confcall earnings release presentation 1 q 1011
TRANSCRIPT

Tereos InternacionalFi t Q t 2010/11 R ltFirst Quarter 2010/11 Results
August 16th, 2010g ,

Agenda
Tereos Internacional Overview
Key highlights
Financial results
Segments
Key markets highlights
Outlook
2

Tereos Internacional Overview
S ti 1Section 1
3

Tereos Internacional OverviewA global leader in food ingredients and bionergy
Combining Guarani with Tereos’ cereal and Indian Ocean sugarcane assets to produceCombining Guarani with Tereos cereal and Indian Ocean sugarcane assets to produce sugar, ethanol and starch-based products
A strategic combination to accelerate growth and play a major role in agroindustry lid ticonsolidation
• Change in scale to meet industry challenges
• Complementary assets and diversified product range with strong growth prospects
• Global reach to serve global customer base
• Reduced cash flow volatility through diversification of raw materials, end products and geographies
• Stronger balance sheet to seize growth opportunities and drive consolidation
Tereos Internacional is incorporated in Brazil, headquartered in São Paulo, and listed on th N M d f th BM&FBOVESPA i A t 13th 2010the Novo Mercado of the BM&FBOVESPA since August 13th, 2010
4

Tereos Internacional OverviewReinforced positions through three recent major transactions
Strategic partnership with Petrobras to accelerate growth in the sugarcane industry: total investment of up to R$2.2Bn in Guarani
Investment by Petrobras Bicombustível of R$1 6Bn over the next 5 years (R$682MM• Investment by Petrobras Bicombustível of R$1.6Bn over the next 5 years (R$682MM already invested) to reach a stake of up to 45.76% in Guarani
• Option for Tereos Internacional to invest up to R$600MM of new equity in Guarani in the 12 months following Petrobras Bicombustível’s direct participation in Guarani
Acquisition of Mandu to increase capacities in Brazil
• Total additional sugarcane crushing capacity of 3 5 million tonsTotal additional sugarcane crushing capacity of 3.5 million tons
• Expected production of 200,000 tons of sugar, 175,000 m3 of ethanol and 65,000 MWh of cogeneration for sale
Acquisition of Groupe Quartier Français (GQF): Tereos becomes the sole sugar producer in La Réunion
• Doubled crushing capacity to 2.0 million tons - Sugar production to reach 200,000 to 220,000 tons
5

Q1 10/11: Key Highlights
S ti 2Section 2
6
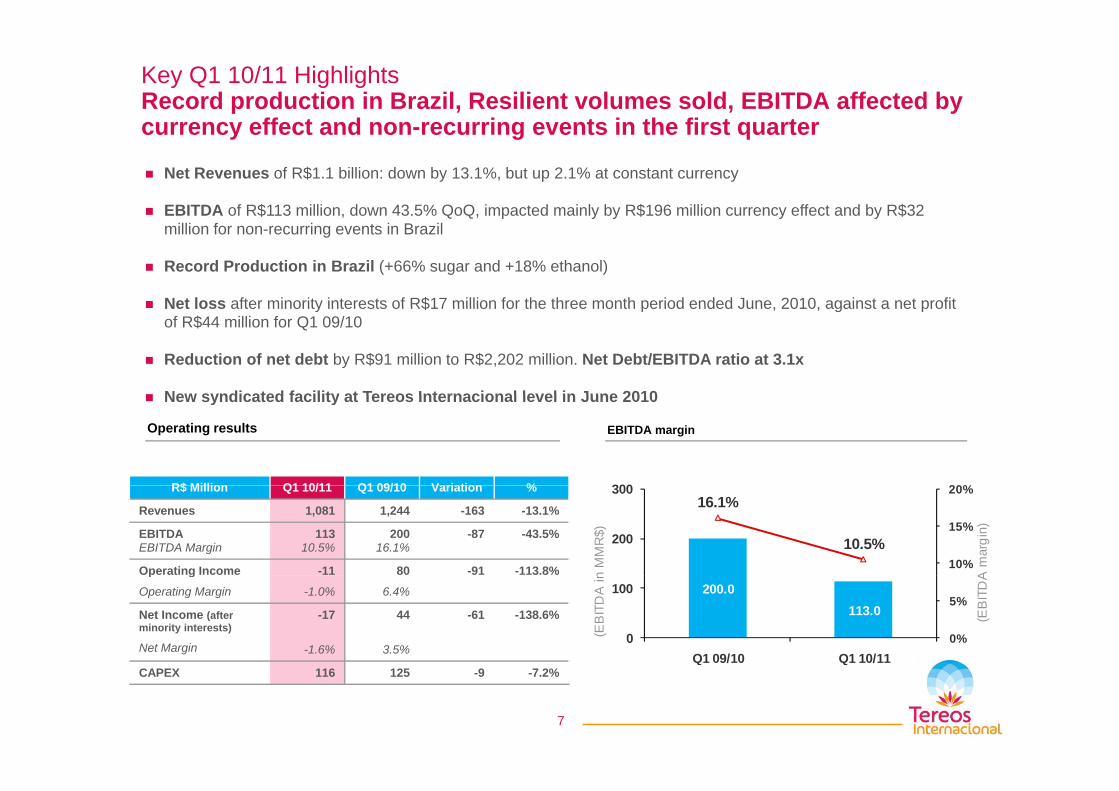
Key Q1 10/11 HighlightsRecord production in Brazil, Resilient volumes sold, EBITDA affected by currency effect and non recurring events in the first quartercurrency effect and non-recurring events in the first quarter
Net Revenues of R$1.1 billion: down by 13.1%, but up 2.1% at constant currency
EBITDA of R$113 million, down 43.5% QoQ, impacted mainly by R$196 million currency effect and by R$32 $ , % Q Q, p y y $ y y $million for non-recurring events in Brazil
Record Production in Brazil (+66% sugar and +18% ethanol)
Net loss after minority interests of R$17 million for the three month period ended June 2010 against a net profitNet loss after minority interests of R$17 million for the three month period ended June, 2010, against a net profit of R$44 million for Q1 09/10
Reduction of net debt by R$91 million to R$2,202 million. Net Debt/EBITDA ratio at 3.1x
New syndicated facility at Tereos Internacional level in June 2010
Operating results EBITDA margin
20%300
New syndicated facility at Tereos Internacional level in June 2010
R$ Million Q1 10/11 Q1 09/10 Variation %16.1%
10.5%10%
15%
20%
200
300
A m
argi
n)
n M
MR
$)
R$ Million Q1 10/11 Q1 09/10 Variation %
Revenues 1,081 1,244 -163 -13.1%
EBITDAEBITDA Margin
11310.5%
20016.1%
-87 -43.5%
Operating Income -11 80 -91 -113.8%200.0
113.0
0%
5%
0
100
Q1 09/10 Q1 10/11
(EB
ITD
A
(EB
ITD
A in
p g
Operating Margin -1.0% 6.4%
Net Income (after minority interests)
Net Margin
-17
-1.6%
44
3.5%
-61 -138.6%
7
CAPEX 116 125 -9 -7.2%
Q1 10/11: Financial Results
Section 3
8

Financial ResultsRevenues of R$1,081 million, up 2.1% at constant currency, but affected by forexby forex
Starch down R$211 million, or -9.2% at constant currency: lower selling prices in line with the decrease of cereal prices and impacted by the appreciation of the Real against the Eurothe decrease of cereal prices and impacted by the appreciation of the Real against the Euro
Brazil up R$59 million: higher prices for sugar and ethanol. Increase in production and higher stocks in line with our strategy for the quarter
Ethanol Europe down R$37 million, but up 1.0% at constant currency: higher volumes sold
Revenues by segment Revenues
R$ Million Q1 10/11 Q1 09/10 Variation %
St h 577 788 211 26 8%1400 1,244 -13.1%
Starch 577 788 -211 -26.8%
Ethanol Europe 162 199 -37 -18.6%
Brazil 293 234 +59 +25.2%
Indian Ocean 49 23 +26 +113,0%
199
162
234
293
2349
600
800
1000
1200
s in
MM
R$)
1,081
Total Tereos Internacional 1,081 1,244 -163 -13.1%
788577
0
200
400
Q1 09/10 Q1 10/11
(Rev
enue
Starch Ethanol Europe Brazil Indian Ocean
9

Financial ResultsEBITDA of R$113 million
Starch: decrease in selling prices, in line with cereal prices, and positive impact of the closure of the Greenwich plant (UK)the Greenwich plant (UK)
Brazil: impacted by non-recurring items (R$32.1 million) and reduced operating margin due to increased sugar mix and increase in raw material prices
Ethanol Europe: planned maintenance stoppage at Lillebonne and temporary lower operating efficiency, due to barley tested as a new raw material
Indian Ocean: improved margins for sugar sales combined with higher volumes
6
EBITDA by segment EBITDA
20043 5%
Indian Ocean: improved margins for sugar sales combined with higher volumes
R$ Million Q1 10/11 Q1 09/10 Variation %% at
constant
19
7
61
17
6
8
75
175
A e
n M
MR
$) 113
-43.5%$ o Q 0/ Q 09/ 0 a at o % co sta tcurrency
Starch 88 114 -26 -22.8% -4.3%
Ethanol Europe 7 19 -12 -63.2% -54.3%
11488
-7-25 Q1 09/10 Q1 10/11
(EB
ITD
A
Starch Ethanol Europe Brazil Indian Ocean Holding
Brazil 17 61 -44 -72.1% -
Indian Ocean 8 6 +2 +33.3% +65.4%
Holding -7 0 -7 - -
Total TereosTotal Tereos Internacional 113 200 -87 -43.5% -31.1%
10
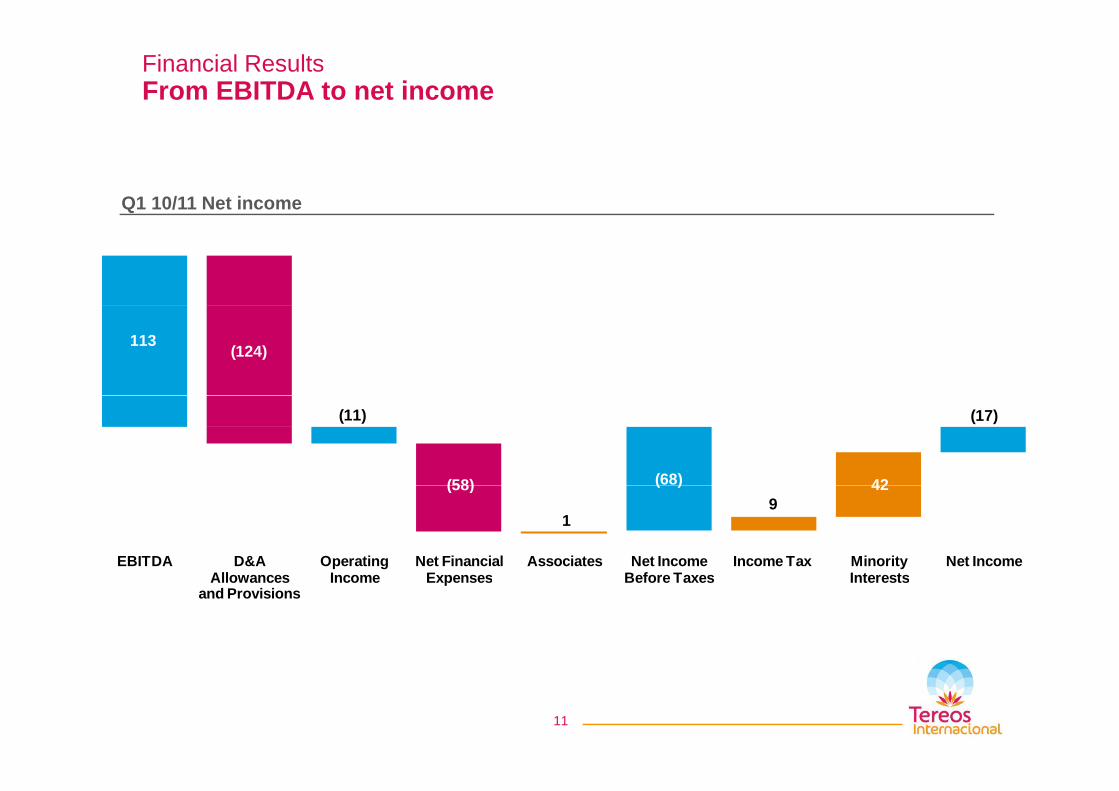
Financial ResultsFrom EBITDA to net income
Q1 10/11 Net income
113 (124)
(11)
(58) (68) 42
(17)
EBITDA D&A Allowances
Operating Income
Net Financial Expenses
Associates Net Income Before Taxes
Income Tax Minority Interests
Net Income
(58)
1
( )9
42
Allowances and Provisions
Income Expenses Before Taxes Interests
11

Financial ResultsPositive operational cash flow and decrease in net debt
R$ Million Q1 10/11
EBITDA 113
Tereos Internacional generatedpositive operational cash flow of R$21million
Working capital variance net of related parties changes
-91
Working capital variance -615
Related parties variation 524
Other 1
Decrease of R$91 million in net debt
Other -1
Operational Cash Flow 21
R$ Million Q1 10/11
Operational Cash Flow 21
• Selective capex policyOperational Cash Flow 21
Financial interest net of dividends received -32
Capex -81
Forex impact 98
Net debt of R$2,202 million at June 30,2010, compared to R$2,293 million atthe end of March, 2010 (-4%)
Cash before acquisition & capital increase 6
Mandu acquisition -598
Capex -279
Perimeter impact 319
Net debt/EBITDA 3.1x
Perimeter impact -319
Capital increase 683
Decrease in indebtedness 91

Segments
S ti 4Section 4
13
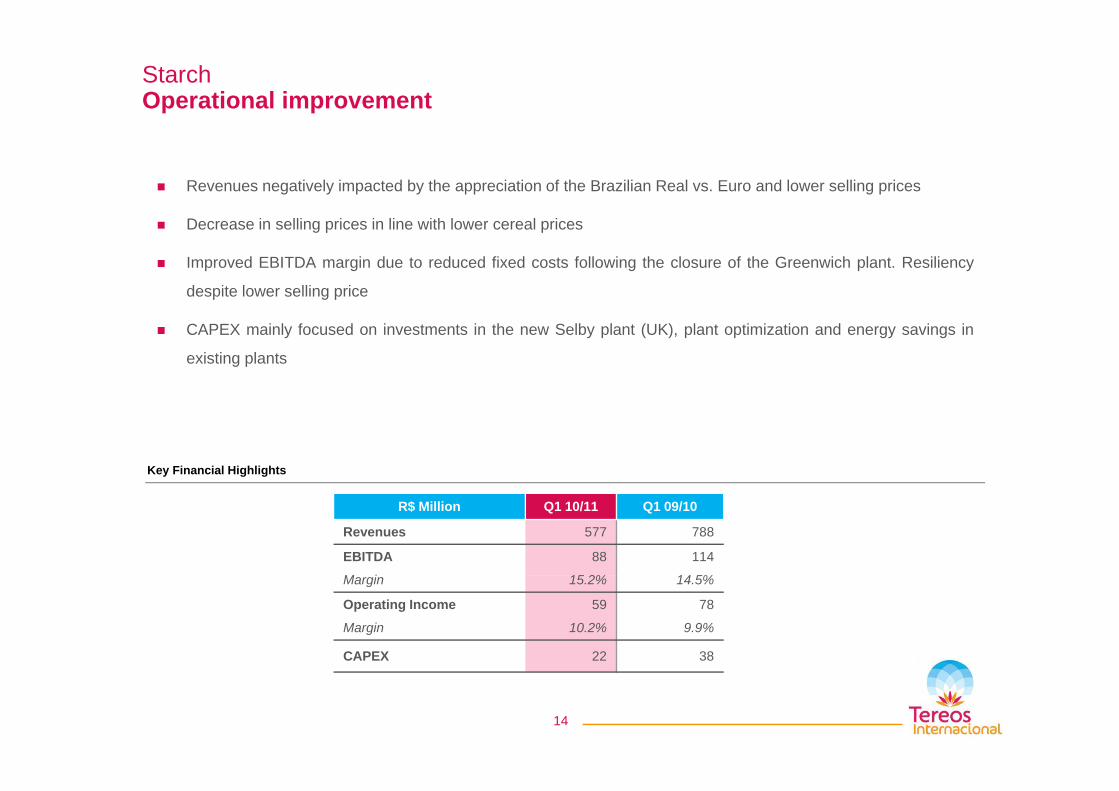
StarchOperational improvement
Revenues negatively impacted by the appreciation of the Brazilian Real vs. Euro and lower selling prices
Decrease in selling prices in line with lower cereal prices
Improved EBITDA margin due to reduced fixed costs following the closure of the Greenwich plant. Resiliency
despite lower selling price
CAPEX mainly focused on investments in the new Selby plant (UK), plant optimization and energy savings in
existing plants
Key Financial Highlights
R$ Million Q1 10/11 Q1 09/10
Revenues 577 788
EBITDA
M i
88
15 2%
114
14 5%Margin 15.2% 14.5%
Operating Income
Margin
59
10.2%
78
9.9%
CAPEX 22 38
14

Ethanol EuropeNon-recurring production impact
Revenues negatively impacted by the appreciation of the Brazilian Real vs. Euro
Decrease in ethanol prices, offset by a positive volume impact
EBITDA i 4 3% dEBITDA margin at 4.3% due to:
• Lower operational efficiency with barley tested as a new raw material
• Planned maintenance stoppage at the Lillebonne plantpp g p
Launch of Distillerie de la Vallée de l’Oise (DVO) in France (production capacity of 30,000 m3 per year)
Key Financial HighlightsKey Financial Highlights
R$ Million Q1 10/11 Q1 09/10
R 162 199Revenues 162 199
EBITDA
Margin
7
4.3%
19
9.5%
O ti I 11Operating Income
Margin
-
-
11
5.5%
Capex 7 18
15

Brazil Record crushing, strong increase in revenues and production
Record sugarcane crushing: 5.9 Million tons, +30.9%
Increase in both sugar and ethanol production (+66% and +18% respectively) with 87.2% of total sugar
production dedicated to white and crystal sugar
Sugar sales concentrated on the domestic market, with an increase of production diverted to inventory QoQ,
and a consequent reduction in sales in the quarter
EBITDA impacted by non-recurring items: provision for ethanol inventories (R$11.1 million), acquisition of
Mandu (R$6.1 million), impact of the fair value of biological assets (R$9.4 million) and reduced operating
margin due to higher industrial costs (mix more heavily geared towards sugar, higher share of refined sugar)
d i i thi d t t (i i t i l i )and rise in third-party sugarcane costs (increase in raw material prices)
Key Financial Highlights
R$Million Q1 10/11 Q1 09/10
Revenues 293 234
EBITDA
Margin
17
5.9%
61
26.3%
Operating Income
Margin
-70
23 9%
-12
5 1%Margin -23.9% -5.1%
Capex 82 68
16

Indian OceanRise in revenues and improved operating margin
Increase in turnover mainly due to bagasse prices, classified as turnover in Q1
• This premium results from the increase of selling price for electricity produced from bagasse
• The amount has been fully transferred in Q1 2010/11 to the sugarcane growers with no impact on the
company’s EBITDA
Hi h l t ti t l EHigher sugar sales to continental Europe
Improvement of operating margin on sugar sales in Europe
Key Financial Highlights
R$ Milli Q1 10/11 Q1 09/10R$ Million Q1 10/11 Q1 09/10
Revenues 49 23
EBITDA
Margin
8
16 3%
6
26 1%Margin 16.3% 26.1%
Operating Income
Margin
7
14.3%
3
13.0%
Capex 6 2
17

Key market highlights
S ti 5Section 5
18
Starch and SweetenersHistorical growth levels resuming, steady demand for co-products
EU starch and sweeteners and co-product prices have decreased, in line with cereal prices
After a fall in the EU starch and sweeteners market in 2009, demand is expected to be back to its historical annual growth levels
Demand for co-products from cereal remains strong, driven by the growing use of protein additives in food and feed industries
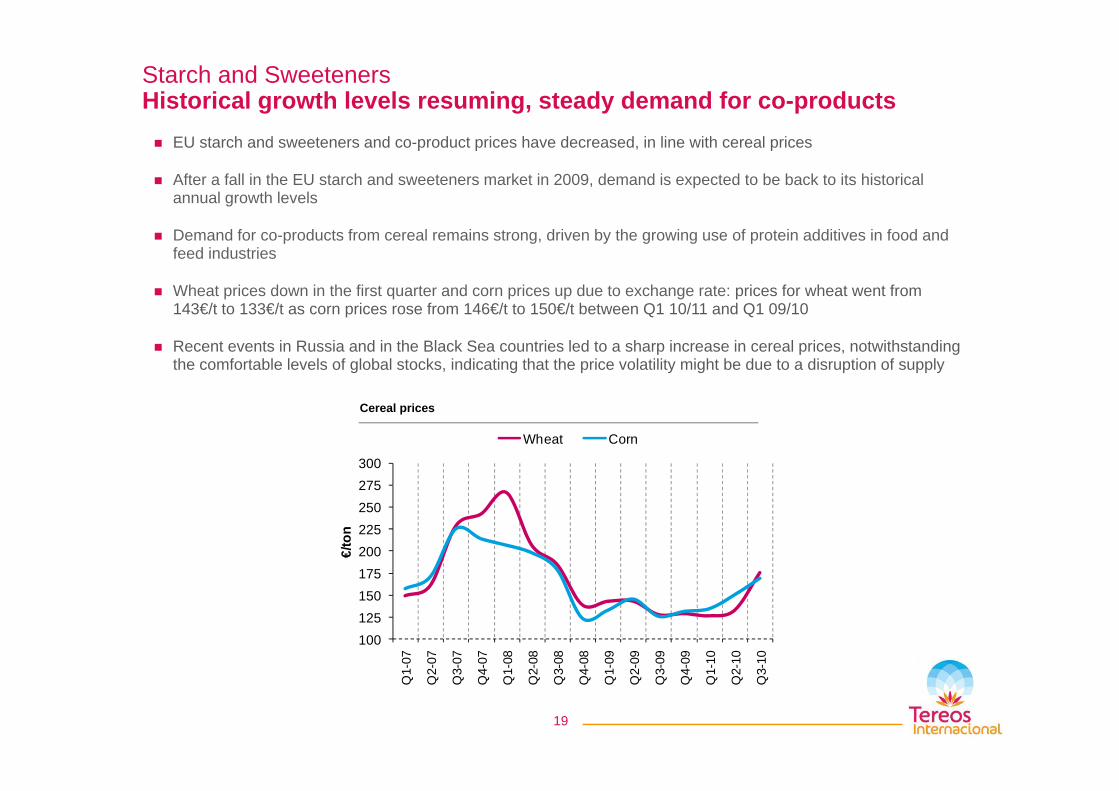
Wheat prices down in the first quarter and corn prices up due to exchange rate: prices for wheat went from 143€/t to 133€/t as corn prices rose from 146€/t to 150€/t bet een Q1 10/11 and Q1 09/10143€/t to 133€/t as corn prices rose from 146€/t to 150€/t between Q1 10/11 and Q1 09/10
Recent events in Russia and in the Black Sea countries led to a sharp increase in cereal prices, notwithstanding the comfortable levels of global stocks, indicating that the price volatility might be due to a disruption of supply
Cereal prices
275300
Wheat Corn
175200225250275
€/to
n
100125150175
-07
-07
-07
-07
-08
-08
-08
-08
-09
-09
-09
-09
-10
-10
-10
Q1-
Q2-
Q3-
Q4-
Q1-
Q2-
Q3-
Q4-
Q1-
Q2-
Q3-
Q4-
Q1-
Q2-
Q3-
19

SugarStrong demand returns, driving prices up
Average raw and white sugar prices reached 15.5 cents/lb and 491,7 US$/ton respectively (up 5.6% and 14.5% vs. Q1 09/10)
Average white premium reached 149 1 US$/ton in Q1 10/11 (+41 5% vs Q1 09/10)Average white premium reached 149.1 US$/ton in Q1 10/11 (+41.5% vs. Q1 09/10)
At end of June, 2010, raw and white sugar prices reached 18.0 cents/lb and 528 US$/ton respectively
In Brazil, average price in Q1 10/11 increased by 11% compared to the same period last year
Brazilian production estimated at 34.1 million tons (+19.1%) for this crop
Evolution of raw sugar prices (NY#11)
6336cents US$/lb cents R$/lb
Evolution of the white sugar premium
350200US$/ton R$/ton
39
47
55
63
23
27
32
36
nts
R$/
lb
ts U
S$/
lb
200
250
300
110
140
170
R$/
ton
US$
/ton
Q110 Q310Q210 Q410 Q111
15
23
31
9
14
18
pr-0
9
ul-0
9
ct-0
9
an-1
0
pr-1
0
ul-1
0
cen
cen
50
100
150
20
50
80
r-09
l-09
t-09
n-10 r-10
l-10
RU
01-A
p
01-J
01-O
01-J
a
01-A
p
01-J
20
1-A
pr
1-Ju
1-O
ct
1-Ja
n
1-A
pr
1-Ju
Source: ICE and LIFFE
EthanolIncreasing global demand
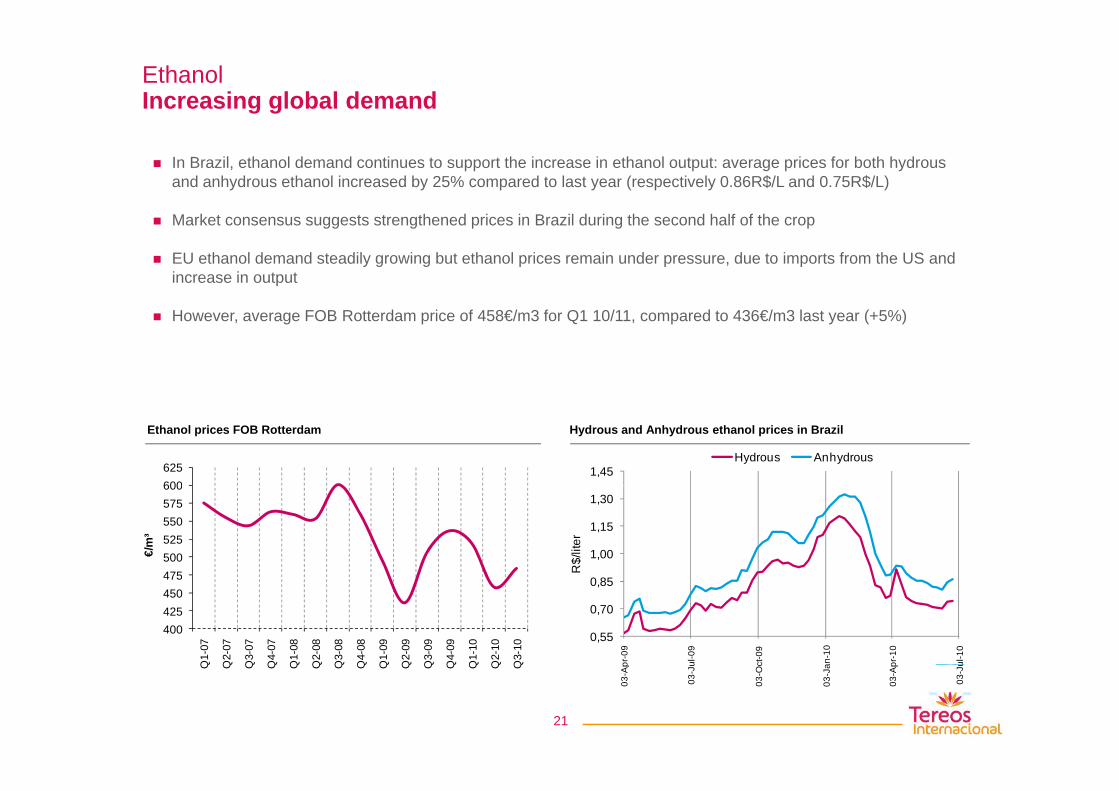
In Brazil, ethanol demand continues to support the increase in ethanol output: average prices for both hydrous and anhydrous ethanol increased by 25% compared to last year (respectively 0.86R$/L and 0.75R$/L)
M k t t t th d i i B il d i th d h lf f thMarket consensus suggests strengthened prices in Brazil during the second half of the crop
EU ethanol demand steadily growing but ethanol prices remain under pressure, due to imports from the US and increase in output
However, average FOB Rotterdam price of 458€/m3 for Q1 10/11, compared to 436€/m3 last year (+5%)
1,45Hydrous Anhydrous
Ethanol prices FOB Rotterdam Hydrous and Anhydrous ethanol prices in Brazil
600625
1,00
1,15
1,30
R$/
liter
475500525550575600
€/m
³
0,55
0,70
0,85
pr-0
9
ul-0
9
ct-0
9
an-1
0
pr-1
0
ul-1
0
400425450475
Q1-
07
Q2-
07
Q3-
07
Q4-
07
Q1-
08
Q2-
08
Q3-
08
Q4-
08
Q1-
09
Q2-
09
Q3-
09
Q4-
09
Q1-
10
Q2-
10
Q3-
10
03-A
p
03-J
u
03-O
c
03-J
a
03-A
p
03-J
uQ Q Q Q Q Q Q Q Q Q Q Q Q Q Q
21

Outlook
S ti 6Section 6
22
2010/11 Outlook: Recent investments and transactions to yield results gradually over the yearg y y
Recent investments and transactions are expected to improve the Company’s revenues and profitability at constant weather and operating conditionsand profitability at constant weather and operating conditions
• Brazil segment: Recent acquisitions of 50% of Vertente and 100% of Mandu - 20.8 million tons of sugarcane crushing in this crop (44% increase over 2009/10)
• Indian Ocean segment: Recent acquisition of Groupe Quartier Français to become theIndian Ocean segment: Recent acquisition of Groupe Quartier Français to become the only sugar producer on the island – crushing capacity doubled to 2 million tons
• Ethanol/Alcohol Europe segment: DVO has passed the quality certification tests and will reach full capacity (30,000 m3) by the end of the crop
Furthermore, two key investments will be operational during the 20112/12 crop year:
• Investment in protein extraction in BENP Lillebonne: diversification of income stream
• Start-up of the Selby high-quality grain alcohol plant in the UK: 45,000 m3/year capacity
Cereal prices:
• Starch segment: next 3-month raw material needs 95% covered
• Ethanol Europe segment: raw material purchase contract indexed on ethanol prices
23

Disclaimer
This presentation does not constitute an offer to sell or a solicitation of offers to purchase or subscribe for, any shares in Tereos Internacional. Any such offer or sale will take place by means of separate offering documents, including prospectuses subject to approval by the Comissão de Valores Mobiliários (CVM) and Autorité des marchés financiers (AMF) in the event of offers to the public in Brazil and/or France, respectively.
Tereos Group announced that it contemplates a primary offering of shares of Tereos Internacional, after completion of the corporate reorganization, and subject tomarket conditions. Investors must carefully read the prospectuses, especially the "risk factors" section prior to making any investment in Tereos Internacional'sshares, if and when any offering is actually implemented takes place.shares, if and when any offering is actually implemented takes place.
With respect to the member states of the European Economic Area which have implemented the Directive 2003/71/EC of the European Parliament and the Council ofNovember 4, 2003 (the "Prospectus Directive"), other than France, no action has been undertaken or will be undertaken to make an offer to the public of the securitiesreferred to herein requiring a publication of a prospectus in any relevant member state (other than France). As a result, the securities referred to herein may not andwill not be offered in any relevant member state (other than France) except in accordance with the exemptions set forth in Article 3(2) of the Prospectus Directive, ifthey have been implemented in that relevant member state, or under any other circumstances which do not require the publication by Tereos Internacional of aprospectus pursuant to Article 3 of the Prospectus Directive and/or to applicable regulations of that relevant member state.
In the United Kingdom, this presentation is only being distributed to, and is only directed at, persons that are "qualified investors" within the meaning of Article2(1)(e)(i), (ii) or (iii) of the Prospectus Directive and that also (i) are "investment professionals" falling within Article 19(5) of the Financial Services and Markets Act2000 (Financial Promotion) Order 2005 (as amended, the "Order"), (ii) are persons falling within Article 49(2)(a) to (d) ("high net worth companies, unincorporatedassociations, etc.") of the Order, or (iii) are persons to whom an invitation or inducement to engage in investment activity (within the meaning of section 21 of theFinancial Services and Markets Act 2000) in connection with the issue or sale of any securities may otherwise lawfully be communicated or caused to becommunicated (all such persons together being referred to as "relevant persons"). In the United Kingdom, this presentation is directed only at relevant persons andmust not be acted on or relied on by persons who are not relevant persons. Any investment or investment activity to which this presentation relates is available onlyto relevant persons and will be engaged in only with relevant personsto relevant persons and will be engaged in only with relevant persons.
Tereos Internacional's shares have not been or will be registered under the U.S. Securities Act of 1933, as amended (the "Securities Act"), and they may not beoffered or sold in the United States absent registration or an exemption from registration under the Securities Act. No public offering in the United States is planned.
The information included in this presentation contains certain forward-looking statements including statements with respect to management's intentions, beliefs orcurrent expectations concerning among other things, Tereos Internacional's growth prospects and strategies and future growth in the sugar, starch and ethanolmarkets worldwide. Such forward-looking statements are not guarantees of future performance and involve risks and uncertainties. Actual results may differ materiallyfrom those in the forward-looking statements as a result of various factors such as market conditions government regulations competitive pressures thefrom those in the forward looking statements as a result of various factors, such as market conditions, government regulations, competitive pressures, theperformance of the Brazilian and global economies and the sugar, starch and ethanol industries. You are cautioned not to place undue reliance on those forwardlooking statements, which speak only as of the date hereof.
24