confeitogui: a toolkit for size-sensitive community
TRANSCRIPT
RESEARCH ARTICLE
ConfeitoGUI: A toolkit for size-sensitive
community detection from a correlation
network
Yoshiyuki OgataID1,2☯*, Kazuto Mannen2☯, Yasuto Kotani1, Naohiro Kimura1,
Nozomu Sakurai2, Daisuke Shibata2, Hideyuki Suzuki2*
1 Graduate School of Life and Environmental Sciences, Osaka Prefecture University, Osaka, Japan,
2 Department of Research and Development, Kazusa DNA Research Institute, Chiba, Japan
☯ These authors contributed equally to this work.
* [email protected] (YO); [email protected] (HS)
Abstract
Analysis of the large amounts of data accumulated in public databanks can facilitate a more
comprehensive understanding of molecular biological processes. Community detection
from molecular biological data is paramount in characterizing evolutionary and functional
traits of organisms based on gene homology and co-expression, respectively. Although
there are common tools to detect local communities from a large network, no toolkit exists
for detecting communities that include an element of interest based on size sensitivity, i.e.,
functionality to obtain local communities with preferred sizes. Herein, we present the Confei-
toGUI toolkit for detecting local communities from a correlation network involving size sensi-
tivity. We compared the toolkit with other common tools for detection in reconstructing
communities of microarray experiments of mice. In the results, ConfeitoGUI was observed
to be preferable for detecting communities whose sizes are similar to those of original com-
munities compared to other common tools. By changing simple parameters representing
sizes for the toolkit, a user can obtain local communities with preferred sizes, which is bene-
ficial for further analysis of members belonging to the communities.
Introduction
In the era of big data, biologists encounter challenges in handling, processing, and moving
such data obtained via high-throughput technologies [1]. By late last century, network graphs
were used to visualize complex systems based on large social datasets. Clauset et al. [2] sug-
gested that approaches using network graphs are useful not only for social science, but also for
biochemistry and molecular biology. This was followed by various approaches to detect local
communities from large networks such as those by Newman et al. [3] and Blondel et al. [4]. In
these approaches, the modularity index is used to show the reasonability of local communities
divided by their algorithms. On the other hand, these approaches provide no attributes for
individual elements in the network. Therefore, elements around the borders of multiple local
communities can be misclassified because information for appropriate classification is
PLOS ONE | https://doi.org/10.1371/journal.pone.0206075 October 23, 2018 1 / 18
a1111111111
a1111111111
a1111111111
a1111111111
a1111111111
OPEN ACCESS
Citation: Ogata Y, Mannen K, Kotani Y, Kimura N,
Sakurai N, Shibata D, et al. (2018) ConfeitoGUI: A
toolkit for size-sensitive community detection from
a correlation network. PLoS ONE 13(10):
e0206075. https://doi.org/10.1371/journal.
pone.0206075
Editor: Yong Deng, Southwest University, CHINA
Received: March 9, 2018
Accepted: October 4, 2018
Published: October 23, 2018
Copyright: © 2018 Ogata et al. This is an open
access article distributed under the terms of the
Creative Commons Attribution License, which
permits unrestricted use, distribution, and
reproduction in any medium, provided the original
author and source are credited.
Data Availability Statement: All relevant data are
available at our public site (http://www.plant.
osakafu-u.ac.jp/~kagiana/confeito/) and also at the
DRYAD repository (doi:10.5061/dryad.jc247v3).
Funding: This work was supported, in part, by
Grants-in-aid for Scientific Research (C) (no.
26350967; https://www.jsps.go.jp/english/e-
grants/; external) and Scientific Research on
Innovative Areas (no. 25108727; https://www.jsps.
go.jp/english/e-grants/grants01.html; external)
from the Ministry of Education, Culture, Sports,
Science, and Technology (MEXT) of Japan, by the
insufficient. Using a network model of Zachary’s karate club, Newman et al. [3] divided the
club members into two communities according to their method based on the shortest-path
betweenness, and, consequently, only one member was misclassified in comparison with the
club’s actual division. After that, Newman [5] proposed an eigenvector-based algorithm,
which can successfully classify the network model.
In our previous research [6], we constructed the Confeito algorithm to detect local commu-
nities, which provides attributes of each element in a network, and thus can determine a classi-
fication for each element. Network density is a common index to characterize a local
community or the whole network. The index can be separated into values for individual ele-
ments, i.e., providing edges for the community members rather than simply the number of
members. We devised an index as a dual measure of network density for a complete and exclu-
sive (i.e., with no link to other local communities) network graph. Using network density and
the dual index, the algorithm can quantify a local community in comparison with a perfect
and exclusive network graph. By applying the algorithm to the network model of Zachary’s
karate club, we successfully classified the network model, and showed that members located
intermediate between two communities have their indecisive indices classified into either
community. By elucidating the attributes of border-located elements, the Confeito algorithm
is border-sensitive for local community detection. In other words, the algorithm is applicable
to a network containing indistinct local communities such as those in the field of molecular
biology.
The use of high-throughput analytical methodologies in molecular biology such as microar-
rays, high-throughput sequencing, and tandem mass spectrometry has led to the accumulation
of large amounts of data in public databanks. The analysis of such data can provide new
insights into molecular biological processes. Nucleic acid sequences are deposited in GenBank
[7], maintained by the National Center for Biotechnology Information (NCBI), and in the
European Molecular Biology Laboratory (EMBL/EBI) Nucleotide Sequence Database, whereas
amino acid sequences are deposited in the Universal Protein Resource (UniProt) database [8].
In its Reference Sequence Database (RefSeq) [9], the NCBI maintains non-redundant
sequences integrated from many nucleotide and amino acid sequences. The RefSeq database
currently contains more than 60 million amino acid sequences, and that number continues to
increase. Compositional and quantitative metabolite datasets are deposited in the MassBank
[10] and MetaboLights [11] databanks, maintained by EMBL/EBI. When integrated into a
reconstructed dataset based on elements such as genes or metabolites, these data can be
applied to network analysis in systems biology research by calculating correlation coefficients
for relationships between elements to construct correlation networks. Molecular elements that
are found within a community share particular biological features. Within the community,
molecular elements for which we have little or no knowledge regarding their function can be
annotated based on known traits of other elements. The resulting networks can be used to
annotate unknown elements by mapping such elements onto the network.
Communities that are identified from analyses of molecular biological datasets (e.g., those
in plants [12–15]) are useful for characterizing functional and evolutionary traits, such as by
co-expression of genes and co-accumulation of metabolites for functional traits and gene
homology for evolutionary traits.
Network analysis of gene co-expression helps to identify novel functional traits for lesser-
known genes. Hirai et al. [12] performed a network analysis using Arabidopsis microarray
datasets to identify novel enzymes and transcription-activating factors that upregulate the glu-
cosinolate biosynthesis pathway and constructed a correlation network based on the expres-
sion patterns of the identified genes. In their approach, gene-gene correlation coefficients were
calculated based on their expression profiles, and then a correlation network between a local
ConfeitoGUI for size-sensitive community detection from a correlation network
PLOS ONE | https://doi.org/10.1371/journal.pone.0206075 October 23, 2018 2 / 18
Kazusa DNA Research Institute Foundation
(internal) (HS), and by the Promotion of Dissimilar
Field Collaboration Research at Osaka Prefecture
University (grant no. 0203041700; http://www.iao.
osakafu-u.ac.jp/urahp/?page_id=28 [in Japanese];
internal) (YO). The funders had no role in study
design, data collection and analysis, decision to
publish, or preparation of the manuscript. There
was no additional external funding received for this
study.
Competing interests: The authors have declared
that no competing interests exist.

community including the genes of interest was depicted. The network included two novel
transcription factors and several novel enzymes related to the glucosinolate pathway, and thus
the authors were able to assign these genes to the pathway. Ogata et al. [13,14] constructed cor-
relation networks composed of genes related to cellulose and monolignol biosynthesis in
plants through a network analysis based on microarray datasets and the original Confeito algo-
rithm [6].
The grouping of homologous genes provides information on evolutionary relationships
based on quantitatively detecting common bases or amino acids. In general, matrixes for
determining correlations between molecular biological elements consist of quantitative indices
(e.g., ranging from -1 to 1 for the Pearson correlation coefficient). By varying the correlation
index thresholds, communities of different size that represent different levels of functionality
can be identified. On the basis of gene homology, Ogata and Suzuki [15] constructed a plant
correlation network comprising 3,167 genes encoding cytochrome P450 (CYP) proteins. A
correlation coefficient threshold of 0.5 in their network identified 217 CYP gene communities.
Varying the threshold leads to the identification of different numbers of communities. The
Cytochrome P450 Engineering Database (https://cyped.biocatnet.de/) [16] categorizes CYP
genes into subfamilies (i.e., small groups), families (mid-sized groups), and superfamilies
(large groups). Differences in the number of communities identified based on application of
different thresholds can represent CYP gene families of different size. The assignment of a
gene within multiple levels of a gene community can enhance our understanding and provide
a broad perspective of the evolutionary and functional traits of the gene.
Local communities (referred to here as “network modules”) can be extracted from a net-
work comprising elements and links between elements using a variety of approaches, as noted
in previous reports [3,4,17–21]. Although these methods can extract network modules that
include a focused element, it is difficult to adjust the size of the modules (i.e., the number of
elements included); the modules are thus often much smaller or larger than expected. In the
field of molecular biology, for example, elements such as genes or metabolites in a module that
includes an element of a researcher’s interest should be further analyzed as candidates to verify
the predictions made by the community assignment. When conducting such analyses, a rea-
sonable number of elements is desired for actual experiments. A size-sensitive approach thus
supports actual verification for such uses.
Consequently, we developed a standalone toolkit, ConfeitoGUI, to identify network
modules within correlation networks in a size-sensitive manner by expanding the Confeito
algorithm [6,22] and integrating vertex-vertex connections based on the algorithm. The pre-
liminary program of the original Confeito algorithm, which was written as a Perl script, con-
structs a network module for an arbitrary element, and thus the network modules for all
elements have redundancy in their memberships; i.e., a single element belongs to multiple net-
work modules. ConfeitoGUI has a function to remove such redundancies in its backend pro-
cess as well as implementation of its frontend process on a graphical user interface (GUI). The
ConfeitoGUI tool allows the adjustment of network module size by manipulation of simple
parameters representing sizes, and it can identify elements specifically related to the network
modules even when they are weakly correlated. Focusing on a particular element, the user can
modify the size of the module including the element.
Materials and methods
Confeito algorithm indices
According to Ogata et al. [6], the Confeito algorithm requires three basic indices to identify a
local community from within a network graph (i.e., ND, NS, and NF, representing network
ConfeitoGUI for size-sensitive community detection from a correlation network
PLOS ONE | https://doi.org/10.1371/journal.pone.0206075 October 23, 2018 3 / 18

density, network specificity, and network F-measure, respectively). Network density and net-
work specificity are dual indices that consider completeness and exclusivity (or with no con-
nections to other local communities). When imaging a network graph with complete intra-
modular connections (perfect) and with no connections to other graphs (exclusive), network
density and network specificity are “precision” and “recall” indices for the graph, respectively.
Precision and recall are dual indices used for information retrieval and represent the ratio of
true positive elements over all positive elements (i.e., for evaluating type I errors) and the ratio
of true positive elements over all true elements (i.e., for evaluating type II errors), respectively.
Because F-measure is a harmonic mean of the dual indices, the index can be used for evaluat-
ing type I and II errors. To evaluate the relationships between an element and a network mod-
ule in which the element is included, vertex indices (i.e., VDi, VSi, and VFi representing vertex
density, vertex specificity, and vertex F-measure, respectively) were established using the pres-
ent algorithm by resolving the former three indices into values based on individual elements:
ND ¼P
ein � ðn � 1Þ
ð1Þ
NS ¼P
eiPd
ð2Þ
NF ¼2
1
NDþ1
NS
¼2 �P
ein � ðn � 1Þ þ
Pdi
ð3Þ
VDi ¼ei
n � 1ð4Þ
VSi ¼eidi
ð5Þ
VFi ¼2
1
VDiþ 1
VSi
¼2 � ei
ðn � 1Þ þ dið6Þ
where n represents the number of vertices included in a network graph and di and ei represent
the degrees of each vertex (Vi) in the graph (i.e., the total number of intramodular and inter-
modular links) and the edges of the vertex (i.e., the number of intramodular links), respec-
tively. The three indices for network modules can be used as indices for vertices located on the
boundary of a module by resolving these indices for the vertices.
To illustrate the roles of these indices in a network graph, we imagined a network module
consisting of six vertices (Fig 1). Each vertex in the module (lighter vertices; i.e., V1 to V6) has
links to other vertices in the module (intramodular links; darker lines in Fig 1) and links to ele-
ments outside the module (intermodular links; lighter lines in Fig 1). When the vertices have
intramodular links to all vertices of the module and no intermodular links to other elements,
the module is said to be perfect (based on complete intramodular links) and also exclusive
(based on the absence of intermodular links). In Fig 1, V4 is not connected to V6, and thus,
the network module is not perfect. Also, V2, V4, V5, and V6 have connections to elements out-
side the module, and thus, the module is not exclusive.
As the network density represents the ratio of intramodular links, it represents the degree
of perfection of the network graph. As shown in Fig 1, six elements can be connected by 15
ConfeitoGUI for size-sensitive community detection from a correlation network
PLOS ONE | https://doi.org/10.1371/journal.pone.0206075 October 23, 2018 4 / 18

ConfeitoGUI for size-sensitive community detection from a correlation network
PLOS ONE | https://doi.org/10.1371/journal.pone.0206075 October 23, 2018 5 / 18

edges and are actually connected by 14 edges; i.e., the network density of the module is 14 over
15.
Network specificity represents the ratio of intramodular links to the total number of links
(both intra- and intermodular.), and thus represents the exclusivity of the graph. As shown in
Fig 1, the sum of the edges for individual module members is 28 (each edge is counted by
two), and the sum of degree for the members is 40 (including 12 links to vertices outside the
module: the numbers at the sides of darker nodes represent the number of links from module
members to vertices outside of the module). In other words, the network specificity of the
module is 28 over 40 (which reduces to 7 over 10).
The network F-measure represents the harmonic mean of network density and network
specificity, and thus gives an indication of both the degree of perfection and exclusivity. When
the network F-measure of a network graph is�0.5, the graph can be considered a network
module based on its degree of perfection and exclusivity. In this case, the average of vertex F-
measure of the module members is over 0.5, meaning that the majority of links of the average
vertex are intra-modular. In conclusion, such a module in total has more tight intra-modular
connections compared with intermodular connections. In Fig 1, the network density is 14 over
15 and the network specificity is 7 over 10, and thus the network F-measure is 4 over 5 as the
calculation shows. This means that the network module is tightly and exclusively connected.
Vertex density, VDi, represents the ratio of the edges of Vi, whereas vertex specificity, VSi,represents the ratio of the edges to the degree of Vi. Vertex F-measure, VFi, represents the har-
monic mean of vertex density and specificity, and thus vertex F-measure gives an indication of
the extent to which the vertex contributes to the network module.
Initial settings
First, two constants, the expected minimal and maximal sizes of the local communities (or net-
work modules), are set as natural numbers p and q, respectively. This does not mean that all
network module sizes obtained using the Confeito algorithm range from p to q but that the
algorithm can detect a greater number of network modules of sizes ranging from p to q. This
increases the probability of detecting a network module of an appropriate size that contains an
element of interest. When a user has no restriction on the sizes of network modules, both val-
ues are appropriately set based on topological indices used in ConfeitoGUI. On the other
hand, when a user focuses on individual elements in a single network module, the size can be
set based on the user’s request. For example, in the field of molecular biology, because such ele-
ments are used for experimental validation of the grouping, the size should depend upon the
user’s capacity to perform experiments.
FPO (false-positive-out) series
The FPO series (Fig 2 and S1 Video) identifies vertices that are highly correlated with a given
vertex. The process of the series is that first, a single vertex is selected as a seed vertex (process
A); second, a vertex group in which members are highly connected to the seed vertex is
selected (process B); third, network indices for the group are calculated (process C); fourth,
from the group, a vertex with the lowest network index is deleted (process D); and by repeating
processes C and D, a final network module originating from the seed vertex is constructed.
This series is explained in detail as follows.
Fig 1. Example calculation of indices using the Confeito algorithm. Lighter vertices represent those included in the network
module MOD1; darker vertices represent those outside of the module; numbers indicate the links from individual vertices
included in the module to those outside the module.
https://doi.org/10.1371/journal.pone.0206075.g001
ConfeitoGUI for size-sensitive community detection from a correlation network
PLOS ONE | https://doi.org/10.1371/journal.pone.0206075 October 23, 2018 6 / 18
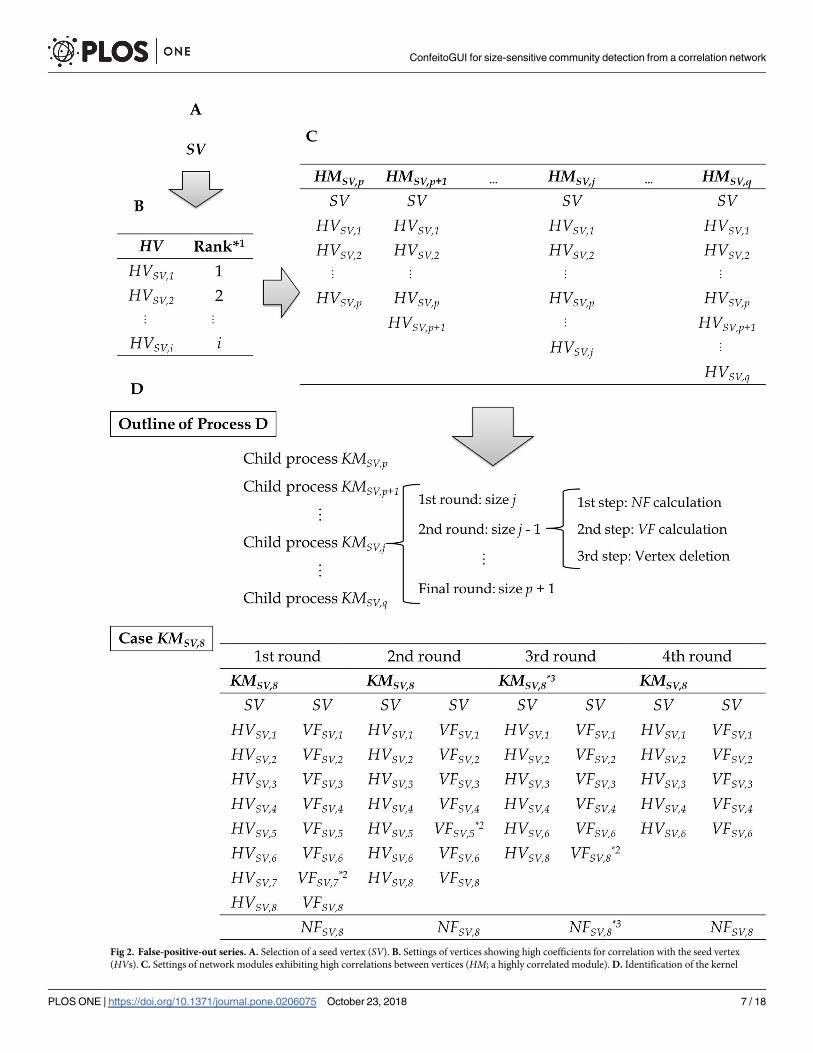
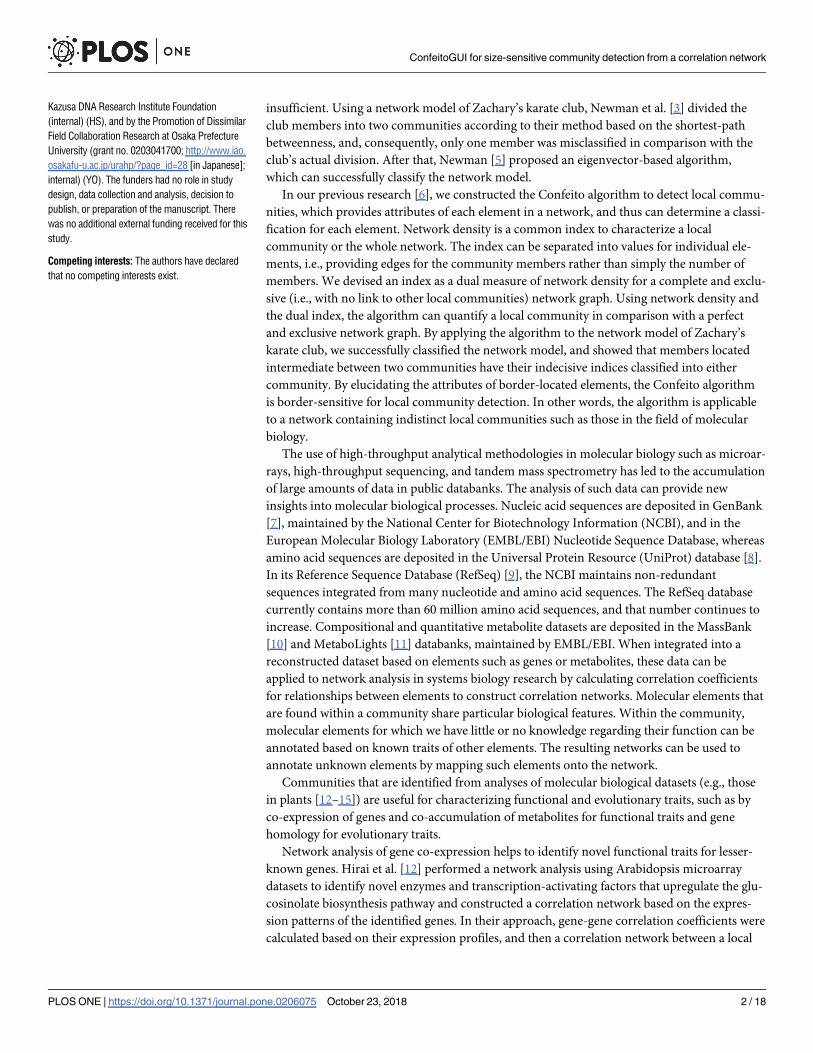
Fig 2. False-positive-out series. A. Selection of a seed vertex (SV). B. Settings of vertices showing high coefficients for correlation with the seed vertex
(HVs). C. Settings of network modules exhibiting high correlations between vertices (HM; a highly correlated module). D. Identification of the kernel
ConfeitoGUI for size-sensitive community detection from a correlation network
PLOS ONE | https://doi.org/10.1371/journal.pone.0206075 October 23, 2018 7 / 18

A) Selecting a seed vertex (SV)
An arbitrary vertex is selected as an SV for the FPO series (Fig 2A).
B) Setting highly correlated vertices (HVs)
A list of correlation coefficients denoting correlations with the seed vertex is selected from a
correlation matrix, and the coefficients are aligned in descending order (Fig 2B). The verti-
ces in the list are known as HVs, with HVSV,i representing a vertex with the ith coefficient
for correlations with the seed vertex.
C) Setting highly correlated modules (HM)
A group of vertices including the seed vertex and vertices from the first (HVSV,1) to the jth(HVSV,j) is designated a highly correlated module (HMSV,j; p� j� q) (Fig 2C). In the mod-
ule, pairs of vertices that have higher correlation coefficients than that of the seed vertex
and the ith vertex (HVSV,i; 1� i� j) pair are connected.
D) Detecting a kernel module (KM)
In this process, a group of vertices that includes the seed vertex and exhibits the maximal
(or more precisely, the approximately maximal) NF value (known as NFSV) is selected as a
final kernel module for the seed vertex (KMSV) (Fig 2D). First, each highly correlated module
(HMSV,j; p� j� q) is set as the initial kernel candidate module (KMSV,j), and a kernel candi-
date module with the lowest j value (KMSV,p) at this time is set as the initial kernel module
(KMSV). The NF value of the temporal kernel module is calculated as the initial NFSV.
For each initial kernel candidate module (KMSV,j), a child process for the module is exe-
cuted. The child process consists of rounds in which a vertex (except for the seed vertex) is
repeated until the size of the candidate module is p + 1.
Each round consists of the following three steps. 1) The NF value of the candidate module
(known as NFSV,j) is calculated. If the NF value is greater than NFSV, NFSV and KMSV are
replaced with NFSV,j and KMSV,j, respectively (see an example for KMSV,8 in Fig 2D). 2) In the
candidate module, the VF values of all vertices, except for that of SV, are calculated (for
instance, VFSV,5 is the VF value of HVSV,5). 3) The vertex representing the minimal VF value is
deleted from the candidate module. In other words, the size of the candidate module decreases
by 1 in this step. If the size is greater than p + 1, the first step is executed again.
Finally, the kernel module (KMSV) is selected as the best network module originating from
the seed vertex, and the VF values of the vertices (HVSV,i) included in the kernel module are
calculated as VFSV,i.
Merging kernel modules (modularizing series)
Kernel modules (KMSVs) originating from multiple SVs show redundancy in terms of the
memberships of the modules. To eliminate this redundancy, the kernel modules are merged
according to the following processes (Fig 3).
A) Depicting a network graph with a specific VF threshold
For merging kernel modules, a new network graph is plotted based on a specific VF (VFT)
threshold instead of the correlation coefficients among these vertices. When the value of
module (KM). Outline shows the hierarchy of Process D. The method selects a kernel module (KMSV,8), which originates from a seed vertex and the eight
highest vertices (HMSV,8). �1 Ranks of coefficients for correlations with an SV. �2 Lowest VF values among those of the vertices in the case of a kernel
module (KMSV,8). The vertices are deleted in the next round. �3 When the network F-measure value (NFSV,8) of the kernel module shows the greatest NFvalue among those calculated throughout the FPO series, the final kernel module (KMSV) and its NF value (NFSV) are replaced by KMSV,8 and NFSV,8,
respectively.
https://doi.org/10.1371/journal.pone.0206075.g002
ConfeitoGUI for size-sensitive community detection from a correlation network
PLOS ONE | https://doi.org/10.1371/journal.pone.0206075 October 23, 2018 8 / 18
Fig 3. Example of a modularizing series. VFT ranges between 0.6 and 0.9 in steps of 0.1. Values of p and q are set to 5 and 50, respectively. At VFT values of 0.6 and 0.7,
there is a single network module, module A. At VFT values of 0.8 and 0.9, the single network module separates into two network modules, A and B. The sizes of both
network modules at the former VFT value are greater than p, indicating that both network modules are valid. However, the size of network module B at the latter VFTvalue is smaller than p, indicating that at VFT = 0.9; therefore, only module A is valid. This indicates that the network modules at VFT = 0.8 should be set as the final
network graph (MOD) in this example.
https://doi.org/10.1371/journal.pone.0206075.g003
ConfeitoGUI for size-sensitive community detection from a correlation network
PLOS ONE | https://doi.org/10.1371/journal.pone.0206075 October 23, 2018 9 / 18

VFSV,i is equal to or greater than VFT, edges between a seed vertex and the ith vertex for the
seed vertex (HVSV,i) are connected. Specifically, in a kernel module originating from the
seed vertex, only edges connected to the seed vertex are used for this process. Through the
process, vertices shared with multiple kernel modules are united. Thus, the redundancy of
vertices in kernel modules is eliminated in the network graph depicted in the process.
B) Depicting network graphs with various thresholds of VFNetwork graphs with various VFT thresholds (MODVFT) are created. For instance, for VFTranging from 0.50 to 0.99 in steps of 0.01, a total of 50 network graphs of MODVFT with dif-
ferent thresholds are created.
C) Selecting the best modules
In MODVFT, network modules with sizes ranging from p to q are those initially desired and
the number of the modules (MMODVFT) is counted. MODVFT showing the maximal num-
ber is designated as the final network module (MOD). The number of network modules
included in MOD is set to MMOD.
Although the present algorithm constructs network modules using VF values as indices to
connect vertices instead of correlation coefficients, the NFs of MOD and the VFs of the vertices
included in MOD are calculated using the original correlation coefficients. That is, the network
modules included in MOD are represented using vertex–vertex connections based on such
coefficients.
FNI (false-negative-in) series
It is possible to obtain false-negative indices that are closely related to a network module but
not included through the FPO and the modularizing series. In the FNI series (Fig 4), such ver-
tices are detected for each network module.
Each network module included in MOD is set as MODi; where 1� i�MMOD. Vertices that
are not included in MODi are set to residual vertices (RVj; 1� j� N–NMODi, and N and NMODi
represent the number of vertices included in the whole network and MODi, respectively). The
VS value of a residual vertex to the network modules in MOD is calculated in descending
order of highly correlated vertices for the residual vertex (HVRVj). The last highly correlated
vertex to be used for the calculation is preliminarily determined: in the ConfeitoGUI toolkit, a
user can set the number of vertices (the default value is 1000). Although VS values of the resid-
ual vertex should be calculated for all network modules in MOD, it is time-consuming to exe-
cute such calculations for each network module. The toolkit provides a result equivalent to the
calculation for all network modules by repeated calculation for only the network module
including the next highly correlated vertex for the residual vertex. The process requires a series
of calculations only for a single set of highly correlated vertices for the residual vertex. The ver-
tex with a VS value to a network module greater than an arbitrary value (e.g., 0.5) is incorpo-
rated into the module as a “false-negative” vertex.
The FNI series is not only useful for identifying false-negative elements, but also for analyz-
ing relationships between heterogeneous elements. For example, the FNI series can be used to
identify network modules of homogeneous elements using FPO and then identifying heteroge-
neous elements (or elements that are not included among the homogeneous elements) that are
specifically related to network modules.
Instructions for use of ConfeitoGUI
The present version of the ConfeitoGUI package (1.2.0 as of September 2017) requires Win-
dows 7 Professional (64-bit) and an Intel Core2 Quad CPU Q9400 @ 2.66 GHz for Windows
ConfeitoGUI for size-sensitive community detection from a correlation network
PLOS ONE | https://doi.org/10.1371/journal.pone.0206075 October 23, 2018 10 / 18

or OS X Yosemite 10.10.3 and Intel Core i7 @ 2.2 GHz for Macintosh. Both operating systems
require at least 8 GB of memory and Java 8 Update 45 (64-bit). The package is available at
http://www.plant.osakafu-u.ac.jp/~kagiana/confeito/. The present version of ConfeitoGUI is
not designed for the Linux operating system.
Fig 4. Example of an FNI series. Lighter vertices represent those included in MOD1. Darker vertices, RV1 and RV2, represent candidate false-negative vertices. Black
vertices represent a group of vertices with connections to the candidates, in which numbers associated with the groups represent the number of vertices included in the
respective group. Fractions with darker vertices represent VS values (VSRV1,MOD1 and VSRV2,MOD1). At a VS threshold of 0.5, only RV1 is incorporated into MOD1 as a
false-negative vertex.
https://doi.org/10.1371/journal.pone.0206075.g004
ConfeitoGUI for size-sensitive community detection from a correlation network
PLOS ONE | https://doi.org/10.1371/journal.pone.0206075 October 23, 2018 11 / 18

For quick use
The quick use method for ConfeitoGUI is illustrated on our website (http://www.plant.
osakafu-u.ac.jp/~kagiana/confeito/test.html). The website provides a method to use it with its
snapshots and a test dataset.
Input
ConfeitoGUI accepts multivariate datasets (i.e., two-dimensional tables containing elements as
rows and datasets as columns). Although the Confeito algorithm accepts any type of correla-
tion coefficient, ConfeitoGUI is equipped with a “Correlation Tool” that enables calculation of
both Pearson and cosine correlation coefficients.
The following rapid steps can be followed to use ConfeitoGUI:
1. ConfeitoGUI installation and uninstallation
From the website (http://www.plant.osakafu-u.ac.jp/~kagiana/confeito/ and http://webs2.
kazusa.or.jp/kagiana/confeito/), download ConfeitoGUI_1.2.0.zip and unzip it to a local drive.
2. Java Runtime Environment (JRE) installation
Install a new 64-bit version of JRE. As of September 2017, the software is available at http://
www.oracle.com/technetwork/java/javase/downloads/index.html.
3. Execution
Double click the “launch.bat” or “launch_mac.command” file for Windows or Macintosh,
respectively, to open the “ConfeitoGUI” window.
4. Calculate a correlation matrix
Click the “Init Tool” menu tab and then click “Correlation Tool” to begin calculation of a
correlation matrix. In the “Correlation Tool” window, browse for an input file (e.g., a sam-
ple dataset available at the ConfeitoGUI website) by clicking “Browse” in the “Input File”
row. Next, select an output folder by clicking “Browse” in the “Output Folder” row. Finally,
click “Start” to calculate a correlation matrix in a new folder based on the input file.
5. Preprocessing
Click “Preprocessing Tool” to create a text-formatted file including information on file
paths of the correlation dataset. Click “Browse” in the “Correlation Data Folder” row to
select the folder created in step 4. Next, click “Browse” to create an intermediate file (�.flis).
Finally, click “Start.”
6. False-positive-out (FPO) analysis
Click the “Confeito Analysis” tab. Select “FPO” in the “Analysis Menu,” click “Browse” in
the “Correlation Data File” row to open the intermediate file created in step 5, and then
click “Browse” in the “Output Folder” row to select an output folder. Finally, click “Start” to
create several FPO analysis results files.
Output
One of the output files will be named “result.net,” and this file can be used to depict a network
constructed by ConfeitoGUI using a network drawing software package such as Pajek [18].
The result.net file is formatted for Pajek and includes information regarding vertices and
edges between vertices. The user can arrange the positions of vertices using Pajek.
ConfeitoGUI for size-sensitive community detection from a correlation network
PLOS ONE | https://doi.org/10.1371/journal.pone.0206075 October 23, 2018 12 / 18

Another output file will be named “result.mod,” and this file includes information regard-
ing all network modules constructed by ConfeitoGUI. In the result.mod file, the NF values
(i.e., the harmonic mean of ND and NS) of network modules and the VF values (i.e., the har-
monic mean of VD and VS) of the vertices in the network modules (calculated using Process C
in the modularizing series) are indicated. The higher the NF value of a network module, the
tighter the intramodular connections will be in the module. A vertex with a higher VF repre-
sents a more central element in the module.
Results
We compared ConfeitoGUI’s accuracy to that of other local community identification meth-
ods (e.g., the Louvain [4], simulating annealing [3,17], and fast greedy [18] methods) using
network modules from a large mouse microarray dataset including results from 37,013 Affy-
metrix mouse microarray samples (named GPL1261) that was obtained from the Gene Expres-
sion Omnibus (GEO) of NCBI in April 2014 (S1 Table). Cosine correlation coefficients
between experiments were calculated, and a correlation network was constructed using the
coefficient matrix. The microarray samples’ network modules were detected using FPO analy-
sis with parameters of 6 for the minimum and 100 for the maximum elements. In addition,
network modules were identified using default setting of the Louvain method with Pajek soft-
ware [23] and the simulating annealing and fast greedy methods with R software. The resulting
network modules were compared through a series of microarray samples using the F-measure
for their memberships, because in this comparison similarity in sizes between original experi-
mental groups and expected local communities is thought to be true. The F-measure index is
the harmonic mean of the precision and recall indices [24]. The precision index was calculated
as the proportion of samples shared between a network module and a single series of samples
to the number of samples in the module. The recall index was calculated as the ratio of shared
samples to the number of samples included in the series. High F-measure values are indicative
of a high degree of similarity between a network module and a sample series, which provides
greater accuracy in discriminating between closely related experiments. The F-measure was
calculated for all network modules obtained using all methods. The network modules obtained
using ConfeitoGUI exhibited greater average F-measure values than those obtained using the
other methods (Table 1), suggesting that ConfeitoGUI performs better than the other publicly
available tools in terms of identifying network modules with sizes more appropriate to the
original experimental groups.
ConfeitoGUI is applicable not only to datasets in the field of molecular biology but to those
in social networks. We applied the toolkit to the dataset of Zachary’s karate club provided by
Newman et al. [3] to compare it with their result (Fig 5; see also our website for details, http://
Table 1. Comparison of the ConfeitoGUI to other tools used for size-sensitive module identification.
Method/Tool Correlation coefficient� F-measure��
ConfeitoGUI – 0.605 ± 0.007
Louvain[12] 0.97 0.465 ± 0.008
Simulating annealing[13,14] 0.96 0.397 ± 0.008
Fast greedy[15] 0.96 0.391 ± 0.008
� Correlation coefficients represent thresholds for identifying networks for correlations in mouse microarray samples
using methods other than the ConfeitoGUI tool, as the ConfeitoGUI tool uses the index modified with the
correlation coefficient.
�� For the average and standard error of the F-measure values, n = 2274.
https://doi.org/10.1371/journal.pone.0206075.t001
ConfeitoGUI for size-sensitive community detection from a correlation network
PLOS ONE | https://doi.org/10.1371/journal.pone.0206075 October 23, 2018 13 / 18
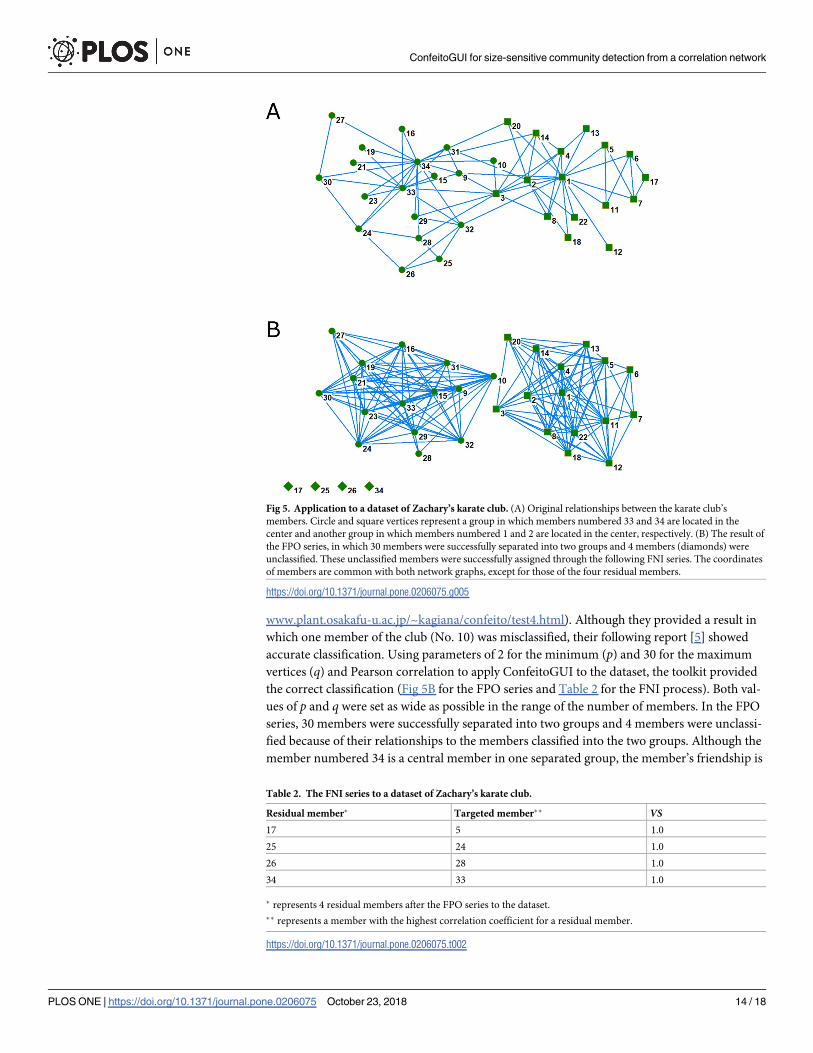
www.plant.osakafu-u.ac.jp/~kagiana/confeito/test4.html). Although they provided a result in
which one member of the club (No. 10) was misclassified, their following report [5] showed
accurate classification. Using parameters of 2 for the minimum (p) and 30 for the maximum
vertices (q) and Pearson correlation to apply ConfeitoGUI to the dataset, the toolkit provided
the correct classification (Fig 5B for the FPO series and Table 2 for the FNI process). Both val-
ues of p and q were set as wide as possible in the range of the number of members. In the FPO
series, 30 members were successfully separated into two groups and 4 members were unclassi-
fied because of their relationships to the members classified into the two groups. Although the
member numbered 34 is a central member in one separated group, the member’s friendship is
Fig 5. Application to a dataset of Zachary’s karate club. (A) Original relationships between the karate club’s
members. Circle and square vertices represent a group in which members numbered 33 and 34 are located in the
center and another group in which members numbered 1 and 2 are located in the center, respectively. (B) The result of
the FPO series, in which 30 members were successfully separated into two groups and 4 members (diamonds) were
unclassified. These unclassified members were successfully assigned through the following FNI series. The coordinates
of members are common with both network graphs, except for those of the four residual members.
https://doi.org/10.1371/journal.pone.0206075.g005
Table 2. The FNI series to a dataset of Zachary’s karate club.
Residual member� Targeted member�� VS17 5 1.0
25 24 1.0
26 28 1.0
34 33 1.0
� represents 4 residual members after the FPO series to the dataset.
�� represents a member with the highest correlation coefficient for a residual member.
https://doi.org/10.1371/journal.pone.0206075.t002
ConfeitoGUI for size-sensitive community detection from a correlation network
PLOS ONE | https://doi.org/10.1371/journal.pone.0206075 October 23, 2018 14 / 18

dissimilar to those of other members; i.e., the member is related to more members than the
others in the group. The FNI series led to the exact classification of the residual members by
calculating their VS values for the two groups. ConfeitoGUI is useful for border-sensitive com-
munity detection by selecting elements on boundaries and classifying them based on their VSvalues for network modules.
Discussion
The ConfeitoGUI toolkit described here is a powerful tool for creating many local communi-
ties in which the size is based on user requests from a network. The toolkit accepts any type of
multivariate data. By changing simple parameters that represent sizes of interest for the toolkit,
users can adjust the sizes of local communities that include any element of interest. When
changing the maximum size for a network module (q) into a smaller number, network mod-
ules with their sizes larger than the number can be divided into smaller network modules. On
the other hand, when changing q into a larger number, multiple network modules can be
merged to create a larger network module. ConfeitoGUI performed better than other publicly
available tools in terms of identifying network modules and their appropriate sizes using indi-
ces based on the improved Confeito algorithm as shown in Table 1.
Although the algorithm was developed to identify local communities from within a large
network, the present version of ConfeitoGUI can also be used to classify all of the elements
within a large network by adding a modularizing series. In the first series (i.e., the FPO series),
local communities originating from individual elements are obtained regardless of those origi-
nating from other elements. Therefore, the elements included in these communities are redun-
dant with respect to each other. In the second series (i.e., the modularizing series), this
redundancy is eliminated by merging the local communities. Through implementation of
these series, elements exhibiting relatively poor correlation with the members of the merged
communities are eliminated, even if they show high affinity for the community members. In
the third series (i.e., the false-negative-in [FNI] series), elements among those not included in
any of the communities but that exhibit high affinity for the merged communities are incorpo-
rated into the communities. By executing these series, all elements in a network can be classi-
fied into local communities.
Extensions and challenges
ConfeitoGUI can accept heterogeneous (or different types of) elements (e.g., genes and metab-
olites) by combining FPO and FNI analyses. In general, when heterogeneous elements are
used for a network analysis, network modules tend to be composed of either type of element
(i.e., there are almost all network modules containing only genes or those containing only
metabolites). To analyze relationships between different types of elements as well as within a
type, the following steps are recommended for dealing with heterogeneous elements. First, a
network graph consisting of homogeneous (or a single type of) elements (e.g., genes) is plotted
using the results of the FPO analysis. Heterogeneous (or another type of) elements (e.g.,
metabolites) are then mapped onto the network using the results of the FNI analysis (e.g.,
based on gene-metabolite correlations). Next, correlation matrices representing gene-gene and
gene-metabolite relationships are created using the “Correlation Tool” in ConfeitoGUI. More-
over, a gene-gene correlation matrix is used for FPO analyses of genes, whereas a gene-metab-
olite correlation matrix is used for FNI analyses to detect gene-metabolite relationships.
However, analyses of relationships between heterogeneous elements using ConfeitoGUI are
complex. A function that will enable simple accommodation of such heterogeneous elements
will be added to the ConfeitoGUI toolkit in the future.
ConfeitoGUI for size-sensitive community detection from a correlation network
PLOS ONE | https://doi.org/10.1371/journal.pone.0206075 October 23, 2018 15 / 18

It can be challenging to identify local communities from within large datasets using the
ConfeitoGUI toolkit. The software initially generates a correlation matrix for all elements.
When the number of elements is quite large (e.g., currently more than 100,000), it is difficult
to create a correlation matrix and execute the software analysis within a reasonable time frame
when using a personal computer (PC). For instance, in the case of a typical genome, the num-
ber of genes is lower than this limit (i.e., <100,000). The number of elements that can be
accepted by the software is limited by the memory in the user’s PC. A useful approach to over-
come this limitation is to preliminarily classify the elements, for instance according to topol-
ogy, as is the case with the Louvain method.
The present version of ConfeitoGUI is equipped with the FNI series only for a single net-
work module. To classify all elements in a network into a network module, the next version of
the toolkit will provide a function for such classification.
Supporting information
S1 Video. Steps of the false-positive-out series.
(MP4)
S1 Table. A microarray dataset for comparative analysis. The manual of ConfeitoGUI in
English is available at our site (http://www.plant.osakafu-u.ac.jp/~kagiana/confeito/).
(XLSX)
Acknowledgments
We sincerely thank Hiroshi Chiba of Tohoku Chemicals for converting Perl scripts to the Java
GUI program and repeatedly revising the software. We are also thankful to Mr. Yoshiki Naga-
shima and Dr. Daisuke Nakajima of Kazusa DNA Research Institute and Ms. Risa Fukui, Mr.
Yusuke Nakamoto, and Ms. Nanako Hirota of Osaka Prefecture University for conducting
performance evaluations.
Author Contributions
Conceptualization: Yoshiyuki Ogata, Daisuke Shibata.
Data curation: Yoshiyuki Ogata, Yasuto Kotani, Naohiro Kimura, Hideyuki Suzuki.
Formal analysis: Yoshiyuki Ogata, Hideyuki Suzuki.
Funding acquisition: Yoshiyuki Ogata, Hideyuki Suzuki.
Investigation: Yoshiyuki Ogata, Kazuto Mannen, Yasuto Kotani, Naohiro Kimura, Hideyuki
Suzuki.
Methodology: Yoshiyuki Ogata, Hideyuki Suzuki.
Project administration: Yoshiyuki Ogata, Hideyuki Suzuki.
Resources: Yoshiyuki Ogata, Nozomu Sakurai.
Software: Yoshiyuki Ogata, Hideyuki Suzuki.
Supervision: Yoshiyuki Ogata, Nozomu Sakurai, Daisuke Shibata, Hideyuki Suzuki.
Validation: Yoshiyuki Ogata, Kazuto Mannen, Yasuto Kotani, Naohiro Kimura, Hideyuki
Suzuki.
Visualization: Yoshiyuki Ogata, Hideyuki Suzuki.
ConfeitoGUI for size-sensitive community detection from a correlation network
PLOS ONE | https://doi.org/10.1371/journal.pone.0206075 October 23, 2018 16 / 18

Writing – original draft: Yoshiyuki Ogata, Kazuto Mannen, Hideyuki Suzuki.
Writing – review & editing: Yoshiyuki Ogata, Kazuto Mannen, Hideyuki Suzuki.
References1. Marx V. The big challenges of big data. Nature 2013; 498:255–260. https://doi.org/10.1038/498255a
PMID: 23765498
2. Clauset A, Moore C, Newman MEJ. Hierarchical structure and the prediction of missing links in net-
works. Nature 2008; 453:98–100. https://doi.org/10.1038/nature06830 PMID: 18451861
3. Newman MEJ, Girvan M. Finding and evaluating community structure in networks. Phys Rev E. 2004;
69:026113.
4. Blondel VD, Guilaume JL, Lambiotte R, Lefebvre E. Fast unfolding of communities in large networks. J
Stat Mech. 2008; https://doi.org/10.1088/1742-5468/2008/10/P10008
5. Newman MEJ. Modularity and community structure in networks. Proc Natl Acad Sci USA. 2006;
103:8577–8582. https://doi.org/10.1073/pnas.0601602103 PMID: 16723398
6. Ogata Y, Sakurai N, Suzuki H, Aoki K, Saito K, Shibata D. The prediction of local modular structures in
a co-expression network based on gene expression datasets. Genome Inform. 2009; 23(1):117–127.
PMID: 20180267
7. Benson DA, Cavanaugh M, Clark K, Karsch-Mizrachi I, Lipman DJ, Ostell J, et al. GenBank. Nucleic
Acids Res. 2013; 41:D36–42. https://doi.org/10.1093/nar/gks1195 PMID: 23193287
8. Consortium UniProt. UniProt: a hub for protein information. 2015; 43:D204–212. https://doi.org/10.
1093/nar/gku989 PMID: 25348405
9. O’Leary NA, Wright MW, Brister JR, Ciufo S, Haddad D, McVeigh R, et al. Reference sequence
(RefSeq) database at NCBI: current status, taxonomic expansion, and functional annotation. Nucleic
Acids Res. 2016; 44:D733–745. https://doi.org/10.1093/nar/gkv1189 PMID: 26553804
10. Horai H, Arita M, Kanaya S, Nihei Y, Ikeda T, Suwa K, et al. MassBank: a public repository for sharing
mass spectral data for life sciences. J Mass Spectrom. 2010; 45(7):703–714. https://doi.org/10.1002/
jms.1777 PMID: 20623627
11. Kale NS, Haug K, Conesa P, Jayseelan K, Moreno P, Rocca-Serra P, et al. MetaboLights: an open-
access database repository for metabolomics data. Curr Protoc Bioinformatics. 2016; 53:14.13.1–18.
12. Hirai MY, Sugiyama K, Sawada Y, Tohge T, Obayashi T, Suzuki A, et al. Omics-based identification
of Arabidopsis Myb transcription factors regulating aliphatic glucosinolate biosynthesis. Proc
Natl Acad Sci USA. 2007; 104(15):6478–6483. https://doi.org/10.1073/pnas.0611629104 PMID:
17420480
13. Ogata Y, Suzuki H, Shibata D. A gene co-expression database for understanding biological processes
in soybean. Plant Biotechnol. 2009; 26:503–507.
14. Ogata Y, Suzuki H, Shibata D. A database for poplar gene co-expression analysis for systematic under-
standing of biological processes, including stress response. J Wood Sci. 2009; 55:395–400.
15. Ogata Y, Suzuki H. Plant expressed sequence tags databases: practical uses and the improvement of
their searches using network module analysis. Plant Biotechnol. 2011; 28:351–360.
16. Sirim D, Wagner F, Lisitsa A, Pleiss J. The Cytochrome P450 Engineering Database: integration of bio-
chemical properties. BMC Biochemistry. 2009; 10:27. https://doi.org/10.1186/1471-2091-10-27 PMID:
19909539
17. Traag VA, Bruggeman J. Community detection in networks with positive and negative links. Phys Rev
E. 2009; 80:036115.
18. Clauset A, Newman MEJ, Moore C. Finding community structure in very large networks. Phys Rev E.
2004; 70:066111.
19. Bastian M, Heymann S, Jacomy M. Gephi: an open source software for exploring and manipulating net-
works. Icwsm 2009; 8:361–362.
20. Guo J, Wilson AG, Nordman DJ. Bayesian nonparametric models for community detection. Techno-
metrics 2013; 55:390–402.
21. Kaplan A, Hofmann H, Nordman D. An interactive graphical method for community detection in network
data. Computational statistics 2017; 32:535–557.
22. Ogata Y, Suzuki H, Sakurai N, Shibata D. CoP: a database for characterizing co-expressed gene mod-
ules with biological information in plants. Bioinformatics. 2010; 26(9):1267–1268. https://doi.org/10.
1093/bioinformatics/btq121 PMID: 20305269
ConfeitoGUI for size-sensitive community detection from a correlation network
PLOS ONE | https://doi.org/10.1371/journal.pone.0206075 October 23, 2018 17 / 18

23. Batagelj V, Mrvar A. Pajek—Analysis and visualization of large networks. In: Junger M, Mutzel P, edi-
tors. Graph Drawing Software. Springer, Berlin; 2003. pp. 77–103.
24. Rijsbergen CJV: Information Retrieval. 2nd ed. Butterworth-Heinemann; 1979.
ConfeitoGUI for size-sensitive community detection from a correlation network
PLOS ONE | https://doi.org/10.1371/journal.pone.0206075 October 23, 2018 18 / 18