conference call –q2/20 resultsdevices at stable prices • covid-19 weighs on h1/20 results,...
TRANSCRIPT
Conference Call – Q2/20 Results
Bad Homburg, 30 July 2020
Frankfurt stock exchange: FRE │ US ADR program: FSNUY │ www.fresenius.com/investors
Safe Harbor Statement
This presentation contains forward-looking statements that are subject to various risks and uncertainties. Future results could differ materially from those described in these forward-looking statements due to certain factors, e.g. changes in business, economic and competitive conditions, regulatory reforms, results of clinical trials, foreign exchange rate fluctuations, uncertainties in litigation or investigative proceedings, and the availability of financing. Fresenius does not undertake any responsibility to update the forward-looking statements contained in this presentation.
Figures for 2020 and 2019 according to IFRS 16 (except otherwise stated).
Q2/20 Results, 30 July 2020 © Fresenius SE & Co. KGaA Investor Relations & Sustainability 2

Fresenius Group Q2/20:Successful crisis management amid the COVID-19 pandemic
Q2/20 Results, 30 July 2020 © Fresenius SE & Co. KGaA Investor Relations & Sustainability
• Fresenius at the forefront to fight COVID-19• Business continuity in plants, hospitals and sites ensured• Safety measures to protect patients and staff enhanced• Supplying COVID-19 patients with essential drugs &
devices at stable prices
• COVID-19 weighs on H1/20 results, however, we see a strong underlying business development
• Q2/20 should mark the trough• Acceleration of earnings growth expected in H2/20• New 2020 guidance including COVID-19 effects is
testament to the Group’s resilience
• Resilience of business model also recognized by rating agencies
• Part of critical infrastructure with high degree of vertical integration
• Our core competencies – affordable and high quality healthcare products and services - will play an even more important role in the future
Responsibility
Fight COVID-19 whilstsafeguarding people‘s health
Financial impact
Robust performance in exceptional times
Resilience
Even stronger followingthis crisis
3

Fresenius Kabi: Gradual recovery in China, COVID-19 headwindselsewhere due to few elective treatments
Q2/20 Results, 30 July 2020 © Fresenius SE & Co. KGaA Investor Relations & Sustainability
H1/20: Status quo Remainder of FY/20: Meaningful uncertainty
China
North America
Devices
COVID-related extra demand
Manufacturing
Incremental expenses for raw materials, logistics, labor and protection of our staff
COVID-related extra demand & stock-build
SG&A savings
Q1/20 Q2/20 H2/20
Postponement of elective procedures
Europe
Global
COVID-related extra demand
Postponement of elective procedures
COVID-related Less blood consumptionextra demand and fewer blood & plasma donations
RoW
China
Global
Reduced volumes
Postponement of elective procedures
Pumps
TCT
Improved capacity utilization & Under-utilization of capacity &inventory build working capital management
4
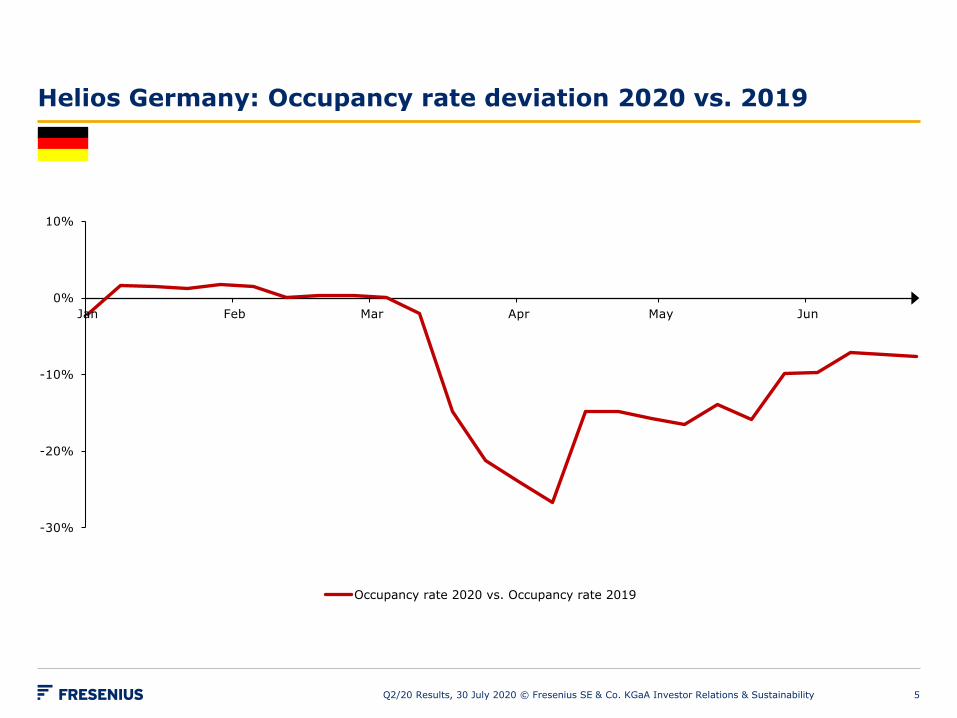
Helios Germany: Occupancy rate deviation 2020 vs. 2019
-30%
-20%
-10%
0%
10%
Jan Feb Mar Apr May Jun
Occupancy rate 2020 vs. Occupancy rate 2019
Q2/20 Results, 30 July 2020 © Fresenius SE & Co. KGaA Investor Relations & Sustainability 5
Q2/20 Results, 30 July 2020 © Fresenius SE & Co. KGaA Investor Relations & Sustainability
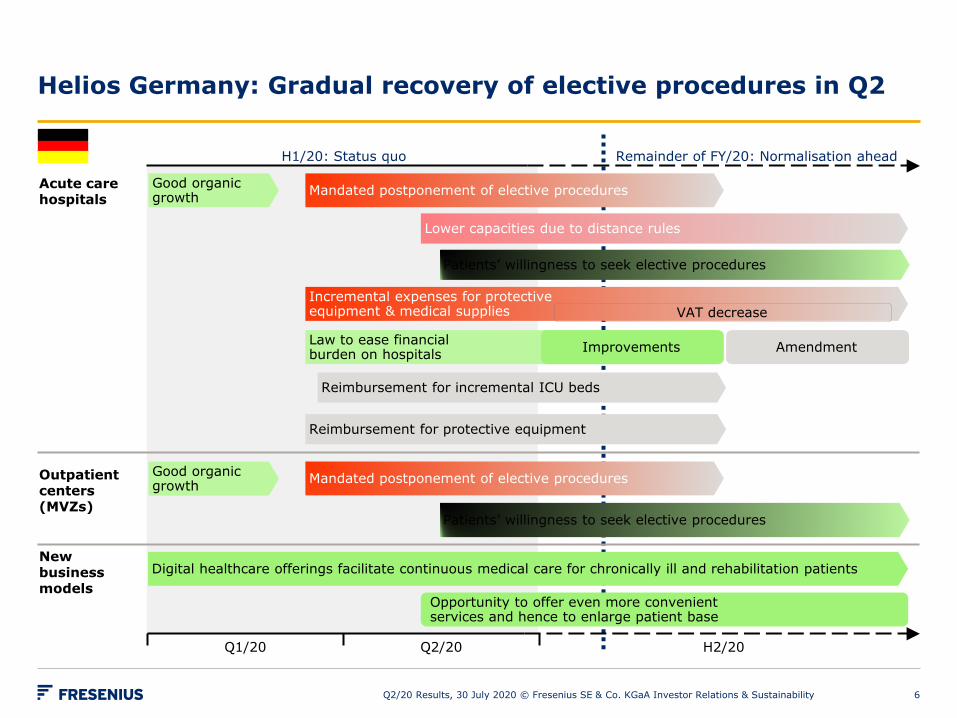
H1/20: Status quo
Q1/20 Q2/20 H2/20
Remainder of FY/20: Normalisation ahead
Acute care hospitals
Outpatient centers(MVZs)
New businessmodels
Good organic growth
Law to ease financialburden on hospitals
Good organic growth
Digital healthcare offerings facilitate continuous medical care for chronically ill and rehabilitation patients
Opportunity to offer even more convenient services and hence to enlarge patient base
Mandated postponement of elective procedures
Patients’ willingness to seek elective procedures
Reimbursement for incremental ICU beds
Lower capacities due to distance rules
Helios Germany: Gradual recovery of elective procedures in Q2
Improvements Amendment
Incremental expenses for protectiveequipment & medical supplies VAT decrease
Reimbursement for protective equipment
Mandated postponement of elective procedures
Patients’ willingness to seek elective procedures
6

Q2/20 Results, 30 July 2020 © Fresenius SE & Co. KGaA Investor Relations & Sustainability
H1/20: Status quo
Q1/20 Q2/20 H2/20
Remainder of FY/20: Normalisation ahead
PPPs
Constrained opportunity to generate ‘Free Choice’ sales
Private hospitals
Good organic growth
ORPs Good organic growth
Cancellation of medical check-ups
Reimbursement/compensation negotiationswith private Health Insurance Companies
Helios Spain: Q2 marked by significant COVID-19 headwinds, gradual recovery of elective treatments started only end of Q2
Additional opportunities in “safe workplace”solutions, minimizing infection risk
Strengthening relation-ships with key clients
Mandated postponement of elective procedures
Incremental beds (ICU & acute) and ventilators
Patients’ willingness to seek elective procedures
Good organic growth
Incremental expenses for protective equipment, medical supplies & additional staff
Mandated postponement of elective procedures
Incremental beds (ICU & acute) and ventilators
Incremental expenses for protective equipment, medical supplies & additional staff
Clarification on reimbursement/compensationexpected in H2/20
Patients’ willingness to seek elective procedures
7
Good organic growth
Q2/20 Results, 30 July 2020 © Fresenius SE & Co. KGaA Investor Relations & Sustainability
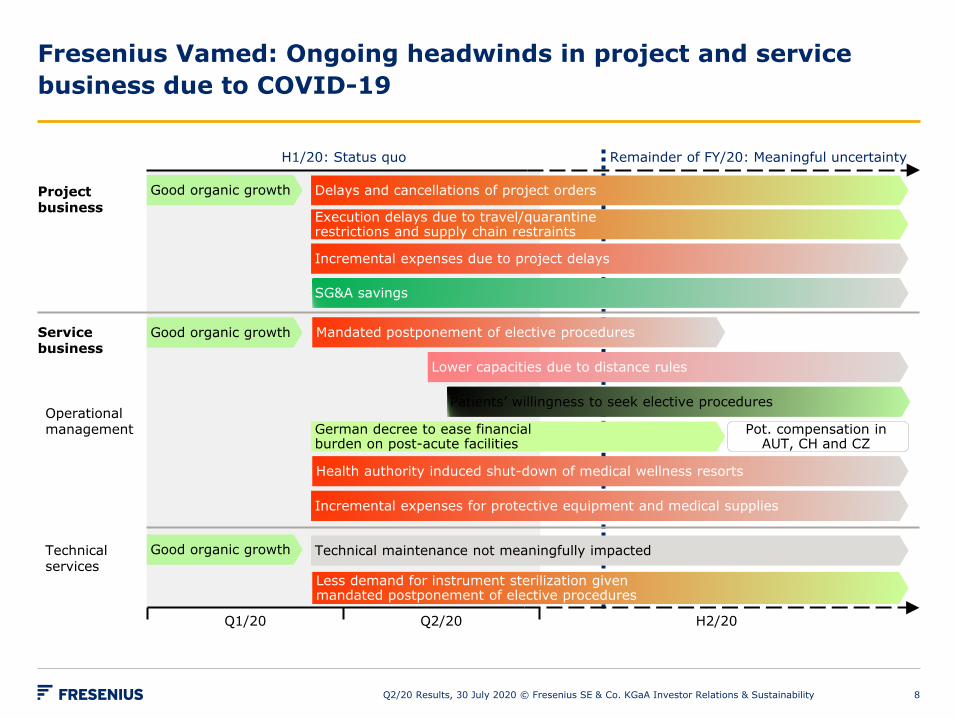
H1/20: Status quo Remainder of FY/20: Meaningful uncertainty
Q1/20 Q2/20 H2/20
Project business
Service business
Operational management
Technical services
Technical maintenance not meaningfully impacted
Execution delays due to travel/quarantine restrictions and supply chain restraints
Incremental expenses for protective equipment and medical supplies
Pot. compensation in AUT, CH and CZ
Incremental expenses due to project delays
Fresenius Vamed: Ongoing headwinds in project and service business due to COVID-19
Less demand for instrument sterilization given mandated postponement of elective procedures
Delays and cancellations of project orders
SG&A savings
Mandated postponement of elective procedures
Patients’ willingness to seek elective procedures
Lower capacities due to distance rules
Good organic growth
German decree to ease financial burden on post-acute facilities
Health authority induced shut-down of medical wellness resorts
Good organic growth
8
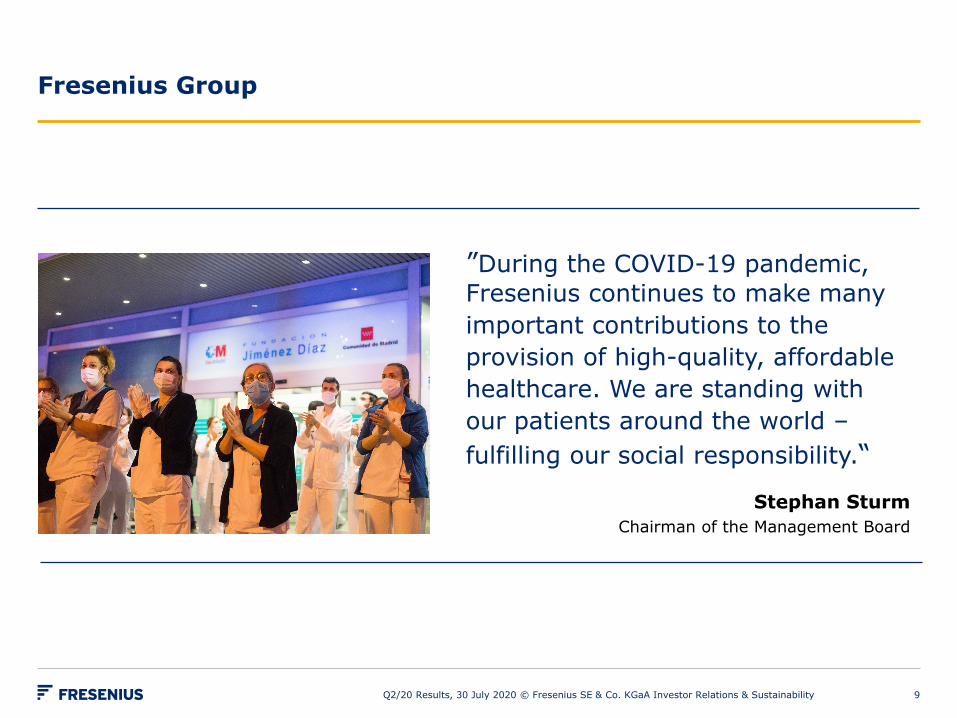
Fresenius Group
”During the COVID-19 pandemic, Fresenius continues to make many important contributions to the provision of high-quality, affordable healthcare. We are standing with our patients around the world –fulfilling our social responsibility.“
Stephan SturmChairman of the Management Board
Q2/20 Results, 30 July 2020 © Fresenius SE & Co. KGaA Investor Relations & Sustainability 9
Financial Review Q2/20
Q2/20 Results, 30 July 2020 © Fresenius SE & Co. KGaA Investor Relations & Sustainability 10
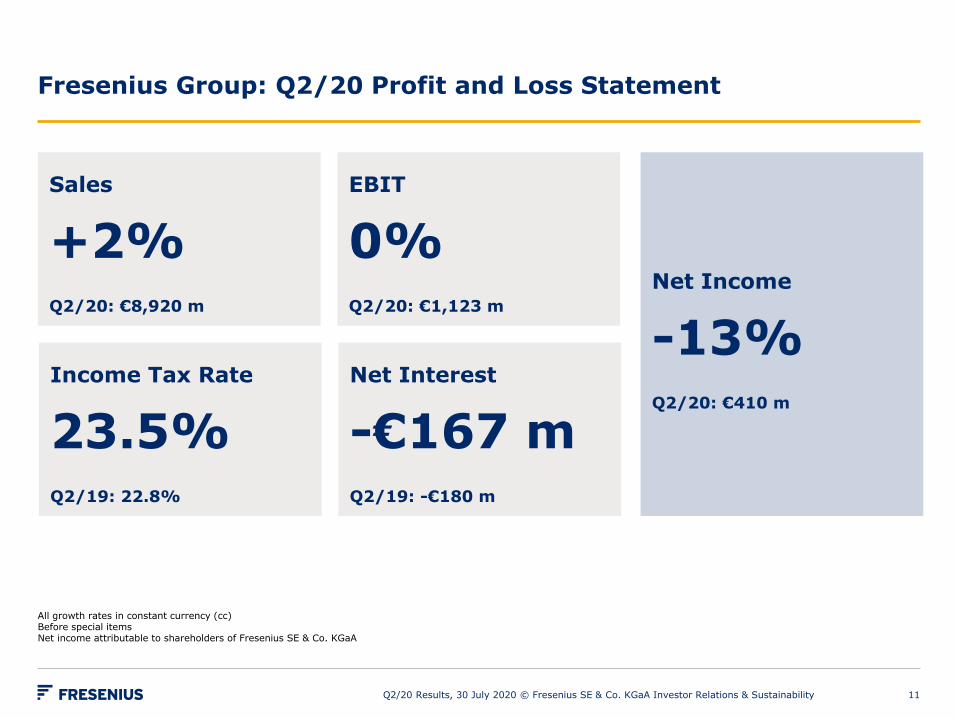
Sales
+2%Q2/20: €8,920 m
Net Income
-13%Q2/20: €410 m
EBIT
0%Q2/20: €1,123 m
Fresenius Group: Q2/20 Profit and Loss Statement
Q2/20 Results, 30 July 2020 © Fresenius SE & Co. KGaA Investor Relations & Sustainability
All growth rates in constant currency (cc)Before special itemsNet income attributable to shareholders of Fresenius SE & Co. KGaA
Net Interest
-€167 mQ2/19: -€180 m
Income Tax Rate
23.5%Q2/19: 22.8%
11

All figures before special itemsFor a detailed overview of special items please see the reconciliation tables provided on our website https://www.fresenius.com/results-center.
Fresenius Group: Q2/20 Business Segment Growth
Organic sales growth
Q2/20 Results, 30 July 2020 © Fresenius SE & Co. KGaA Investor Relations & Sustainability
EBIT growth (cc)
+4%
+2%
-2%
-1%
+25%
-5%
-29%
-159%
+2% 0%
12
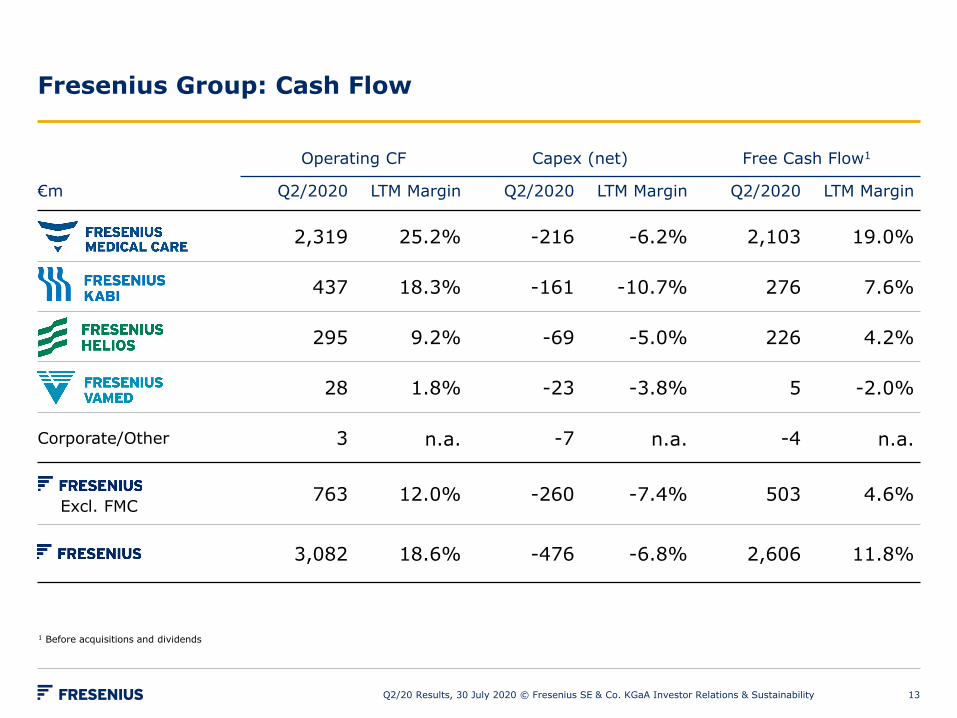
Fresenius Group: Cash Flow
Q2/20 Results, 30 July 2020 © Fresenius SE & Co. KGaA Investor Relations & Sustainability
Operating CF Capex (net) Free Cash Flow1
€m Q2/2020 LTM Margin Q2/2020 LTM Margin Q2/2020 LTM Margin
2,319 25.2% -216 -6.2% 2,103 19.0%
437 18.3% -161 -10.7% 276 7.6%
295 9.2% -69 -5.0% 226 4.2%
28 1.8% -23 -3.8% 5 -2.0%
Corporate/Other 3 n.a. -7 n.a. -4 n.a.
763 12.0% -260 -7.4% 503 4.6%
3,082 18.6% -476 -6.8% 2,606 11.8%
1 Before acquisitions and dividends
Excl. FMC
13
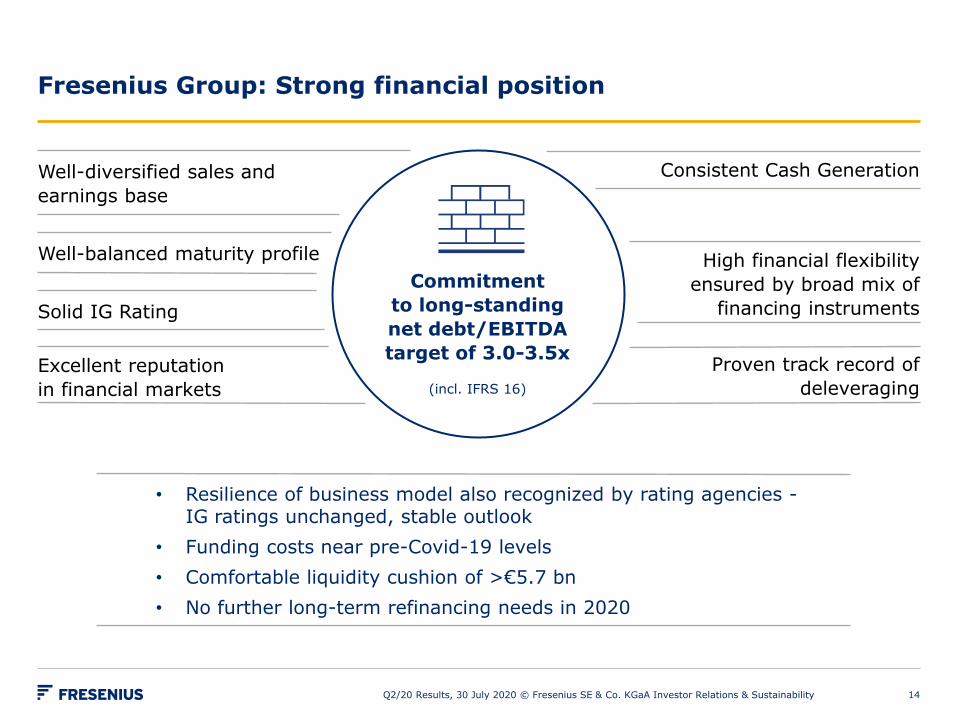
Fresenius Group: Strong financial position
High financial flexibility ensured by broad mix of
financing instruments
Consistent Cash Generation
Well-balanced maturity profile
Excellent reputation in financial markets
Well-diversified sales and earnings base
• Resilience of business model also recognized by rating agencies -IG ratings unchanged, stable outlook
• Funding costs near pre-Covid-19 levels• Comfortable liquidity cushion of >€5.7 bn• No further long-term refinancing needs in 2020
Commitment to long-standingnet debt/EBITDA target of 3.0-3.5x
(incl. IFRS 16)
Q2/20 Results, 30 July 2020 © Fresenius SE & Co. KGaA Investor Relations & Sustainability
Proven track record of deleveraging
Solid IG Rating
14

€m (except otherwise stated)FY/19Base1
H1/20Actual FY/20e2
FY/203
New
Sales growth (org) 6,919 3,467 +3% to +6% +2% to +5%
EBIT growth (cc) 1,205 581 -4% to +0% -6% to -3%
Sales growth (org) 9,234 4,781 +3% to +6% +1% to +4%
EBIT growth (cc) 1,025 472 +3% to +7% broadly stable
Sales growth (org) 2,206 974 +4% to +7% ~ 10% decline
EBIT growth (cc) 134 1 +5% to +9% ~ 50% decline
1 Before special items and including IFRS 16 effects2 Before special items3 Before special items and including estimated COVID-19 effects
For a detailed overview of special items please see the reconciliation tables provided on our website https://www.fresenius.com/results-center.
Fresenius Group: FY/20 Financial Outlook by Business Segment (including COVID-19 effects)
Q2/20 Results, 30 July 2020 © Fresenius SE & Co. KGaA Investor Relations & Sustainability 15

€m(except otherwise stated)
FY/19Base1
H1/20Actual2 FY/20e2
FY/20e2,3
New
Sales growth (cc) 35,409 +5% +4% to +7% +3% to +6%
Net income4
growth (cc)1,879 -6% +1% to +5% -4% to +1%
Fresenius Group: FY/20 Financial Guidance (including COVID-19 effects)
1 Before special items, including IFRS 16 effects, including NxStage operations 2 Before special items3 Including estimated COVID-19 effects4 Net income attributable to shareholders of Fresenius SE&Co.KGaA
For a detailed overview of special items please see the reconciliation tables provided on our website https://www.fresenius.com/results-center.
Q2/20 Results, 30 July 2020 © Fresenius SE & Co. KGaA Investor Relations & Sustainability 16
Attachments
Q2/20 Results, 30 July 2020 © Fresenius SE & Co. KGaA Investor Relations & Sustainability 17
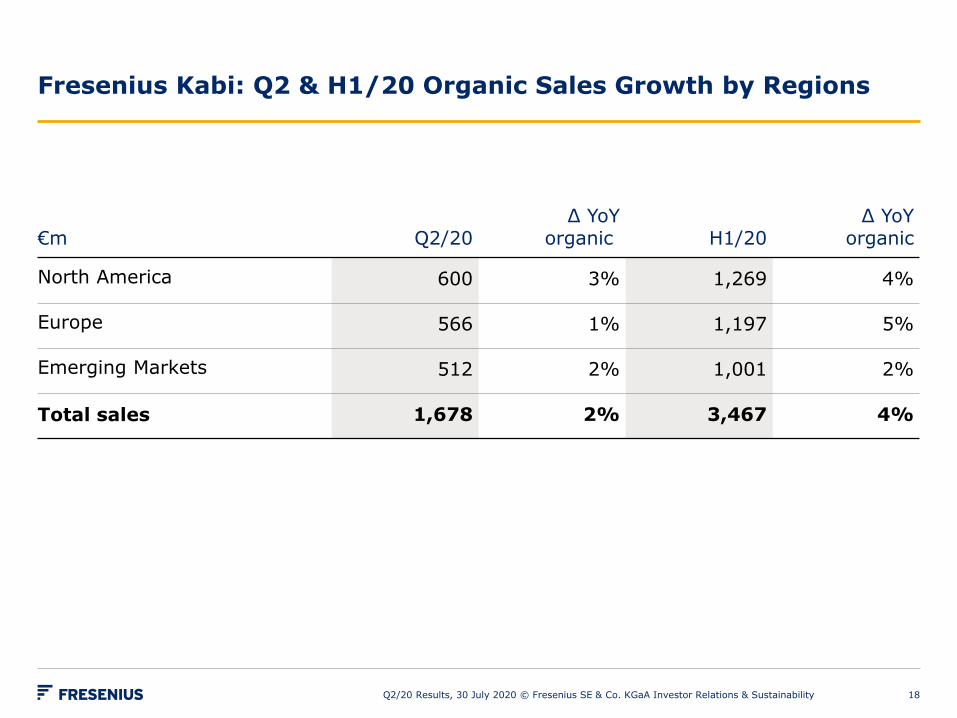
Fresenius Kabi: Q2 & H1/20 Organic Sales Growth by Regions
€m Q2/20Δ YoY
organic H1/20Δ YoY
organic
North America 600 3% 1,269 4%
Europe 566 1% 1,197 5%
Emerging Markets 512 2% 1,001 2%
Total sales 1,678 2% 3,467 4%
Q2/20 Results, 30 July 2020 © Fresenius SE & Co. KGaA Investor Relations & Sustainability 18

Fresenius Kabi: Q2 & H1/20 Organic Sales Growth by Product Segment
€m Q2/20 Δ YoY organic
H1/20 Δ YoY organic
IV Drugs 741 5% 1,537 6%
Infusion Therapy 178 -9% 377 -5%
Clinical Nutrition 456 1% 917 2%
Medical Devices/Transfusion Technology
303 2% 636 7%
Total sales 1,678 2% 3,467 4%
Q2/20 Results, 30 July 2020 © Fresenius SE & Co. KGaA Investor Relations & Sustainability 19
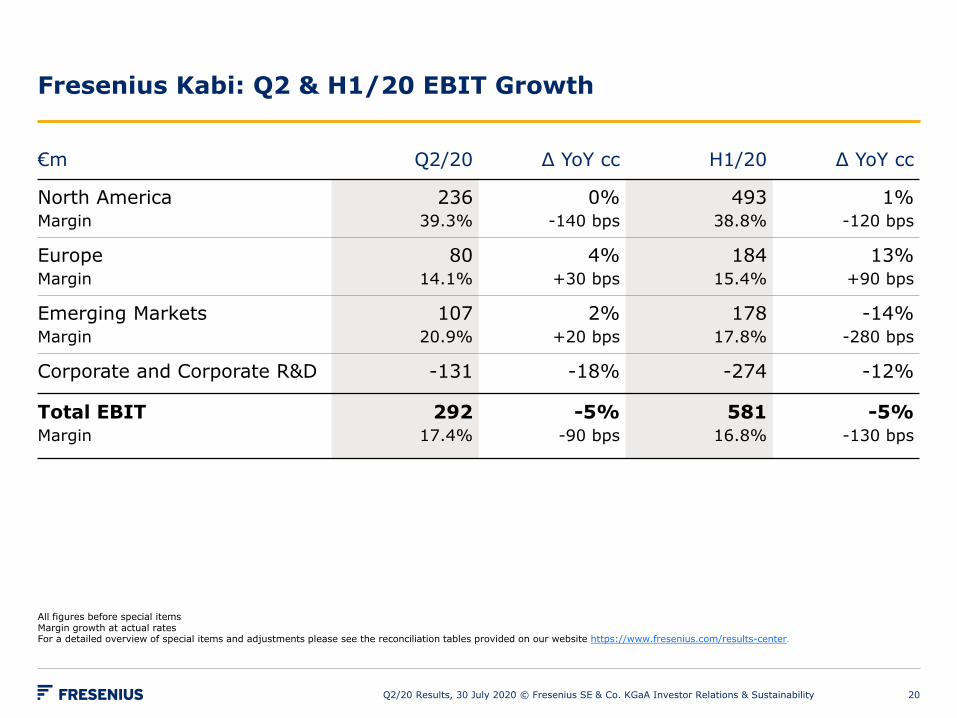
Fresenius Kabi: Q2 & H1/20 EBIT Growth
Q2/20 Results, 30 July 2020 © Fresenius SE & Co. KGaA Investor Relations & Sustainability
€m Q2/20 Δ YoY cc H1/20 Δ YoY cc
North AmericaMargin
23639.3%
0%-140 bps
49338.8%
1%-120 bps
EuropeMargin
8014.1%
4%+30 bps
18415.4%
13%+90 bps
Emerging MarketsMargin
10720.9%
2%+20 bps
17817.8%
-14%-280 bps
Corporate and Corporate R&D -131 -18% -274 -12%
Total EBITMargin
29217.4%
-5%-90 bps
58116.8%
-5%-130 bps
All figures before special itemsMargin growth at actual ratesFor a detailed overview of special items and adjustments please see the reconciliation tables provided on our website https://www.fresenius.com/results-center.
20
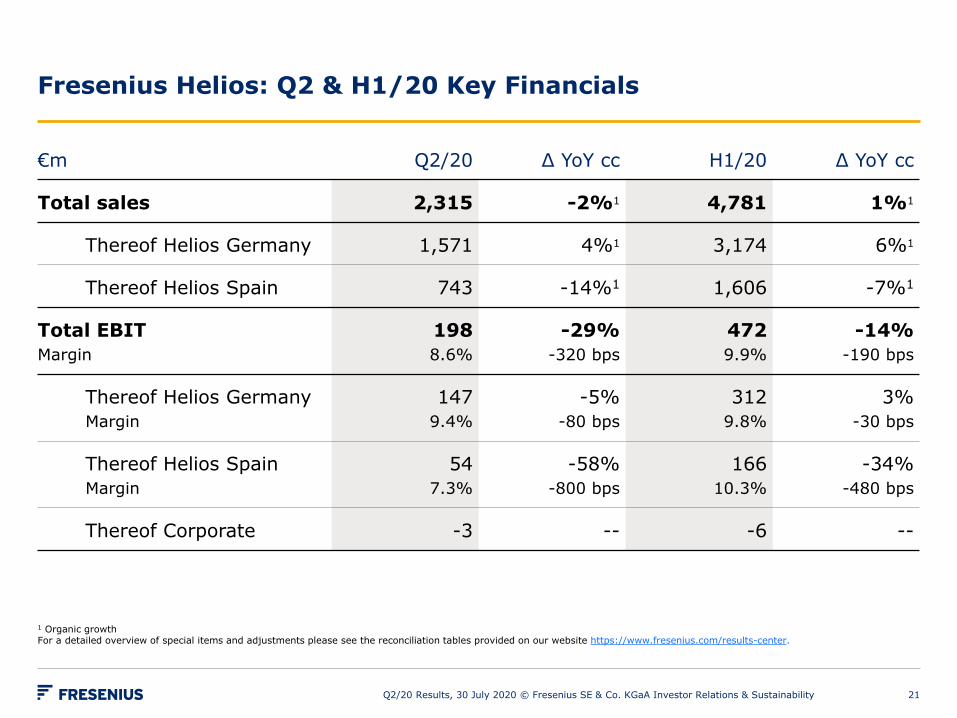
Fresenius Helios: Q2 & H1/20 Key Financials
Q2/20 Results, 30 July 2020 © Fresenius SE & Co. KGaA Investor Relations & Sustainability
€m Q2/20 Δ YoY cc H1/20 Δ YoY cc
Total sales 2,315 -2%1 4,781 1%1
Thereof Helios Germany 1,571 4%1 3,174 6%1
Thereof Helios Spain 743 -14%1 1,606 -7%1
Total EBITMargin
1988.6%
-29%-320 bps
4729.9%
-14%-190 bps
Thereof Helios GermanyMargin
1479.4%
-5%-80 bps
3129.8%
3%-30 bps
Thereof Helios SpainMargin
547.3%
-58%-800 bps
16610.3%
-34%-480 bps
Thereof Corporate -3 -- -6 --
1 Organic growthFor a detailed overview of special items and adjustments please see the reconciliation tables provided on our website https://www.fresenius.com/results-center.
21

Fresenius Helios: Key Metrics
Q2/20 Results, 30 July 2020 © Fresenius SE & Co. KGaA Investor Relations & Sustainability
H1/20 FY/19 Δ
No. of hospitals Germany- Acute care hospitals
8683
8683
0%0%
No. of hospitals Spain(Hospitals)
52 51 2%
No. of beds Germany- Acute care hospitals
28,81128,284
28,90728,380
0%0%
No. of beds Spain(Hospitals)
7,832 7,288 7%
Admissions Germany (acute care) 519,184 1,206,654
Admissions Spain (including outpatients) 7,009,642 15,396,051
22

Fresenius Vamed: Q2 & H1/20 Key Financials
1 Project business only2 Versus December 31, 2019
€m Q2/20 Δ YoY cc H1/20 Δ YoY cc
Total salesThereof organic sales
475 1%-1%
974 7%5%
Project business 146 18% 288 24%
Service business 329 -4% 686 1%
Total EBIT -13 -159% 1 -97%
Order intake1 50 -57% 174 -65%
Order backlog1 2,745 -4%2
Q2/20 Results, 30 July 2020 © Fresenius SE & Co. KGaA Investor Relations & Sustainability 23

Fresenius Group: Q2/20 Key Financials
Q2/20 Results, 30 July 2020 © Fresenius SE & Co. KGaA Investor Relations & Sustainability
€m Q2/201 specialitems
Q2/20 reported
Δ YoY cc1
Sales 8,920 - 8,920 2%
EBIT 1,123 - 1,123 0%
Net interest -167 - -167 7%
Income taxes -225 1 -224 -4%
Net income2 410 1 411 -13%
1 Before special items2 Net income attributable to shareholders of Fresenius SE & Co. KGaA
For a detailed overview of special items and adjustments please see the reconciliation tables provided on our website https://www.fresenius.com/results-center.
24

Fresenius Group: Calculation of Noncontrolling Interests
Q2/20 Results, 30 July 2020 © Fresenius SE & Co. KGaA Investor Relations & Sustainability
€m H1/20 H1/19
Earnings before tax and noncontrolling interests 1,907 1,887
Taxes -440 -435
Noncontrolling interests, thereof -592 -524
Fresenius Medical Care net income not attributable to Fresenius (H1/20: ~68%)
-431 -371
Noncontrolling interest holders in Fresenius Medical Care -144 -118
Noncontrolling interest holders in Fresenius Kabi (-€17 m), Fresenius Helios (-€2 m), Fresenius Vamed (€0 m) and due toFresenius Vamed’s 23% external ownership (+€2 m)
-17 -35
Net income attributable to Fresenius SE & Co. KGaA 875 928
Before special itemsFor a detailed overview of special items and adjustments please see the reconciliation tables provided on our website https://www.fresenius.com/results-center.
25

Fresenius Group: Cash Flow
Q2/20 Results, 30 July 2020 © Fresenius SE & Co. KGaA Investor Relations & Sustainability
€m Q2/20 LTM Margin Δ YoY
Operating Cash Flow 3,082 18.6% 156%
Capex (net) -476 -6.8% 14%
Free Cash Flow(before acquisitions and dividends)
2,606 11.8% --
Acquisitions (net) -79
Dividends -153
Free Cash Flow(after acquisitions and dividends)
2,374 8.7% --
26
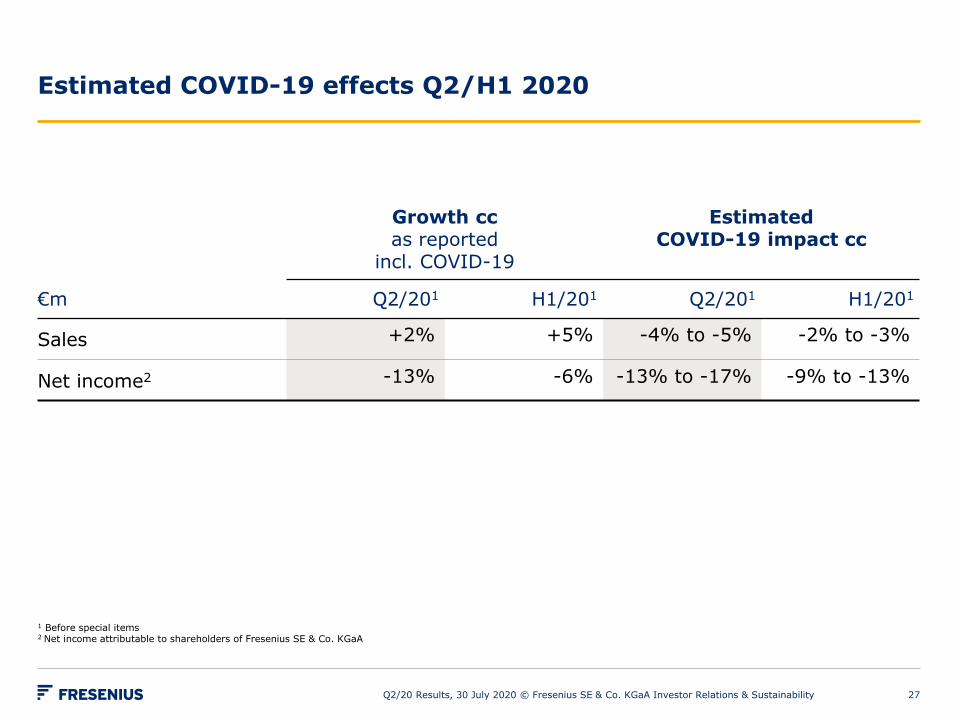
Estimated COVID-19 effects Q2/H1 2020
Q2/20 Results, 30 July 2020 © Fresenius SE & Co. KGaA Investor Relations & Sustainability
Growth ccas reported
incl. COVID-19
EstimatedCOVID-19 impact cc
€m Q2/201 H1/201 Q2/201 H1/201
Sales +2% +5% -4% to -5% -2% to -3%
Net income2 -13% -6% -13% to -17% -9% to -13%
1 Before special items2 Net income attributable to shareholders of Fresenius SE & Co. KGaA
27
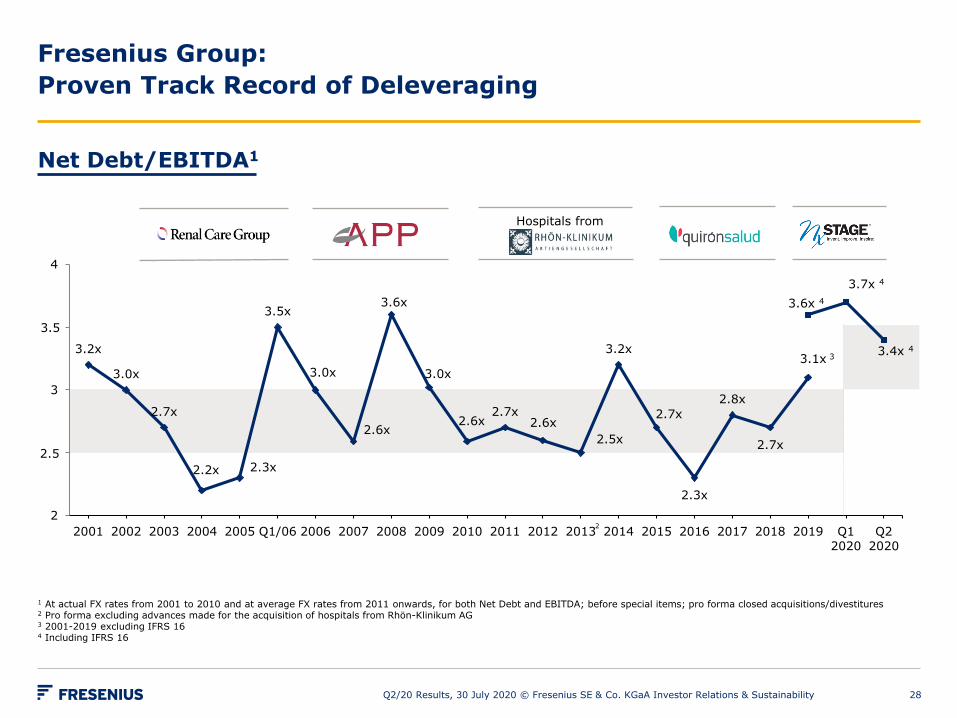
3.2x
3.0x
2.7x
2.2x 2.3x
3.5x
3.0x
2.6x
3.6x
3.0x
2.6x2.7x
2.6x2.5x
3.2x
2.7x
2.3x
2.8x
2.7x
3.1x 3
3.6x 43.7x 4
3.4x 4
2
2,5
3
3,5
4
2001 2002 2003 2004 2005 Q1/06 2006 2007 2008 2009 2010 2011 2012 2013 2014 2015 2016 2017 2018 2019 Q12020
Q22020
2
Hospitals from
Q2/20 Results, 30 July 2020 © Fresenius SE & Co. KGaA Investor Relations & Sustainability
Fresenius Group: Proven Track Record of Deleveraging
Net Debt/EBITDA1
1 At actual FX rates from 2001 to 2010 and at average FX rates from 2011 onwards, for both Net Debt and EBITDA; before special items; pro forma closed acquisitions/divestitures2 Pro forma excluding advances made for the acquisition of hospitals from Rhön-Klinikum AG3 2001-2019 excluding IFRS 164 Including IFRS 16
2.5
3.5
28

Fresenius Group: Major Long Term Debt Maturities1,2
All major remaining 2020 maturities already refinanced
Q2/20 Results, 30 July 2020 © Fresenius SE & Co. KGaA Investor Relations & Sustainability
1 As of June 30, 2020 and based on utilization of major financing instruments, excl. Commercial Paper of €1,267m2 Pro Forma repayment of FSE €500m bonds on July 15, 2020 and early repayment of FMC $500m bonds on July 17, 2020, originally maturing on Oct. 15, 2020
€m
Fresenius Medical Care Fresenius excl. Fresenius Medical Care
Maturity 3.9 years2 on
average
68
1,016
1,740
650357 500
1,100 947750
77
1,926
2,021
698
2,071
500
238
1,657
750
584
500
0
1.000
2.000
3.000
4.000
2020 2021 2022 2023 2024 2025 2026 2027 2028 2029 2030 2031 2032
4,000
3,000
2,000
1,000
29
Financial Calendar / Contact
Financial Calendar 28 August 2020 Annual General Meeting (virtual event)
29 October 2020 Results Q3/20
Please note that these dates could be subject to change.
Contact
Investor Relations & SustainabilityFresenius SE & Co. KGaAphone: +49 6172 608-2485e-mail: [email protected] further information and current news: www.fresenius.com
Follow us on Twitter www.twitter.com/fresenius_irand LinkedIn: www.linkedin.com/company/fresenius-investor-relations
Q2/20 Results, 30 July 2020 © Fresenius SE & Co. KGaA Investor Relations & Sustainability 30