conference call first nine months of fiscal year 2014 · q1-q3 2015 671 616 q1-q3 2014 10.8 lignite...
TRANSCRIPT

Conference call on the first nine months 2015 »
Karlsruhe, 13 November 2015 Thomas Kusterer, Chief Financial Officer
Ingo Peter Voigt, Senior Vice President, Head of Finance, M&A and Investor Relations
EnBW Energie Baden-Württemberg AG
Unless indicated otherwise, all data contained hereinafter refers to the EnBW group and is calculated according to IFRS.
No offer or investment recommendation
This presentation has been prepared for information purposes only. It does not constitute an offer, an invitation or a recommendation to purchase or sell securities issued by EnBW Energie Baden-Württemberg AG (EnBW), a company of the EnBW group or any other company. This presentation does not constitute a request, instruction or recommendation to vote or give consent. All descriptions, examples and calculations are included in this presentation for illustration purposes only.
Future-oriented statements
This presentation contains future-oriented statements that are based on current assumptions, plans, estimates and forecasts of the management of EnBW. Such future-oriented statements are therefore only valid at the time at which they are published for the first time. Future-oriented statements are indicated by the context, but may also be
identified by the use of the words “may”, “will”, “should”, “plans”, “intends”, “expects”, “believes”, “assumes”, “forecasts”, “potentially” or “continued” and similar expressions.
By nature, future-oriented statements are subject to risks and uncertainties that cannot be controlled or accurately predicted by EnBW. Actual events, future results, the financial position, development or performance of EnBW and the companies of the EnBW group may therefore diverge considerably from the future-oriented statements made in this presentation. Therefore it cannot be guaranteed nor can any liability be assumed otherwise that these future-oriented statements will prove complete, correct or precise or that expected and forecast results will actually occur in the future.
No obligation to update the information
EnBW assumes no obligation of any kind to update the information contained in this presentation or to adjust or update future-oriented statements to future events or developments.
Important note
Conference Call on the first nine months 2015, 13 November 2015 2
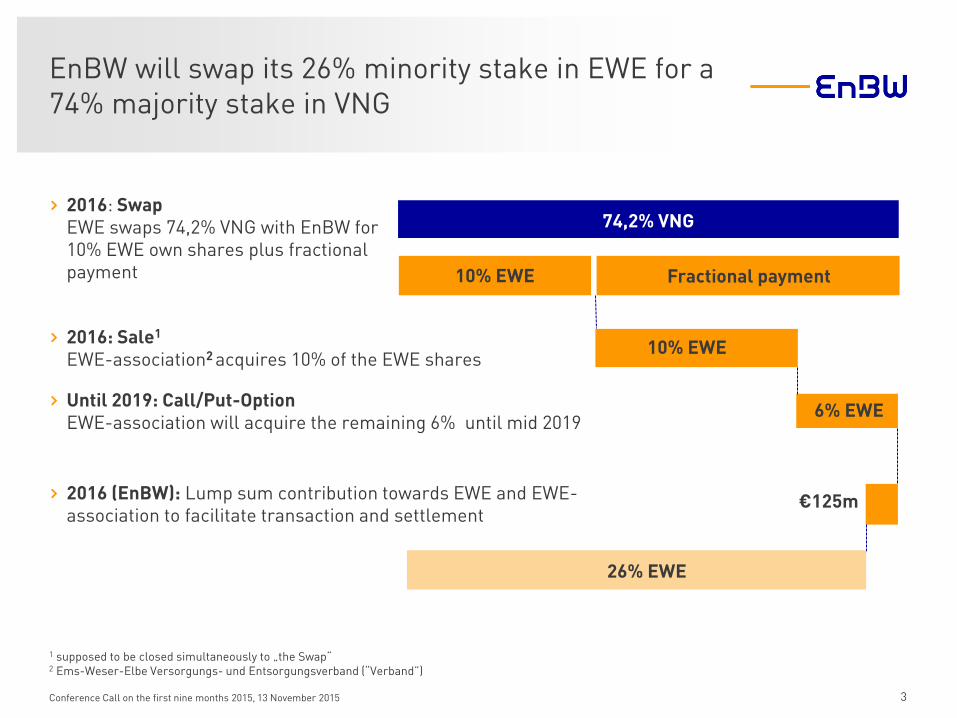
EnBW will swap its 26% minority stake in EWE for a 74% majority stake in VNG
3
74,2% VNG
10% EWE
10% EWE
6% EWE › Until 2019: Call/Put-Option
EWE-association will acquire the remaining 6% until mid 2019
› 2016: Swap EWE swaps 74,2% VNG with EnBW for 10% EWE own shares plus fractional payment
› 2016: Sale1 EWE-association2 acquires 10% of the EWE shares
€125m › 2016 (EnBW): Lump sum contribution towards EWE and EWE-association to facilitate transaction and settlement
26% EWE
1 supposed to be closed simultaneously to „the Swap“ 2 Ems-Weser-Elbe Versorgungs- und Entsorgungsverband (“Verband”)
Fractional payment
Conference Call on the first nine months 2015, 13 November 2015
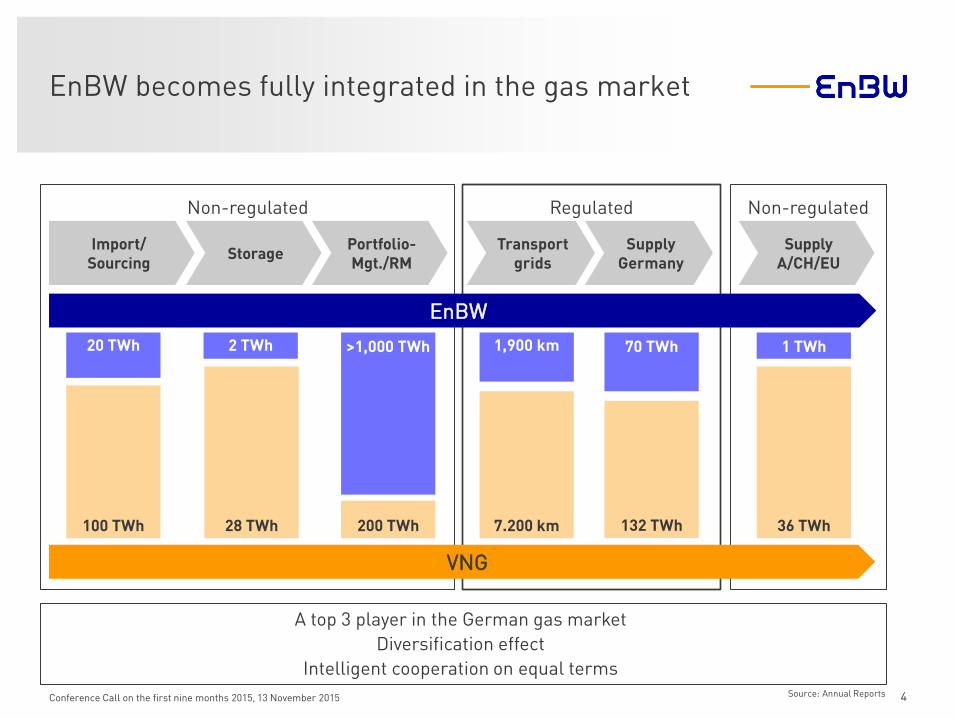
Non-regulated Regulated Non-regulated
70 TWh 1 TWh
4
20 TWh
› VNG
EnBW
2 TWh >1,000 TWh 1,900 km
36 TWh
Source: Annual Reports
Import/ Sourcing
Storage Portfolio-Mgt./RM
Supply A/CH/EU
EnBW becomes fully integrated in the gas market
A top 3 player in the German gas market
Diversification effect
Intelligent cooperation on equal terms
Conference Call on the first nine months 2015, 13 November 2015
132 TWh 100 TWh 28 TWh 200 TWh 7.200 km
Transport grids
Supply Germany
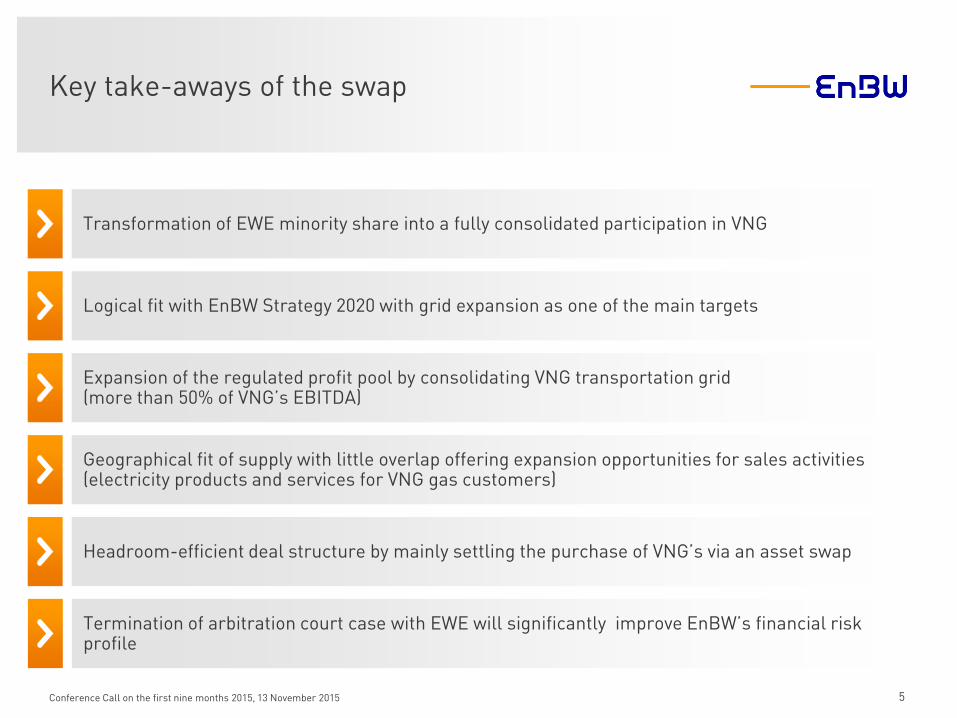
Key take-aways of the swap
5
Logical fit with EnBW Strategy 2020 with grid expansion as one of the main targets
Expansion of the regulated profit pool by consolidating VNG transportation grid (more than 50% of VNG’s EBITDA)
Transformation of EWE minority share into a fully consolidated participation in VNG
Geographical fit of supply with little overlap offering expansion opportunities for sales activities (electricity products and services for VNG gas customers)
Headroom-efficient deal structure by mainly settling the purchase of VNG’s via an asset swap
Termination of arbitration court case with EWE will significantly improve EnBW’s financial risk profile
Conference Call on the first nine months 2015, 13 November 2015
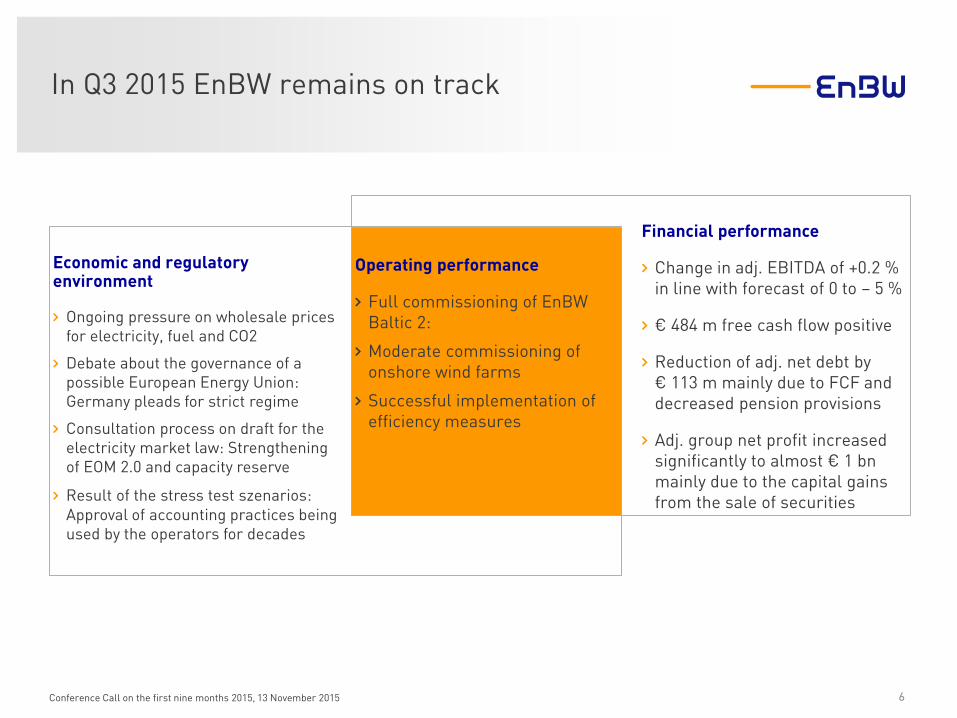
In Q3 2015 EnBW remains on track
6
Financial performance
› Change in adj. EBITDA of +0.2 %
in line with forecast of 0 to – 5 %
› € 484 m free cash flow positive
› Reduction of adj. net debt by
€ 113 m mainly due to FCF and
decreased pension provisions
› Adj. group net profit increased
significantly to almost € 1 bn
mainly due to the capital gains
from the sale of securities
Economic and regulatory environment
› Ongoing pressure on wholesale prices
for electricity, fuel and CO2
› Debate about the governance of a
possible European Energy Union:
Germany pleads for strict regime
› Consultation process on draft for the
electricity market law: Strengthening
of EOM 2.0 and capacity reserve
› Result of the stress test szenarios: Approval of accounting practices being
used by the operators for decades
Operating performance
› Full commissioning of EnBW
Baltic 2:
› Moderate commissioning of
onshore wind farms
› Successful implementation of
efficiency measures
Conference Call on the first nine months 2015, 13 November 2015
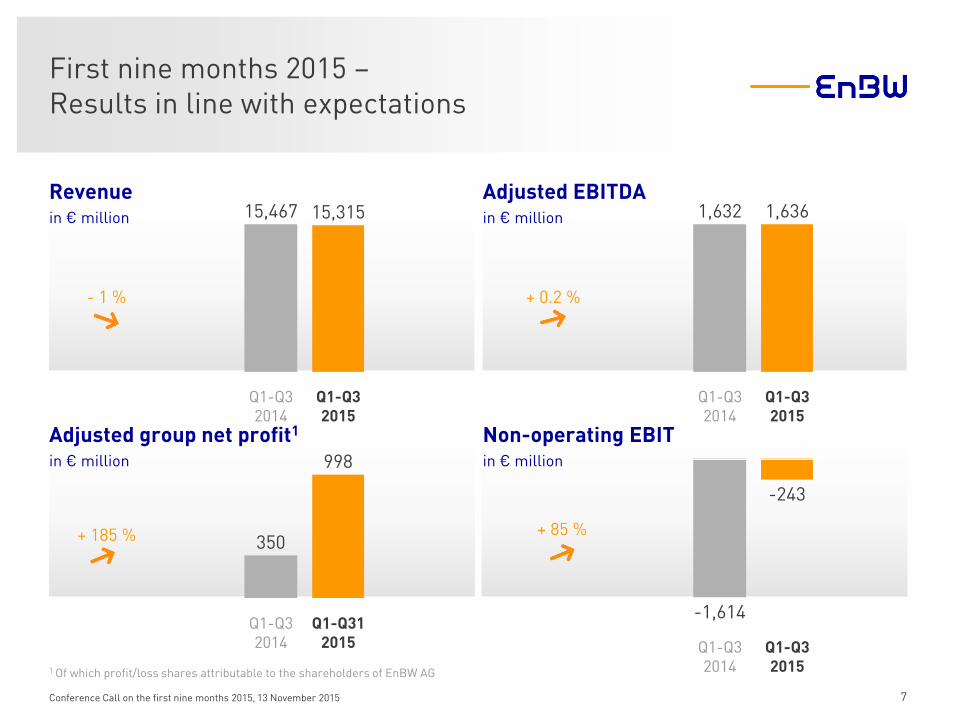
Non-operating EBIT
in € million
Revenue in € million
Adjusted EBITDA
in € million
Adjusted group net profit1
in € million
1 Of which profit/loss shares attributable to the shareholders of EnBW AG
479 + 185 %
- 1 %
+ 85 %
Q1-Q3 2015
15,467
Q1-Q3 2014
15,315
Q1-Q3 2014
Q1-Q3 2015
1,636 1,632
Q1-Q3 2015
Q1-Q3 2014
-1,614
-243
Q1-Q3 2014
Q1-Q31 2015
350
998
7
First nine months 2015 – Results in line with expectations
+ 0.2 %
Conference Call on the first nine months 2015, 13 November 2015

Electricity sales in TWh
Gas Sales
in TWh
Adjusted EBITDA
in € million
Sales – Profitability increase due to higher gas sales
› Weather-related higher gas sales and adjusted EBITDA
› Ongoing optimisation in the area of sales
› Investments: € 27.7 m, significantly below prior-year level (€ 242.4 m due to the acquisition of the 50 % share of EnBW Gas Verwaltungsgesellschaft mbH)
Key messages
+ 5.2 %
Q1-Q3 2015
Q1-Q3 2014
227 238
B2B
B2C
Q1-Q3 2015
34.7
23.5
11.2
Q1-Q3 2014
35.0
23.6
11.4
- 0.9 % + 26 % B2B
B2C
Q1-Q3 2015
48.9 6.9
54.9
Q1-Q3 2014
61.8
5.5
43.4
8 Conference Call on the first nine months 2015, 13 November 2015
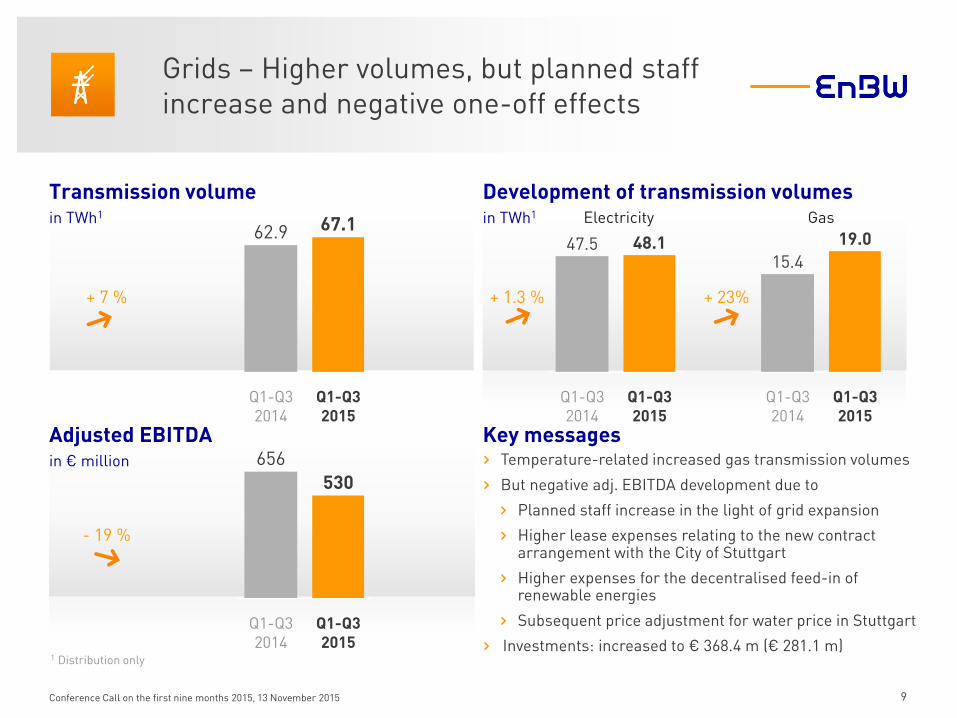
Transmission volume in TWh1
Development of transmission volumes
in TWh1
Adjusted EBITDA
in € million
1 Distribution only
Grids – Higher volumes, but planned staff increase and negative one-off effects
Electricity Gas
› Temperature-related increased gas transmission volumes
› But negative adj. EBITDA development due to
› Planned staff increase in the light of grid expansion
› Higher lease expenses relating to the new contract arrangement with the City of Stuttgart
› Higher expenses for the decentralised feed-in of renewable energies
› Subsequent price adjustment for water price in Stuttgart
› Investments: increased to € 368.4 m (€ 281.1 m)
Key messages
+ 7 %
- 19 %
+ 1.3 % + 23%
Q1-Q3 2015
67.1
Q1-Q3 2014
62.9
Q1-Q3 2015
530
Q1-Q3 2014
656
Q1-Q3 2015
48.1
Q1-Q3 2014
47.5
Q1-Q3 2015
19.0
Q1-Q3 2014
15.4
9 Conference Call on the first nine months 2015, 13 November 2015

Generation volume in TWh1
Adjusted EBITDA
in € million
1 Includes long-term procurement agreements and generation from partly owned power stations; the figures indicated are taken from the segments; segment excludes generation from pump storage plants that is associated in the generation and trading segment
Renewable energies – Slight increase in profitability mainly due to Baltic 2
› Increased adjusted EBITDA due to
› Full commissioning of offshore wind farm Baltic 2 end of September
› Moderate commissioning of onshore wind farms
› But negative earnings impacts on account of unfavourable development of the run-of-river power plants due to lower electricity prices
› Investments of € 325.4 m, below prior-year level (€ 368.1 m)
Key messages
+ 7 %
+ 9 %
Q1-Q3 2015
5.1
Q1-Q3 2014
4.7
156
Q1-Q3 2014
146
Q1-Q3 2015
10
Development of renewables generation mix
in TWh1
0.7
Q1-Q3 2015
4.2
5.1
Q1-Q3 2014
4.7
Wind
Other
Run-of-river
0.4
4.0 + 9 %
Conference Call on the first nine months 2015, 13 November 2015

1 Includes long-term procurement agreements and generation from partly owned power stations; the figures indicated are taken from the segments 2 Segment includes pump storage plants
Generation & Trading – Increased profitability due to efficiency and one-off effects
› Decreasing electricity prices and spreads on wholesale market temporarily overcompensated by
› Positive temporarily effect due to different revision dates in 2014 and 2015
› Measures to increase efficiency
› Reimbursement of cost due to Ordinance on Reserve Power Plants
› Investments: €125.6 m (Q3 2014: € 377.5 m)
Conventional & nuclear generation volume in TWh1,2
Development of fossil generation mix
in TWh1,2
Adjusted EBITDA
in € million
Key messages
+ 0.5 %
+ 9 %
36.8
Q1-Q3 2014
Q1-Q3 2015
37.0
Q1-Q3 2015
671 616
Q1-Q3 2014
10.8
Lignite
Nuclear
Other²
Hard coal
Q1-Q3 2015
37.0
4.1
19.3
2.8
Q1-Q3 2014
36.8
4.7
18.3
2.5
11.3
+ 0.5 %
11 Conference Call on the first nine months 2015, 13 November 2015
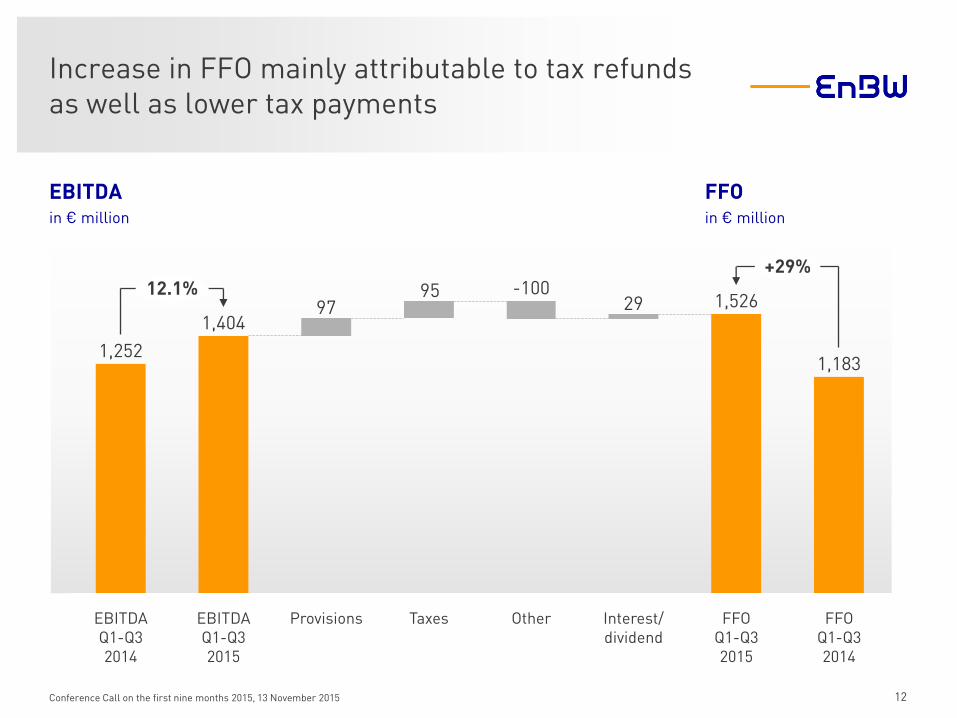
Increase in FFO mainly attributable to tax refunds as well as lower tax payments
EBITDA
in € million
FFO
in € million
12
2995
97
Other
-100 12.1%
FFO Q1-Q3 2014
Interest/ dividend
+29%
1,526
1,183
FFO Q1-Q3 2015
Taxes Provisions EBITDA Q1-Q3 2015
1,404
EBITDA Q1-Q3 2014
1,252
Conference Call on the first nine months 2015, 13 November 2015

Adjusted net debt reduction mainly due to RCF and decreased NPV of pension provisions
Adjusted Net Debt
in € million
89266736
323
Net investments, acquisitions, divestitures
Working capital
FFO
-1,526
December 2014
7,983
September 2015
7,871
Non-cash payment effects
-1%
Dividends paid
13 Conference Call on the first nine months 2015, 13 November 2015

Group adj. EBITDA outlook 2015 remains unchanged, improved dynamic leverage ratio expected
Adjusted EBITDA
1 In comparison with adjusted EBITDA 2014
2014 Outlook 2015 Q3 20151
Group € 2,167 million 0 to -5 %
Sales € 231 million 10 to 20 %
Grids € 886 million -10 to -20 %
Renewable Energies € 191 million >20 %
Generation and Trading € 900 million -15 to -25 %
14 Conference Call on the first nine months 2015, 13 November 2015
IR 2014: 0 to -10%
Dynamic leverage ratio 2014 Outlook 2015 Q3 2015
Group 3.68 3.0 – 3.4 IR 2014: 3.2–3.6
Q1 2015: 3.6–4.0
Questions & Answers »
15 Conference Call on the first nine months 2015, 13 November 2015

Non-operating result
Q1-Q3 2015 Q1-Q3 2014
Income/expenses relating to nuclear power 26.8 – 67.5
Disposal gains/losses 25.0 42.3
Addition to the provision for onerous contracts relating to electricity procurement agreements
-214.7 -345.9
Earnings on write-ups 34.7 0.9
Other non-operating result -103.9 -10.4
Non-operating EBITDA -232.1 -380.6
Impairment losses -11.1 -1,233.8
Non-operating EBIT -243.2 -1,614.4
Non-operating investment result -17.5 -3.2
Non-operating financial result -95.8 0.1
Non-operating income taxes 70.1 468.1
Non-operating group net profit/loss -286.4 -1,149.4
of which profit/loss shares attributable to non-controlling interests (0.9) (-28.4)
of which profit/loss shares attributable to the equity holders of EnBW AG (-287.3) (-1,121.0)
Non-operating result
in € million
16 Conference Call on the first nine months 2015, 13 November 2015
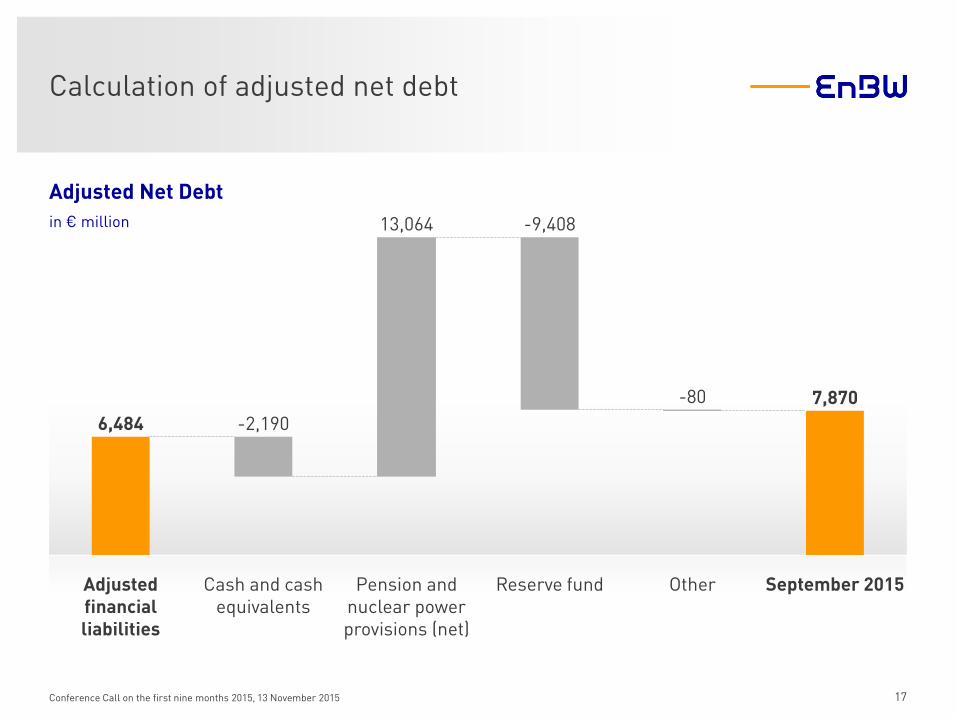
Calculation of adjusted net debt
Adjusted Net Debt
in € million
17
-2,190
Adjusted financial liabilities
6,484
-80 7,870
September 2015 Other Reserve fund
-9,408
Pension and nuclear power provisions (net)
13,064
Cash and cash equivalents
Conference Call on the first nine months 2015, 13 November 2015
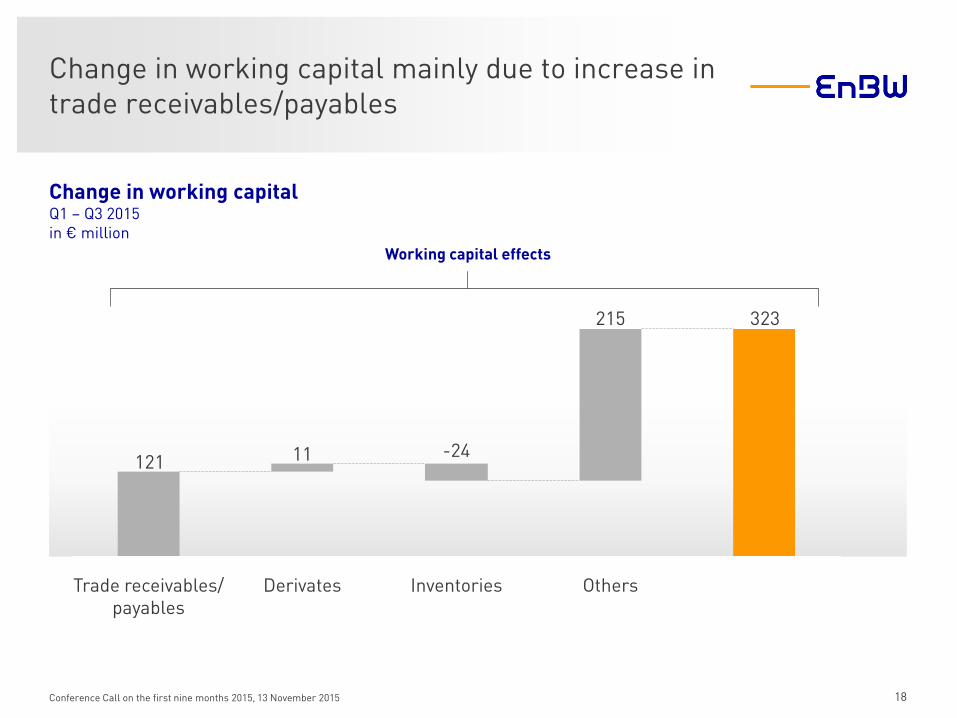
Change in working capital mainly due to increase in trade receivables/payables
Working capital effects
Change in working capital
Q1 – Q3 2015 in € million
18
323215
11121
Inventories
-24
Derivates Trade receivables/ payables
Others
Conference Call on the first nine months 2015, 13 November 2015
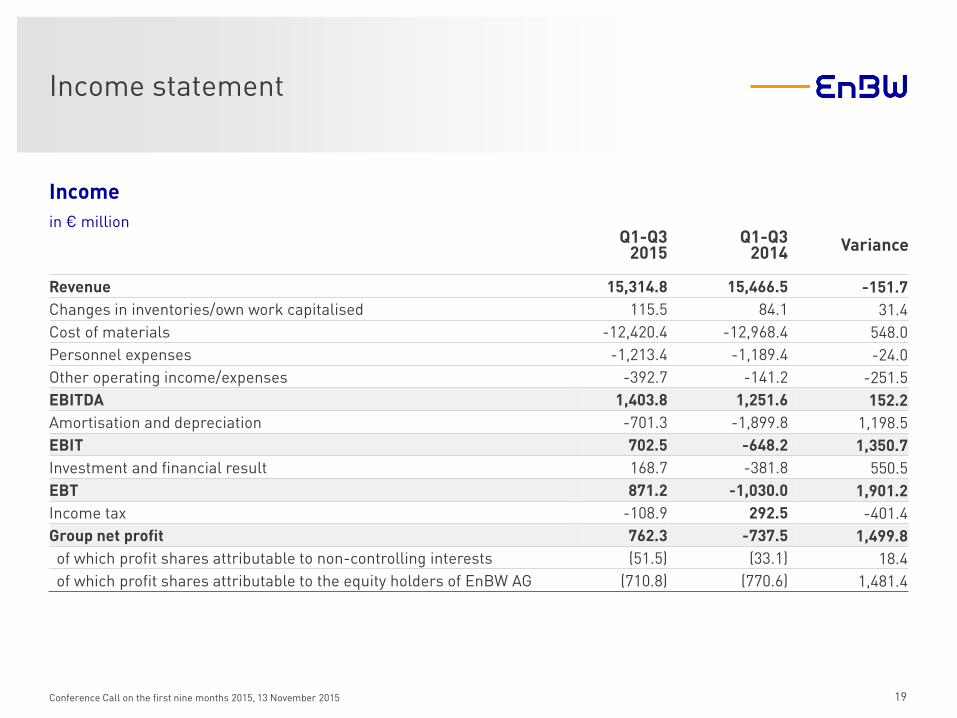
Income statement
Q1-Q3 2015
Q1-Q3 2014 Variance
Revenue 15,314.8 15,466.5 -151.7
Changes in inventories/own work capitalised 115.5 84.1 31.4
Cost of materials -12,420.4 -12,968.4 548.0
Personnel expenses -1,213.4 -1,189.4 -24.0
Other operating income/expenses -392.7 -141.2 -251.5
EBITDA 1,403.8 1,251.6 152.2
Amortisation and depreciation -701.3 -1,899.8 1,198.5
EBIT 702.5 -648.2 1,350.7
Investment and financial result 168.7 -381.8 550.5
EBT 871.2 -1,030.0 1,901.2
Income tax -108.9 292.5 -401.4
Group net profit 762.3 -737.5 1,499.8
of which profit shares attributable to non-controlling interests (51.5) (33.1) 18.4
of which profit shares attributable to the equity holders of EnBW AG (710.8) (770.6) 1,481.4
Income
in € million
19 Conference Call on the first nine months 2015, 13 November 2015
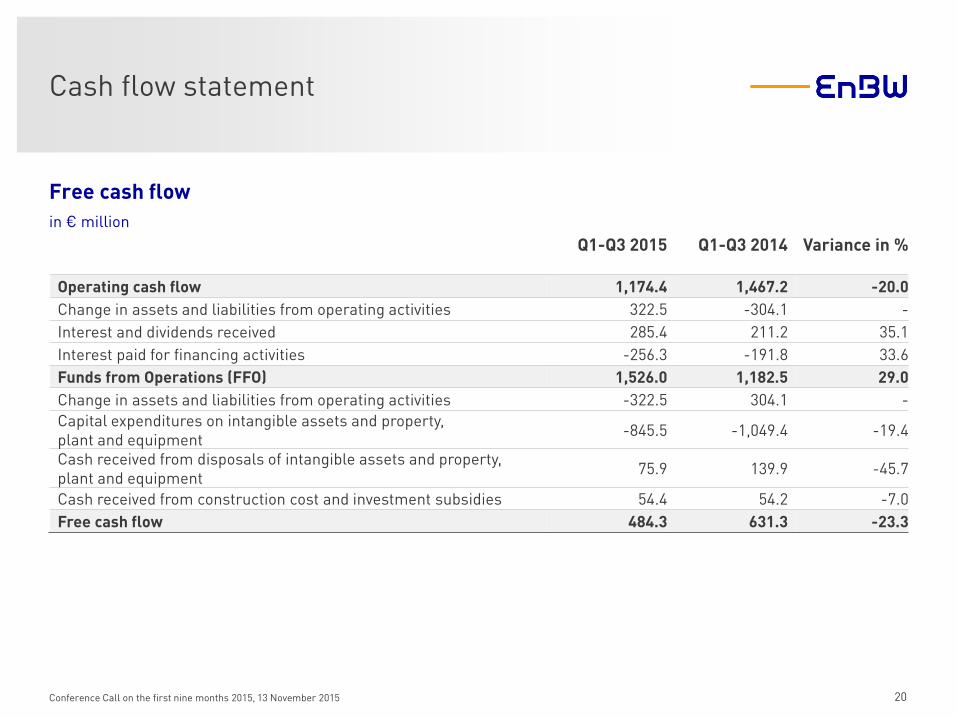
Cash flow statement
Q1-Q3 2015 Q1-Q3 2014 Variance in %
Operating cash flow 1,174.4 1,467.2 -20.0
Change in assets and liabilities from operating activities 322.5 -304.1 -
Interest and dividends received 285.4 211.2 35.1
Interest paid for financing activities -256.3 -191.8 33.6
Funds from Operations (FFO) 1,526.0 1,182.5 29.0
Change in assets and liabilities from operating activities -322.5 304.1 -
Capital expenditures on intangible assets and property, plant and equipment
-845.5 -1,049.4 -19.4
Cash received from disposals of intangible assets and property, plant and equipment
75.9 139.9 -45.7
Cash received from construction cost and investment subsidies 54.4 54.2 -7.0
Free cash flow 484.3 631.3 -23.3
Free cash flow
in € million
20 Conference Call on the first nine months 2015, 13 November 2015
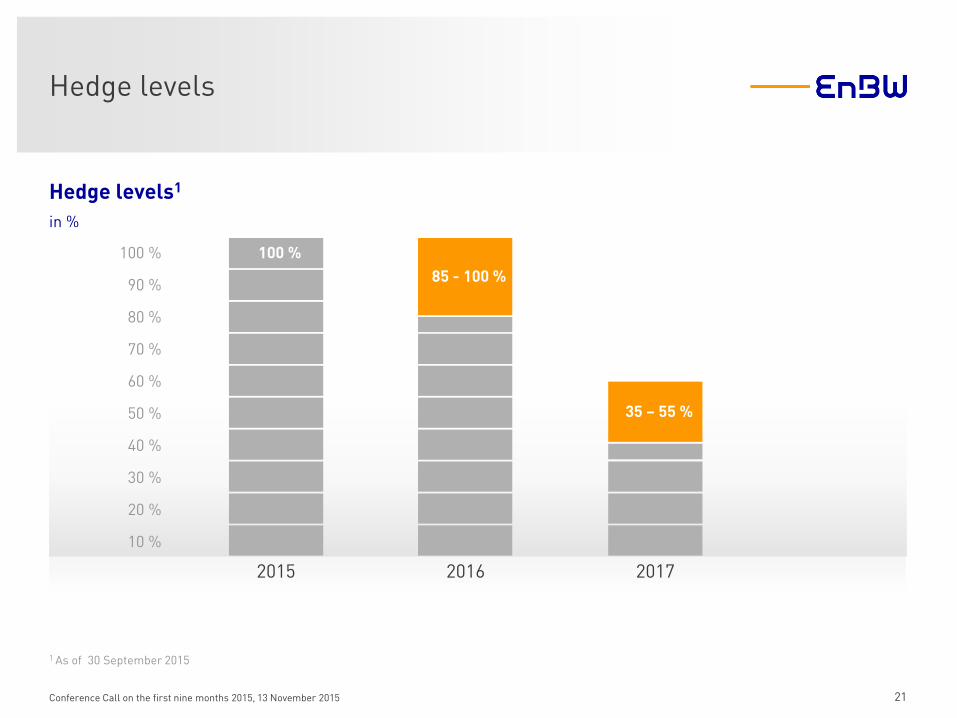
1 As of 30 September 2015
Hedge levels
10 %
20 %
30 %
40 %
50 %
60 %
70 %
80 %
90 %
100 %
2015
100 %
2016 2017
85 - 100 %
Hedge levels1
in %
35 – 55 %
21 Conference Call on the first nine months 2015, 13 November 2015
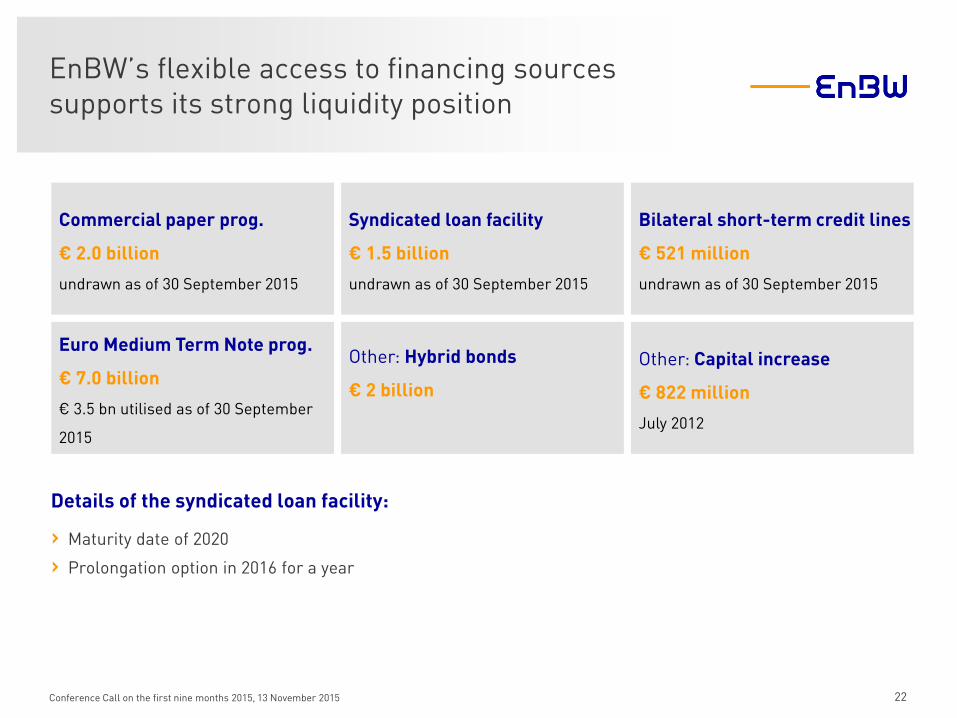
EnBW’s flexible access to financing sources supports its strong liquidity position
Commercial paper prog.
€ 2.0 billion
undrawn as of 30 September 2015
Details of the syndicated loan facility:
› Maturity date of 2020
› Prolongation option in 2016 for a year
Syndicated loan facility
€ 1.5 billion
undrawn as of 30 September 2015
Bilateral short-term credit lines
€ 521 million
undrawn as of 30 September 2015
Euro Medium Term Note prog.
€ 7.0 billion
€ 3.5 bn utilised as of 30 September
2015
Other: Hybrid bonds
€ 2 billion
Other: Capital increase
€ 822 million
July 2012
22 Conference Call on the first nine months 2015, 13 November 2015
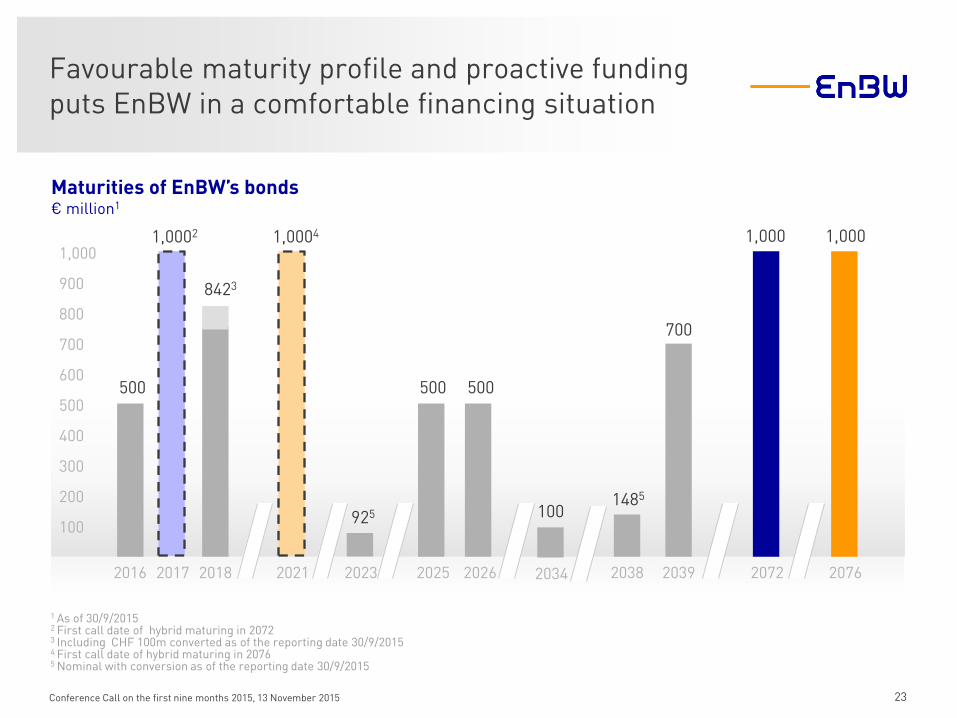
Favourable maturity profile and proactive funding puts EnBW in a comfortable financing situation
23 Conference Call on the first nine months 2015, 13 November 2015
1 As of 30/9/2015 2 First call date of hybrid maturing in 2072 3 Including CHF 100m converted as of the reporting date 30/9/2015 4 First call date of hybrid maturing in 2076 5 Nominal with conversion as of the reporting date 30/9/2015
Maturities of EnBW’s bonds € million1
100
200
300
400
500
600
700
800
900
1,000
500
2016
1,0002
2017
8423
2018
925
2023 2025
1485
2038
700
2039
1,000
2072
500
1,0004
2021 2076
1,000
2026
500
100
2034
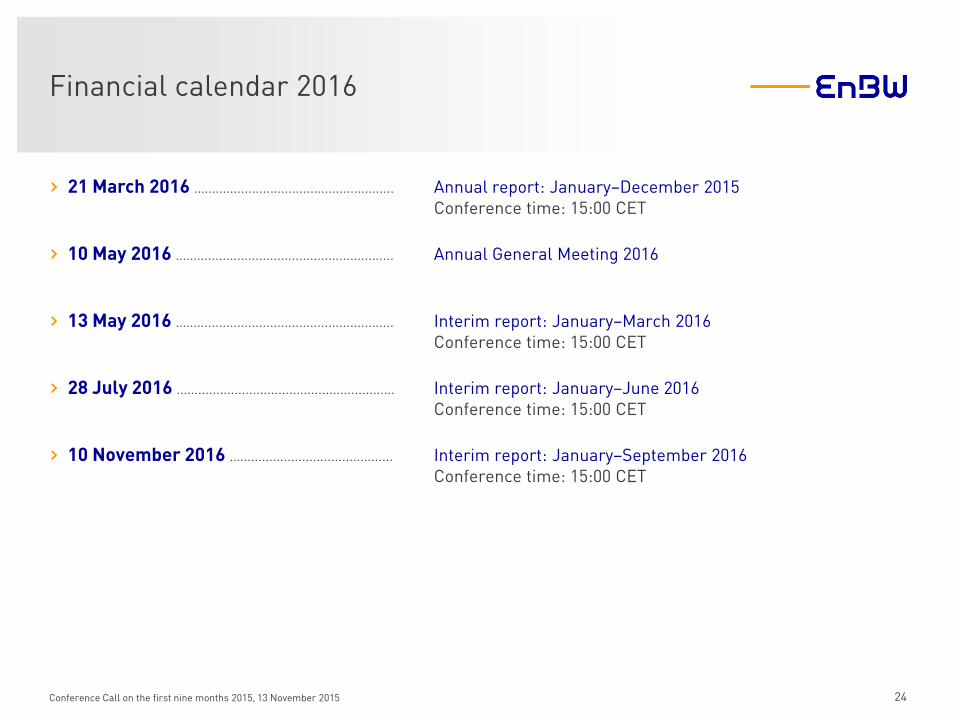
Financial calendar 2016
24
› 21 March 2016 ....................................................... Annual report: January–December 2015 Conference time: 15:00 CET
› 10 May 2016 ............................................................ Annual General Meeting 2016
› 13 May 2016 ............................................................ Interim report: January–March 2016 Conference time: 15:00 CET
› 28 July 2016 ............................................................ Interim report: January–June 2016 Conference time: 15:00 CET
› 10 November 2016 ............................................. Interim report: January–September 2016 Conference time: 15:00 CET
Conference Call on the first nine months 2015, 13 November 2015

EnBW IR contacts
› Ingo Peter Voigt Senior Vice President Head of Finance, M&A and Investor Relations
› Julia v. Wietersheim Senior Manager Investor Relations
› Julia Reinhardt Manager Investor Relations
T +49 721-6314375 [email protected]
T +49 721-6312060 [email protected]
T +49 721 - 6312697 [email protected]
25 Conference Call on the first nine months 2015, 13 November 2015