conference paper investigation on the qoe and packet loss
TRANSCRIPT

American Journal of Data Mining and Knowledge Discovery 2017; 2(1): 15-30 http://www.sciencepublishinggroup.com/j/ajdmkd doi: 10.11648/j.ajdmkd.20170201.13
Conference Paper
Investigation on the QOE and Packet Loss Rate of the IOT Network
Yibin Hou*, Jin Wang
*
School of Software Engineering, Department of Information, Beijing University of Technology, Beijing, China
Email address:
*Corresponding author
To cite this article: Yibin Hou, Jin Wang. Investigation on the QOE and Packet Loss Rate of the IOT Network. American Journal of Data Mining and Knowledge
Discovery. Vol. 2, No. 1, 2017, pp. 15-30. doi: 10.11648/j.ajdmkd.20170201.13
Received: December 22, 2016; Accepted: January 6, 2017; Published: February 4, 2017
Abstract: The Internet of things, including Internet technology, including wired and wireless networks. In this paper, we
investigate on the QOE and packet loss rate of the network because QOE is important in the network and packet loss rate is the
key point in many papers. In order to study the influence of packet loss on the users’ quality of experience QoE and establish the
Mapping model of the two when the video transmit in the network, building a NS2+ MyEvalvid simulation platform, by the
method of modifying QoS parameters to simulate different degrees of packet loss, focus on the influence of packet loss on QoE
and establish the mapping model between them. Experimental results show that, packet loss has an significant influence on
Quality of experience. Packet loss rate and the Quality of experience presents a nonlinear relationship, and use matlab to establish
the mapping model, this model’s accuracy is high, easy to operate, can real-time detect packet loss has influences on the user’s
quality of experience (QoE).
Keywords: Packet Loss Rate, Influence, Quality of Experience, Mapping Model
1. Introduction
At present, the development of international information
prompted the international people's exchanges widely,
network video business is increasing. In the information
industry, network video business has become the most popular
application of computer network field, from the international
and domestic exchanges to life and entertainment, video
penetrated into every aspect of our lives.
But the network itself is not perfect, in essence is a kind of
distortion network. Therefore, causes the academia and industry
professionals think that, what causes the decrease of the quality
of the video and how to evaluate the quality of the network video.
So, we set up the video quality assessment model to evaluate the
quality of video. Network TCP/ IP protocol itself is only a best
effort protocol [1], in this service model, all the business flows
fair competition to network resources, can not meet the
bandwidth, delay, jitter and other special requirements of the new
application. These new applications contributed to QoS (Quality
of Service, QoS) concept appears. In addition, QoS and
man-made factors together determine the user’s Quality of
Experience (Quality of Experience, QoE) [2]. Network video
distortion will seriously affect the user’s Quality of experience
QoE. Therefore, in order to meet the needs of the user’s Quality
of experience, needs establish a optimization model of the video
quality evaluation. In QoE evaluation methods the subjective
method is very difficult to operate, therefore, the objective
evaluation method of QoE is namely make the packet loss rate
which is obtained by measuring mapped into QoE is a new
method. Through in-depth analysis of network video distortion,
we can know the major form of network video transmission
distortion is delay, packet loss and jitter. Among them, delay
almost has no effect on the quality of the video, and the effect
caused by the network jitter is packet loss, so unified used the
packet loss rate to measure the performance of the influence on
the users’ Quality of experience. Therefore, we study the
influence of packet loss on QoE and establish the Mapping model
of packet loss rate and the Quality of experience.

16 Yibin Hou and Jin Wang: Investigation on the QOE and Packet Loss Rate of the IOT Network
2. Method
2.1. Related Work
Reference [3] presented a set of video evaluation
framework EvalVid based on PSNR value through coding,
transmission, repair, comparative evaluation module to source
video to realize the video transmission and evaluate the whole
process of simulation. Reference [4] successfully apply
Evalvid framework to NS2. Implements the simulation of
video transmission process, but there is no in-depth analysis of
packet loss effects on QoE. Reference [5, 6, 7] shows in H.264
video distinguishes the I, P, B frames’ priority and improve the
quality of the video, but there is no in-depth analysis of each
frame’s influence on the users’ Quality of experience.
Reference [8] conclued that affecting MPEG2 video quality’s
main factors are coding rate and packet loss and so on, but
there is no mapping model of packet loss rate and the Quality
of experience. Reference [9] choose MPEG4, H. 264, H.263
three kinds of video format analysis of different packet loss
location has influences on QoE in Evalvid framework.
Reference [10] in order to support large-scale deployment,
improve the accuracy and feasibility, establish a evaluation
model of packet loss and the distortion video. Reference [11]
shows that due to video packet loss in the process of
grouping,QoE and QoS (quality of experience/ quality of
service) services can strong degradation. It is verified that a
single I frame packet loss resulting video impairment, and
significantly reduce the video quality. Reference [12] in order
to illustrate packet loss on the quality of the video, designs a
real-time packet analysis system to monitor packets lost.
Reference [13] puts forward packet loss information including
different kinds of frames, different locations of image and
different distribution and focus on the distribution of the
packet loss, under the different distributions of packet loss, the
same packet loss rate will leads to a MOS flow. Reference [14]
in order to explain the video stream’s user’s quality of
experience how to change and how the QoS parameters
fluctuations, packet loss as one QoS parameter, puts forward a
general quantitative relationship between video streaming
QoE and a QoS parameter (packet loss). Reference [15]
introduces under different packet loss models obtains the high
definition video flow quality of experience evaluation model,
goal is to achieve using SSIM video quality measurement,
time sharing technology and content characteristics. It is
common, has high correlation with the subjective results, and
this model has been used in the quality of experience (QoE)
domain. Reference [16] introduces a model to illustrate the
QoS parameters have influences on the user’s perceived video
quality, analysis of the MPEG-4 video transmission QoS
parameters under various network configurations, obtains the
QoS parameters how to affect the user’s perceived video
quality. Reference [17, 18] puts forward that affecting the
video quality’s main network QoS parameters delay and jitter
are characterized by packet loss, therefore, adopts packet loss
rate for a unified measure of the quality of the video,
combined with the human visual characteristics, proposes a
real-time video quality assessment model based on network
packet loss. Reference [19] describes the factors affecting
QoE include the perception the user 's emotional state to the
video, also include packet loss. Therefore, in order to be able
to accurately assess the user’s quality of experience. Focusing
on study the influence of packet loss on the user’s quality of
experience and establish the mapping model of packet loss
rate and the user’s quality of experience.
In general, research on packet loss mainly concentrated on
the influence of packet loss on the user’s quality of experience
and quality of service, the main field is in the codec and
transmission field, and consider the single frame such as
I-frame’s effect are the most, few consider the packet loss
concentration and different distribution of packet loss on the
video’s quality, lack of research on combine packet loss rate
and other indicators to assess the impact of data loss on QoE,
for each frame of packet loss on the quality of the video’s
study also not many. In early days focused on the assessment
of full reference considering packet loss, later consider
starting involved packet loss of no-reference assessment
method. The beginning of the study without considering the
packet loss characteristics, later began to study the
no-reference assessment method. Study on the mapping
model of packet loss rate and the Quality of experience on the
influence of packet loss on QoE is mainly for give the majority
of the users bring good visual experience, for optimization of
digital video assessment system, communication quality
monitoring, provide theory, technology and method of support
for the area of consumer media grading.
2.2. Influences of Packet Loss on Qoe
First of all, the cause of focus on packet loss is through
in-depth analysis of distortion network, we know that the main
form of network video transmission distortion are delay,
packet loss and jitter. Among them, delay has little effect on
the quality of the video, while network jitter causes the effect
of network packet loss, so unified used the packet loss rate to
measure the performance of the network. Secondly, the
definition of the user’s quality of experience is in the certain
objective environment users’ overall approval degree of the
use of services or business is the user’s quality of experience.
Influence factors of QoE are mainly QoS and human factors.
The quantization methods of QoE mainly includes MOS
method, paired comparison method, two categories method
and PSNR method. This part mainly uses the MOS method
and PSNR method, and the two methods are compared. At last,
this part is mainly based on use MPEG4 encoder to study the
influence of packet loss on QoE, mainly study whether there is
a significant influence on packet loss and to what extent. At
present what is widely used is MOS method which is
recommend by the International Telecommunication Union
ITU. This is a kind of order quantity expression which QoE
subjective feeling can be divided into 5 levels and a detailed
description of the user's subjective feeling. The following are
shown in table 1 [20]. PSNR and MOS corresponding relation
are shown in table 2 below [21].
American Journal of Data Mining and Knowledge Discovery 2017; 2(1): 15-30 17
Table 1. MOS method.
MOS QoE Impairment
5 Excellent imperceptible
4 Good Perceptible, not annoying
3 Fair Slightly annoying
2 Poor Annoying
1 Bad Very annoying
Table 2. PSNR to MOS.
PSNR MOS
>37 5
31-37 4
25-31 3
20-25 2
<20 1
2.2.1. Experimental Environment
Because in the real network, unable to quantify to simulate
the network with different degree of damage. Therefore,
network simulation environment is built on cygwin+ NS2 at
windows, through the method of changing QoS parameters to
simulate different levels of network damage. Then NS2 and
Evalvid integration MyEvalvid. The MyEvalvid through the
myEvalvid, my_UDP, my_Evalvid_Sink three interface
programs to communicate with NS2, NS2 simulation network
can simulate the OSI seven layers architecture, introduced as
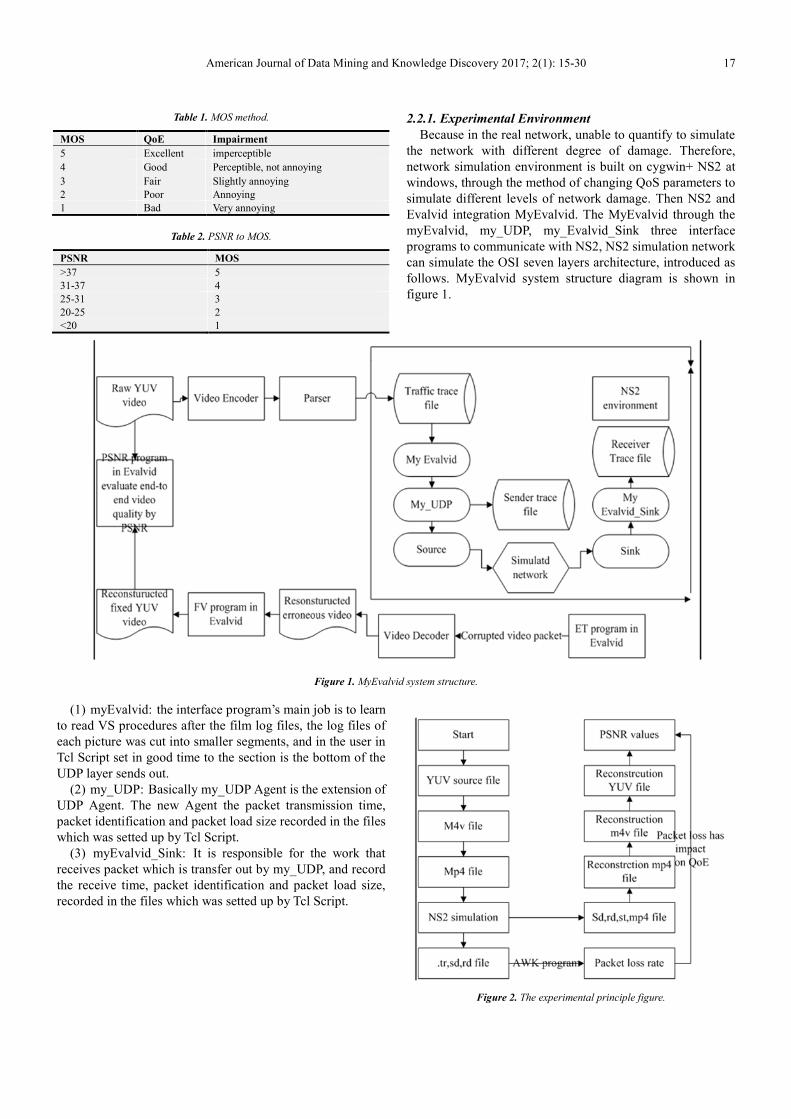
follows. MyEvalvid system structure diagram is shown in
figure 1.
Figure 1. MyEvalvid system structure.
(1) myEvalvid: the interface program’s main job is to learn
to read VS procedures after the film log files, the log files of
each picture was cut into smaller segments, and in the user in
Tcl Script set in good time to the section is the bottom of the
UDP layer sends out.
(2) my_UDP: Basically my_UDP Agent is the extension of
UDP Agent. The new Agent the packet transmission time,
packet identification and packet load size recorded in the files
which was setted up by Tcl Script.
(3) myEvalvid_Sink: It is responsible for the work that
receives packet which is transfer out by my_UDP, and record
the receive time, packet identification and packet load size,
recorded in the files which was setted up by Tcl Script.
Figure 2. The experimental principle figure.

18 Yibin Hou and Jin Wang: Investigation on the QOE and Packet Loss Rate of the IOT Network
The experimental principle figure as shown in figure 2,
focusing on the influences of packet loss on QoE, and with
AWK analysis of experimental results, in order to get the
packet loss rate.
2.2.2. Pre-experiments
(1) Explore the different packet loss rate has an effect on
QoE Do pre-experiments using football. yuv video, assuming
concluded that different packet loss rate has impact on QoE.
Use psnr calculate the psnr value of each frame of the video
after reconstruction. As shown in Figure 3.
Figure 3. Psnr value of each frame of the video after reconstruction.
Using YUV viewer to view the source files and rebuild files’ 6 frame. YUV viewer as shown in figure 5. The 6th frame PSNR
value is 23.56. As shown in figure 4.
Figure 4. The source files and rebuild files’ 6 frame.
Figure 5. YUV viewer.
Using YUV viewer to view the source files and rebuild files’ 43 frame. The 43th frame PSNR value is 34.98. As shown in
figure 6.

American Journal of Data Mining and Knowledge Discovery 2017; 2(1): 15-30 19
Figure 6. The source and rebuild files’ 43 frame.
From the comparison of image frames 6 and 43, we can find
that the 6th frame distortion is more serious. This is because in
the process of network transmission, different picture have
different packet loss rate. Thus, different packet loss rate has a
great influence on the quality of video transmission, thus
affecting the quality of experience QoE. That is the assume is
right.
(2) The influence of different factors on QoE Through many experiments on football. yuv and
forman_qcif. yuv and mother-daughter. yuv, the use of
quantitative parameters Q is larger, the users’ quality of
experience will be getting worse. When the packet length is
longer and Gop length is shorter, the packet loss rate is small,
the users’ quality of experience will be more high. In a certain
range, duplex and simplex link speed is greater, the packet loss
rate is small, the users’ quality of experience is better.
Contrast table 3 and table 4, can find Foreman_qcif. yuv
PSNR values change is larger than Football. yuv, contrast
table 4 and table 5 can find Foreman_qcif. yuv PSNR values
change is larger than mother-daughter_qcif. yuv, that is the
more complex video content motion is, the large sensitivity of
the quantitative parameters. And in the same experimental
conditions, obtain the Foreman_qcif. yuv PSNR values are
most bigger than Football. yuv PSNR values, as a result, the
more complex video content motion is, the greater the time
complexity is,and it can hava masking effects on coding
distortion, so, the better the video quality is.
For football. yuv video (Strenuous exercise, the camera
translation and rotation), foreman_qcif.yuv video (Movement
direction, scene transitions) and mother-daughter.yuv video
(Slow motion, Stationary background) these three videos,
duplex link speed is 10 MB, simplex is 0.64 MB, packet size is
1024 KB, GOP is 9, quantitative parameters on the users’
quality of experience as shown in table3, table 4 and table 5.
Table 3 is football. yuv video’s quantitative parameters
changes, and table 4 is foreman_qcif. yuv video’s quantitative
parameters changes, and table 5 is mother-daughter. yuv
video’s quantitative parameters changes.
Table 3. football. yuv video.
Experiment video Quantitative avgpsnr
number parameters
1 FOOTBALL 31 26.017445
2 FOOTBALL 20 29.200301
3 FOOTBALL 10 31.500689
Table 4. Foreman_qcif. yuv video.
Experiment video Quantitative avgpsnr
number parameters
1 Foreman_qcif 31 26.828076
2 Foreman_qcif 20 28.818952
3 Foreman_qcif 10 32.275925
Table 5. Mother-daughter. yuv video.
Experiment video Quantitative avgpsnr
number parameters
1 mother-daughter 31 29.135065
2 mother-daughter 20 31.337936
3 mother-daughter 10 34.653800
2.2.3. Topology Description and HD Video Options
Default network includes wired and wireless environment,
but in the end, most adopted wired experimental environment,
and experimenting under the same topology structure, mainly
consider the principle of a single variable. Wired topology
structure consists of 4 nodes, between n0 and n1, n2 and n3 are
duplex links, link bandwidth is 10 MBPS, delay time is set to 1
ms. Between n1 and n2 is simplex link, the bandwidth is 640
KB, delay time is set to 1 ms. Simplex or duplex queue
management mechanism adopts DropTail, and the length of
queue is 50 packet size. Establish UDP Agent on n0, the
packet size is set to 1500 bytes, establish a NULL Agent on n3,
the packet size is set to 1500 bytes. The simulation time is 10s.
The wired experimental environment topology structure as
shown in figure 7. With the rapid development of wireless
applications, people look to the wireless network
communication. But wireless environment compared with
wired environment, usually has a high bit error rate, big time
delay, low bandwidth, channel asymmetry and frequent
mobile features. As a result, under the environment of wireless
network congestion can no longer be seen as the only reason
for the loss of data, there are a large number of datas are due to
the switch, channel fading, interference and so on to be
discarded, the packet loss due to wireless environment called
wireless packet loss. In a word, under the environment of the
wired, congestion loss is the only cause of the loss of data,
while in the wireless environment, congestion loss and
wireless loss both can cause data loss.
As a result, the study of the wireless network will be more

20 Yibin Hou and Jin Wang: Investigation on the QOE and Packet Loss Rate of the IOT Network
complicated than the wired network environment. Wireless
topology consists of 4 nodes, n0-n3 these four wireless nodes,
n0(200, 400), n1(200, 300), n2(400, 300), n3(400, 400). n0
settings for the mobile node, at the simulation time of 5s, from
the starting position at a speed of 5 m/s move to the ending
position (300, 400), then at the simulation time of 25s, to (200,
400), that is the starting position of n0. Establish udp1 Agent
on the n0 node, establish null1 Agent on the n3 node, then set
up online above. The simulation time is 50s. The wireless
experiment environment topology structure as shown in figure
8. The establishment of the topology structure is mainly by
writing TCL code, under wireless environment establish udp’s
TCL code as shown below:
set udp1 [new Agent/myUDP]
$ns attach-agent $n0 $udp1
$udp1 set_filename sd_a01
$udp1 set packetSize_ $packetSize
Figure 7. Wired topology.
Figure 8. Wireless topology.

American Journal of Data Mining and Knowledge Discovery 2017; 2(1): 15-30 21
Figure 9. Src13_hrc1_525. yuv.
Figure 10. Src22_hrc1_525. yuv.
We select the HD video sources to conduct the experiment,
HD video sources mainly have 525 series and 625 series.
These two sequences are both the video quality experts group
VQEG’s test sequence, 525 sequence containing ref and HRC
two series, 625 also includes ref and HRC two series. Ref is
the reference state sequence, each HRC is a defect of the
original reference sequence. Among them, the 525 sequence
frequency is 60HZ, The frame size is 1440 x 486 or 699840
bytes per frame, the 625 sequence frequency is 50HZ, the size
is 1440 * 576 or to say 829440 bytes per frame. YUV format is
4:2:2 format, a pixel are two bytes. Hd video is divided into
two kinds in total, a video is strenuous exercise, video’s
content complexity is high, another video is the scenery,
video’s content complexity is low. On the basis of fully
understand the HD video, select human strenuous exercise,
high content complexity video src13_hrc1_525. yuv and the
scenery, low content complexity src22_hrc1_525. yuv these
two videos. Two selected video src13 as shown in figure 9,
src22 as shown in figure 10. This selection is mainly in order
to choose the video with different content complexity,
facilitate through the contrast, judge different video content
complexity whether have influences on the user’s quality of
experience or not.
3. Result
3.1. The Simulation Experiment
In order to eventually establish a mapping model of packet
loss rate and QoE, need to understand the relationship between
y and x, x as the horizontal axis is the packet loss rate, y as the
vertical axis is PSNR values, finally uses matlab to make the
scatter plot of the relationship between the packet loss rate and
the PSNR values. Through the scatterplot, can find the scatter
distribution, and then to study the effect of packet loss on QoE
and lays the foundation for establishing a mapping model of
the packet loss rate and the PSNR values.
This experiment first using HD video src13_hrc1_525. yuv
and src22_hrc1_525. yuv using MPEG4 coding under the
environment of the wired. First of all, we assume that the
packet loss rate has no influences on user’s quality of
experience. Second, we assume that the video content
complexity has no influences on user’s quality of experience.
PSNR quantitative QoE method’s experimental results as
shown in figure 11 and figure 12. The fitting curves as shown
in figure 13 and figure 14. MOS value quantitative QoE
method’s experimental results are shown in figure 15 and 16.
The fitting curves as shown in figure 17 and 18.
Figure 11. Scatter plot of src13(PSNR).

22 Yibin Hou and Jin Wang: Investigation on the QOE and Packet Loss Rate of the IOT Network
Figure 12. Scatter plot of src22(PSNR).
Figure 13. Src13 fitting curve(PSNR).
Figure 14. Src22 fitting curve(PSNR).
Figure 15. Scatter plot of src13(MOS).
Figure 16. Scatter plot of src22(MOS).
Figure 17. Src13 fitting curve(MOS).
American Journal of Data Mining and Knowledge Discovery 2017; 2(1): 15-30 23
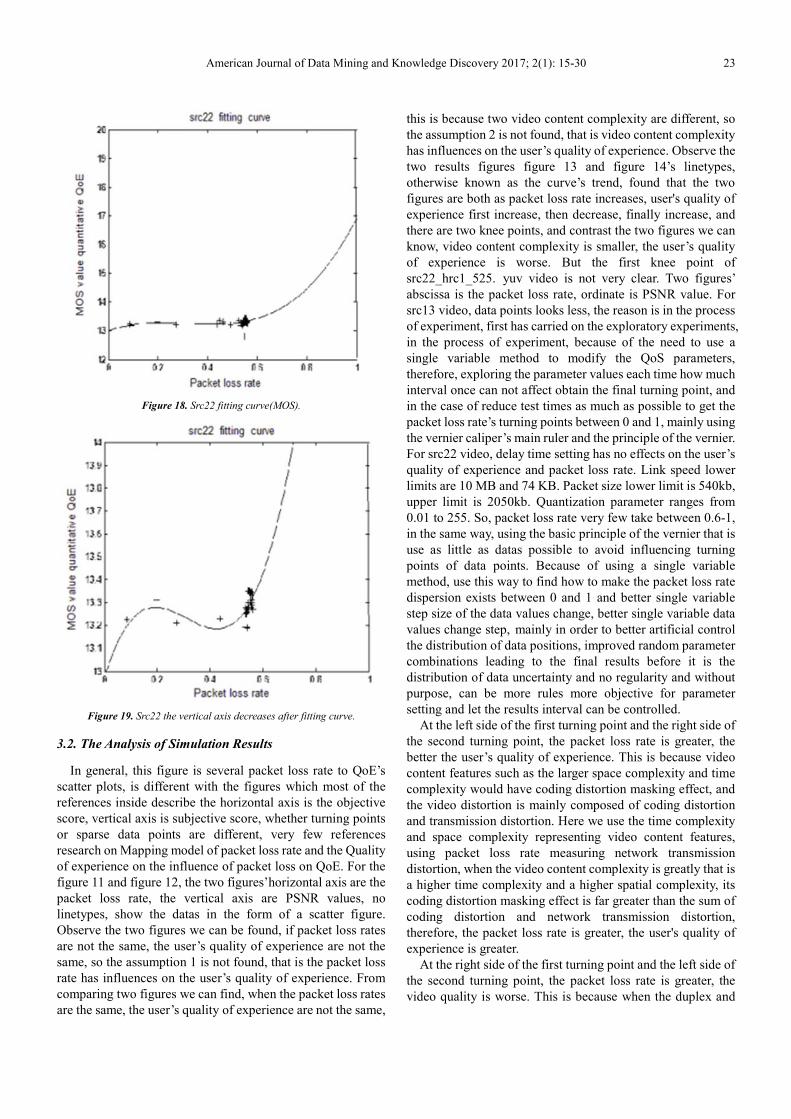
Figure 18. Src22 fitting curve(MOS).
Figure 19. Src22 the vertical axis decreases after fitting curve.
3.2. The Analysis of Simulation Results
In general, this figure is several packet loss rate to QoE’s
scatter plots, is different with the figures which most of the
references inside describe the horizontal axis is the objective
score, vertical axis is subjective score, whether turning points
or sparse data points are different, very few references
research on Mapping model of packet loss rate and the Quality
of experience on the influence of packet loss on QoE. For the
figure 11 and figure 12, the two figures’horizontal axis are the
packet loss rate, the vertical axis are PSNR values, no
linetypes, show the datas in the form of a scatter figure.
Observe the two figures we can be found, if packet loss rates
are not the same, the user’s quality of experience are not the
same, so the assumption 1 is not found, that is the packet loss
rate has influences on the user’s quality of experience. From
comparing two figures we can find, when the packet loss rates
are the same, the user’s quality of experience are not the same,
this is because two video content complexity are different, so
the assumption 2 is not found, that is video content complexity
has influences on the user’s quality of experience. Observe the
two results figures figure 13 and figure 14’s linetypes,
otherwise known as the curve’s trend, found that the two
figures are both as packet loss rate increases, user's quality of
experience first increase, then decrease, finally increase, and
there are two knee points, and contrast the two figures we can
know, video content complexity is smaller, the user’s quality
of experience is worse. But the first knee point of
src22_hrc1_525. yuv video is not very clear. Two figures’
abscissa is the packet loss rate, ordinate is PSNR value. For
src13 video, data points looks less, the reason is in the process
of experiment, first has carried on the exploratory experiments,
in the process of experiment, because of the need to use a
single variable method to modify the QoS parameters,
therefore, exploring the parameter values each time how much
interval once can not affect obtain the final turning point, and
in the case of reduce test times as much as possible to get the
packet loss rate’s turning points between 0 and 1, mainly using
the vernier caliper’s main ruler and the principle of the vernier.
For src22 video, delay time setting has no effects on the user’s
quality of experience and packet loss rate. Link speed lower
limits are 10 MB and 74 KB. Packet size lower limit is 540kb,
upper limit is 2050kb. Quantization parameter ranges from
0.01 to 255. So, packet loss rate very few take between 0.6-1,
in the same way, using the basic principle of the vernier that is
use as little as datas possible to avoid influencing turning
points of data points. Because of using a single variable
method, use this way to find how to make the packet loss rate
dispersion exists between 0 and 1 and better single variable
step size of the data values change, better single variable data
values change step, mainly in order to better artificial control
the distribution of data positions, improved random parameter
combinations leading to the final results before it is the
distribution of data uncertainty and no regularity and without
purpose, can be more rules more objective for parameter
setting and let the results interval can be controlled.
At the left side of the first turning point and the right side of
the second turning point, the packet loss rate is greater, the
better the user’s quality of experience. This is because video
content features such as the larger space complexity and time
complexity would have coding distortion masking effect, and
the video distortion is mainly composed of coding distortion
and transmission distortion. Here we use the time complexity
and space complexity representing video content features,
using packet loss rate measuring network transmission
distortion, when the video content complexity is greatly that is
a higher time complexity and a higher spatial complexity, its
coding distortion masking effect is far greater than the sum of
coding distortion and network transmission distortion,
therefore, the packet loss rate is greater, the user's quality of
experience is greater.
At the right side of the first turning point and the left side of
the second turning point, the packet loss rate is greater, the
video quality is worse. This is because when the duplex and

24 Yibin Hou and Jin Wang: Investigation on the QOE and Packet Loss Rate of the IOT Network
simplex link speeds are small, especially within the range of
less than the actual transmission speed, duplex and simplex
link speeds setting are smaller, network will be more
congestion, the greater the packet loss rate is, the user's quality
of experience is worse. In the case of packet error rate is the
same, the smaller the size of the packet set, the more the
number of the packets, the greater the packet loss rate is, the
smaller the user's quality of experience. The greater the
quantitative parameters of compression, so needs more
packets to send, the greater the packet loss rate, compression
of video quality is worse. The longer the GOP length, it
waiting for the next I frame coming time is long, the recovery
time is longer, So the video user’s quality of experience is
relatively bad. And when the time complexity and space
complexity are not big, its coding distortion masking effect is
far less than the sum of coding distortion and network
transmission distortion, therefore, the packet loss rate is
greater, the user's quality of experience is worse.
Through the above figure 13 and figure 14 we can find that,
in the case of different videos, under the condition of the same
packet loss rate, different video’s users’ quality of experience
QoE values are different, the influences degrees of the packet
loss on QoE is different, that is at the left of the second turning
point, under the condition of the same packet loss rate, src13
video users’ quality of experience QoE values greater than
src22 users’ quality of experience QoE, this is because the
src13 video content complexity is high. As a result, the more
complex the content of the video, video QoE is larger. We can
come to the conclusion that different video content have
impacts on the video QoE. This is because the more complex
video content motion, the larger the space complexity and the
time complexity, so would have coding distortion masking
effect, therefore, user's quality of experience is greater.
For figure 15, figure 16 and figure 17, figure 18, the
horizontal axis are packet loss rate, the vertical axis are to use
MOS quantitative QoE, the first two are scatter plots, the latter
two are curve figures. Through the above four figures we can
find that MOS method and PSNR method’s shape of the curve
is roughly similar, just the scope of Y axis is different. This is
because one is using the MOS quantitative QoE, one is using
the PSNR quantitative QoE. Figure 19 is src22 vertical axis
decreases after fitting curve.
In general, we can came to the conclusion that different
content complexity and different packet loss rates have a
significant impact on the user's quality of experience. This
part’s study laid a foundation of establish the mapping model
of the packet loss rate and QoE.
4. Discussion
4.1. Establish Mapping Model of Packet Loss Rate and the
Quality of Experience
Due to study the effect of packet loss on the user’s quality of
experience QoE’s purpose is to allow users to obtain good
quality of experience, so needs to establish mapping model of
packet loss rate and the Quality of experience by modifying
the QoS parameters of the methods to make the packet loss
rate small and user’s quality of experience large. As is known
to all, QoE evaluation methods mainly include subjective
methods and objective methods, the subjective method is very
difficult to operate. So objective QoE evaluation method make
the packet loss rate get from measure mapping into the user’s
quality of experience QoE become one new kind of thought.
4.1.1. The Related Theory
In the mapping model of packet loss rate and QoE’s
problem, in the same process of these two variables are linked
to each other, restrict each other. The relationship between the
common variable has two categories: A class called
deterministic relationship, the relationship between the
variables called the function relation. A class is called non
deterministic relationship or correlation relationship, this class
of non deterministic relationship between variables called
correlation relationship. Analysis of the mathematical model
established for studying the relationship between one or more
independent variables and a random variable and the statistics
when done called regression analysis There is only one
independent variable in the regression analysis called a
regression analysis, if the model is nonlinear, called nonlinear
regression analysis. In the regression analysis is usually need
to discuss 3 questions: To solve regression coefficient,
reliability test, prediction and control of the use of regression
equation.
For the current mainstream video on demand application of
PPLIVE, Optimal library and so on the relationship between
PSNR and packet loss rate when 400k code, through the linear,
square, hybrid, logarithmic, power, third power after model
match found between the packet loss rate and the PSNR value
(MOS value) has third power relations,establish the regression
equation like: y=ax+bx 2 +cx 3 +d [7]. In this paper, uses
src13_hrc1_525. yuv as an example, the establishment of
scattered plot this video’s packet loss rate and PSNR value,
observe the scatterplot namely figure 11 can be found, packet
loss rate and the PSNR values are presented a nonlinear
relationship, reference PPLIVE packet loss rate and the PSNR
values relation model, under wired and wireless environment
establish the regression equation like: y=ax 3 +bx 2 +cx+d.
First of all, we use of matlab conduct a nonlinear fitting to
compute the coefficients of the regression equations and
conduct the fitting curve of the src13_hrc1_525. yuv video’s
packet loss rate to the PSNR value’s scatterplot. The second,
we have the reliability test and the performance evaluation of
the model. At last, using the regression equation to forecast
and control. Experiment environment and topology
description and HD video options are the same with the packet
loss on QoE’s Part.
4.1.2. The Simulation Experiments (1) Regression equation coefficient and its confidence
interval. For src13_hrc1_525. yuv video, establish the
regression equation as follows, the mapping model of packet
loss rate and the Quality of experience are as shown below.
PSNR quantitative QoE method, establish regression

American Journal of Data Mining and Knowledge Discovery 2017; 2(1): 15-30 25
equation as shown below:
Wired environment: y=20.87x 3 -34.48x 2 +14.65x+13.41
Wireless environment: y=13090x 3 -150.4x 2
+21.31x+11.86 In order to make more precise quantitative of
QoE, MOS
quantitative QoE method, establish regression equation as
shown below:
Wired environment:
y=41.7383 x 3 -68.9554x 2 +29.2980x+26.8264
Wireless environment:
y=18450x 3 -211.3x 2 +72.35x+23.61
For the src13_hrc1_525. yuv video, wired and wireless
environment PSNR method and MOS method’s regression
coefficient and its confidence interval as shown in tables 6 and
table 7 respectively.
Table 6. Src13 wired environment regression coefficients and its confidence interval.
Para meter Regression coefficient(PSNR) confidence interval(PSNR) Regression Coefficient (MOS) confidence interval(MOS)
beta(1) 20.87 (16.41,25.34) 41.7383 (32.81,50.67)
beta(2) -34.48 (-41.62,-27.35) -68.9554 (-83.23,-54.68)
beta(3) 14.65 (11.32,17.98) 29.2980 (22.64,35.96)
beta(4) 13.41 (12.98,13.84) 26.8264 (25.96,27.69)
Table 7. Src13 wireless environment regression coefficient and its confidence interval.
Para meter Regression coefficient (PSNR) confidence interval (PSNR) Regression Coefficient (MOS) confidence interval(MOS)
beta(1) 13090 (-1548000,1574000) 18450 (-2.187e+006,2.224e+006)
beta(2) -150.4 (-18670,18360) -211.3 (-2.638e+004,2.595e+004)
beta(3) 21.31 (-34.83,77.45) 72.35 (-6.977,151.7)
beta(4) 11.86 (11.81,11.9) 23.61 (23.55, 23.68)
(2) Fitting curves
For the src13_hrc1_525. yuv video, packet loss rate and
the PSNR value relationship’s scatter plot under the
environment of the wired using a nonlinear regression
analysis PSNR quantitative method after fitting the fitted
curve is as shown in figure 20. Wireless environment as
shown in figure 21. Two figures’ horizontal axis is packet
loss rate, the vertical axis represents the PSNR values.
Figure 20 curves first increased and then decreased and
then increased, there are two turning points. Figure 21 that
is why the src13 wireless environment data points less is
that when obtained different packet loss rate in modifying
parameters, in the case of different multiple parameter
settings, the packet loss rate and the PSNR values are repeat
in cycles. As a result, the final shape of the curve is roughly
on the rise, no obvious turning point, can be thought of as in
the wireless environment src13 with the increase of packet
loss rate, PSNR value increased gradually. In the end, by
comparing figure 20 and figure 21 we can be found, use the
same video such as are all src13 video, can be thought of as
due to the different topology structure and network
environment which is the difference between wired and
wireless environment resulted in the wire environment has
two turning points and wireless environment do not hava a
turning point. The topology structure and different network
environment has impact on users’ quality of experience
QoE. MOS quantitative QoE method are as shown in figure
22 and 23. Two figures’ horizontal axis are packet loss rate,
the vertical axis are MOS quantitative QoE values. Two
figures’ linear and PSNR method quantitative QoE is
basically the same.
Figure 20. Src13 wired Network environment.
Figure 21. Src13 wireless network environment.

26 Yibin Hou and Jin Wang: Investigation on the QOE and Packet Loss Rate of the IOT Network
Figure 22. Src13 wired Network environment.
Figure 23. Src13 wireless network environment.
4.2. Analysis of the Model
By observing the fitting curve, we can find that packet loss
rate and the user’s quality of experience QoE presents a
nonlinear relationship. For src13_hrc1_525. yuv video, make
the fitting curve of the scatter plot, wired and wireless
environments respectively using PSNR method and MOS
method quantitative QoE’s performance index as follows in
Table 8 and Table 9. The evaluation indexes are mainly
R-square, RMSE (Root Mean Square Error, RMSE), SSE,
SROCC (Spearman Rank Order Correlation Coefficient,
SROCC), Pearson, OR (Outlier Ratio), Spearman, and these
values are between 0 and 1. Which R-Square is called the
adjusted coefficient of determination, the greater the valuen is,
believe that the better the fitting effect of the model. RMSE is
called the root mean square error, it is a kind of numerical
indicators measuring accuracy of measurement, the smaller
this value is, believe that the better fitting effect of the model.
SSE is the sum of squared residuals, it is also a kind of
numerical indicators measuring accuracy of measurement, the
smaller this value is, believe that the better fitting effect of the
model. SROCC is the spearman correlation coefficient
(SROCC) between objective and subjective score, used to
detect the monotonicity of model prediction, the greater the
coefficient is, the change trend increasingly relevant, methods
are more good. Pearson correlation coefficient is used to
measure whether the two data sets on a line, it is used to
measure linear relationship between the distance variables, the
greater the correlation coefficient, the stronger the correlation.
OR said out rate, a measure of the stability of model prediction,
this value is small, the better the performance of the model.
The greater the Spearman coefficient, the better the
performance of the model.
Table 8. PSNR quantitative QoE method.
Video R-square RMSE SSE SROCC Pearson OR Spearman
Src13(Wired) 0.7271 0.2188 4.69 0.8884 0.9917 0 0.9832
13(wireless) 0.6779 0.06808 0.1669 0.8659 1 0 0.9789
PSNR _0.588 0.16 0.2 0.634 0.71 0.5428 0.688
SSIM 0.666 0.15 0.18 0.815 0.83 0.7441 0.766
Table 9. MOS quantitative QoE method.
Video R-square RMSE SSE SROCC Pearson OR Spearman
Src13(Wired) 0.7271 0.4375 18.76 0.9998 0.9917 0 0.9832
Src13(Wireless) 0.8392 0.096 0.3332 1 0.9163 0 0.9789
PSNR 0.588 20.16 0.2 0.634 0.71 0.5428 0.688
SSIM 0.666 0.15 0.18 0.815 0.83 0.7441 0.766
Comprehensive look at table 8 and table 9 can be found, the
horizontal header is coefficient of each measures, the vertical
header is a variety of methods, discovered by table 8 src13
wired indicators better than src13 wireless indicators, prove
src13 wired fitting effect is better, discovered by table 9 src13
wired indicators better than src13 wireless indicators. Contrast
table 8 and 9 can be found, MOS quantitative QoE method
better than the PSNR quantitative QoE method. Due to the
sum of squared residuals SSE is small, so the root mean square
error RMSE is small, the adjust coefficient of determination
R-Square is bigger, so you can think the fitting effect is better,
the fitting is effective. The inspection of the fitting equation is

American Journal of Data Mining and Knowledge Discovery 2017; 2(1): 15-30 27
mainly through the test of goodness of fit (Determination
coefficient R-square test). Among them, determination
coefficient R square is the most commonly used indicators
used to determine regression model fitting degree pros and
cons, the more close to 1, the higher of the degree of the fitting
model. For src13_hrc1_525. yuv video, in the wired and
wireless environment, in the case of using PSNR quantitative
QoE method, determination coefficient R-square is 0.7271
and 0.6779, close to 1, the model is of good performance.
SROCC is respectively 0.8884 and 0.8659, bigger than the
traditional evaluation method PSNR and SSIM’s SROCC, so
think this model’s fitting effect is well. In the case of using
MOS quantitative QoE method, determination coefficient
R-square is 0.7271 and 0.8392, close to 1, the model is of good
performance. SROCC is respectively 0.9998 and 1, bigger
than the traditional evaluation method PSNR and SSIM’s
SROCC, so think this model’s fitting effect is well. At the
same time, compared with PSNR quantitative QoE, SROCC is
bigger than that one, so think MOS value quantitative QoE
method is better than the PSNR value quantitative QoE. The
experimental results show that the model accuracy is high,
easy to operate, can real-time detect packet loss has influences
on the user’s Quality of experience. For PSNR method, src13
in wired and wireless environment, by observing the wired
environment figure 24 and figure 25, wireless environment
figure 26 and figure 27, also can find the confidence interval
of observation is greater than predicted confidence interval,
the predicted value is more accurate than the observed value.
May safely draw the conclusion that, predicted value is more
accurate than the observed value. That is to say establish the
mapping model of packet loss rate and the user’s quality of
experience QoE, in the case of given a packet loss rate, to
predict more accurately, that is to say the correctness of this
model is high, easy to operate. In the same way for MOS
quantitative QoE method [22].
In the end, for PSNR quantitative QoE method src13 wired
and wireless’s fitting subjective and objective, as shown in Figure
28 and Figure 29, for MOS quantitative QoE method src13 wired
and wireless’s fitting subjective and objective, as shown in Figure
30 and Figure 31. The horizontal axis expresses the objective
score of the objective quality evaluation, the vertical axis
represents the value of the subjective scores. The subjective and
objective video fitting figure is different with image, most video
take on the shape of a straight line, most images show the shape
of the curve. Through the four figures can be obviously found
that, MOS quantitative QoE method and PSNR quantitative QoE
method have better subjective and objective consistency, the
former the subjective and objective consistency is stronger than
the latter, MOS quantitative QoE degree of polymerization is
better than the method of PSNR, therefor, MOS quantitative QoE
method is better. By moving the QoE models in IPTV network
application tests, found the detection bandwidth is at least a
minimum of 2Mbps [23].
Figure 24. Src13 wired prediction confidence interval (PSNR).
Figure 25. Src13 wired observation confidence interval (PSNR).
Figure 26. Src13 wireless prediction confidence interval (PSNR).

28 Yibin Hou and Jin Wang: Investigation on the QOE and Packet Loss Rate of the IOT Network
Figure 27. Src13 wireless observation confidence interval (PSNR).
Figure 28. Src13 wired subjective and objective consistency (PSNR).
Figure 29. Src13 wireless subjective and objective consistency(PSNR).
Figure 30. Src13 wired subjective and objective consistency (MOS).
Figure 31. Src13 wireless subjective and objective consistency(MOS).
5. Conclusion
In summary, this paper mainly studies mapping model of
packet loss rate and the Quality of experience on the influence of
packet loss on QoE. The contribution of this paper is first through
research obtain packet loss has a significant effect on video.
Second, based on received the packet loss has a significant effect
on QoE study and establish the mapping model of packet loss
rate and the user’s quality of experience QoE. Next step is to set
up considering network packet loss of video quality evaluation
model, on the basis of considering different packet loss rate and
different content complexity has effects on QoE which conclude
from packet loss has effects on QoE’s part, combine consider
other factors such as different packet loss models to establish
video quality evaluation model consider the network packet loss,
more accurate prediction of user’s quality of experience QoE is
the future work direction [24].
American Journal of Data Mining and Knowledge Discovery 2017; 2(1): 15-30 29
Acknowledgements
This work was partially supported by the Beijing University of
Technology doctoral student scholarship and grants, Beijing
University of Technology software college scholarship and
grants, Tutor scholarship and grants. Thanks to Yi bin Hou,
provide a good research platform and environment, teach
Methods of scientific research. This work was partially
supported by the National Natural Science Foundation of
China (No: 61203377, 60963011, 61162009), the PLA Navy
surface (CHJ13L012).
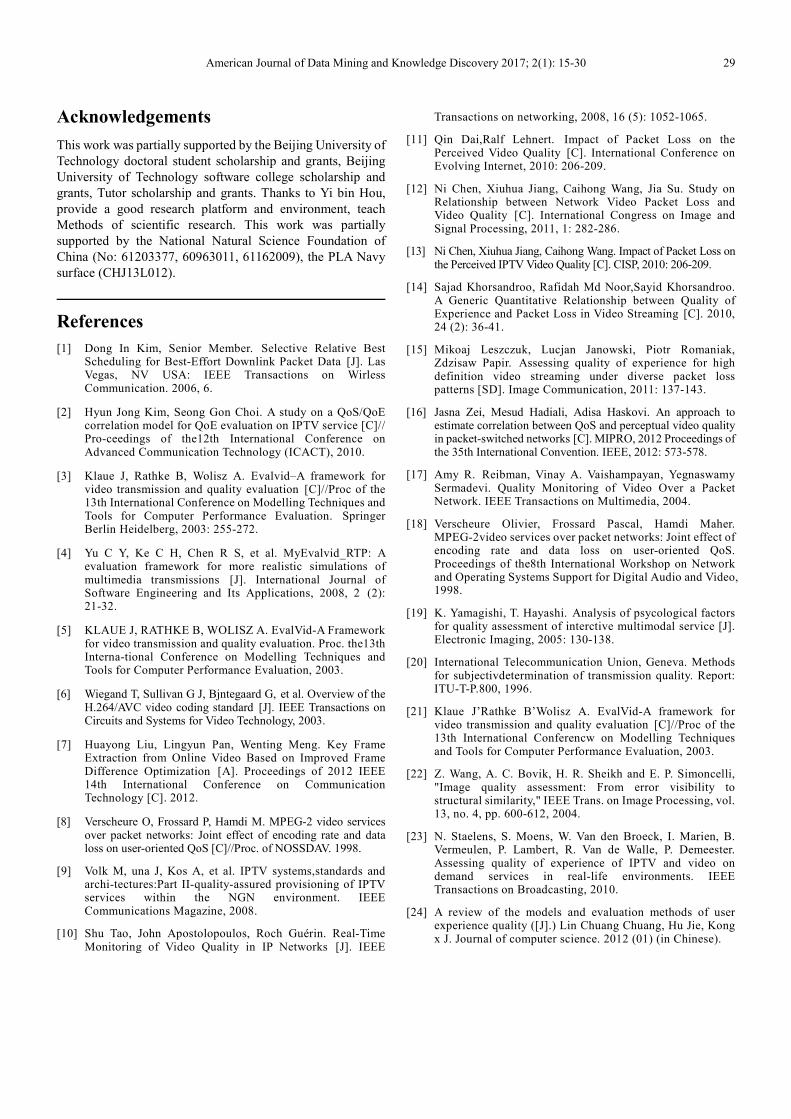
References
[1] Dong In Kim, Senior Member. Selective Relative Best Scheduling for Best-Effort Downlink Packet Data [J]. Las Vegas, NV USA: IEEE Transactions on Wirless Communication. 2006, 6.
[2] Hyun Jong Kim, Seong Gon Choi. A study on a QoS/QoE correlation model for QoE evaluation on IPTV service [C]// Pro-ceedings of the12th International Conference on Advanced Communication Technology (ICACT), 2010.
[3] Klaue J, Rathke B, Wolisz A. Evalvid–A framework for video transmission and quality evaluation [C]//Proc of the 13th International Conference on Modelling Techniques and Tools for Computer Performance Evaluation. Springer Berlin Heidelberg, 2003: 255-272.
[4] Yu C Y, Ke C H, Chen R S, et al. MyEvalvid_RTP: A evaluation framework for more realistic simulations of multimedia transmissions [J]. International Journal of Software Engineering and Its Applications, 2008, 2 (2): 21-32.
[5] KLAUE J, RATHKE B, WOLISZ A. EvalVid-A Framework for video transmission and quality evaluation. Proc. the13th Interna-tional Conference on Modelling Techniques and Tools for Computer Performance Evaluation, 2003.
[6] Wiegand T, Sullivan G J, Bjntegaard G, et al. Overview of the H.264/AVC video coding standard [J]. IEEE Transactions on Circuits and Systems for Video Technology, 2003.
[7] Huayong Liu, Lingyun Pan, Wenting Meng. Key Frame Extraction from Online Video Based on Improved Frame Difference Optimization [A]. Proceedings of 2012 IEEE 14th International Conference on Communication Technology [C]. 2012.
[8] Verscheure O, Frossard P, Hamdi M. MPEG-2 video services over packet networks: Joint effect of encoding rate and data loss on user-oriented QoS [C]//Proc. of NOSSDAV. 1998.
[9] Volk M, una J, Kos A, et al. IPTV systems,standards and archi-tectures:Part II-quality-assured provisioning of IPTV services within the NGN environment. IEEE Communications Magazine, 2008.
[10] Shu Tao, John Apostolopoulos, Roch Guérin. Real-Time Monitoring of Video Quality in IP Networks [J]. IEEE
Transactions on networking, 2008, 16 (5): 1052-1065.
[11] Qin Dai,Ralf Lehnert. Impact of Packet Loss on the Perceived Video Quality [C]. International Conference on Evolving Internet, 2010: 206-209.
[12] Ni Chen, Xiuhua Jiang, Caihong Wang, Jia Su. Study on Relationship between Network Video Packet Loss and Video Quality [C]. International Congress on Image and Signal Processing, 2011, 1: 282-286.
[13] Ni Chen, Xiuhua Jiang, Caihong Wang. Impact of Packet Loss on the Perceived IPTV Video Quality [C]. CISP, 2010: 206-209.
[14] Sajad Khorsandroo, Rafidah Md Noor,Sayid Khorsandroo. A Generic Quantitative Relationship between Quality of Experience and Packet Loss in Video Streaming [C]. 2010, 24 (2): 36-41.
[15] Mikoaj Leszczuk, Lucjan Janowski, Piotr Romaniak, Zdzisaw Papir. Assessing quality of experience for high definition video streaming under diverse packet loss patterns [SD]. Image Communication, 2011: 137-143.
[16] Jasna Zei, Mesud Hadiali, Adisa Haskovi. An approach to estimate correlation between QoS and perceptual video quality in packet-switched networks [C]. MIPRO, 2012 Proceedings of the 35th International Convention. IEEE, 2012: 573-578.
[17] Amy R. Reibman, Vinay A. Vaishampayan, Yegnaswamy Sermadevi. Quality Monitoring of Video Over a Packet Network. IEEE Transactions on Multimedia, 2004.
[18] Verscheure Olivier, Frossard Pascal, Hamdi Maher. MPEG-2video services over packet networks: Joint effect of encoding rate and data loss on user-oriented QoS. Proceedings of the8th International Workshop on Network and Operating Systems Support for Digital Audio and Video, 1998.
[19] K. Yamagishi, T. Hayashi. Analysis of psycological factors for quality assessment of interctive multimodal service [J]. Electronic Imaging, 2005: 130-138.
[20] International Telecommunication Union, Geneva. Methods for subjectivdetermination of transmission quality. Report: ITU-T-P.800, 1996.
[21] Klaue J’Rathke B’Wolisz A. EvalVid-A framework for video transmission and quality evaluation [C]//Proc of the 13th International Conferencw on Modelling Techniques and Tools for Computer Performance Evaluation, 2003.
[22] Z. Wang, A. C. Bovik, H. R. Sheikh and E. P. Simoncelli, "Image quality assessment: From error visibility to structural similarity," IEEE Trans. on Image Processing, vol. 13, no. 4, pp. 600-612, 2004.
[23] N. Staelens, S. Moens, W. Van den Broeck, I. Marien, B. Vermeulen, P. Lambert, R. Van de Walle, P. Demeester. Assessing quality of experience of IPTV and video on demand services in real-life environments. IEEE Transactions on Broadcasting, 2010.
[24] A review of the models and evaluation methods of user experience quality ([J].) Lin Chuang Chuang, Hu Jie, Kong x J. Journal of computer science. 2012 (01) (in Chinese).

30 Yibin Hou and Jin Wang: Investigation on the QOE and Packet Loss Rate of the IOT Network
Biography
Yi bin Hou graduated from xi’an jiaotong
university computer science department,
with a master’s degree in engineering,
graduated from the Netherlands
EINDHOVEN university of technology
department, received a doctor’s degree from
the department of engineering. From 2002
to 2013 as vice President of Beijing
university of technology. The Beijing university of technology,
professor, doctoral supervisor, dean of the school of software,
embedded computing, director of the institute, Beijing university
of technology, deputy director of academic committee and
secretary-general, Beijing Internet software and systems
engineering technology research center director. He research
interests are the Internet of things and software engineering.
Jin Wang received a Bachelor’s degree in
Software Engineering from Beijing
University of Chemical Technol-ogy,
Beijing, China, in 2012.6. And won the
National Scholarship in 2010 and won the
National Endeavor Fellowship in 2009. She
received a master graduate in Computer
Application Technology in Shijiazhuang
Tiedao University in 2015.1. And published many papers
including ISTP, EI and SCI. Now from 2015.4 she is in the
school of software engineering, Department of information,
Beijing University of Technology, read her PHD, Her research
interests are the Internet of things and software engineering and
Embedded and image and video quality assessment in distorting
network.