conference program and abstracts
TRANSCRIPT

International Conference on
Advances in Interdisciplinary Statistics and Combinatorics
AISC - 2014
A Conference ofThe North Carolina Chapter of the American Statistical Association
October 10–12, 2014
The University of North Carolina at Greensboro

Conference Sponsors
The University of North Carolina at Greensboro
The North Carolina Chapter of the American Statistical Association
The American Statistical Association
National Science Foundation, Grant # DMS-1212830
Pearson
RTI International
RHO
Taylor and Francis Group
1

International Conference onAdvances in Interdisciplinary Statistics and Combinatorics
AISC - 2014
Local Organizing Committee
Ratnasingham Shivaji (Advisor)Department of Mathematics and Statistics, UNCG
Sat Gupta (Chair)Department of Mathematics and Statistics, UNCG
Xiaoli GaoDepartment of Mathematics and Statistics, UNCG
Scott RichterDepartment of Mathematics and Statistics, UNCG
Jan RychtarDepartment of Mathematics and Statistics, UNCG
Shanmugathasan SuthaharanDepartment of Computer Science, UNCG
Haimeng ZhangDepartment of Mathematics and Statistics, UNCG
2

International Advisory Committee
Tasos ChristofidesUniversity of Cyprus, Cyprus
Frank CoolenDurham University, UK
B. K. DassUniversity of Delhi, India
Angela DeanOhio State University
Giancarlo DianaThe University of Padua, Italy
Jean-Franois DupuyInstitut de Recherche Mathmatique de Rennes et INSA de Rennes, France
Sudhir GuptaNorthern Illinois University
Jonathan HoskingIBM
Cem KadilarHacettepe University, Turkey
Ben KedemUniversity of Maryland
Simos MeintanisNational and Kapodistrian University of Athens, Athens, Greece
PrajneshuIndian Agricultural Statistics Research Institute, New Delhi, India
John RaynerThe University of Newcastle, NSW, Australia
Jerry ReiterDuke University
Bimal RoyDirector, Indian Statistical Institute, Kolkata, India
Kunio ShimizuKeio University, Japan
K. F. TurkmanUniversity of Lisbon, Portugal
Sergio VerduPrinceton University
Abdus WahedUniversity of Pittsburgh
Ricardas ZitikisUniversity of Western Ontario, Canada
3

Welcome from the Hosts
On behalf of the North Carolina Chapter of the American Statistical Association and The University ofNorth Carolina at Greensboro, we are very pleased to welcome you to AISC -2014, the InternationalConference on Advances in Interdisciplinary Statistics and Combinatorics. We sincerely hopethat your participation in the conference is productive and your stay in Greensboro is a pleasant one.
A project of this magnitude is not possible without liberal support from many quarters. We are verythankful to the NC-ASA executive committee, and the UNCG administration, particularly Dr. TimothyJohnston, Dean of the College of Arts & Sciences and Dr. Ratnasingham Shivaji, Head of the Mathematicsand Statistics Department, for their whole-hearted support. We would also like to express our most sincerethanks to the conference secretary Haley Childers, for taking care of all of the logistical issues. We wouldalso like to take this opportunity to thank all of the sponsors for this conference, particularly the NationalScience Foundation whose generous support made it possible for many of the young researchers to attendthis conference. We would also like to thank all of the plenary speakers and the session organizers whosecontributions made it possible for us to put together such a wonderful academic program.
Hopefully you will go back with very good memories of the conference and will continue to be part of futureNC-ASA activities.
Best wishes,
Sat Gupta, UNC GreensboroConference Chair
Jerry Reiter, Duke UniversityNC-ASA President - 2014
4

Welcome fromDr. Ratnasingham Shivaji, Head
Department of Mathematics and StatisticsUNCG
On behalf of the Department of Mathematics and Statistics at UNCG, I welcome you to this importantevent. Actually our Department is home to several other conferences of this type, all federally funded inpart. I invite you to visit our department’s website at http://www.uncg.edu/mat/ to know us better.
I know Sat and his co-organizers have put together a rich academic program for the conference covering awide range of topics. I am particularly impressed with the two workshops on Big Data/Machine Learning,and Mathematical Biology/Game Theory. Big Data/Machine Learning will clearly be the focus of researchfor many years. Similarly research in Mathematical Biology/Game Theory is a perfect example of howmathematicians, statisticians, biologists, computer scientists, and many others can go outside of their narrowdomains and come together on one platform to do meaningful research. Our department is one of the leadersin this area and we have run several NSF funded math/bio programs for the past eight years.
I would also like to take this opportunity to thank the North Carolina Chapter of the American StatisticalAssociation for bringing this conference to our beautiful campus, and for supporting the conference financiallytoo. I assure NC-ASA that they will not be disappointed. I would like to thank all of the other sponsors aswell.
We will make every effort to make your stay in Greensboro comfortable but if there is anything specific wecan do for you, just let Sat or the conference secretaries know and we will make every effort to take care ofit. Please do come back and visit our department for a colloquium talk, or just to say hello. We will be veryhappy to have you here.
With best wishes,
Ratnasingham ShivajiHelen Barton Excellence Professor & HeadDepartment of Mathematics and Statistics, UNCG
5

Welcome fromDr. Timothy Johnston, DeanCollege of Arts & Sciences
UNCG
On behalf of the College of Arts and Sciences, home of the Department of Mathematics and Statistics atUNCG, I would like to extend a very warm welcome to all of the delegates, particularly those who have comefrom abroad. I would like to thank the North Carolina Chapter of the American Statistical Associationfor letting us host this important event. We are hopeful that UNCG will become the permanent home forfuture AISC conferences. I would also like to thank all of the sponsors of the conference for their financialcontributions at a time when everyones budgets are under considerable strain.
I am very proud of our Mathematics and Statistics Department which now hosts several very importantNSF-funded annual or biennial events of this type. I know that Professor Sat Gupta and his colleagues haveput together a wonderful program that will encourage you to return to UNCG to enjoy this conference infuture years also.
With best wishes,
Timothy D. Johnston, DeanCollege of Arts & Sciences, UNCG
6

Welcome fromDr. Terri Shelton
Vice Chancellor for Research and Economic DevelopmentUNCG
On behalf of The University of North Carolina at Greensboro and Chancellor Linda Brady, I extend avery warm welcome to all of you to our campus. The main theme of the conference, InterdisciplinaryStatistics, is very timely since quantitative methods are at the core of research and the ability to employdata analytics across disciplines is key to answering some of the major questions facing scholars today. OurStatistical Consulting Center, housed in the Department of Mathematics and Statistics, is a perfect exampleof this. SCS supports not only the research activities across campus, but also helps the community at largewith statistical issues in a variety of settings. I am particularly pleased that the list of sponsors for thisconference includes not just the traditional sponsors like NSF but includes several private entities as well.This public/private partnership leads to asking better questions as well as discovering better solutions. Iknow this year will bring the same invigorating discussion and exchange of ideas as in years past and inviteyou to steal a few moments from your conference schedule to explore our campus and our city.
With best wishes,
Terri L. SheltonVice Chancellor for Research and Economic Development &Carol Jenkins Mattocks Distinguished Professor, UNCG
7

Plenary Speakers: Workshop on Big Data
Dr. Syed Ejaz AhmedDean, Faculty of Mathematics and Science, Brock University, Canada
Ejaz Ahmed is professor of statistics and Dean of Faculty of Math and Sci-ence. Before joining Brock, he was a professor and Head of Department ofMathematics & Statistics at the University of Windsor, and University ofRegina. Prior to that, he held faculty position at the University of West-ern Ontario. His area of expertise includes statistical inference, shrinkageestimation, and big data analysis. He has numerous published articles inscientific journals, both collaborative and methodological. Further, he haswritten several books, edited and co-edited several volumes and special is-sues of scientific journals. He organized several workshops and many invitedsessions. He made numerous invited scholarly presentations in many coun-tries around the globe. Dr. Ahmed serves on the editorial board of many
statistical journals (SPL, CSDA, JSCS, JSTP, and others) and review editor for Technometrics. He servedas a Board of Director and Chairman of the Education Committee of the Statistical Society of Canada. Hewas a VP communication for ISBIS. Recently, he served as a member of an Evaluation Group, DiscoveryGrants and the Grant Selection Committee, Natural Sciences and Engineering Research Council of Canada.He is an elected fellow of American Statistical Association.
Dr. David B. DunsonArts and Sciences Distinguished ProfessorDepartment of Statistical Science, Duke University, Durham, NC, USA
David Dunson is Arts and Sciences Distinguished Professor of Statistical Sci-ence at Duke University. His research focuses on Bayesian statistical theoryand methods motivated by high-dimensional and complex applications, with aparticular focus on biomedical applications areas including epidemiology andneuroscience. A methods emphasis is on dimensionality reduction, latent fac-tor models, and nonparametric approaches, particularly for high-dimensional,longitudinal and dynamic data, including images, functions, shapes, networksand other complex objects. Dr. Dunson is a fellow of the American StatisticalAssociation and of the Institute of Mathematical Statistics. He is winner ofthe 2007 Mortimer Spiegelman Award for the top public health statistician,
the 2010 Myrto Lefkopoulou Distinguished Lectureship at Harvard University, the 2010 COPSS Presidents’Award for the top statistician under 41, and the 2012 Youden Award for interlaboratory testing methods.He has over 300 peer reviewed publications.
8

Dr. Sudipto GuhaDepartment of Computer and Information Science, University of Pennsylva-nia, Philadelphia, PA, USA
Sudipto Guha is an Associate Professor in the Department of Computer andInformation Sciences at University of Pennsylvania since Fall 2001. He com-pleted his Ph.D. in 2000 at Stanford University working on approximationalgorithms and spent a year working as a senior member of technical staff inNetwork Optimizations and Analysis Research department in AT&T Shan-non Labs Research. He is a recipient of the NSF CAREER award in 2007,and the Alfred P. Sloan Foundation fellowship. Sudipto Guha is an Asso-ciate Professor in the Department of Computer and Information Sciences atUniversity of Pennsylvania since Fall 2001. He completed his Ph.D. in 2000at Stanford University working on approximation algorithms
Dr. Lexin LiDivision of Biostatistics, University of California, Berkeley, CA, USA
Lexin Li obtained B.E. in Electrical Engineering from Zhejiang University,China, in 1998, and Ph.D. in Statistics, from School of Statistics, Univer-sity of Minnesota, in 2003. He then worked as a Postdoctoral Researcher atSchool of Medicine, University of California, Davis. Dr. Li joined Depart-ment of Statistics, North Carolina State University, in 2005, as an AssistantProfessor in Statistics, and was promoted to an Associate Professor in 2011.He was a visiting faculty at Department of Statistics, Stanford Universityand Yahoo Research Labs from 2011 to 2013 and finally he joined Division ofBiostatistics, University of California, Berkeley, as an Associate Professor, in2014. His research interests include imaging analysis, networks data analysis,dimension reduction, variable selection, computational biology, data mining,and statistical machine learning.
Dr. Jerry ReiterMrs. Alexander Hehmeyer Professor of Statistical ScienceDepartment of Statistical Science, Duke University, Durham, NC, USA
Jerome Reiter is the Mrs. Alexander Hehmeyer Professor of Statistical Sci-ence at Duke University, and the Associate Director of the Information Ini-tiative at Duke. He received his PhD in statistics from Harvard Universityin 1999. His primary research interests include methods for protecting dataconfidentiality, for dealing with missing data, for combining information frommultiple sources, and for analyzing complex data. He is the principal inves-tigator of the Triangle Census Research Network (TCRN), one of the nodesof the NSF NCRN network. The TCRN is dedicated to improving the waythat statistical agencies disseminate data for secondary analysis. Jerome Re-iter is the Mrs. Alexander Hehmeyer Professor of Statistical Science at Duke
University, and the Associate Director of the Information Initiative at Duke. He received his PhD in statis-tics from Harvard University in 1999. His primary research interests include methods for protecting dataconfidentiality,
9

Dr. Ming YuanDepartment of Statistics, University of Wisconsin-Madison & Medical Sci-ences Center, Madison, WI, USA
Ming Yuan is Professor at Department of Statistics at University ofWisconsin-Madison and Senior Investigator at Morgridge Institute for Re-search. He was previously Coca-Cola Junior Professor in the H. Milton Schoolof Industrial and Systems Engineering at Georgia Institute of Technology. Hereceived his Ph.D. in Statistics and M.S. in Computer Science from Univer-sity of Wisconsin-Madison. His main research interests lie in theory, methodsand applications of data mining and statistical learning. Ming Yuan is Pro-fessor at Department of Statistics at University of Wisconsin-Madison andSenior Investigator at Morgridge Institute for Research. He was previouslyCoca-Cola Junior Professor in the H. Milton School of Industrial and Systems
Engineering at Georgia Institute of Technology. He received his Ph.D. in Statistics and M.S. in ComputerScience from University of Wisconsin-Madison. His main research interests lie in theory, methods and ap-plications of data mining and statistical learning.
10

Plenary Speakers: Workshop on Mathematical Biology/GameTheory
Dr. Benjamin AllenDepartment of Mathematics, Emanuel College, Boston, MA, USA
Benjamin Allen is an Assistant Professor of Mathematics at Emmanuel Col-lege in Boston, MA, and a Visiting Scholar at the Center for MathematicalSciences and Applications at Harvard University. He holds a PhD in Math-ematics from Boston University, and did postdoctoral research at the Pro-gram for Evolutionary Dynamics at Harvard University. His research is inthe mathematical modeling of evolutionary processes. Specific research fociinclude evolution in spatially structured populations, the somatic evolutionof cancer, and microbial evolution. Benjamin Allen is an Assistant Professorof Mathematics at Emmanuel College in Boston, MA, and a Visiting Scholarat the Center for Mathematical Sciences and Applications at Harvard Uni-versity. He holds a PhD in Mathematics from Boston University,
Dr. Mark BroomDepartment of Mathematics, City University London, United Kingdom
Professor Mark Broom obtained a BA (Hons) in Mathematics from the Uni-versity of Oxford in 1989, followed by an MSc in Statistics (1990) and a PhDin Mathematics (1993) at the University of Sheffield. He then held a postdoc-toral research position again at Sheffield (1993-5) and a temporary lecturingposition at the University of Glasgow (1995-6). He joined the University ofSussex as a Lecturer in 1996, where he worked until the end of 2009, mostrecently as Reader in Mathematics, and he was the Head of the Departmentof Mathematics from 2007 to 2009. Mark was appointed as Professor ofMathematics at City University in January 2010.
Mark’s research interests are in Mathematical Biology, in particular Evo-lutionary Game Theory, and he has published just under 100 papers. This
includes both theoretical work on general games and the modelling of specific animal behaviours. Mainresearch areas include multiplayer game theory, models of food stealing (kleptoparasitism), the signallingbehaviour of prey species, and evolutionary processes on graphs.
In 2013, together with Jan Rychtar, he completed the book Game-Theoretical Models in Biology publishedby Chapman and Hall.
He is a member of the following organisations: International Society of Dynamic Games, Higher EducationAcademy, European Society for Mathematical and Theoretical Biology, International Society for BehavioralEcology, London Mathematical,Society and the Royal Statistical Society.
11

Dr. Ross CressmanDepartment of Mathematics, Wilfrid Laurier University, Canada
Ross Cressman is Professor of Mathematics and Chair of the Department atWilfrid Laurier University in Waterloo, Ontario, Canada. He earned his BScin Mathematics and Physics at the University of Toronto and his PhD inMathematics at the University of British Columbia. His research has focusedon the theory and applications of evolutionary game theory, especially formodels that include the effects of individual behavior in biological systemsand of human decisions in social science areas such as economics.
He has published two books on the subject. The Solution Concept of Evo-lutionary Game Theory: A Dynamic Approach (Lecture Notes in Biomath-ematics, Vol 94, Springer, 1992) gives a dynamic characterization of the evo-lutionarily stable strategy (ESS) concept introduced for a single species by
John Maynard Smith in terms of strong stability under corresponding evolutionary dynamics (e.g. thereplicator equation). It also generalizes the ESS approach to biological systems with more than one species.
The second book, Evolutionary Dynamics and Extensive Form Games (MIT Press, 2003) extends evo-lutionary game theory to extensive form games that model sequential interactions among individuals whosestrategy choices at later stages of the interaction may depend on earlier actions. Such games, which tradition-ally are used to predict rational human behavior through their static equilibrium properties (e.g. subgameperfect Nash equilibria), are now recognized as important predictors of dynamic stability for individualbehavior in evolving populations.
For the past ten years, Professor Cressman has expanded his research on evolutionary games in severaldirections. A series of papers (e.g. R. Cressman, V. Krivan, J. Garay (2004) ”Ideal Free Distributions,Evolutionary Games, and Population Dynamics in Multiple-Species Environments”, American Naturalist,164, 473-489; V. Krivan, R. Cressman, C. Schneider (2008) ”The Ideal Free Distribution: A Review andSynthesis of the Game-Theoretic Approach”, Theoretical Population Biology 73, 403-425) developed theconnection between the ESS and the earlier concept of the ideal free distribution (IFD). The IFD assumesspecies are distributed in a patchy environment in such a way that individuals in all occupied habitats havethe same fitness that is at least as high as it would be in any unoccupied habitat. Other, more theoretical,directions analyzing games with continuous strategy spaces and the dynamical consequences of continuouslystable strategies (CSS) and neighborhood invader strategies (NIS) are summarized in R. Cressman andY. Tao (”The Replicator Equation and other Game Dynamics”, Proceedings of the National Academy ofSciences USA (PNAS) 2014, 111, 10810-10817).
He is currently active in the worldwide research effort to understand, both in theory and through gameexperiments, the evolution of cooperation in social dilemmas such as the Prisoner’s Dilemma Game and thePublic Goods Game (e.g. R. Cressman, J. Song, B. Zhang, Y. Tao (2012) ”Cooperation and EvolutionaryDynamics in the Public Goods Game with Institutional Incentives”, Journal of Theoretical Biology 299,144-15; J. Wu, B. Zhang, Z. Zhou, Q. He, X. Deng, R. Cressman, Y. Tao (2009) ”Costly Punishmentdoes not always increase Cooperation”, PNAS 106, 17448-17451). A recent initiative (R. Cressman, V.Krivan, J. Brown, J. Garay (2014) ”Game-Theoretic Methods for Functional Response and Optimal ForagingBehavior”, PLoS ONE 9, e88773) shows classical models of optimal foraging can be solved by interpretingpredator decisions in an extensive form game-like setting. This direction adds an exciting new dimension togame theory by considering the effect that interaction time has on the evolutionary outcome.
12

Dr. Vlastimil KrivanDepartment of Mathematics and Biomathematics, University of South Bo-hemia, Czech Republic
Professor Vlastimil Krivan obtained an MSc in Mathematics from the CharlesUniversity in Prague in 1982, followed by a PhD in Mathematics (1989) atthe Czech Academy of Sciences. Since his graduation he held a researchposition at the Biology Centre of the Czech Academy of Sciences at CeskeBudejovice where he currently serves as the Head of Department of Ecologyand Systematics. Since 2008 he also serves as the Head of the Departmentof Mathematics and Biomathematics at the Faculty of Science, University ofSouth Bohemia.
Vlastimil’s research interests are in applications of mathematics to bi-ology and ecology. In particular, he is interested in links between animal
behavior, population dynamics and evolutionary processes that preserve biodiversity on Earth. To this end,he combines game theoretical methods with differential equations describing population dynamics. Thesemethodologies include theory of evolutionarily stable strategies, theory of differential equations with discon-tinuous vector fields and differential inclusions.
He serves on editorial boards of international journals such as American Naturalist, Dynamic Games andApplications, Theoretical Population Biology and was a member of the board of International Society ofDynamic Games and European Society for Mathematical and Theoretical Biology.
Dr. Alun LloydMathematics Department, North Carolina State University, Raleigh, NC
Professor Lloyd studied mathematics at Trinity College, Cambridge, beforemoving to the Department of Zoology in Oxford to do a Ph.D. with RobertMay, which he completed in 1996. The following three years in Oxford sawhim doing his first postdoc, on a Medical Research Council Non-Clinical Fel-lowship, and a lectureship at St. Hilda’s College. In 1999 he moved to theUS, for a four year stint as a Long-Term Member in the Institute for Ad-vanced Study’s Program in Theoretical Biology. In 2003 he moved to NorthCarolina State University to take up a faculty position in the Departmentof Mathematics and its Biomathematics Graduate Program, which he hasbeen directing since 2007. He has broad interests in mathematical biology,but his main focus is on the transmission dynamics of infectious diseases,
particularly mosquito-borne infections. I studied mathematics at Trinity College, Cambridge, before movingto the Department of Zoology in Oxford to do a Ph.D. with Robert May, which I completed in 1996.
13

Dr. Mike Mesterton-GibbonsDepartment of Mathematics, Florida State University, Tallahassee, FL, USA
Mike Mesterton-Gibbons grew up in Coventry in the United Kingdom. Hegraduated with a D.Phil. from the University of Oxford in 1977 before movingto the US in 1982 for a tenure-track position in the Department of Mathe-matics at Florida State University, where he has been a full professor since1996. He conducts research on game-theoretic modelling of animal behaviorand social structure, on which he has published numerous articles. He is alsothe author of three texts on modelling and optimization, and an associateeditor for Journal of Theoretical Biology. Further biographical details can befound at http://www.math.fsu.edu/DepartmentNews/Articles/Fac_MG.
math Mike Mesterton-Gibbons grew up in Coventry in the United Kingdom.He graduated with a D.Phil. from the University of Oxford in 1977 before
moving to the US in 1982 for a tenure-track position in the Department of Mathematics at Florida StateUniversity, where he has been a full professor since 1996.
Dr. Dmitri ZaykinNational Institute of Environmental Health Sciences
Dmitri Zaykin completed a master’s-equivalent degree in biology and popu-lation genetics from Far Eastern State University, Vladivostok, Russia, and adoctorate in biomathematics from North Carolina State University. He heldresearch positions at the Institute of Marine Biology, Vladivostok, North Car-olina State University and GlaxoSmithKline before joining the National In-stitute of Environmental Health Sciences in 2004, where he is a tenured inves-tigator. His research is at the interface between statistics, mathematics andgenetics with current focus on uncovering relationships between genetic vari-ation and phenotypic traits. Dmitri Zaykin completed a master’s-equivalentdegree in biology and population genetics from Far Eastern State University,Vladivostok, Russia, and a doctorate in biomathematics from North Carolina
State University.
14

Plenary Speakers: AISC 2014
Dr. Ching-Shui ChengInstitute of Statistical Science, Academia Sinica, and Department of Statis-tics, University of California, Berkeley, CA, USA
Ching-Shui Cheng is currently a Distinguished Research Fellow and Directorof the Institute of Statistical Science, Academia Sinica, in Taiwan, and aProfessor Emeritus at the University of California, Berkeley. He received hisB.S. in mathematics from National Tsing Hua University and both his MS inmathematics and Ph.D. in mathematics from Cornell University. He joinedthe Department of Statistics at the University of California, Berkeley in 1977and retired in 2013.
Dr. Cheng’s research interest is mainly in experimental design and relatedcombinatorial problems. He is a fellow of the Institute of MathematicalStatistics and the American Statistical Association and an elected member
of the International Statistical Institute. He was an associate editor of the Journal of Statistical Planningand Inference, Annals of Statistics, Statistica Sinica, Biometrika, and Technometrics. He also served as thechair-editor of Statistica Sinica from 1996 to 1999.
Dr. Marie DavidianWilliam Neal Reynolds ProfessorDepartment of Statistics, North Carolina State University, Raleigh, NC, USAASA President 2013
Marie Davidian is William Neal Reynolds Professor in the Department ofStatistics at North Carolina State University (NCSU) and Adjunct Profes-sor of Biostatistics and Bioinformatics at Duke University. She received herPhD in Statistics in 1987 from the University of North Carolina at ChapelHill and is a Fellow of the American Statistical Association (ASA), the In-stitute of Mathematical Statistics (IMS), and the American Association forthe Advancement of Science, and is an elected member of the InternationalStatistical Institute. Marie has served as chair of grant review panels for theNational Institutes of Health (NIH), including as chair of the Biostatistical
Methods and Research Design study section; as Coordinating and Executive Editor of Biometrics; as a mem-ber of US Food and Drug Administration Advisory Committees; and as 2004 president of the Eastern NorthAmerican Region of the International Biometric Society and 2013 president of the ASA. At NCSU, Marieserved as founding director of the Center for Quantitative Sciences in Biomedicine from 2007-2013, and sheis Cluster Coordinator for the Chancellor’s Faculty Excellence Program’s Personalized Medicine DiscoveryFaculty Cluster.
Marie’s interests include analysis of longitudinal data, methods for design and analysis of clinical trialsand observational studies, methods for making statistical inference in the presence of missing or mismeasureddata, and causal inference and dynamic treatment regimes. She is co-author of the 1995 book ”NonlinearModels for Repeated Measurement Data” and is co-editor of the 2009 book ”Longitudinal Data Analysis.”She received the 2007 Janet L. Norwood Award for Outstanding Achievement by a Woman in the StatisticalSciences; the 2009 George W. Snedecor and the 2011 F.N. David Awards presented by the Committee ofPresidents of Statistical Societies (COPSS); the 2010 NCSU Alexander Quarles Holladay Medal for Excel-lence, the highest honor the University bestows on a faculty member; and has delivered several distinguishedlectures, including a 2010 IMS Medallion Lecture.
Marie is PI or co-investigator for several NIH research grants supporting statistical methods research,and is one of three PIs of a joint P01 Program Project funded by the National Cancer Institute, ”StatisticalMethods for Cancer Clinical Trials,” involving faculty from NC State, Duke, and UNC-CH. Since 2004,Marie has served as director of the annual joint NCSU-Duke Clinical Research Institute Summer Institutefor Training In Biostatistics (SIBS), a six-week program to inspire US undergraduates to pursue graduate
15

training in biostatistics, funded by the National Heart, Lung, and Blood Institute and the National Centerfor Advancing Translational Sciences.
Dr. Amy HerringDepartment of Biostatistics, UNC Chapel Hill, USA
Amy Herring is Professor and Associate Chair of Biostatistics in the GillingsSchool of Global Health at the University of North Carolina at Chapel Hill.Her research interests include statistical methods for studying complex en-vironmental exposures and methods for multivariate and longitudinal dataof mixed types. She enjoys collaborating with researchers in public healthand was honored to receive the 2012 American Public Health AssociationsMortimer Spiegelman Award for outstanding public health statistician underage 40. She enjoys collaborating with researchers in public health and washonored to receive the 2012 American Public Health Associations MortimerSpiegelman Award for outstanding public health statistician under age 40.She enjoys collaborating with researchers in public health and was honored
to receive the 2012 American Public Health Associations Mortimer Spiegelman Award for outstanding publichealth statistician under age 40.
Dr. Alan F. KarrDirector of the Center of Excellence for Complex Data Analysis (CoDA)RTI International, Research Triangle Park, North Carolina, USA
Alan F. Karr is Director of the Center of Excellence for Complex Data Analy-sis (CoDA) at RTI International. Previously, he was Director of the NationalInstitute of Statistical Sciences (NISS) (2000–14, and Associate Director from1992 to 2000), Professor of Statistics & Operations Research and Biostatis-tics at the University of North Carolina at Chapel Hill (1993–2014), andAssociate Director of the Statistical and Applied Mathematical Sciences In-stitute (SAMSI) (2002– 07 and 2011–14). Before coming to North Carolina,he was Professor of Mathematical Sciences and Associate Dean of the Schoolof Engineering at Johns Hopkins University. His research activities are cross-disciplinary and cross-sector collaborations involving statistics and such other
fields as data confidentiality, data integration, data quality, data availability, survey methodology, educationstatistics, healthcare, transportation, aging, the scientific workforce, software engineering, materials scienceand disease surveillance. He holds one patent, is the author of three books and more than 140 scientificpapers, the majority of which have co-authors from disciplines other than statistics, and has been the PI orco-PI on more than $50 million of sponsored research funding.
Karr is a Fellow of the American Statistical Association (ASA) and of the Institute of MathematicalStatistics (IMS), an elected member of the International Statistical Institute, and an elected member ofthe Johns Hopkins Society of Scholars. He currently serves on the Steering Committee of Section U of theAmerican Association for the Advancement of Science, the Executive Advisory Board of the Institute forAdvanced Analytics at North Carolina State University and the Committee on Privacy and Confidentialityof the ASA, as well as being Vice-Chair of the Transportation Statistics Interest Group of the ASA. He isan Associate Editor of Statistics and Public Policy.
16

Dr. Benjamin KedemDepartment of Mathematics, University of Maryland, College Park, MD,USA
Benjamin Kedem is a professor in the Mathematics Department, and an af-filiate of the Institute for Systems Research, University of Maryland, CollegePark. He is a Fellow of the American Statistical Association. He served as theSTAT Director, 2000-2004. His areas of expertise include spectral analysis,temporal/spatial prediction, generalized linear models for time series, andsemiparametric statistical inference based on integrated data from multiplesources. Among his honors: a) 1986: Research on higher order crossings(HOC) selected as an accomplishment by AFOSR; b) 1988: IEEE W.R.G.Baker award, given for the most outstanding paper reporting original work inany of the Transactions, Journals, and Magazines of the IEEE Societies or in
the PROCEEDINGS of the IEEE; c) 1997: NASA/Goddard Exceptional Achievement Award, for “theoret-ical development and optimization of statistical methods maximizing the accuracy of rainfall measurementsfor the Tropical Rainfall Measuring Mission(TRMM)”; d) 2006: Weston Visiting Professorship, WeizmannInstitute of Science, Israel; e) 2006: IBM Faculty Award; and f) 2013: Fulbright Specialist, New Universityof Lisbon, Portugal. He served as PI for grants and contracts from AFOSR, ONR, NASA, NCHS, NSF, andUSDA.
He is the author of: a) Binary Time Series, Dekker, 1980; b) Time Series Analysis by Higher OrderCrossings, IEEE Press, 1994; c) Regression Models for Time Series Analysis (with K. Fokianos), Wiley, 2002.
Dr. Richard SmithMark L. Reed III Distinguished ProfessorDirector of SAMSIDepartment of Statistics and Operations Research, UNC Chapel Hill, NC,USA
Richard L. Smith is Mark L. Reed III Distinguished Professor of Statisticsand Professor of Biostatistics in the University of North Carolina, ChapelHill. He is also Director of the Statistical and Applied MathematicalSciences Institute (SAMSI), a Mathematical Sciences Institute supportedby the National Science Foundation. He obtained his PhD from Cornell Uni-versity and previously held academic positions at Imperial College (London),the University of Surrey (Guildford, England) and Cambridge University.His main research interest is environmental statistics and associated areas
of methodological research such as spatial statistics, time series analysis and extreme value theory. He isparticularly interested in statistical aspects of climate change research, and in air pollution including itshealth effects. He is a Fellow of the American Statistical Association and the Institute of MathematicalStatistics, an Elected Member of the International Statistical Institute, and has won the Guy Medal in Silverof the Royal Statistical Society, and the Distinguished Achievement Medal of the Section on Statistics andthe Environment, American Statistical Association. In 2004 he was the J. Stuart Hunter Lecturer of TheInternational Environmetrics Society (TIES). He is also a Chartered Statistician of the Royal StatisticalSociety.
17

Dr. John StufkenCharles Wexler Professor in StatisticsSchool of Mathematical and Statistical Sciences, Arizona State University,USA
After receiving his BS and MS degrees from the University of Nijmegen inthe Netherlands, John Stufken received his PhD in Statistics in 1986 fromthe University of Illinois at Chicago. Since that time, he has held positions asAssistant and Associate Professor at the University of Georgia (1986-1990),Assistant, Associate and Full Professor at Iowa State University (1988-2002),Program Director for Statistics at the National Science Foundation (2000-2003), and Professor and Head of the Department of Statistics at the Uni-versity of Georgia (2003-2014). Since August 2014 he is the Charles WexlerProfessor in Statistics in the School of Mathematical and Statistical Sciences
at Arizona State University. His primary area of research interest is design and analysis of experiments. Hehas approximately 75 publications in this area, and is co-author (with A. Hedayat and N.J.A. Sloane) of theSpringer Verlag book Orthogonal Arrays: Theory and Applications. He is also co-Editor (with D. Bingham,A.M. Dean and M.D. Morris) of the forthcoming Handbook of Design and Analysis of Experiments pub-lished by Chapman and Hall/CRC. He has served as Associate Editor for many journals, including currentlyfor the Journal of the American Statistical Association and the Journal of Statistical Theory and Practice.From 2004-2006, he served a three-year term as Executive Editor for the Journal of Statistical Planningand Inference. This was followed by a three-year stint as Editor for The American Statistician (2009-2011).He has served in multiple capacities for the ASA, including on three Task Forces appointed by incomingpresidents. He was co-organizer (with A. Mandal) of the conference Design and Analysis of Experiments2012, which was held from October 17-20, 2012, in Athens, GA. John Stufken is an elected Fellow of the IMS(2000) and of the ASA (2001). He held a one-month appointment as the Rothschild Distinguished VisitingFellow at the Isaac Newton Institute for Mathematical Sciences in Cambridge, UK, in 2011.
Dr. Anastasios A. (Butch) TsiatisGertrude M. Cox Distinguished Professor of StatisticsDepartment of Statistics, North Carolina State University, Raleigh, NC, USA
Anastasios A. Tsiatis is the inaugural Gertrude M. Cox Distinguished Pro-fessor of Statistics at NCSU. Dr. Tsiatis is known internationally for hisstatistical methods research, particularly in the areas of survival analysis,semiparametric methods, cost and quality of life data analysis, and causalinference. He has published more than 150 papers, most in top statisticaljournals, and he is a Fellow of the American Statistical Association (ASA)and of the Institute of Mathematical Statistics (IMS) and an elected OrdinaryMember of the International Statistical Institute. Dr. Tsiatis is currently co-editor of the journal Biostatistics, and he is a long-standing Editor for theSpringer Series on Statistics for Biology and Health. He has received numer-
ous honors and awards, including the 1986 Mortimer Spiegelman Award given by the American Public HealthAssociation Statistics Section to recognize an outstanding statistician under age 40, the 2001 Committee ofPresidents of Statistical Societies (COPSS) George W. Snedecor Award, and distinguished lectureships innumerous leading statistics and biostatistics departments. He is the recipient of a prestigious Method toExtend Research In Time (MERIT) award from the National Institute of Allergy and Infectious Diseases(NIAID) of the National Institutes of Health (NIH), which recognizes researchers who have demonstratedsuperior competence and outstanding productivity in research by awarding them long-term support to fostercontinued creativity; less than 5% investigators supported by NIH receive MERIT awards. Dr. Tsiatis isalso the first statistician to receive the 2010-2011 Princess Lilian Visiting Professorship, which brings anoutstanding scientific researcher to Belgium for a series of distinguished lectures; and he was awarded anhonorary doctorate in 2013 by the University of Hasselt in Belgium. Dr. Tsiatis received his bachelor’sdegree in mathematics from the Massachusetts Institute of Technology in 1970 and his PhD in statistics
18

from the University of California, Berkeley, in 1974 under the direction of Jerzy Neyman. He has been amember of the Department of Statistics faculty at NCSU since 1997. Prior to joining NCSU, he was a facultymember in the Department of Biostatistics at Harvard University, where he was promoted to Professor withtenure in 1990; a member of the Biostatistics Division at St. Jude Childrens Research Hospital; and a facultymember in the Department of Statistics at the University of Wisconsin-Madison.
Dr. Mike WestThe Arts & Sciences Professor of Statistics & Decision SciencesDepartment of Statistical Science, Duke University, Durham, NC, USA
Mike West holds a Duke University distinguished chair as the Arts & SciencesProfessor of Statistics & Decision Sciences in the Department of StatisticalScience, where he led the development of statistics from 1990-2002. A pastpresident of the International Society for Bayesian Analysis (ISBA), West hasserved the international statistics profession broadly. This includes foundingroles for ISBA and the Bayesian section of the American Statistical Asso-ciation, among other areas of professional society development. He was amember of establishment committees and founding boards of the NationalInstitute of Statistical Sciences and the Statistical & Applied MathematicalSciences Institute in the USA, and has served on advisory boards of other
national research institutes including the Institute for Mathematical Sciences in UK, and the Institute ofStatistical Mathematics in Japan. West’s expertise spans a wide range of areas in Bayesian statisticalmodelling and computation, focusing on methodology and applications of complex stochastic modelling inhigh-dimensional problems. His current research emphasizes emerging large-scale computation, multivariatetime series and dynamic modelling, sparsity modelling in statistics, and spatio-dynamic modelling. Currentareas of emphasis in applications include financial time series and decision analysis with increasingly com-plex, structured models, macro-econometrics and societally relevant big & fast data issues in global financialsystems, monitoring and fast data analysis in dynamic networks, advanced imaging and statistical modellingin systems biology applications, large-scale environmental and atmospheric monitoring, and others.
Since his PhD in 1982, West has published around 180 papers in core statistics and interdisciplinaryapplications in business, econometrics and finance, signal processing, climatology, public health, genomics,immunology, neurophysiology, systems biology and other areas. He is co-author of three books on Bayesiantime series analysis and dynamic modelling, several edited volumes, and multiple software packages. Hehas been a statistical consultant for multiple companies, banks, government agencies and academic centersin UK and USA. In the business world beyond consulting, West co-founded the biotechnology companyExpressionanalysis (EA Inc.), now a wholly owned subsidiary of Quintiles, has been advisor or board memberof financial investment firms, and is a current member of the board of directors of investment company BEAMMulti-Strategy Master Fund, Ltd., and of the IT energy solutions company Panton Inc.
West has received a number of awards for research and professional service, including the internationalMitchell Prize for research in applied Bayesian statistics (in 1994, 1997 and again in 2012), outstandingstatistical application paper award of the American Statistical Association (in 1997), the Zellner Medal ofISBA, the International Society for Bayesian Analysis (in 2014), and multiple distinguished speaking awards.West teaches broadly in Bayesian statistics, in academia and through short-courses. His professional kickscome from a variety of sources, but teaching and working with smart, young, emerging statisticians from allover the world is what he prizes most. In addition to working with and advising many undergraduates andMasters students, West has advised more than 50 primary PhD students and postdoctoral associates, mostof whom are now in academic, industrial or governmental positions involving advanced statistical research.
19
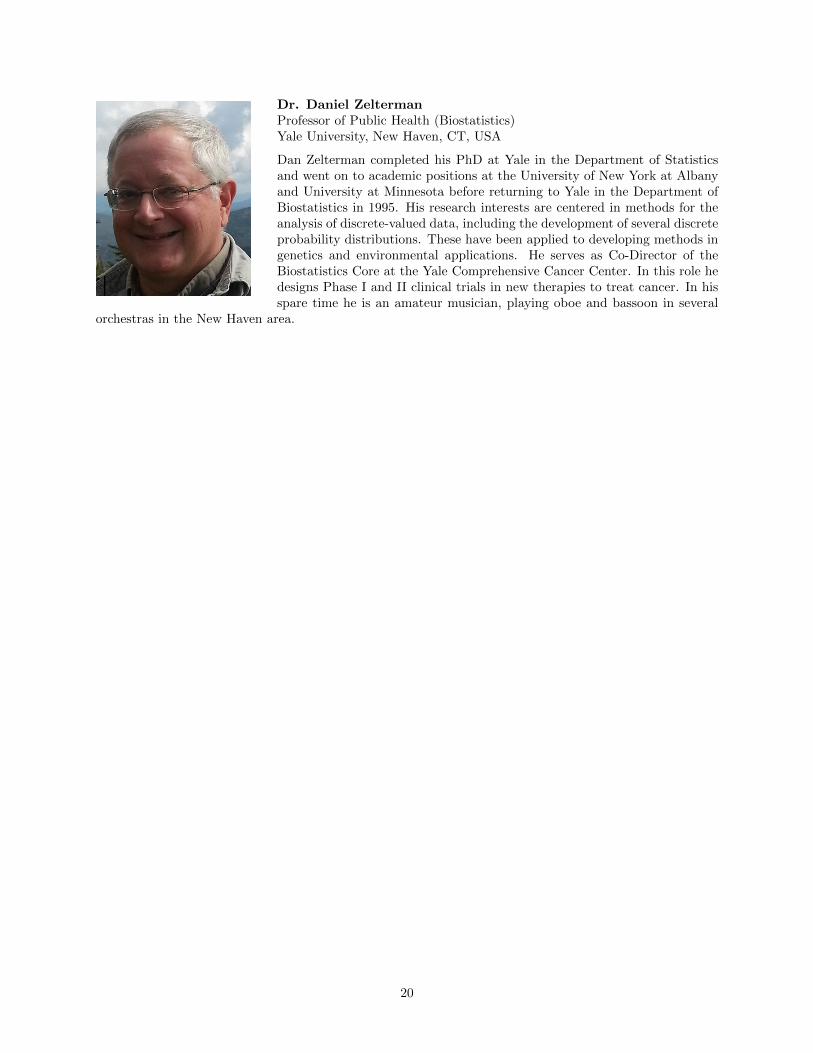
Dr. Daniel ZeltermanProfessor of Public Health (Biostatistics)Yale University, New Haven, CT, USA
Dan Zelterman completed his PhD at Yale in the Department of Statisticsand went on to academic positions at the University of New York at Albanyand University at Minnesota before returning to Yale in the Department ofBiostatistics in 1995. His research interests are centered in methods for theanalysis of discrete-valued data, including the development of several discreteprobability distributions. These have been applied to developing methods ingenetics and environmental applications. He serves as Co-Director of theBiostatistics Core at the Yale Comprehensive Cancer Center. In this role hedesigns Phase I and II clinical trials in new therapies to treat cancer. In hisspare time he is an amateur musician, playing oboe and bassoon in several
orchestras in the New Haven area.
20

Conference ProgramAISC 2014 - October 10-12, 2014
UNCG
Please Note: At UNCG Campus, shuttles will always drop off and pick up from Sterling Street betweenElliott University Center (EUC: Conference Venue) and Walker Parking Deck
October 9, 2012, Thursday
5:00 - 8:00 pm Conference Registration Desk at Sheraton Hotel
October 10, 2014, Friday
Plenary Sessions 1- 4 on Day 1 (Friday, October 10) are devoted exclusively to the workshops on Big Data/Machine Learning, and Mathematical Biology/Game Theory.
7:30 - 7:45 Shuttles from Sheraton Hotel to UNCGDepartures: 7:30, 7:45Please don’t wait for the last departure, you may have to take a cab or walk
7:30- Registration Desk, Refreshments, EUC Auditorium Lobby
8:30 - 9:00 Inaugural Remarks - EUC Auditorium
9:00 - 10:30 Plenary Session 1A: Workshop on Big Data/Machine LearningEUC AuditoriumChair: Ming Yuan - University of Wisconsin-Madison
Jerry Reiter - Duke UniversityProtecting Confidentiality in an era with no Privacy
Sudipto Guha - University of PennsylvaniaSampling, Sketching and Streaming: Designing Combinatorial Algorithms for Big Data
9:00 - 10:30 Plenary Session 1B: Workshop on Mathematical Biology/Game TheoryKirkland RoomChair: Jan Rychtar - UNCG
Mark Broom - City University LondonAsymmetric Games in Monomorphic and Polymorphic Populations
Mike Mesterton-Gibbons - Florida State UniversityVariation between Self- and Mutual Assessment in Animal Contests
10:30 - 10:50 Coffee Break
10:50 - 12:20 Plenary Session 2A: Workshop on Big Data/Machine LearningEUC AuditoriumChair: Lexin Li - University of California, Berkeley
Ming Yuan - University of Wisconsin-MadisonDetection of Very Short Signal Segments
S. Ejaz Ahmed - Brock University, CanadaBig Data, Big Bias, Small Surprise!
21

10:50 - 12:20 Plenary Session 2B: Workshop on Mathematical Biology/Game TheoryKirkland RoomChair: Mark Broom - City University London
Vlastimil Krivan - University of South BohemiaOn Lotka-Volterra Population Games
Ross Cressman - Wilfrid Laurier UniversityGame-Theoretic Methods for Functional Response and Optimal Foraging Behavior
12:20 - 1:50 Lunch - Dining Commons (Two buildings down from EUC, the Conference Center)
1:50 - 3:20 Plenary Session 3A: Workshop on Big Data/Machine LearningEUC AuditoriumChair: : J. S. Marron - UNC Chapel Hill
David Dunson - Duke UniversityBayesian Inference on Populations of Networks
Lexin Li - University of California, BerkeleyTwo Years in Silicon Valley – Some experiences, stories, and thoughts about Big Data
1:50 - 3:20 Plenary Session 3B: Workshop on Mathematical Biology/Game TheoryKirkland RoomChair: Ross Cressman - Wilfrid Laurier University
Benjamin Allen - Emanuel College & Harvard UniversitySpatial Population Structure Affects the Rate of Neutral Substitution
Alun Lloyd - North Carolina State UniversityModeling Novel Strategies for Controlling Mosquito-Borne Diseases
3:30 - 3:50 Coffee Break
3:50 - 4:20 Plenary Session 4: Workshop on Mathematical Biology/Game TheoryKirkland RoomChair: Vlastimil Krivan - University of South Bohemia
Dmitri Zaykin - National Institute of Environmental Health SciencesSorting out Genuine and Spurious Discoveries in Large Scale Genetic Studies
3:50 - 4:20 NC-ASA Chapter Meeting (non-members also invited)EUC AuditoriumChair: Jerry Reiter - Duke University, NC-ASA President
4:30 - 6:30 Parallel Sessions 1A-2H
6:45 - 8:30 Reception/Dinner in the Dining Commons
8:30 - 9:00 Shuttles Back to SheratonDepartures: 8:30, 8:45
22

October 11, 2014, Saturday
7:30 - 7:45 Shuttles from Sheraton Hotel to UNCGDepartures: 7:30, 7:45Please don’t wait for the last departure, you may have to take a cab or walk
7:30 - 8:30 Registration/Refreshments, EUC Auditorium Lobby
8:30 - 10:00 Plenary Session 5EUC AuditoriumChair: Ben Kedem - University of Maryland
Mike West - Duke UniversitySparsity in Multivariate Dynamic Models
Muni Srivastava - University of TorontoTests for Covariance Matrices in High Dimension with Less Sample Size
10:00 - 10:20 Coffee Break
10:20 - 12:20 Parallel Sessions 2A-3H
12:20 - 1:50 Lunch - Dining Commons
1:50 - 3:20 Plenary Session 6EUC AuditoriumChair: Sujit Ghosh - SAMSI & North Carolina State University
Richard Smith - SAMSI & UNC Chapel HillInfluence of Climate Change on Extreme Weather Events
John Stufken - Arizona State UniversityOn Optimal Designs for Nonlinear Mixed Effects Models
3:20 - 3:40 Coffee Break
3:40 - 5:10 Plenary Session 7EUC AuditoriumChair: Dan Zelterman - Yale University
Marie Davidian - North Carolina State UniversityImplementing Personalized Medicine: Estimation of Optimal Dynamic Treatment Regimes.Part I: Statistical Framework and Regression-based Estimators
Anastasios Tsiatis - North Carolina State UniversityImplementing Personalized Medicine: Estimation of Optimal Dynamic Treatment Regimes.Part II: Value Search Estimators and Classification Perspective
5:20 - 7:20 Parallel Sessions 3A-3G
7:30 - 9:30 Conference Banquet & Chapter Awards Ceremony, Cone Ball Rooms, EUC9:30 - 10:00 Shuttles Back to Sheraton
Departures: 9:30, 9:45
23

October 12, 2014, Sunday
7:30 - 7:45 Shuttles from Sheraton Hotel to UNCGDepartures: 7:30, 7:45Please don’t wait for the last departure, you may have to take a cab or walk
7:30 - 8:30 Registration/Refreshments, EUC Auditorium Lobby
8:30 - 10:00 Plenary Session 8EUC AuditoriumChair: John Stufken - Arizona State University
Dan Zelterman - Yale UniversityA Two-Stage, Phase II Clinical Trial Design with Nested Criteria for Early Stoppingand Efficacy
Ben Kedem - University of MarylandRepeated Out of Sample Fusion in Interval Estimation of Small Tail Probabilitiesin Food Safety
10:00 - 10:20 Coffee Break
10:20 - 11:50 Plenary Session 9EUC AuditoriumChair: Jerry Reiter - Duke University
Alan Karr - RTI InternationalEffects of Method Parameters and Ground Truth in the OMOP Results Database
C. S. Cheng - Institute of Statistical Science, Academia Sinica & UC BerkeleyMinimal Second-Order Saturated Designs
12:20 - 11:50 Lunch -Dining Commons
1:50 - 3:50 Parallel Sessions 4A-4G
3:50 - 4:30 Coffee Break
4:30 - 5:00 Best Paper Awards, EUC Auditorium
5:00 - 5:30 Shuttles Back to SheratonDepartures: 5:00, 5:15
24

Parallel Session 1A: EUC Joyner RoomRecent Advances in Multivariate Theory and Its ApplicationChair: Dietrich von Rosen - Swedish University of Agricultural SciencesFriday, October 10, 4:30 - 6:30
Shinpei Imori, Hiroshima UniversityConsistent Selection of the True Covariance Components in High-Dimensional Growth Curve Model withRandom Coefficients
Francesca Greselin - University of Milano-Bicocca, ItalyRobust Mixtures of Factor Analyzers via the Trimming Approach
Dietrich von Rosen - Swedish University of Agricultural SciencesWilks Lambda and the Growth Curve Model
Martin Singull, Linkoping UniversityTest for the Mean in a Growth Curve Model for High Dimensions
Parallel Session 1B: EUC Claxton RoomFoundations of Objective InferenceChair: Jan Hannig - UNC Chapel HillFriday, October 10, 4:30 - 6:30
Kai Zhang - UNC Chapel HillInference after Model Selection Valid Post-Selection Inference
Dungang Liu - Yale UniversityA Nonparametric Approach to Combining Information from Multiple Sources
Ryan Martin - University of Illinois at ChicagoOn Optimal Inferential Models
Abhishek Pal Majumear - UNC Chapel HillHigher Order Asymptotics for Generalized Fiducial Distribution
Parallel Session 1C: EUC Maple RoomStatistical ConsultingChair: Jason Brinkley - East Carolina UniversityFriday, October 10, 4:30 - 6:30
Jason Brinkley - East Carolina UniversityConsulting: The Good, The Bad, and The Ugly
Emily Griffith - North Carolina State UniversityPlaying in everyone’s Backyard: Statistical Consulting in the Sciences
Eric Vance - Virginia TechTraining Statistical Consultants to Become Collaborative Statisticians
Julia Sharp- Clemson UniversityPerceptions of Statistical Consulting in a University Setting
Panel Discussion:Jason Brinkley (East Carolina University), Emily Griffith (North Carolina State University), Eric Vance(Virginia Tech), Julia Sharp (Clemson University), Scott Richter (UNCG) and Hrishikesh Chakraborty(University of South Carolina)
25

Parallel Session 1D: EUC Alexander RoomNew Techniques for Analyzing High Dimensional and Complex DataOrganizer: Yichao Wu - North Carolina State UniversityChair: Donald Martin - North Carolina State UniversityFriday, October 10, 4:30 - 6:30
Yuexiao Dong - Temple UniversitySufficient Dimension Reduction with Multivariate Response
Donald Martin - North Carolina State UniversityEfficient Computation of the Distribution of Spaced Seed Coverage
Jichun Xie - Duke UniversityHigh Dimensional Tests for Functional Brain Networks
Jiajia Zhang - University of South CarolinaAccelerated Intensity Frailty Model for Recurrent Events Data
Parallel Session 1E: EUC Sharpe RoomData Dimension Reduction ApproachesChair: Kumer Pial Das- Lamar UniversityFriday, October 10, 4:30 - 6:30
J. S. Marron - UNC Chapel HillNonnegative Nested Cone Analysis
S. Stanley Young - National Institute of Statistical SciencesTwo-Block Non-Negative Matrix Factorization for Unknown Chemical Identification
Karthik Devarajan - Fox Chase Cancer Center, Temple UniversityNon-Negative Matrix Factorization Algorithms for Heteroscedastic Data
Kumer Pial Das - Lamar UniversityUsing Text Mining Methods to Analyze Biomedical Data
Parallel Session 1F: EUC Kirkland RoomSpatial Statistics and the Environment: Theory and ApplicationsChair: Haimeng Zhang - UNCGFriday, October 10, 4:30 - 6:30
Haimeng Zhang - UNCGCovariance Structures of Axially Symmetric Spatial Processes on the Sphere
Yang Li - University of Minnesota, DuluthModeling Nonstationary Covariance Function with Convolution on Sphere
Elizabeth Mannshardt - North Carolina State UniversityDynamic Spatial Evaluation of Deterministic Air Quality Models Using Monitoring Station Observations
Guoyi Zhang - University of New MexicoSmoothing Splines Using Compactly Supported, Positive Definite, Radial Basis Functions
Janet S. Kim -North Carolina State UniversityGeneralized Functional Concurrent Model
26

Parallel Session 1G: EUC Dogwood RoomFinancial and Insurance ModelsChair: J. Beleza Sousa - New University of LisbonFriday, October 10, 4:30 - 6:30
J. Beleza Sousa - New University of LisbonBonds Historical Simulation Value at Risk
Goncalo dos Reis - University of EdinburgSecuritization and Equilibrium Pricing Under Relative Performance Concerns
Manuel L. Esquvel - New University of LisbonMarket Liquidity as a Probability or as a Stochastic Process
Ricardas Zitikis - University of Western OntarioTrends in Disguise
Oleh Stefanets - Kyiv National University of Trade and EconomicsEconomic and Mathematical Models of Credit Risk Assessment in Commercial Bank
Parallel Session 1H: EUC AuditoriumNoSQL Systems for Big Data AnalyticsChair: Venkat Gudivada - Marshall UniversityFriday, October 10, 4:30 - 6:30
Jordan Paris - Marshall UniversityBig Data Scale Content Based Image Retrieval
S. Jothilakshmi - Annamalai University, IndiaInformation Security in NoSQL Systems for Big Data
Dhana Rao - Marshall UniversityCanonical Discriminate Analysis of Functional Metagenomes
Akhil M. Gudivada - Marshall UniversityHCUP Data Analysis with MongoDB
Quan Do - New Mexico State UniversityModeling Multimodal Healthcare Big Data
Parallel Session 2A: EUC Alexander RoomClinical Trials Methods: Novel Methods or ApplicationsOrganizer: Heejung Bang - UC DavisChair: Sonia Davis - UNC Chapel HillSaturday, October 11, 10:20 - 12:20
Zhiwei Zhang - FDANew Analytical Methods for Non-Inferiority Trials: Covariate Adjustment and Sensitivity Analysis
Hrishikesh Chakraborty - University of South CarolinaMarkov Chain Models for Clinical Trials: Intervention to Reduce Human Papillomavirus Infection
Bo Zhang - FDA/CDRHEstimating Biomarker-Adjusted Treatment Effects in Randomized Clinical Trials Using Auxiliary Covariates:Application to a Phase 3 HIV-1 Trial
Jared Lunceford - Merck & CoClinical Utility Estimation for Assay Cut-offs in Early Phase Oncology Enrichment Trials
27

Bo Jin - PfizerLongitudinal Data Analysis to Assess Clinical Efficacy Equivalence in Biosimilar Clinical Trials
Parallel Session 2B: EUC Kirkland RoomGame Theory/Mathematical BiologyChair: Jan Rychtar - UNCGSaturday, October 11, 10:20 - 12:20
David Sykes - UNCGToxoplasmosis Vaccination Strategies
Ana Paula Tognasoli - UNCGGame-Theoretical Model of Oviposition Site-Selection of Gravid Female Mosquitoes
David Suarez - UNCGGreater Mobility and Larger Neighborhood Size Inhibit the Evolution of Cooperation
Aida Briceno - UNCGThe Dynamics of Offensive Messages in the World of Social Media
Jan Rychtar - UNCGIdeal Cost-Free Distributions in Structured Populations for General Payoff Functions
Fei Xu - Wilfrid Laurier UniversityEvolution of Mobility in Predator-Prey Systems
Parallel Session 2C: EUC Claxton RoomApplications of Multiple Imputation via Bayesian Mixture ModelingChair: Jerry Reiter - Duke UniversitySaturday, October 11, 10:20 - 12:20
Lan Wei - Duke UniversityReleasing Synthetic Magnitude Microdata with Fixed Marginal
Nicole Dalzell - Duke UniversityA Bayesian Approach to Incorporating Uncertainty in Record Linkage
Jingchen Hu - Duke UniversityNested Dirichlet Process Model for Household Data Synthesis
Jerry Reiter - Duke UniversityImputation of Missing Data via Flexible, Mixture Modeling
Parallel Session 2D: EUC AuditoriumDesign and Analysis of ExperimentsOrganizer: Manohar Aggarwal, University of MemphisChair: John Stufken, Arizona State UniversitySaturday, October 11, 10:20 - 12:20
Angela Dean - The Ohio State UniversityA-optimal and A-efficient Designs for Discrete Choice Experiments
Pallavi Chitturi - Temple UniversitySome Results on the Optimality of Choice Sets for 2n Factorial Designs
Tena Katsaounis - The Ohio State University at MansfieldTwo-Level Screening Designs Derived From Binary Non-Linear Codes
28

John Morgan - Virginia TechMulti-factor Youden Rectangles
Jyotirmoy Sarkar - Indiana University Purdue University IndianapolisSudokus as Experimental Designs
Parallel Session 2E: EUC Maple RoomRecent Developments in Statistical Machine LearningOrganizer: Yufeng Liu - UNC Chapel HillChair: Yuexiao Dong - Temple UniversitySaturday, October 11, 10:20 - 12:20
Xiaoli Gao - UNCGRobust Feature Selection with Fussy Group Information
Yuying Xie - UNC-Chapel HillEstimation of Graphical Model from Noisy Data
Guan Yu - UNC-Chapel HillSparse Learning Incorporating the Graphical Structure among Features
Yin Xia - UNC-Chapel HillHigh Dimensional Sparse MANOVA
Parallel Session 2F: EUC Sharpe RoomQuantitative MethodsChair: Prajneshu, Indian Agricultural Statistical Research Institute, New Delhi, IndiaSaturday, October 11, 10:20 - 12:20
Eddy Kwessi - Trinity UniversityGeneralized Signed-Rank Estimation for Nonlinear Models with Multidimensional Indices
B. K. Dass - University of DelhiConstruction of M-Repeated Burst Error Detecting and Correcting Non-Binary Linear Codes
Prithwish Bhaumik - North Carolina State UniversityBayesian Estimation in Differential Equation Models
Benedicto Kazuzuru- Sokoine University of Agriculture, TanzaniaChallenges of Statistical Consultancy for Developing Countries
Parallel Session 2G: EUC Joyner RoomRisk AnalyticsChair: Ricardas Zitikis - University of Western OntarioSaturday, October 11, 10:20 - 12:20
Vytaras Brazauskas - University of Wisconsin-MilwaukeeCATL Methods and Robust Credibility: A Study Using Hachemeister’s Data
Bruce Jones - University of Western OntarioPhysiological Age, Health Costs and their Relationship
Danang Teguh Qoyyimi - University of Western OntarioMeasuring the Lack of Monotonicity in Functions
Jaehwan Kim - Korea University Business SchoolA Direct Utility Model for Economies of Scope
29

Ricardas Zitikis - University of Western OntarioExtremal Risks: Paths and Indices of Maximal Tail Dependence
Parallel Session 2H: EUC Dogwood RoomHealthcare ChallengesChair: Jennifer Fencl - Cone Health SystemSaturday, October 11, 10:20 - 12:20
Dawn Engels - Cone Health SystemPrevention of Hospital Acquired Pressure Ulcers in an Operating Room Setting
Jennifer Fencl - Cone Health SystemExamining Neurosurgical Surgical Site Infections
Prashant Mittal - Muskie School of Public Service, University of Southern MaineMeasuring health outcomes in America using a multivariate approach
Jennifer Fencl - Cone Health SystemIntra-Operative Skin Prep: Is There a Difference? A Retrospective Review
Parallel Session 3A: EUC Alexander RoomClinical Trials: Less Discussed IssuesChair: Heejung Bang UC DavisSaturday, October 11, 5:20 - 7:20
Russell Reeve QuintilesCritique of Trends in Phase II Trials
Guochen Song- QuintilesAssess the Uncertainty of Probability of Success in Phase III Trial after Phase II Data
Sonia Davis UNC Chapel HillTime to Treatment Discontinuation as a Clinical Trial Outcome
Martin Ho FDASimulation for Designing Medical Device Trials
Gina-Maria Pomann - North Carolina State UniversityCase-Control Sampling for Brain Imaging and Enhancement Prediction
Parallel Session 3B: EUC Joyner RoomMining Text NetworksChair: David Banks Duke UniversitySaturday, October 11, 5:20 - 7:20
Christine Chai - Duke UniversityPre-analysis of Text Data
Christoph Hellmayr Duke UniversityBayesian Models for Text Networks
Shaobo Han Duke UniversityDiscovering Dynamic Topics in Time Stamped Documents
David Banks Duke UniversityAnalysis of a 2012 Political Blog Network
30

Parallel Session 3C: EUC AuditoriumDesign and Analysis of ExperimentsOrganizer: Manohar Aggarwal, University of MemphisChair: John Morgan, Virginia TechSaturday, October 11, 5:20 - 7:20
Sanjoy Sinha - Carleton University, CanadaOptimal Designs for Generalized Linear Mixed Models
Miriam Tamm - University Hospital RWTH Aachen, GermanyChronological Bias Caused By Unobserved Time Trends in Randomized Clinical Trials
Linwei Hu - University of GeorgiaOptimal Designs for Multi-Covariate Generalized Liner Models
Hai Ying Wang - University of New HampshireOptimal Algorithms for Logistic Regression with Big Data
Ramesh K. Budhraja - S. V. College, University of Delhi, IndiaFractional Factorial Designs with some Linear Trend Free Effects using Linear Codes
Parallel Session 3D: EUC Kirkland roomAdvances in Mathematical and Statistical EcologyChair: Richard Smith, SAMSI & UNC Chapel HillSaturday, October 11, 5:20 - 7:20
Christopher Strickland SAMSI & UNC Chapel HillModeling Savanna Water Resource Dynamics with Stochastic Daily Rainfall
Kimberly Kaufeld SAMSI & North Carolina State UniversityA Spatio-Temporal Model for Predicting Bark Beetle Damage
Daniel Taylor-Rodriguez SAMSI & Duke UniversityIntrinsic-objective Bayes Variable Selection for Site-Occupancy Models
Richard Smith SAMSI & UNC Chapel HillMathematical and Statistical Ecology Program at SAMSI - Research Opportunities
Parallel Session 3E: EUC Dogwood RoomEconometric Methods in StatisticsChair: Manuel L. Esquıvel - New University of LisbonSaturday, October 11, 5:20 - 7:20
Sujit Ghosh - SAMSI & North Carolina State UniversityA Computationally Efficient Flexible Observed Factor Model with Separate Dynamics for the Factor Volatil-ities and Correlation Matrix
Barry Goodwin - North Carolina State UniversityModeling Dependence in Pricing Risk
Prajneshu Indian Agricultural Statistics Research Institute, New DelhiAutoregressive-Stochastic Volatility with Threshold Nonlinear Time-Series Model
Priya Kohli Connecticut CollegeClustering Financial Time Series: A Polyspectral SLEX Approach
Parallel Session 3F: EUC Maple RoomBig Data Challenges
31

Co-Chairs: Rajeev Agrawal - North Carolina A&T State UniversityAshok Kumar, Kentucky State UniversitySaturday, October 11, 5:20 - 7:20
Rajeev Agrawal - North Carolina A&T State UniversityA Layer Based Architecture for Provenance in Big Data
Anirudh Kadadi - North Carolina A&T State UniversityChallenges of Data Integration and Interoperability in Big Data
Christopher Nyamful - North Carolina A&T State UniversityBig Data Storage and Management
Chitra Reddy Musku UNCGEvaluation of Low-Dimensional Structures in High-Dimensional Twitter Data
Parallel Session 3G: EUC Sharpe RoomSampling MethodsChair: Breda Munoz RTI InternationalSaturday, October 11, 5:20 - 7:20
Rita Sousa New University of Lisbon, PortugalImproved Mean Estimation Using Auxiliary Information in Stratified Sampling
Anu Chhabra University of DelhiModified Optional Unrelated Question RRT Models
Zaheen Khan - Federal Urdu University of Arts, Science and Technology, Islamabad, PakistanCircular and Diagonal Circular Systematic Sampling in the Presence of Linear Trend
Parallel Session 4A: EUC Alexander RoomDynamic Treatment Regimes and Sequentially Randomized TrialsChair: Abdus Wahed, University of PittsburghOctober 12, Sunday, 1:50 - 3:50
Eric Laber - North Carolina State UniversityFunctional Feature Construction for Personalized Treatment Regimes
Yichi Zhang - North Carolina State UniversityInterpretable Optimal Treatment Regime Using Decision Lists
Jonathan Hibbard - University of North Carolina - Chapel HillThe Liberti Trial for Discovering A Dynamic Treatment Regimen in Burn Scar Repair
Abdus S. Wahed - University of PittsburghSMART Estimators for SMART Studies
Jerry Q. Cheng - Rutgers UniversityUsing Bootstrap Methods to Estimate Mean Survival Time in Clinical Trials
Parallel Session 4B: EUC AuditoriumDesign and Analysis of ExperimentsOrganizer: Manohar Aggarwal, University of MemphisChair: C. S. Cheng - Institute of Statistical Science, Academia Sinica & UC BerkeleyOctober 12, Sunday, 1:50 - 3:50
Wei Zheng - Indiana University Purdue University Indianapolis
32

Universally optimal designs for two Interference Models
Nutan Mishra - University of South AlabamaOptimality of Variance Balanced Designs and Their Constructions
Dursun Bulutoglu - Air Force Institute of Technology, Dayton, OHFinding the Symmetry Group of a Linear Program for Enumerating Orthogonal Arrays
Weng Kee Wong, UCLAMultiple-Objective Optimal Designs for the 4-Parameter Logistic Model
Satoshi Aoki - Kagoshima University, JapanSampling Fractional Factorial Designs by Markov Basis
Parallel Session 4C: EUC Kirkland RoomClinical Trials/BiostatisticsOrganizer: Sudhir Gupta Northern Illinois UniversityChair: Xiao Qiang Xue, QuintilesOctober 12, Sunday, 1:50 - 3:50
Xiao Qiang Xue, QuintilesOptimal Design of Clinical Trials with Randomly Censored “Time-To-Event” End Points
Yingqi Zhao - University of Wisconsin MadisonEfficient Augmentation and Relaxation Learning for Treatment Regimes Using Observational Data
Nicholas Meyer - North Carolina State UniversityAn Adaptive Decision Making Algorithm To Manage the Spread of a Disease over a Network
Yunro Chung - University of North Carolina Chapel HillStatistical Challenges in Investigating the Effect of Busulfan Delivered by Targeted Pharmacokinetics inPhase I Oncology Trial
Sudip Roy - University of Texas at San AntonioAutoregressive Methodology in Detection of Irregular Spiking Activity in Neurons
Parallel Session 4D: EUC Maple roomHigh Dimensional Time Series Data AnalysisChair: Xiaoli Gao UNCGOctober 12, Sunday, 1:50 - 3:50
Kei Hirose - Osaka University, JapanPenalized Likelihood Factor Analysis
Ying-Ju Chen - Bowling Green State UniversityJackknife Empirical Likelihood Based Detection Procedure for Change-Point in Mean Residual Life Functions
Kun Chen - University of ConnecticutOn Some Low-Rank Models in Multivariate Time Series Analysis
Elizabeth M. Sweeney - Johns Hopkins Bloomberg School of Public HealthAnalysis of Multi-sequence Time Series Data from MS Lesions on Structural MRI
Parallel Session 4E: EUC Sharpe RoomSampling Theory and MethodsChair: Javid Shabbir Quaid-I-Azam University, Islamabad, PakistanOctober 12, Sunday, 1:50 - 3:50
33

Javid Shabbir Quaid-I-Azam UniversityOn a Generalized Class of Mean Estimators in Survey Sampling
G. N. Singh Indian School of Mines, DhanbadImproved Exponential Methods Of Imputation In Estimation Of Current Population Mean In Two-OccasionSuccessive Sampling
Geeta Kalucha University of Delhi, IndiaA Regression Estimator for Finite Population Mean of a Sensitive Variable
Jeong Sihm UNCGA Modified Binary Optional RRT Model
Parallel Session 4F: EUC Joyner RoomTeaching & Research Innovations for UndergraduatesOrganizers: Jan Rychtar (UNCG),Kumer Pial Das (Lamar University), andMeenakshi Prajneshu (University of Delhi)October 12, Sunday, 1:50 - 3:50
Chad Awtrey- Elon UniversityOne Approach to Researching, Presenting, and Publishing with Undergraduate Pure Math Majors
Jan Rychtar UNCGMentoring Interdisciplinary Research Projects
Meenakshi Prajneshu Deshbandhu College, University of DelhiUndergraduate Research at Delhi University, India: An Overview
Kumer Pial Das Lamar UniversityStudent Views on the Value of Undergraduate Research
Hyunju Oh Bennett College, GreensboroCo-Directing from Two Institutions for the National Research Experience for Undergraduates Program
Ashok Kumar - Kentcuky State UniversityQuantitative Analysis of Effectiveness of Teaching an Online Vs In-Class Course
Parallel Session 4G: EUC Dogwood RoomCluster-Based Statistical Methodologies in Community-Based InterventionsOrganizer: Roy T. Sabo - Virginia Commonwealth UniversityOctober 12, Sunday, 1:50 - 3:50
Robert E. Johnson - Vanderbilt UniversityCluster-Based Methodologies in Community-Based Interventions: An Overview
Scarlett Bellamy - University of PennsylvaniaRandomization Challenges in Couple-Based Randomization Trials: An Application to a Couple-Based, Clus-tered HIV Behavioral Modification Intervention Study
Roy T. Sabo - Virginia Commonwealth UniversityUsing Meta-Analysis to Obtain Desired Random Effect Structures in Cluster-Randomized Studies
N. Rao Chaganty Old Dominion UniversityLikelihood Model and Parameter Estimation for Clustered Ordinal Data
34

Abstracts of the talks
A Layer Based Architecture for Provenance in Big DataRajeev AgrawalNorth Carolina A & T State [email protected]
Coauthors: Ashiq Imran
Big data is a new technology wave that makes the world awash in data. Various organizations accumulatedata that are difficult to exploit. Government databases, social media, healthcare databases etc. are theexamples of that Big data. Big data covers absorbing and analyzing huge amount of data that may haveoriginated or processed outside of the organization. Data provenance can be defined as origin and processof data. It carries significant information of a system. It can be useful for debugging, auditing, measuringperformance and trust in data. Data provenance in big data is relatively unexplored topic. It is necessaryto appropriately track the creation and collection process of the data to provide context and reproducibility.In this paper, we propose an intuitive layer based architecture of data provenance and visualization. Inaddition, we show a complete workflow of tracking provenance information of big data.
Big Data, Big Bias, Small Surprise!S. Ejaz AhmedBrock University, [email protected]
Coauthors: Xiaoli Gao - UNC Greensboro
In high-dimensional statistics settings where number of variables is greater than observations, or whennumber of variables are increasing with the sample size, many penalized regularization strategies were studiedfor simultaneous variable selection and post-estimation. However, a model may have sparse signals as well aswith number predictors with weak signals. In this scenario variable selection methods may not distinguishpredictors with weak signals and sparse signals. The prediction based on a selected submodel may not bepreferable in such cases. For this reason, we propose a high-dimensional shrinkage estimation strategy toimprove the prediction performance of a submodel. Such a high-dimensional shrinkage estimator (HDSE)is constructed by shrinking a ridge estimator in the direction of a candidate submodel. We demonstratethat the proposed HDSE performs uniformly better than the ridge estimator. Interestingly, it improvesthe prediction performance of given candidate submodel generated from most existing variable selectionmethods. The relative performance of the proposed HDSE strategy is appraised by both simulation studiesand the real data analysis.
A New Estimator of The Population Mean: An Application to Bioleaching StudiesAmer Ibrahim Al-OmariAl al-Bayt University, Jordanalomari [email protected]
Coauthors: Carlos N. Bouza, Dante Covarrubias, Roma Pal
In this paper, multistage balanced groups ranked set samples (MBGRSS) method is considered for esti-mating the population mean for samples of size where is a real integer. The MBGRSS is compared with thesimple random sampling (SRS) and ranked set sampling (RSS) schemes. It turnout that for the symmetricdistributions considered in this study, the MBGRSS estimator is unbiased estimator of the population meanand it is more efficient than SRS and RSS methods based on the same number of measured units. In addi-tion, the efficiency of MBGRSS is increasing in s for fixed value of the sample size, where s is the numberof stages. For non symmetric distributions considered in this paper, the MBGRSS estimator is biased. Themethods is applied in a study of bioleaching. It appeared as more efficient than RSS and SRS.
35

Spatial Population Structure Affects the Rate of Neutral SubstitutionBenjamin AllenEmmanuel [email protected]
Coauthors: Christine Sample, Yulia A. Dementieva, Ruben Medeiros, Christopher Paoletti, and Martin A.Nowak
Over time, a population acquires neutral genetic substitutions as a consequence of random drift. Afamous result in population genetics asserts that the rate, K, at which these substitutions accumulate inthe population coincides with the mutation rate, u, at which they arise in individuals: K = u. This identityenables genetic sequence data to be used as a “molecular clock” to estimate the timing of evolutionaryevents. While the molecular clock is known to be perturbed by selection, it is thought that K = u holds verygenerally for neutral evolution. Here we show that asymmetric spatial population structure can alter themolecular clock rate for neutral mutations, leading to either K < u or K > u. Deviations from K = u occurbecause mutations arise unequally at different sites and have different probabilities of fixation depending onwhere they arise. If birth rates are uniform across sites, then K ≤ u. In general, K can take any valuebetween 0 and Nu. Our model can be applied to a variety of population structures. In one example, weinvestigate the accumulation of genetic mutations in the small intestine. In another application, we analyzeover 900 Twitter networks to study the effect of network topology on the fixation of neutral innovations insocial evolution.
Sampling Fractional Factorial Designs by Markov BasisSatoshi AokiKagoshima University, [email protected]
Fractional factorial designs of several controllable factors are also expressed as binary contingency tables,i.e., the contingency tables whose entries are the indicator functions of the designs. For given marginal totalsof the binary contingency tables, Markov chain can be constructed by Markov basis. This approach is firstintroduced by Fontana, Rapallo and Rogantin (2013) for the saturated designs. In this paper, we considersampling methods of fractional factorial designs by Markov basis of the binary contingency tables. Becausethe entries of the binary contingency tables are 0 or 1, the results on the Markov basis of the bounded tablesis important. In this paper, we show the fundamental results on the relations between the marginal totals,confoundings and regular fractional factorial designs.
One Approach to Researching, Presenting, and Publishing with Undergraduate Pure MathMajorsChad AwtreyElon [email protected]
The goal of this talk is to describe the speaker’s recent collaborations with undergraduates on projectsrelated to computational Galois theory. Included are discussions of the following: recruiting students, fundingsources, dissemination outlets, a description of a recent project, and a summary of students’ achievementsand post-baccalaureate plans.
36

Text Mining in Dynamic Blog NetworksDavid BanksDuke [email protected]
Many applications (the Internet, Wikipedia) concern networks of documents. We mine the corpus thatconsists of all U.S. political blog posts in 2012. The intent is to use recent advances in dynamic networkmodeling to improve the topic discovery, and recent research on text mining to improve the network modeling.We describe an analysis based on the subset of blog posts that concern the shooting of Trayvon Martin, andthen a full analysis of the entire corpus, at a lower level of resolution.
Randomization Challenges in Couple-Based Randomization Trials: An Application to a Couple-Based, Clustered HIV Behavioral Modification Intervention Study.Scarlett BellamyUniversity of [email protected]
We present an algorithm for randomizing units in blocks/clusters for controlled trials when the compo-sition of blocking factors is not known in advance. For example, suppose the desired goal of an interventionstudy is to randomize units to one of two interventions while blocking on a dichotomous factor (e.g., gender),but the total number of units, and therefore number or composition, of males and females among thoseunits assembled for randomization cannot be determined in advance. This situation arises in randomizedtrials when subjects are scheduled to be randomized as a group, but not all of the subjects show up for thevisit. Since investigators do not know which of the scheduled subjects will or will not show up, a dynamicrandomization scheme is required to accommodate the unknown composition of the blocking factor once agroup of subjects (units) is assembled for randomization. These settings are further complicated when thereis more than one blocking factor. In this paper, we present an algorithm that ensures the integrity of therandomization process in these settings.
Bayesian Estimation in Differential Equation ModelsPrithwish BhaumikNorth Carolina State [email protected]
Coauthors: Subhashis Ghosal (North Carolina State University)
Ordinary differential equations (ODEs) are used to model dynamic systems appearing in engineering,physics, biomedical sciences and many other fields. These equations contain unknown parameters, say θ ofphysical significance which have to be estimated from the noisy data. Often there is no closed form analyticsolution of the equations and hence we cannot use the usual non-linear least squares technique to estimatethe unknown parameters. There is a two step approach to solve this problem, where the first step involvesfitting the data nonparametrically. In the second step the parameter is estimated by minimizing the distancebetween the nonparametrically estimated derivative and the derivative suggested by the system of ODEs.The statistical aspects of this approach have been studied under the frequentist framework. We consider thistwo step estimation under the Bayesian framework. The response variable is allowed to be multidimensionaland the true mean function of it is not assumed to be in the model. We induce a prior on the regressionfunction using a random series based on the B-spline basis functions. We establish the Bernstein-von Misestheorem for the posterior distribution of the parameter of interest. Interestingly, even though the posteriordistribution of the regression function based on splines converges at a rate slower than n−1/2, the parametervector θ is nevertheless estimated at n−1/2 rate.
37

CATL Methods and Robust Credibility: A Study Using Hachemeister’s DataVytaras BrazauskasUniversity of [email protected]
Coauthors: Harald Dornheim (KPMG Switzerland)
Two recent papers by Dornheim and Brazauskas (2011a,b) introduced a new likelihood-based approach forrobust-efficient fitting of mixed linear models and showed that it possesses favorable large- and small-sampleproperties which yield more accurate premiums when extreme outcomes are present in the data. In particular,they studied regression-type credibility models that can be embedded within the framework of mixed linearmodels for which heavy-tailed insurance data are approximately log-location-scale distributed. The newmethods were called corrected adaptively truncated likelihood (CATL) methods. In this talk, we build uponthat work and further explore how CATL methods can be used for pricing risks. For illustrative purposes,we use a well-studied Hachemeister’s data of bodily injury claims. The process of outlier identification, theensuing model inference, and related issues are thoroughly investigated on the featured data set. Performanceof CATL methods is compared to that of other robust regression credibility procedures.
The Dynamics of Offensive Messages in the World of Social MediaAida [email protected]
Coauthors: Krystal Blanco, Javier Tapia, Andrea Steele, John McKay, Sherry Towers, Kamuela Yong
The 21st century has redefined the way we communicate, our concept of individual and group privacy,and the dynamics of acceptable behavioral norms. The messaging dynamics on Twitter, an internet socialnetwork, has opened new ways/modes of spreading information. As a result, cyberbullying or in general,the spread of offensive messages, is a prevalent problem. The aim of this report is to identify and evaluateconditions that would dampen the role of cyberbullying dynamics on Twitter. We present a discrete-timenon-linear compartmental model to explore how the introduction of a Quarantine class may help to hinderthe spread of offensive messages. We based the parameters of this model on recent Twitter data relatedto a topic that communities would deem most offensive, and found that for Twitter a level of quarantinecan always be achieved that will immediately suppress the spread of offensive messages, and that this levelof quarantine is independent of the number of offenders spreading the message. We hope that the analysisof this dynamic model will shed some insights into the viability of new models of methods for reducingcyberbullying in public social networks.
Consulting: The Good, The Bad, and The UglyJason BrinkleyEast Carolina [email protected]
It is often the case that statisticians find large deviations from statistical theory and unique problems inthe world of statistical consulting. Consultants routinely deal with a wide range of clients who have varyingdegrees of statistical acumen and mathematical capacity. This talk will highlight a series of case studies ofreal life incidents where consulting clients have clearly deviated from the traditional textbook data collectionand analysis. What happens when physicians decide upon themselves to violate the protocol of a clinicalstudy? How does a analyst deal with survey data when seemingly unnecessary questions are answered withsurprising results? How do you do analysis when the outcome of interest is in fact missing data? These arejust a some of the examples of daily issues that present to the consulting statistician who must manage boththe use and misuse of statistics.
38

Statistical Consulting - Panel DiscussionJason BrinkleyEast Carolina [email protected]
Coauthors: Emily Griffith (NCSU) Eric Vance (Virginia Tech) Julia Sharp (Clemson) Scott Richter (UNCG)Rishi Chakraborty (USC)
Consulting in the Academic Setting - Panel discussion among 6 universities.
Asymmetric Games in Monomorphic and Polymorphic PopulationsMark BroomCity University London, [email protected]
Coauthors: Jan Rychtar, University of North Carolina at Greensboro
Evolutionary game theory is an increasingly important way to model the evolution of biological popula-tions. Many early models were in the form of matrix games, or bi-matrix games in asymmetric situationswhen individuals occupy distinct roles within the contest, where rewards are accrued through independentcontests against random members of the population. More recent models have not had the simple linearproperties of matrix games, and more general analysis has been required. In this talk we consider a generalanalysis of asymmetric games, comparing monomorphic and polymorphic populations. We are particularlyinterested in situations where the strategies that individuals play influence which role that they occupy, forexample in a more realistic variant of the classical Owner-Intruder game. We both show general results andconsider specific examples to illustrate the difficulties of these more complex games.
Fractional Factorial Designs with some Linear Trend Free Effects using Linear CodesRamesh K. BudhrajaUniversity of Delhi, [email protected]
The paper presents a simple method to construct fractional factorial designs with s levels(s� 2) havingsome linear trend free effects (main and two factor interactions) using the parity check matrices of linearcodes. Further, the method is used to generate the blocked fractional factorial and mixed fractional factorialdesigns with some linear trend free effects.
39

Likelihood Model and Parameter Estimation for Clustered Ordinal DataRao N. ChagantyOld Dominion [email protected]
Coauthors: Dr. Raghavendra Kurada (SAS Institute) Dr. Roy Sabo (Virginia Commonwealth University)
In this paper we will discuss a latent variable likelihood methodology for clustered ordinal data usingGaussian copula with probit and logit link functions. We derive the score functions and simplified expressionsfor the Hessian matrices, which allow easy computation of the standard errors for the marginal regressionparameter estimates as well as the dependence parameters. Through asymptotic relative efficiency calcula-tions we demonstrate that these likelihood estimators are superior as compared to estimators arising frompreviously established estimating equation approaches. We apply this likelihood-based methodology in ananalysis of two real-life data examples using an R package developed specifically for the likelihood estimation.
Pre-analysis of Text DataChristine ChaiDuke [email protected]
It is now becoming common to analyze text as data. But text requires different kinds of preparation thanis needed for numerical data. This talk describes issues in scraping data from on-line sources, then tokenizingit, and finally n-gramming it. Popular methods for text analysis rely upon bag-of-words models, and thisloses semantic information, especially negation, but proper processing can recover some of this. We alsodescribe methods for reducing the number of tokens, to expedite computation. These ideas are illustratedin the context of mining a corpus of political blogs.
Markov Chain Models for Clinical Trials: Intervention to Reduce Human PapillomavirusInfectionHrishikesh ChakrabortyUniversity of South [email protected]
In randomized clinical trials and comparative studies of recurrent infection, researchers often collectlongitudinal data on disease status of subjects from different groups to compare them and determine theintervention/drug effect. Usually, the comparisons are made with respect to infection rate during follow-up,time to new infection, clearance rate of existing infection, and time to clearance of existing infection. At anyfollow-up visit, an individual may be infected or uninfected, and may maintain or change infection statusin subsequent visits. Researchers often use different survival type models for estimation and comparisonusing a subset of the data. By not using information from all enrolled subjects, they are then prohibitedfrom claiming that the analysis follows the intention-to-treat property. To address this problem, we useda discrete-time two-state homogenous Markov chain model and a time homogeneous multistate continuousMarkov model with related asymptotic distribution to analyze recurrent infection data for an intention-to-treat type analysis. This methodology was used to compare intervention and control groups in a longitudinalHuman Papillomavirus (HPV) trial in Kenya and HPV trial at the University of South Carolina.
40

On Some Low-Rank Models in Multivariate Time Series AnalysisKun ChenUniversity of [email protected]
Coauthors: Kung-Sik Chan
Reduced-rank vector autoregressive (VAR) models are commonly used in analyzing multivariate timeseries data. In practice, finding a subset VAR model that parsimoniously approximates the underlyingprocess could be more important than only determining the VAR order. Moreover, the variable associationcharacterized by the low-rank structure can be refined by incorporating sparse estimation, assuming thateach latent association only involves a subset of the variables and their lags. We thus propose to use asparse and low-rank regularized regression approach to conduct the VAR model analysis, for simultaneousorder selection, rank reduction and variable selection. It is shown that, in the context of stationary time-series data, the proposed approach is able to correctly identify both the rank and the sparse structure withprobability one asymptotically. We also discuss several extensions of low-rank models, regarding robustestimation/outlier detection, functional data and high dimensional inference.
Jackknife Empirical Likelihood Based Detection Procedure for Change-Point in Mean ResidualLife FunctionsYing-Ju ChenBowling Green State [email protected]
Coauthors: Dr. Wei Ning and Dr. Arjun K. Gupta
Mean residual life function is an important function in survival analysis which describes the expectedremaining lifetime given survival time up to a certain age. In this talk, I will introduce the nonparametricmethod based on Jackknife empirical likelihood through U-statistic to test the change point of mean resid-ual life functions of independent random variables. The test statistic and its asymptotic distribution areinvestigated. Monte Carlo Simulations under different lifetime settings are carried out to show the powerperformance and the control of Type I error. The real data example is analyzed to illustrate the testingprocedure.
Minimal Second-Order Saturated DesignsChing-Shui ChengInstitute of Statistical Science, Academia Sinica, and University of California, [email protected]
This conference is about advances in statistics and combinatorics. I shall discuss two related topics,minimal second-order saturated designs and minimal 1-saturating sets in statistical design of experimentsand finite projective geometry, respectively. Under a 2n−p fractional factorial design, in addition to the maineffects, there are 2n−p− 1−n degrees of freedom available for estimating interactions. A design is said to besecond-order saturated (SOS) if all these degrees of freedom can be used to estimate two-factor interactions.An SOS design is minimal if it is no longer SOS whenever an arbitrary factor is deleted. All SOS designscan be obtained by adding factors to minimal ones. Minimal SOS designs are important for studying thestructures and construction of factorial designs and are also useful for constructing space-filing designs forcomputer experiments.
41

Using Bootstrap Methods to Estimate Mean Survival Time in Clinical TrialsJerry Q. ChengRutgers [email protected]
Coauthors: Javier Cabrera and John B. Kostis
In clinical trials, we often need to assess performance of several types of treatments by comparing theiroutcomes. The gain in life expectancy is one of the performance measures of interest because it has a simpleinterpretation. This quantity can be easily estimated by the area between estimated survival curves givenby the treatment and placebo or for two comparative treatments. However, it is not less straightforward toquantify the variability of such an estimate. In this presentation, we use Bootstrap methods to obtain confi-dence intervals and conduct statistical testing. Simulation studies are conducted to evaluate the effectivenessof the methods against the asymptotic results under different scenarios (i.e., sample sizes, censoring rates,bootstrap resampling methods, confidence intervals). We apply the methods to a real clinical trial data set.
Modified Optional Unrelated Question RRT ModelsAnu ChhabraUniversity of Delhi, [email protected]
Coauthors: B. K. Dass, University of Delhi
Sihm et al. (2014) introduced modified Unrelated Question Optional RRT Models for simultaneouslyestimating the mean of a sensitive variable and the sensitivity level of the underlying sensitive questionwithout using a split-sample approach. In this study, we carry that work forward in the context of two-stageRRT models the T-Model proposed by Mangat and Singh (1990) and the F-Model proposed by Mehta etal. (2012). Extensive computer simulations are used to compare efficiencies of the one-stage and two-stageoptional unrelated question RRT models
Some Results on the Optimality of Choice Sets for 2n Factorial DesignsPallavi ChitturiTemple [email protected]
Coauthors: Jing Xiao
Choice-based conjoint experiments are used when choice alternatives can be described in terms of at-tributes. The objective is to infer the value that respondents attach to attribute levels. This method involvesthe design of profiles on the basis of attributes specified at certain levels. Respondents are presented sets ofprofiles called choice sets, and asked to select the one they consider best. Information Per Profile (IPP) isused as an optimality criteria to compare designs with different numbers of profiles. The optimality of con-nected main effects plans based on two consecutive choice sets, Sl, Sl+1 has been examined in the literature.However, the optimality of non-consecutive choice sets has not been examined. In this paper we examine theIPP of both consecutive and non-consecutive choice sets and show that IPP can be maximized under certainconditions. Further, we show that non-consecutive choice sets have higher IPP than consecutive choice setsfor n > 4. Finally, we examine the optimality of connected first-order-interaction designs based on threechoice sets and show that non-consecutive choice sets have higher IPP than consecutive choice sets undercertain conditions.
42

Statistical Challenges in Investigating the Effect of Busulfan Delivered by Targeted Pharma-cokinetics in Phase I Oncology TrialYunro ChungUniversity of North Carolina at Chapel [email protected]
Coauthors: Anastasia Ivanova, Jason P. Fine
For some oncology agents dosing patients according to mg/m2 might lead to high toxicity rates or lowerefficacy and dosing with respect to the area under the curve (AUC) estimated by pharmacokinetic analysisis preferred. We described challenges we encountered in analyzing data from a Phase I trial investigatingBusulfan in patients undergoing allogeneic hematopoietic cell transplantation. The first challenge was model-ing the relationship between relapse free survival, death from relapse and death from other causes and AUC.The Cox regression cannot be used because assumption of independent censoring is violated. Therefore weused a competing risk regression model. The second challenge was to have a flexible model for time to evenas a function of AUC. A natural assumption is that the failure rate is decreasing with AUC. We developeda nonparametric method of estimating the shape restricted hazard function. We illustrate our approachesby analyzing the Phase I Busulfan data.
Game-Theoretic Methods for Functional Response and Optimal Foraging BehaviorRoss CressmanWilfrid Laurier University, [email protected]
Coauthors: Vlastimil Krivan, Joel Brown and Jozsef Garay
The number of prey of a given type consumed by a predator per unit time (i.e. the functional response)depends on the spatial distribution of the prey as well as on the decisions taken by the predator (e.g. whereto search for prey, which type of prey to pursue, whether to attack, etc.) and on the times taken for theseactivities relative to their expected nutritional value gained. I will discuss (i) how this information can beconveniently represented in a tree diagram similar to an extensive form game; (ii) how standard functionalresponses such as Holling II emerge naturally from this setting; (iii) how game-theoretic methods can beused to analyze the optimal foraging strategy of the predator. The methods will be illustrated for classicaldiet choice and patch choice models, including those that involve the effects of simultaneously encounteringdifferent types of prey and of prey recognition effects. They will also be applied to predict equilibriumforaging behavior of a predator population with intraspecific strategies taken from a Hawk-Dove game thatincludes interaction times.
A Bayesian Approach to Incorporating Uncertainty in Record LinkageNicole DalzellDuke [email protected]
Coauthors: Jerry Reiter, Ph.D
Data on a single individual or entity are often available from many different sources. Researchers seekingto combine information from such diverse sources must identify which records in one file correspond to thesame individual in another. The difficulty of this task is compounded when confidentiality concerns mandatethat records are stored without a unique identifier. Record linkage is the process of comparing informationin such de-identified records in order to determine groups of records which correspond to the same entityand create a final linked data set to be used for inference. The linking process is often hindered by thepossibility of errors in the record fields used for comparison. This work presents a Bayesian method forrecord linkage which accounts for potential errors in the linking fields while incorporating the uncertainty of
43
the matching process into inference conducted on the final linked data set. An example with social sciencedata is presented to illustrate the method.
Using Text Mining Methods to Analyze Biomedical DataKumer Pial DasLamar [email protected]
Coauthors: Chelsea Boling
The primary objective of this study is to use two statistical techniques in text mining to discover pat-terns and trends in biomedical literature. Latent Semantic Analysis (LSA) discovers a data representationthat has a lower dimension than the original semantic space by singular value decomposition. Similarly,Non-negative Matrix Factorization (NMF) discovers two non-negative matrices whose product can approx-imate the original matrix. Essentially, both techniques reduce the dimensionality of given data to preservethe most crucial aspects. Selecting an appropriate dimension for a reduced representation maximizes theperformance of an information retrieval system. We illustrate the effectiveness of each method and analyzethe latent relationships of the reduced representation of 3,398 full-text articles in the Open Access subset ofPubMed Central data. By revealing meaningful relationships between terms and documents, the goal is toovercome the problem of unsatisfactory indexed results and to ultimately discover new knowledge based onthe diversification these techniques entail.
Student Views on the Value of Undergraduate ResearchKumer Pial DasLamar [email protected]
Research experience is crucial for an undergraduate students professional and personal development,academic success, and career preparation. Educational Institutions around the country are encouragingand stimulating undergraduate research programs. This study examines student views on the value ofundergraduate research. To understand student views several groups of undergraduate researchers weresurveyed and this talk will provide an insight of the findings.
Construction Of m-Repeated Burst Error Detecting and Correcting Non-Binary Linear CodesB. K. DassUniversity of Delhi, [email protected]
Coauthors: Rashmi Verma University of Delhi, India E-mail: [email protected]
The paper proposes a simple algorithm for constructing a parity-check matrix for any linear code overGF(q) capable of detecting and correcting a new kind of burst error called ‘m-repeated burst error of lengthb or less’ recently introduced by the authors. Codes based on the proposed algorithm have been illustrated.
44

Implementing Personalized Medicine: Estimation of Optimal Dynamic Treatment Regimes.Part I: Statistical Framework and Regression-Based EstimatorsMarie DavidianNorth Carolina State [email protected]
Personalized medicine is focused on making treatment decisions for an individual patient based on his/hergenetic/genomic, clinical, and other characteristics. A popular perspective on achieving this goal is to focuson identifying subgroups of patients sharing certain characteristics who may benefit from a certain treatmentand for whom new, targeted treatments may be developed. Another is based on operationalizing clinicalpractice. Clinicians make a series of treatment decisions over the course of a patient’s disease or disorderbased on accruing information on the patient with the goal of achieving the ”best” possible outcome for thepatient. A dynamic treatment regime is a list of sequential decision rules that formalizes this process. Eachrule corresponds to a key decision point in the disease/disorder progression and takes as input the informationon the patient to that point and outputs the treatment that s/he should receive from among the availableoptions. A key step toward personalized medicine from the perspective of clinical practice is thus identifyingthe optimal dynamic treatment regime, that which would lead to the most favorable outcomes given theinformation available. We describe a statistical framework based on the notion of potential outcomes inwhich the definition of an optimal treatment regime may be formalized. Given data from a clinical trialor observational study, the statistical problem is to estimate an optimal treatment regime, a regime thatleads to the most favorable outcome if followed by all patients in the population. We discuss methods forestimating an optimal treatment regime based on regression modeling. This talk is based on joint work withBaqun Zhang, Phillip Schulte, Eric B. Laber, and Anastasios A. Tsiatis.
Time to Discontinuation as a Primary Outcome in Clinical TrialsSonia DavisUniversity of North [email protected]
Clinical trials of neuroscience indications often have markedly high rates of early patient discontinua-tion. Statistical methods to compare treatment groups for traditional outcomes in the face of missing datahave become more developed in the past decade, yet high rates of patient discontinuation pose substantialcomplications for addressing bias and interpreting results. As an alternate strategy to address high dropoutrates, we present time to all-cause treatment discontinuation (TTD) as a primary clinical trial outcome. Weevaluate the benefits and drawbacks of TDD, and identify indications where is it well suited. Results fromthe CATIE study of antipsychotics for schizophrenia are used as an illustrative example. Time to discontin-uation for lack of efficacy, intolerability, and patient decision are also explored. All-cause discontinuation isfurther contrasted with Treatment Failure.
A-Optimal and A-Efficient Designs for Discrete Choice ExperimentsAngela DeanThe Ohio State [email protected]
Coauthors: Fangfang Sun
Discrete choice experiments are used widely in areas such as marketing, city planning, and medicalcare, etc., for the purpose of determining consumer preference to products and services. In a forced choiceexperiment, respondents are shown choice sets of options or profiles. The profiles represent a selection ofproducts or services and are made up of a number of attributes (factors) at various levels and are similar totreatment combinations in a factorial experiment. Each respondent is asked to select their most preferredprofile from each choice set. In- formation about the choices made can be used to infer the effects of the
45

individual attribute levels on consumer preference as well as interactions. In turn, this attribute informationcan be used in the future to design new products more tailored to the population requirements. In this talk,the multinomial logit model (MNL) is used to model the probability that a particular option is chosen froma given finite choice set. The systematic component of the utility of each option is modelled in terms ofparameters representing the main effects and interactions of the attributes. An A-optimal design is one whichminimizes the variance of the contrasts of interest of these parameters. Since the MNL model is a non-linearmodel, the optimal design despends upon the parameter values. A common approach is to construct designsfor the particular case of equally attractive options. For this case, a lower bound is derived for the A-valueof a discrete choice design. Some examples of designs acheiving the lower bound are given. For situationswhen the bound cannot be achieved, and when a complete search for the optimal design is not feasible, themodel is linearized and a factor loading approach is taken to suggest options that should be included in achoice set. It is shown that this approach leads to highly A-efficient designs. This approach can be extendedto construction of designs under the assumption of unequally attractive options.
Non-Negative Matrix Factorization Algorithms for Heteroscedastic DataKarthik DevarajanTemple University Health [email protected]
Coauthors: Vincent C.K. Cheung, McGovern Institute for Brain Research, Massachusetts Institute of Tech-nology, Cambridge, MA
Non-negative matrix factorization (NMF) is a powerful machine learning method for decomposing a high-dimensional non-negative matrix V into two non-negative matrices W and H such that V = WH + e wheree is error. It has been success fully applied in the analysis and interpretation of large-scale data arisingin computational biology, neuroscience and natural language processing, among other areas. A distinctivefeature of this approach is its non-negativity constraints that allow only additive linear combinations ofthe data, thus enabling it to learn parts that have distinct physical representations in reality. Most of themethodological developments in NMF have ignored the heteroscedastic nature of the data observed in thesediverse fields. We present an information-theoretic approach to NMF for modeling data exhibiting signal-dependent noise and discuss its connections to generalized linear models. We develop algorithm-specificmeasures for evaluating the performance of the proposed methods. Our methods are demonstrated usingdata from high-throughput genomics, text-mining and electromyography studies in the context of dimensionreduction, and compared with existing methods.
Modeling Multimodal Healthcare Big DataQuan DoNew Mexico State Universityquando@nmsu
Coauthors: Son Tran - New Mexico State University and Venkat Gudivada - Marshall University
Healthcare data satisfies all the five attributes of Big Data. It is voluminous, heterogeneous, every dayadds data in the order of gigabytes to terabytes, data undergoes transformation due to various businessesprocesses, and hospital and healthcare providers depend on this data for operational and strategic decisionmaking. In the talk, we provide a critical evaluation of existing data representation schemes for modelinghealthcare data. Our evaluation includes Relational, Column Relational, RDF Stores, Native XML, Object-oriented, Search Engine-based, Key-Value, Column-oriented, Document-oriented, Graph, NewSQL, CMS,Multivalue, and Navigational models. We will also discuss our preliminary work on data representationscheme that is specifically suited to address the needs of healthcare Big Data.
46

Sufficient Dimension Reduction with Multivariate ResponsesYuexiao DongTemple [email protected]
Coauthors: Zhou Yu, Liping Zhu
Existing methods for sufficient dimension reduction (SDR) with multivariate responses, such as projec-tion resampling sliced inverse regression, have two limitations. First, the slicing based methods rely onselecting the slicing scheme, and different slicing could lead to different estimation results. Second, it can becomputationally intensive as a large number of random projections of the multivariate response is needed inpractice. To address such limitations, we propose a novel method for SDR with multivariate response whichutilizes the distance between the distinct responses. In the challenging case of p > n, our proposal naturallyleads to a novel feature screening method for multivariate response.
Bayesian Inference on Populations of NetworksDavid DunsonDuke [email protected]
Coauthors: Daniele Durante and Joshua Vogelstein
In connectomic applications, a network of inter-connections in the brain is collected for each patient inthe study. Interest focuses on characterizing variability among individuals, and how individuals in differentgroups (eg., according to mental health status) vary in their connection structure. Current methods focus onreducing network data to features prior to statistical analysis, while we propose a fully generative and flexibleBayesian nonparametric approach for modeling the population distribution of network-valued data. Theapproach is based on mapping the binary adjacency matrix within each brain to a latent space, conducting aflexible low-rank matrix factorization in this space, and then using Dirichlet process priors for the distributionof individual-specific components in this factorization. The formulation is provably flexible, and leads toa simple and computationally efficient Gibbs sampler. We discuss properties, illustrate the performance insimulations, and consider an application to brain network data in relation to covariates.
Prevention of Hospital Acquired Pressure Ulcers in an Operating Room SettingDawn EngelsCone [email protected]
Coauthors: Melody Austin, Laurie McNichol, Jennifer L. Fencl, Sat Gupta, and Haseeb Kazi
Prevention of hospital acquired pressure ulcers (HAPU) is an important quality measure since this isconsidered a never event. Literature suggests pressure ulcer prevalence occurs at a rate of 8.5% or higheramong patients who undergo surgical procedures that last longer than three hours. The purpose of this studywas to determine what factors might contribute towards the development of pressure ulcers in patients thathave been to the Operating Room. (OR) This project entailed a retrospective chart review after surgicalprocedures were performed. The sample population included patients who obtained a pressure ulcer thatwas not present upon admission and which was noted during their post-operative hospital stay. The studyrevealed consistent risk factors which may contribute towards the development of pressure ulcers in patientsthat have been to the OR. These findings can drive implementation of preventative interventions to reducethe occurrence of HAPU associated with surgical procedures.
47

Market Liquidity as a Probability or as a Stochastic ProcessManuel L. EsquvelNew University of Lisbon, FCT, Department of Mathematics, Quinta da [email protected]
Coauthors: P. P. Mota
Motivated by the needs of risk analysis we introduce and study some alternative notions of liquidity forfinancial products.
Intra-Operative Skin Prep: Is There A Difference? A Retrospective ReviewJennifer L. FenclCone [email protected]
Surgical Site Infections (SSI) are the most common type hospital acquired infections in the surgicalpopulation with nearly 750,000 occurring annually. An individuals risk for dying is 11 times greater with theoccurrence of an SSI. Additionally, SSIs increase length of stay by 7-31 days per event resulting in 1.6 billiondollars in cost for treatment. Hospitals are challenged to evaluate current practices to decreases SSI. Thepurpose of this project was to identify which intra-operative prepping solution utilized in our health networkfor adult open abdominal surgical procedures had the lowest incidence of SSI 30-days post-operatively. Weperformed a retrospective medical record of consecutive patients age 18 years and older undergoing electiveopen abdominal procedures at four acute care, community hospitals within an integrated tertiary healthnetwork in the Southeastern US from December 2008-December 2010. What we found out, procedures usingPCMX intra-operative solution (n = 71) resulted in no SSI, while procedures that used other preppingsolutions (CHG, povidone-iodine, and iodine-base with alcohol) (n=91) resulted in five SSIs. Chi-square testindicated a significant difference in the incidence of SSI among PCMX intra-operative prep solution whencompared to the other solutions in open abdominal surgical procedures ( 2 = 4.025 (1, 162), p = 0.045).Research on this subject acknowledges an appropriate and effective surgical skin antiseptic plays a vital rolein the prevention of devastating post-operative infections. By staying abreast of research and understandingthe advantages and disadvantages of available surgical skin antiseptics, peri-Operative registered nurses areable to make informed recommendations
Examining Neurosurgical Surgical Site InfectionsJennifer L. FenclCone [email protected]
Coauthors: Felecia G. Wood, Debbie Green, Sat Gupta, Vangela Swofford, Melissa Morgan
The objective of this study was to analyze surgical site infection (SSI) risk factors for spinal surgery, anthen develop an SSI risk assessment tool considering both pre- and intra-operative risk factors to identifypatients at highest risk to develop an infection. We did this by utilizing a retrospective cohort study applyingsimilar methodology as discussed in previous studies focusing on neurosurgery spinal SSI. The setting wasan acute care hospital in the southeastern United States performing approximately 13,217 surgical cases peryear with approximately 2579 of those being neurosurgical spinal cases. Study subjects included patientswho developed a SSI after a neurosurgery spinal procedure as defined by the Center for Disease Controland Prevention (case patient) and randomly selected non-infected patients (match control patient) whounderwent a neurosurgery spinal procedure during the same timeframe as the case patient (June 2012-June2013). Patients were matched based on type of surgery and Anesthesiologists (ASA) score. We used aretrospective chart review using an investigator-developed drill down tool reflecting specific risk factors forSSI identified in the literature for the neurosurgery spinal population. We found that the strongest predictorof SSI was the type of intra-operative prepping solution utilized (p= .009) and how skin closure occurred (p=
48

.006). In addition, the placement of drains (p= .001), misappropriate antibiotic administration (p=.026),and if glue utilized to repair dural tears (p = .041) also demonstrated an increased risk of developing a SSI.This study suggests that healthcare organizations must proactively take measures to identify patients athighest risk for poor outcomes and thoughtfully implement standardization to improve care, which needs toinclude assessment of intraoperative risk factors.
Robust Feature Selection with Fussy Group InformationXiaoli GaoUniversity of North Carolina at Greensborox [email protected]
In high-dimensional data analysis, grouping information may behave as a double-edged sword and havethe potentiality of damaging the feature selection efficiency if fussy grouping information is incorporated. Inthis paper, we propose a robust alternative to existing group LASSO approach when the assumed groupingstructure is flawed. Some small sample simulation studies and real data analysis will be conducted todemonstrate the advantage of the proposed approach.
Finding the Symmetry Group of a Linear Program for Enumerating Orthogonal ArraysDursun Bulutoglu and Andrew GeyerAAir Force Institute of [email protected]
For a given LP (linear program) the set of all permutation of its variables that send feasible points tofeasible points was defined by Margot (2010) to be the symmetry group of the LP denoted by GLP . Margot(2010) described a method for computing the GLP of an LP with only inequality constraints. His methodfinds a subgroup of the GLP when the LP has equality constraints. We will discuss a method for findingthe GLP of an LP that also has equality constraints. We will also discuss two different (integer linearprogramming) ILP formulations of the orthogonal array problem and the GLP s of their corresponding LPrelaxations.
A Computationally Efficient Flexible Observed Factor Model with Separate Dynamics for theFactor Volatilities and Correlation MatrixSujit GhoshNorth Carolina State University & [email protected]
Coauthors: Yu-Cheng Ku and Peter Bloomfield
Multivariate stochastic volatility (MSV) models have become important tools in financial econometrics,largely due to the successful utilization of Markov chain Monte Carlo (MCMC) methods. Recent develop-ments in the MSV literature focus on dimension reduction via factor analysis, given that the complexityof computation and the difficulty in model interpretation drastically increase as the dimension of data in-creases. In order to obtain a flexible yet computationally efficient procedure, we propose a MSV structurewith separate dynamics for the volatilities and the correlation matrix. The correlation matrix of the factorsis allowed to be time varying, and its evolution is described by an inverse Wishart process. The proposedMCMC method is shown to have some major advantages compared to existing methods for similar models inthe literature. For numerical illustrations, we compare the proposed model with other similar multivariatevolatility models using Fama-French factors and portfolio weighted return data. The result shows that ourmodel has better predictive performance and computationally more stable.
49

Modeling Dependence in Pricing RiskBarry K. GoodwinNorth Carolina State [email protected]
As empirical scientists, we have come to define dependence largely in linear terms, typically representedby correlation or linear regression parameters. Galton introduced the notion of linear correlation in 1885and this narrow idea of dependence has dominated our thinking since. Dependence is a much broaderconcept than this, however, and it is key to understanding multivariate ordering and modeling. The properrepresentation of dependence has significant implications in economic models of risk. Insurance contractstypically consider multiple dependent sources of risk. Reinsurance portfolios and the pricing of derivativeinstruments also depend heavily on the relationships among multiple dependent sources of risk. This paperreviews the implications of dependence for the pricing of risks. Tail-dependence, state-dependence, andnonlinear functional relationships are considered within the general context of copulas. Examples taken fromthe pricing of revenue insurance contracts are discussed. The implications of small samples and samplingvariability in the precision of model estimates are also developed.
Robust Mixtures of Factor Analyzers via the Trimming ApproachFrancesca GreselinUniversity of Milano-Bicocca, [email protected]
Coauthors: Luis Angel Garcia-Escudero, Alfonso Gordaliza, Salvatore Ingrassia and Agustin Mayo-Iscar
Mixtures of Gaussian factors are powerful tools for modeling an unobserved heterogeneous population,offering - at the same time - dimension reduction and model-based clustering. Unfortunately, the highprevalence of spurious solutions and the disturbing effects of outlying observations, along maximum likeli-hood estimation, open serious issues. In this paper we complement model estimation with restrictions forthe component covariances and trimming, to provide robustness to violations of normality assumptions ofthe underlying latent factors. A detailed AECM algorithm, which enforces constraints on eigenvalues andtentatively discards outliers at each step, is also presented. In the new setting, under mild conditions onthe underlying distribution, the existence of the solution for the population and sample problems can beobtained, as well as the consistency of the sample estimator to the population parameter. Properties of theestimators are evaluated through MonteCarlo experiments and compared to the estimators from the classicalmodel. Results from the analysis a a real dataset are presented.
Playing in Everyones Backyard: Statistical Consulting in the SciencesEmily H GriffithNorth Carolina State Universityemily [email protected]
Playing in everyones backyard (apologies to John Tukey) is an exciting and challenging part of being astatistical consultant. If you work with scientists in a broad array of fields, however, it can quickly becomeoverwhelming. Is it better to limit your expertise to the statistical part of the study, or should you immerseyourself in the science? How do you keep from being overwhelmed by working with many different specialties?When do you become a collaborator instead of a consultant? This talk will cover how to evaluate the amountof involvement in the science that is appropriate using specific examples from consulting projects.
50

HCUP Data Analysis with MongoDBAkhil M GudivadaMarshall [email protected]
Coauthors: Dhana Rao
The HCUP is a publicly available dataset and includes the largest collection of longitudinal hospital caredata in the U.S. from 1988 to present. In this talk, we describe our approach to analyzing HCUP data forvarious trends using MongoDB, a NoSQL database management system. Our analysis encompasses over 24million records corresponding to patient discharge data from over 1,000 hospitals. The unit of analysis is thedischarge record, not individual patients. Our analysis focuses on gaining insights into access to health care,cost and quality of health services, medical practice patterns, and outcomes of treatments at the national,state, and local levels.
Sampling, Sketching and Streaming: Designing Combinatorial Algorithms for BigDataSudipto GuhaUniversity of [email protected]
The explosion of data over the last two decades has mandated that space and access constraints are asimportant to algorithms as accuracy and running time. This has led to the investigation of a variety ofmodels of computation such as streaming, compressed sensing, and map-reduce, to name a few. Significantrecent progress has been made and for several statistical estimation problems, the tradeoffs between thefour parameters are well understood. Yet similar progress has been elusive in large combinatorial or graphproblems, even though graphs constitute one of the most classic representations of data.
In this talk we will review how the different models relate to each other and a few of the recent advancesin parameter estimation problems. We will particularly review the notion of sketching computing innerproducts of the input with suitably designed pseudo-random vectors. The majority of the talk will focuson developing graph algorithms in these models that go beyond parameter estimation and output extendedstructures, for example, a spanning tree or an approximately optimal matching.
Discovering Dynamic Topics in Time Stamped DocumentsShaobo HanDuke [email protected]
Coauthors: Lin Du, Esther Salazar, and Lawrence Carin
We consider the problem of discovering latent structures in a text streams. We propose a dynamic sparsefactor model based on the extended rank likelihood, capable of (1) discovering the time-evolving importanceof topics, (2) learning contemporary topic and word correlations. The high-dimensional, time-evolving wordcounts, after an arbitrary monotone transformation, are well accommodated through an underlying dynamicsparse factor model. The framework naturally admits heavy-tailed innovations, capable of inferring abrupttemporal jumps in the importance of topics. Locally conjugate posterior inference is performed throughGibbs sampling, based on the forward-filtering backward-sampling algorithm. The model is demonstratedby analyzing the US Presidential State of the Union addresses from 1790 to 2014.
51

Dynamic Network-Topic ModelsChristoph HellmayrDuke [email protected]
Coauthors: David Banks
In many situations in which Topic Modelling is appropriate there exists additional data regarding thenetwork structure between the document generating agents. We attempt to include this information in adynamic Network-Topic Model. We model both the time evolution of and the effects of the network structureon topics. We present an algorithm for generating data from this model, and an outline of a MCMC-samplerto fit it.
Nonparametric Bayes Models for Modeling Longitudinal Change in Association among Cate-gorical VariablesAmy HerringThe University of North Carolina at Chapel Hillamy [email protected]
Coauthors: Tsuyoshi Kunihama, Duke University David Dunson, Duke University Carolyn Halpern, TheUniversity of North Carolina at Chapel Hill
Modeling and computation for multivariate longitudinal data has proven challenging, particularly whendata are not all continuous but contain discrete measurements. Approaches based on generalized linearmixed modeling, and related exponential family hierarchical models, have been criticized due to a lack ofrobustness. In particular, problems arise due to the dual role of the random effects structure in controllingthe dependence and shape of the marginal distributions. Motivated by an interesting application to sexualpreference data, we propose a novel approach based on a Dirichlet process mixture of Gaussian latentfactor models. The proposed model uses a rounded kernel method to allow data to be mixed scale, witha longitudinal factor structure incorporating dependence within-subjects in their repeated measurements.Survey weights are incorporated into the model to facilitate generalizability. Parameter interpretation isconsidered, and an efficient Markov chain Monte Carlo algorithm is proposed. The methods are assessedthrough simulation studies and applied to the National Longitudinal Study of Adolescent Health.
The Liberti Trial for Discovering a Dynamic Treatment Regimen in Burn Scar Repair.Jonathan HibbardUNC Chapel [email protected]
Coauthors: Michael R. Kosorok
In this talk we describe the design and analysis plan for the Liberti (Laser Induced, Biologically Engi-neered Remodeling of Thermally Injured) Skin Trial. This is a SMART (Sequential Multiple AssignmentRandomized Trial) design to discover the best sequence of treatments over three time intervals to improveoutcomes for patients with severe burn scaring as a function of baseline and historical tailoring variables. Inaddition, a simple randomized comparison of the three treatments being compared (standard of care plustwo different laser treatments) using a surrogate outcome is embedded within the SMART design.
52

Extension of Rotation Technique via Penalization in Factor Anlaysis ModelKei HiroseOsaka [email protected]
Coauthors: Michio Yamamoto
We consider the problem of sparse estimation in a factor analysis model. A traditional estimation pro-cedure in use is the following two-step approach: the model is estimated by maximum likelihood methodand then a rotation technique is utilized to find sparse factor loadings. However, the maximum likelihoodestimates cannot be obtained when the number of variables is much larger than the number of observations.Furthermore, even if the maximum likelihood estimates are available, the rotation technique does not oftenproduce a sufficiently sparse solution. In order to handle these problems, this paper introduces a penalizedlikelihood procedure that imposes a nonconvex penalty on the factor loadings. We show that the penalizedlikelihood procedure is an extension of the traditional two-step approach. In addition, the proposed method-ology can produce sparser solutions than the rotation technique. The model is estimated by EM algorithmalong with coordinate descent.
Simulation for Designing Medical Device TrialsMartin HoFDA/[email protected]
Coauthors: Xuefeng Li (FDA/CDRH) Telba Irony (FDA/CDRH)
Division of Biostatistics at the Center for Devices and Radiological Health (CDRH) of Food and DrugAdministration has reviewed and accepted various types of adaptive clinical trial designs for confirmatorypivotal medical device trials for a decade. Although these designs operating characteristics often do not haveclosed form solutions, CDRH requires the sponsors to provide sufficient simulations under different scenariosfor study design evaluations. In this presentation, I will discuss the experience of CDRH using simulationsto evaluate clinical study designs and analyze study results. I will first explain why simulation importanceis important for clinical study designs. Next, I will describe what and how we evaluate the simulationssubmitted by the sponsors. After going through a hypothetical example of Bayesian adaptive design trial, Iwill conclude the presentation with some remarks from a regulatory perspective.
Nested Dirichlet Process Model for Household Data SynthesisJingchen HuDuke [email protected]
Coauthors: Jerome P. Reiter
Surveys on household data may comprise only nominal responses (sex, race, marital status etc.) foreach household member (such as the Decennial Census Data on Families). In order to protect respondentsprivacy, suitable model for generating synthetic dataset is needed. In this study we are developing a fullyBayesian, joint modeling approach for categorical data based on the nested Dirichlet process developed byRodriguez et al. (2008), for household synthetic data simulation. The model aims to preserve dependencestructures among variables at both the individual level and the household level. Extensions of this modelcan deal with relational structural zeros in household dataset.
53

Optimal Designs for Multi-Covariate Generalized Liner ModelsLinwei HuUniversity of [email protected]
Coauthors: John Stufken
Optimal design results for multi-covariate generalized linear models are scarce. In this paper, we willderive some complete class results for generalized linear models with an arbitrary number of covariatesand possible interactions between the covariates. The design space can also be any hypercube. Based onthe complete class results, we identify a small class of designs in which the optimal designs can be found,thus greatly simplifies the computational cost for searching the optimal design. The saving in computationincreases exponentially as the number of covariates increases, and is shown in a few numerical studies.
Consistent Selection of the True Covariance Components in High-Dimensional Growth CurveModel with Random CoefficientsShinpei ImoriOsaka [email protected]
Coauthors: Dietrich von Rosen
We try to select the true covariance components in the growth curve model with random coefficientswhen the dimension of response variables is large. The generalized information criterion type model selectoris proposed. Under mild conditions, the proposed criterion has a consistency property, i.e., the selectionprobability of the true covariance components by the proposed criterion goes to 1 with the sample sizetending to infinity.
Longitudinal Data Analysis on the Assessment of Equivalence in Biosimilar Clinical TrialsBo JinPfizer [email protected]
Coauthors: Kerry Barker, Ron Menton, Jim Bolognese, Mikhail Salganik, Lingyun Liu
The assessment of equivalence between biosimilar and reference products in clinical pharmacodynamics(PD) and/or efficacy endpoints is essential to Biosimilar clinical development after the equivalence in clinicalpharmacokinetics is demonstrated. Unlike innovator non-inferiority trials where non-inferiority is usuallytargeted on a primary endpoint (a single time point), biosimilar equivalence to reference products ofteninvolves the evaluation on multiple time points in PD and/or efficacy endpoints. It is therefore of particularinterest how to evaluate equivalence over multiple time points in an efficient and effective way. In this paper,we study the application of longitudinal data analysis models on the evaluation of equivalence on multipletime points. Specifically, several longitudinal data analysis (LDA) models are compared in the analysisof DAS28, a continuous composite endpoint which is commonly used to measure severity of rheumatoidarthritis. Longitudinal Emax model, linear hockey-stick (HS) model, longitudinal linear mixed model androbust linear mixed model will be compared under the various simulated true time-response scenarios. Thesimulations indicated a tradeoff for the Emax model, which had the smallest standard errors and the greatestpower, but had the greatest potential at the same time for yielding biased estimates and inflating the alphalevel. The traditional linear mixed models and robust linear models can yield unbiased estimates and keepconservative alpha levels, but are less powerful than Emax and HS models. The linear hockey-stick modelappeared to be most robust to true response curves and seemed to control alpha levels while still havingsatisfactory power.
54

Cluster-Based Methodologies in Community-Based Interventions: An OverviewRobert E. JohnsonVanderbilt [email protected]
The randomized control trial is the prominent methodological tool used to establish evidence in medicaland other research. Community-based interventions may demand implementation at the community levelrather than at the subject level. This requires all or a sample of subjects within the community to berandomized to intervention or control conditions. Such clustering must be accounted for in the determinationof sample size and statistical analysis. A few short years ago it was too common for analysts to ignore thecluster-base of the sample, causing over-stated significance of interventions. The proper use of cluster-randomized trials has thankfully become prevalent, mainly through education. With this, an array ofmethodological issues has come to the forefront. Sample size strategies and related software, mixed modelsand related hierarchical models for analysis, adapted sampling and randomization strategies, and approachesto accommodate cohorts, repeated values, nesting, etc., are among the various cluster-based methodologiesthat have and continue to be developed. A brief overview of the history of cluster-based trials and currentdevelopments will be provided.
Physiological Age, Health Costs and their RelationshipBruce JonesUniversity of Western [email protected]
Coauthors: Maria Govorun, Xiaoming Liu, David Stanford
We use a phase-type approach to demonstrate the impact of observable annual health cost informationon the evaluation of an individual’s physiological age.
In 2007, Lin and Liu proposed a model for human aging which is a particular Markov chain with statesbeing unobservable physiological ages of an individual. In this phase-type aging model, an individual of agiven age has a defined distribution of his/her physiological age. Many studies indicate that it is importantfor health cost projections and for underwriting purposes to take into account the physiological conditionof an individual rather than just his/her chronological age. In this work, we extend the Lin and Liu modelin order to use information on annual health costs to infer the distribution of the physiological age for anindividual of a given chronological age. We also show the impact of the cost information on the net presentvalue health care costs.
Challenges of Data Integration and Interoperability in Big Data.Anirudh KadadiNorth Carolina A&T State [email protected]
Coauthors: Dr. Rajeev Agrawal
The enormous volumes of data created and maintained by industries, research institutions are on the vergeof outgrowing its infrastructure. The advancements in the organizations work flow include Data Storage,Data Management, Data Maintenance, Data Integration and Data Interoperability. Among these levels, DataIntegration and Data Interoperability can be the two major focus areas for the organizations which tend toimplement advancements in their workflow. Overall, Data Integration and Data Interoperability influencethe data performance. The Data Integration and Data Interoperability is complex for the Big Data therebyrequires a comprehensive path to negotiate the challenges. Given a scenario where two big organizationsmerge and tend to operate centrally, data integration and interoperability could be the major area of focusas the two organizations might have had respective data management techniques before the merger. Thispresentation focuses on the challenges of Data Integration and Data Interoperability, emphasizing on the
55

different techniques to integrate and operate the Big Data, also focusing on ideas for Data Integration andInteroperability in Big Data.
A Regression Estimator for Finite Population Mean of a Sensitive VariableGeeta KaluchaUniversity of Delhi, [email protected]
Coauthors: Sat Gupta & Javid Shabbir
Kalucha et al. (2014) introduced an additive ratio estimator for finite population mean of a sensitivevariable in simple random sampling without replacement and showed that this estimator performs betterthan the ordinary mean estimator based on an optional randomized response technique (RRT). In this article,we introduce a regression estimator that performs better than the ratio estimator even for modest correlationbetween the primary and the auxiliary variable. The primary study variable is sensitive in nature and thecorresponding auxiliary variable that is positively correlated with the primary variable is non-sensitive. Inthe present work, we improve on the results of Gupta et al. (2013) further by using an optional RRT model.Expressions for the Bias and MSE (Mean Square error) for the proposed estimator are derived based on firstorder of approximation. A comparison of the proposed estimator with the corresponding ratio estimator andthe ordinary RRT mean estimator is carried out both theoretically and numerically.
Effects of Method Parameters and Ground Truth in the OMOP Results DatabaseAlan KarrRTI [email protected]
The OMOP results database is a unique dataset containing the results of more than 6 million statisticalanalyses of patient-level medical data. The analyses are meant to identify drugs associated with particularadverse outcomes. The data are drawn from five large provider databases, and cover 181 drugs and 19outcomes. Seven classes of statistical methods were applied to each (drug,outcome) pair, with 1246 variantsarising from parameter settings within each method class. The dataset also contains a binary ground truthfor each (drug,outcome) pair.
This presentation will describe two sets of condition-specific analyses of the OMOP results database thatilluminate the roles of modeling choices and ground truth in determining log relative risk values. The firstare partition models that show concretely the effects and interactions of model parameters and ground truth,as well as reveal clearly the bias resulting from particular choices of parameters. The second set of analysesare ”efficient frontier” models that identify non-dominated methods on the basis of misclassification rates.
An simplified encapsulation of the results is that often how the data are analyzed affects the results morethan does ground truth.
56
Two-Level Screening Designs Derived from Binary Non-Linear CodesTena I. KatsaounisOhio State University at [email protected]
Coauthors: Manohar Aggarwal, University of Memphis
Two-level non-regular fractional factorial designs can provide economical designs in screening experimentsbecause of their flexible run sizes and good projection properties. Two criteria are given for evaluating theoverall aliasing and uniformity properties of projections of a non-regular fractional factorial design onto theactive factors. They are used to rank two-level non-regular fractional designs which correspond to binary non-linear codes. Examples of such non-regular fractional factorial designs are compared to the Plackett-Burmandesigns with 12, 24, 32 and 40 runs and various numbers of factors.
A Spatio-Temporal Model for Predicting Bark Beetle DamageKimberly KaufeldSAMSI/North Carolina State [email protected]
Coauthors: Matthew Heaton, Stephen Sain
Bark beetle damage is one of the primary causes for the dramatic change of the forest composition inthe Rocky Mountain region over the last few years. In order to mitigate the bark beetle epidemic, statisticalmodeling is needed to understand and predict the spread and occurrence of damage. Using data in theRocky Mountains between the years 2001-2011, a zero-augmented spatio-temporal beta regression model isused to predict both the occurrence of beetle damage and, given damage occurred, the percent of the regioninfected. A stick-breaking representation accounts for the proportion of cumulative damage occurred overtime. Temporal evolution of the bark beetle damage is captured using a dynamic linear model where boththe probability and extent of damage depend on the amount of damage incurred in neighboring regionsin the previous time period. A sparse conditional autoregressive model captures any spatial informationnot modeled by spatially varying covariates. We find that the occurrence and extent of beetle damage arenegatively associated with elevation and damage in previous time periods. Additionally, we demonstrate theutility of predicting bark beetle damage by highlighting areas that display a higher probability of outbreakin future time periods.
The Challenges of Statistical Consultancy in Developing Countries Tanzanian Case StudyBenedicto KazuzuruSokoine University of Agriculture-Tanzania & Virginia [email protected]
Laboratory for Interdisciplinary Statistical Analysis 2020 is a program at Virginia Tech University totrain statisticians from developing countries to become good statistical collaborators and thereafter be ableto establish statistical collaboration laboratories in their countries. LISA 2020 program has a plan to estab-lish 20 statistical collaboration laboratories in 20 developing countries by the year 2020. LISA has so farearmarked some developing countries including Nigeria (OAU University) and Tanzania (Sokoine Universityof Agriculture) as countries from Africa where such a laboratory can be established. Unfortunate the devel-oping countries social economic environments may not be as good as the environments in developed countriesand particular in USA where we have such a statistical laboratory (LISA). This scenario may somehow slowdown the functioning and progress of Statistical laboratories in developing countries. For example, the is-sue of African universities funding LISA may be among the critical challenges in the functioning of LISAin developing countries. This talk intend to highlight some key challenges which statistical laboratories indeveloping countries may face and propose where possible alternatives solutions to such challenges
57
Repeated Out of Sample Fusion in Interval Estimation of Small Tail Probabilities in FoodSafetyBenjamin KedemUniversity of [email protected]
In food safety and bio-surveillance in many cases it is desired to estimate the probability that a contami-nant such as some insecticide or pesticide exceeds unsafe very high thresholds. The probability or chance inquestion is then very small. To estimate such a probability we need information about large values. However,in many cases the data do not contain information about exceedingly large contamination levels. A solutionis suggested whereby more information about small tail probabilities is obtained by REPEATED FUSIONof the real data with computer generated data. The method provides short but reliable interval estimatesfrom moderately large samples. An illustration is provided using exposure data from the National Healthand Nutrition Examination Survey (NHANES).
Circular and Diagonal Circular Systematic Sampling in the Presence of Linear TrendZaheen KhanFederal Urdu University of Arts, Science and Technology, [email protected]
In this paper, a new approach is used to study the characteristics of circular version of systematic samplingschemes. This approach enables us to derive the variance expressions of Circular Systematic Sampling (CSS)and Diagonal Circular Systematic Sampling (DCSS) for the populations having linear trend, which were notavailable up till now. Using this new approach, corrected sample mean and average variance of the correctedsample mean for CSS and DCSS are also obtain. Further, we extend the whole work for the case wheresome label of units of certain samples exceeds , which were also not considered earlier. A detailed efficiencycomparison is also carried out.
Key words: CSS, DCSS, linear trend, corrected mean, average variance.
A Direct Utility Model for Economies of ScopeJaehwan KimKorea University Business [email protected]
Coauthors: Dong Soo Kim (Ohio State University) Sanghak Lee(Universiyt of Iowa) Greg Allenby (OhioState University)
Economies of scope exist when consumers find it beneficial to consume multiple offerings because itreduces the cost of consumption. Examples include shopping at malls and other venues where products arein close proximity, and ordering season tickets that do not require seat requests and billing information forevery home game. Economies of scope lead to the consumption of multiple goods because of cost reductions,in contrast to models of satiation that explain multiple purchases in terms of diminishing marginal returnsin utility. We develop a model of scope economies for a latent, unobserved resource that constrains consumerpurchases. The model is applied to a conjoint dataset of theme park demand, where we find that economiesof scope lead to a better model fit and smaller price elasticities relative to existing models of demand.
58

Generalized Functional Concurrent ModelJanet S. KimNorth Carolina State [email protected]
Coauthors: Arnab Maity, Ana-Maria Staicu
We consider the generalized functional model, where both the response and the covariate are functionaldata and are observed on the same domain. In contrast to typical functional linear concurrent models, weallow the relationship between the response and covariate to be nonlinear, depending on both the valueof the covariate at a specific time point as well as the time point itself. In this framework we developmethodology for estimation of the unknown relationship, allowing for correlated error structure as well assparse and/or irregular design. In this study we mainly focus on prediction of an unobserved functionalresponse. We construct point-wise prediction bands for the predicted trajectories under the flexible settingsof observations. We test the existence of unknown dependence between the response and the covariatethrough bootstrapping. We investigate this approach in finite sample size through simulations and a realdata application.
Database Storage Engines for Big Data ManagementRajesh Babu KodaliMarshall [email protected]
Coauthors: Dr. Venkat N Gudivada
Special needs of Web 2.0, Big Data, and mobile applications have ushered in several new classes ofsystems for data management. This renaissance in database management systems (DBMS) is ushering anew trend where a database system can be built using modular components to closely match the applicationdata needs. Database storage engine is a central component of this approach.
In this talk, we present our investigation of the following storage engines: InnoDB, MyISAM, TokuDB,MERGE MEMORY (HEAP), BDB (BerkeleyDB), EXAMPLE, ARCHIVE, CSV, BLACKHOLE, ISAM,MariaDB, Tokutek, ARCHIVE, ndbcluster, FEDERATED, MRG MYISAM, and PostgreSQL. We discusstheir functional and performance characteristics and identify Big Data application scenarios that are idealfor each engine.
Clustering Financial Time Series: A Polyspectral SLEX ApproachPriya KohliConnecticut [email protected]
Coauthors: Nalini Ravishanker and Jane L Harvill
Clustering of time series has applications in diverse fields like business, finance and geophysical processes.Time series data in many scientific or engineering disciplines exhibit nonstationarity and/or nonlinearity. Themost widely used clustering methods are based on the second order properties which are generally insufficientfor the nonlinear processes. There are several open problems in the estimation of time-varying, higher-orderspectra for nonlinear time series, and the development of optimal clustering algorithms based on these spec-tral estimates. We address these issues using an approach based on the smooth localized complex exponentiallibrary of orthogonal transforms for polyspectra (higher order spectra) that is statistically and computation-ally efficient. The performance of the proposed approach is illustrated through extensive simulations andreal-data analysis.
59

On Lotka-Volterra Population GamesVlastimil KrivanBiology centre of AS CR and Faculty of Science USB, Czech [email protected]
Lotka-Volterra predator-prey and competition models played an instrumental role in developing funda-mental principles of contemporary population ecology. These dynamics assume that the interaction strengthbetween different species is fixed (e.g., predator’s food preferences are fixed and independent of prey den-sities). In other words, they do not consider animal behavior (e.g., food preferences, habitat preferences,predator avoidance etc.) that can change as a response to changing environment. Such adaptive animal be-haviors have been documented empirically, and are often postulated in game theoretical evolutionary models.To integrate population dynamics with evolutionary models requires to specify time-scales on which theseprocesses do operate. In my talk I will adopt the classical dogma of ecology where behavior is much fasterwhen compared to population dynamics which are still much faster than evolutionary changes in traits. Withthis perspective I will discuss effect of adaptive animal behaviors on classical Lotka-Volterra predator-preyand competition models. I will show that adaptive animal behaviors when applied to the Lotka-Volterramodels can strongly change their predictions and provide new hypothesis for species coexistence.
Quantitative Analysis of Effectiveness of Teaching an Online Versus In-Class CourseAshok KumarKentcuky State [email protected]
More and more public and private educational institutions and training institutes are moving towardsonline education. There is a tremendous growth of online courses for either making profit by the privateorganization or in order to meet large funding cuts to the public institutions over the last 10 years. Duringthis period, there has been an explosion of these online courses all over the world, especially in USA. Ourresearch is being conducted for quantitatively analyze the data obtained from two sections of a course tomeasure and compare the effectiveness of an online course vs and traditional on campus course.
Generalized Signed-Rank Estimation for Nonlinear Models with Multidimensional IndicesEddy KwessiTrinity [email protected]
Coauthors: B. Nguelifack, A. Abebe
We consider a nonlinear regression model when the index variable is multidimensional. Such models areuseful in signal processing, texture modeling, and spatio-temporal data analysis. A generalized form of thesigned rank estimator of the nonlinear regression coefficients is proposed. This general form of the signed-rank estimator includes Lp estimators and hybrid variants. Sufficient conditions for strong consistency andasymptotically normality of the estimator are given. It is shown that the rate of convergence to normality canbe different from root-n. The sufficient conditions are weak in the sense that they are satisfied by harmonictype functions for which results in the current literature are not applicable. A simulation study shows thatthe certain generalized signed-rank estimators (eg. signed-rank) perform better in recovering signals thanothers (eg. least squares) when the error distribution is contaminated or is heavy-tailed
60

Functional Feature Construction for Personalized MedicineEric LaberNorth Carolina State [email protected]
Coauthors: Ana-Maria Staicu, Leslie Sall
Evidence-based personalized medicine formalizes treatment selection as a decision rule that maps up-to-date patient information into the space of possible treatments. Available patient information may includestatic features such race, gender, family history, genetic and genomic information, as well as longitudinalinformation including the emergence of comorbidities, waxing and waning of symptoms, side-effect burden,and adherence. Dynamic information measured at multiple time points before treatment assignment shouldbe included as input to the decision rule. However, subject longitudinal measurements are typically sparse,irregularly spaced, noisy, and vary in number across subjects. Existing estimators for decision rules requireequal information be measured on each subject and thus standard practice is to summarize longitudinal sub-ject information into a scalar ad hoc summary during data pre-processing. This reduction of the longitudinalinformation to a scalar feature precedes estimation of a decision rule and is therefore not informed by subjectoutcomes, treatments, or covariates. We propose a data-driven method for constructing maximally prescrip-tive yet interpretable features that can be used with standard methods for estimating optimal decision rules.In our proposed framework, we treat the subject longitudinal information as a realization of a stochasticprocess observed with error at discrete time points. The estimated feature is expressible as the integralof the subject longitudinal process against a smooth coefficient function; the estimated coefficient functiontherefore describes the optimal weighting of subject-specific longitudinal information which is potentiallyinformative for clinical practice.
Two Years in Silicon Valley – Some Experiences, Stories, and Thoughts about Big DataLexin LiUniversity of California, [email protected]
There has been an enormous and continuously growing interest in Big Data in recent years – Just seehow often we hear this term from the media and from everyone around us nowadays. In 2011-2013, I wason leave from North Carolina State University, and had been visiting Yahoo Research Labs and StanfordUniversity. Then in fall 2013, I offered a topic course on Big Data at NC State, Statistics Department.In this talk, I would like to share some of my own experiences and personal thoughts on issues related toBig Data, and will talk about the Big Data course that I taught. This talk has been based upon manyconversations and interactions with people from leading Internet Technology companies in Silicon Valley, aswell as my students who took the course.
Modeling Nonstationary Covariance Function with Convolution on SphereYang LiUniversity of Minnesota [email protected]
Coauthors: Zhengyuan Zhu
The wide use of satellite-based instruments provides measurements in climatology on a global scale,which often have nonstationary covariance structure. In this paper we address the issue of modeling axiallysymmetric spatial random fields on sphere with a kernel convolution approach. The observed random fieldis generated by convolving a latent uncorrelated random field with a class of Matern type kernel functions.By allowing the parameters in the kernel functions to vary with locations, we are able to generate a flexibleclass of covariance functions and capture the nonstationary properties. Since the corresponding covariancefunctions generally do not have a closed form, numerical evaluations are necessary and a pre-computation
61

table is used to speed up the computation. For regular grid data on sphere, the circulant block property ofthe covariance matrix enables us to use Fast Fourier Transform (FFT) to get its determinant and inversematrix efficiently. We apply this approach to the Total Ozone Mapping Spectrometer (TOMS) ozone data.
A Nonparametric Approach to Combining Information from Multiple SourcesDungang LiuUniversity of [email protected]
Coauthors: Regina Liu and Minge Xie
For the purpose of combining inferences from several nonparametric studies for a common hypothesis,we develop a new methodology using the concepts of data depth and confidence distribution. A confidencedistribution (CD) is a sample-dependent distribution function that can be used to estimate parameters ofinterest. It is a purely frequentist concept yet can be viewed as a distribution estimator of the parameterof interest. Examples of CDs include Efrons bootstrap distribution and Frasers significance function (alsoreferred to as p-value function). In recent years, the concept of CD has attracted renewed interest andhas shown high potential to be an effective tool in statistical inference. In this project, we use the conceptof CD, coupled with data depth, to develop a new approach for combining the test results from severalindependent studies for a common multivariate nonparametric hypothesis. Specifically, in each study, weapply data depth and bootstraps to obtain a p-value function for the common hypothesis. The p-valuefunctions are then combined under the framework of combining confidence distributions. This approachhas several advantages. First, it allows us to resample directly from the empirical distribution, rather thanfrom the estimated population distribution satisfying the null constraints. Second, it enables us to obtaintest results directly without having to construct an explicit test statistic and then establish or approximateits sampling distribution. The proposed method provides a valid inference approach for a broad class oftesting problems involving multiple studies where the parameters of interest can be either finite or infinitedimensional. The method will be illustrated using simulations and flight data from the Federal AviationAdministration (FAA).
Modeling Novel Strategies for Controlling Mosquito-Borne DiseasesAlun LloydNorth Carolina State Universityalun [email protected]
Dengue is the most significant mosquito-borne viral infection of humans, causing hundreds of millionsof infections annually. The main line of attack against dengue has been traditional mosquito control mea-sures, such as insecticides. The coming years will see the broadening of our anti-dengue arsenal to includegenetically-modified mosquitoes, biocontrol methods—such as Wolbachia—and vaccines. Mathematical mod-els are being, and have been, used to assess the feasibility and effectiveness of a number of these approachesat various stages of their development. In this talk, I shall discuss the biological bases of some of these novelstrategies and the accompanying modeling work, illustrating the use of a number of different models as theprojects move along the path from theoretical proposals, through lab-based studies to field deployment.
62

Clinical Utility Estimation for Assay Cut-offs in Early Phase Oncology Enrichment TrialsJared LuncefordMerck & Co., Inc.jared [email protected]
Coauthors: Jeff Cheng, Peggy Wong, Devan V. Mehrotra
Predictive enrichment strategies use biomarkers to selectively enroll oncology patients into clinical trialsto more efficiently demonstrate therapeutic benefit. Because the enriched population differs from the pa-tient population eligible for screening with the biomarker assay, there is potential for bias when estimatingclinical utility for the screening eligible population if the selection process is ignored. We write estimatorsof clinical utility as integrals averaging regression model predictions over the conditional distribution of thebiomarker scores defined by the assay cut-off and discuss the conditions under which consistent estimationcan be achieved while accounting for some nuances that may arise as the biomarker assay progresses towarda companion diagnostic. We outline and implement a Bayesian approach to estimating these clinical utilitymeasures and use simulations to illustrate performance and the potential biases when estimation naively ig-nores enrichment. Results suggest that the proposed integral representation of clinical utility in combinationwith Bayesian methods provide a practical strategy to facilitate cut-off decision making in this setting.
Higher Order Asymptotics for Generalized Fiducial DistributionAbhishek Pal MajumderUniversity of North Carolina at Chapel [email protected]
Coauthors: Jan Hannig
When no prior information is available about the parameter space it’s common to use non-informativeprior despite its undesirable performances in some pathological cases. The study of Generalized FiducialInference has its own merit since it evolved from an extension of Fisher’s Fiducial argument where so called”prior” depends on the data generating structural equation (i.e X = G(U, θ)). Now if we look at thetransformation A on the data generating equation A(X) = A ◦ G(U, θ) then one can associate a weightfunction w() = A′() in the Jacobian part of the Fiducial distribution. Under few strong assumptions, itcan be shown that if a smooth transformation A is a minimal sufficient statistics then the fiducial quantileis exact in classical coverage sense. But if those assumptions aren’t met, we used the idea of probabilitymatching prior to get conditions under which the Fiducial quantile will be asymptotically first/second orderexact. Conditions are similar to Bayesian paradigm but difference occurs in the asymptotic expansion offiducial quantile since due to the empirical structure, one has some noise terms inside of both first and secondorder terms. This work bridges and analyze two paradigms on a common ground and raise some importantquestions on the validity of the first/second order terms.
Dynamic Spatial Evaluation of Deterministic Air Quality Models Using Monitoring StationObservationsElizabeth MannshardtNorth Carolina State [email protected]
Coauthors: Montserrat Fuentes, Soumendra Lahiri, and Kristen Foley
The Air Quality System (AQS) network of monitoring stations provides a rich source of informationabout air pollution. However, station observations do not allow consideration of different emission andmeteorological scenarios. Air quality models can be used to predict changes in air quality due to changes inemissions or meteorology. The Community Multiscale Air Quality System (CMAQ) allows for estimationsunder different climate scenarios, but is not as accurate as network sensors. Of interest is the comparisonof modeled ozone output to observed ozone, as well as how ozone changes in response to emissions and
63

meteorology. We consider ozone observations from AQS monitoring stations to evaluate CMAQ ozoneestimates. We construct spatial quantile functions for observed ozone versus modeled ozone, considering thequantile of each metric that corresponds to the EPA standard for ozone emissions. A dynamic evaluationapproach explicitly focuses on predicted pollutant responses due to changes in emissions or meteorology.Findings from such dynamic evaluation studies can be directly relevant in regulatory decisions.
Nonnegative Nested Cone AnalysisJ. S. MarronUniversity of North [email protected]
Coauthors: Lingsong Zhang, Dept. of Statistics, Purdue University
The usefulness of Principal Component Analysis as a statistical visualization device is illustrated. In anumber of situations, maximal interpretability comes from nonnegative loadings and scores. The standardNonnegative Matrix Factorization solution suffers in multi-scale applications (such as visualization) becausethe solutions are not nested over rank of approximation. The recently developed notion of BackwardsPrincipal Component Analysis is seen to lead to a useful solution to this problem, giving a new methodcalled Nonnegative Nested Cone Analysis.
Efficient Computation of the Distribution of Spaced Seed CoverageDonald E.K. MartinNorth Carolina State [email protected]
Coauthors: Laurent Noe, LIFL (UMR 8022 Lille 1 University/CNRS) - INRIA Lille Nord-Europe, Villeneuved’Ascq, France
When using an auxiliary Markov chain to compute probabilities for pattern statistics, the computationalcomplexity is directly related to the number of Markov chain states. Thus in recent years, minimal deter-ministic finite automata have been used as data structures that facilitate computation while keeping thenumber of states at a minimum. For statistics where overlapping and non-overlapping pattern occurrencesare treated differently, one could form an extended automaton that includes prefixes of initial and overlappingword occurrences, and then minimize the extended automaton. However, there are situations where forminga full extended automaton and then minimizing it is computationally expensive. We give a method to bypassthe formation of a full extended automaton before minimization that facilitates efficient computation. Themethod is applied to the distribution of the number of sequence positions covered by spaced seed hits, apattern matching paradigm that has proven fruitful in similarity searches for DNA sequences.
64

On Optimal Inferential ModelsRyan MartinUniversity of Illinois at [email protected]
The inferential model (IM) framework provides provably valid probabilistic inference in cases where nogenuine prior information is available. This is accomplished through the use of random sets for predictingunobservable auxiliary variables associated with the observable data and unknown parameters. The efficiencyof the corresponding IM is related to the choice of this random set. In this talk, I will present a theory ofoptimal predictive random sets. Besides efficiency gains, this optimality theory also removes any apparentsubjectivity in the choice of association or random set, since the resulting IM depends only on the samplingmodel. Examples, extensions, and open questions will also be discussed.
Variation between Self- and Mutual Assessment in Animal ContestsMike Mesterton-GibbonsFlorida State [email protected]
Coauthors: Stephen M. Heap (Department of Biological and Environmental Science, University of Jyvaskyla,Finland)
Limited resources lead animals into conflicts of interest, which are resolved when an individual withdrawsfrom a direct contest. Current theory suggests that the decision to withdraw can be based on a thresholdderived from an individual’s own state (self-assessment) or on a comparison between their own state and theiropponent’s (mutual assessment). The observed variation between these assessment strategies in nature doesnot conform to theory. Thus, we require theoretical developments that explain the functional significance ofdifferent assessment strategies. We consider a hawk-dove game with two discrete classes that differ in fightingability, in which the players strategically decide on their investment toward mutual assessment. Analysisof the model indicates that there are simultaneous trade-offs relating to assessment strategies. First, weakindividuals in a population must decide on whether to acquire information about their opponents at the costof providing opponents with information about themselves. Secondly, all individuals must decide betweeninvesting in mutual assessment and being persistent in contests. Our analysis suggests that the potential forindividuals to make errors during contests and differences in the consequences of sharing information withina population may serve as fundamental concepts for explaining variation in assessment strategy.
An Adaptive Decision Making Algorithm to Manage the Spread of a Disease Over a NetworkNicholas J. MeyerNorth Carolina State [email protected]
Coauthors: John Drake, Eric B. Laber, Krishna Pacifici, Brian J. Reich
Managing the spread of a disease over a network is a complex decision making problem with both spatialand temporal components. Optimally choosing the times and locations to apply treatment requires a highquality model for the disease dynamics and the ability to use that model to simulate and optimize potentialtreatment strategies. In some settings the disease dynamics are non-stationary and the model must bere-estimated as new data become available. We construct an adaptive sequential treatment strategy thatminimizes the disease spread over a network by a pre-specified finite time horizon. Using observed data, themethod estimates a dynamics model to develop an initial treatment strategy. In real time, as data accrue,the initial strategy is updated using a stochastic approximation algorithm. The method is illustrated usinga series of simulated experiments.
65

Optimality of Variance Balanced Designs and Their ConstructionsNutan MishraUniversity of South [email protected]
Optimality properties of non-binary , variance balanced designs with unequal replications are discussed.The criteria for optimality considered are based on the canonical efficiency factors instead of the charac-teristic roots of the C-matrix. Further the necessary conditions for the existence of such designs and theirconstructions are given.
Measuring Health Outcomes in America Using a Multivariate ApproachPrashant MittalUniversity of Southern [email protected]
It is challenging to accurately measure and compare health outcomes nationally. Several survey andsurveillance systems collect health data on a yearly basis to make such comparisons. Researchers tend toinvestigate state level data for national comparisons with the underlying assumption that within each statethe health outcomes are similar. The reality is unquestionably far from this notion. Each state behaves asits own ecosystem with a huge diversity of outcomes at smaller geographic boundaries like counties, citiesand towns. Imagine a jig-saw puzzle made up of approximately 3,200 pieces of counties in the nation,rearranged not based on their geography but based on how sick or how healthy they are. The results willbe anything but the geographic map of America. This paper makes a first of its kind attempt to study thephenomenon of diversity in self-reported health outcomes using a sophisticated multivariate approach. Thestudy compares comorbidity and protective factors to create profiles of similar counties. Such analysis mayinform policy makers, health organizations and service providers, so they better understand the diversity ofhealth nationally and locally, and can allocate resources accordingly. This study uses Behavioral Risk FactorsSurveillance System (BRFSS) national data. BRFSS is the worlds largest telephonic health surveillancesystem, conducted by the Centers for Disease Control and Prevention (CDC) in all 50 states and territoriesin the US. BRFSS uses a complex survey methodology and weighting scheme to measure behavioral factorsand related health outcomes.
Multi-factor Youden RectanglesJohn P. MorganVirginia [email protected]
Coauthors: Donald A. Preece (Queen Mary University of London and University of Kent, Canterbury)
A Youden rectangle is a k × v row-column design on v treatments, where row blocks are complete andcolumn blocks comprise a symmetric BIBD. This design also travels by the name Youden square, owing tothe fact that if one interchanges the roles of rows and treatments, the result is a v × v square on k symbolswith v(v− k) empty cells. This square, termed a (v, k)-Youden array, has the properties that (i) each of thek symbols appears once in each row and once in each column, and (ii) if each of the k symbols is replacedby a one, and each empty cell is filled with a zero, the result is an incidence matrix for a BIBD.
Consider now two (v, k)-Youden arrays based on the same BIBD incidence matrix. For simplicity, takethe k symbols in each of the individual arrays to be the integers 0, 1, . . . , k − 1. The pair of arrays can thenbe considered as a single v×v array with an ordered pair of integers in each non-empty cell. This is a doubleYouden array if, throughout the array, the ordered pair p, q (p = 0, 1, . . . , k−1; q = 0, 1, . . . , k−1) occurs n1times if p = q, and n2 times if p 6= q, where n1 and n2 are constants with n1 = n2±1. Extending this notion,if any two of m Youden arrays form a double Youden array, one has a (v, k,m)-Youden array, correspondingto a Youden rectangle for m factors.
66

For m = 3 two examples of triple Youden arrays are known, having (v, k) = (13, 4) and (15, 7). To ourknowledge, no examples are known for m > 3. Here (v, k,m)-Youden arrays are constructed for m = k − 4with v = 2k + 1, where k is an odd prime or prime power, and their properties as statistical designs areexplored. This is the last paper in the long and distinguished career of Donald Preece, who died January 6,2014.
Evaluation of Low-Dimensional Structures in High-Dimensional Twitter DataChitra Reddy MuskuThe University of North Carolina at Greensboroc [email protected]
Coauthors: Shan Suthaharan
The complicated linguistic structure combined with terabytes of data makes the analysis of twitter data achallenging research problem. The high dimensionality of the data adds more complexity and it is difficult toapply Machine Learning techniques to model the data for prediction and decision making with these problems.In this case, preprocessing techniques (called representation learning) can help reduce the complexity.
Recently, a preprocessing technique using twitter data, related to Dutch keywords, has been proposedand reported in the Big Data literature. This technique extracts word count, phrase count and conversationcount from terabytes of twitter data using Hadoop Distributed File System (HDFS). In our research, wecollect our own twitter data and transform phrases from keywords (e.g. iPhone 6 and Samsung Galaxy)and its neighboring words within a predetermined window size, and then hash the phrases to constructlow dimensional structures. This transformation helps reduce the dimensionality of data, volume and lin-guistic complexity. We then execute the preprocessing techniques in the hashed domain, hence leads tofaster processing and reduced complexity in HDFS. We present our twitter data, results and findings at theconference.
Big Data Storage And ManagementChristopher NyamfulNC A&T State [email protected]
Coauthors: Rajeev Agrawal
The amount of data generated daily by industries, large organizations and research institute is increasingat a very fast rate. These huge volumes of data need to be kept not just for analytic purposes, but also incompliance with laws and service level agreements to protect and preserve data. Storage and managementare major concern in this era of big data. The ability for storage devices to scale to meet the rate of datagrowth, enhance access time and data transfer rate is equally challenging. These factors, to a considerableextent, determine the overall performance of data storage and management. Big data storage requirementsare complex and thus needs a holistic approach to mitigate its challenges. This survey paper analyses currenttechnologies and techniques available for big data storage and management. In addition, we also provideuseful suggestions to meet the demands posed by big data storage and management.
67

Co-Directing from Two Institutions for the National Research Experience for UndergraduatesProgramHyunju OhBennett [email protected]
Coauthors: Jan Rychtar
In this talk, we will present our two years of experiences in the National Research Experience for Un-dergraduates Program funded by Mathematical Association of America. Jan Rychtar at the University ofNorth Carolina at Greensboro and Hyunju Oh at the Bennett College co-directed students projects in GameTheory and Applications during the six weeks each summer 2013 and 2014. We will report how we sup-port African-American female undergraduate students from Bennett College in research experience and thestudents achievements, and how we collaborate between two project directors in two different institutions.
Big Data Scale Content Based Image RetrievalJordan ParisMarshall [email protected]
Coauthors: Dr. Gudivada
Digital images are being generated at unprecedented levels by both humans and machines. Camerasembedded in mobile devices and smart camera networks are the primary contributors of these images. In2013 Facebook reported that over 350 million images per day are uploaded to its site. However, image searchis still based on textual descriptors and other metadata associated with the images. Ability to search largeimage collections based on their contents is an active research problem.
In this talk, we describe our approach to content based image retrieval that can scale to Big Data imagecollections. We divide the image into non-overlapping blocks of equal size and compute various pixel-basedmetrics to characterize the image blocks. Using these block metrics, we create a structure similar to a merkletree. In essence, each image is represented by a merkle tree and similarity between two images is cast as aproblem of finding similarity between merkle trees. We demonstrate the effectiveness of our approach usingthe images in the Geograph collection.
Case-Control Sampling for Brain Imaging and Enhancement PredictionGina-Maria PomannNorth Carolina State [email protected]
Coauthors: A. Staicu, R.T. Shinohara, and E. Sweeney, and D.S. Reich
Multiple sclerosis (MS) is a disease associated with inflammation of the brain, morbidity, and disability.Irregular blood flow in white matter of the brain is associated with clinical relapses in patients with MS.This abnormality in active MS lesions is commonly evaluated through identification of enhancing voxels onMagnetic Resonance (MR) images. Current clinical practice includes intravenous injection of contrast agentsthat are occasionally toxic to the patient and can increase the cost of imaging by over 40%. Local imageregression methodology has recently been developed to predict enhancing MS lesions without using suchcontrast agents. We extend this model to account for the rarity of enhancement as well as to incorporate his-torical information about lesions. Incorporation of a historical covariate which characterizes newly enhancinglesion behavior is found to substantially improve prediction. We consider 77 brain MR imaging studies on15 patients which include historical imaging covariates along with T1-w, T2-w images. Additionally, wepresent a novel scan-stratified case-control sampling technique that accounts for the rarity of enhancementand reduces the computational cost.
68

Autoregressive-Stochastic Volatility with Threshold Nonlinear Time-Series ModelPrajneshuIndian Agricultural Statistics Research Institute, [email protected]
A parametric nonlinear time-series model, viz. Autoregressive-Stochastic volatility with threshold (AR-SVT) model with mean equation for forecasting level and volatility is proposed. Methodology for estimationof parameters of this model is developed by first obtaining recursive Kalman filter time-update equationand then employing Unrestricted quasi-maximum likelihood method. Further, optimal multi-step aheadout-of-sample forecasts formulae along with forecast error variances are derived analytically by recursiveuse of conditional expectation and variance. As an illustration, volatile all-India monthly spices export isconsidered. Entire data analysis is carried out using EViews and MATLAB software packages. The AR-SVT model is fitted and interval forecasts for ten hold-out data points are obtained. Superiority of thismodel for describing and forecasting over other competing models for volatility is shown for the data underconsideration
Undergraduate Research at Delhi University, India: An OverviewMeenakshi PrajneshuUniversity of Delhi, [email protected]
Aim of undergraduate research is the supportive, encouraging, and intellectual partnership among stu-dents as well as between students, their faculty and project mentor through which they apply knowledgegained in the classrooms to real-life problems. Delhi University constituent colleges have been challengedto involve students in hands-on research experiences to enhance their learning. Interdisciplinary researchis conducted through teams of ten students from two or three disciplines, three faculty members and onementor. Every year, a Symposium is organized by each team in which imminent scholars give lectures andinteract with scholars to make them interested in result-oriented research. Teams also present their work tothe whole University and outside World by participating in an annual programme of the Universitys Antard-hwani. Essentially, students become junior partners in faculty research. This promotes students to becomescholars. Undergraduate research at Delhi University colleges started in the year 2012 in a modest way butvery next year, more than 250 projects were sanctioned. Salient aspects of some completed as well as someongoing projects will be described in the talk. Rigorous monitoring mechanism being followed will also bediscussed. My own experiences as a Coordinator since inception of this programme will be highlighted.
Measuring the Lack of Monotonicity in FunctionsDanang Teguh QoyyimiGadjah Mada University, [email protected]
Coauthors: Ricardas Zitikis (University of Western Ontario, Canada)
Problems in econometrics, insurance, reliability engineering, and statistics quite often rely on the assump-tion that certain functions are non-decreasing. To satisfy this requirement, researchers frequently model theunderlying phenomena using parametric and semi-parametric families of functions, thus effectively specifyingthe required shapes of the functions. To tackle these problems in a non-parametric way, in this presentationwe suggest indices for measuring the lack of monotonicity in functions. We investigate properties of theindices and also offer a convenient computational technique for practical use.
69

Canonical Discriminate Analysis of Functional MetagenomesDhana RaoMarshall [email protected]
Coauthors: Venkat N. Gudivada
Canonical discriminate analysis of functional metagenomes Metagenomics is a relatively new area thatapplies genomics techniques to study microbial communities in their natural environments. It has showntremendous potential to drive the discovery of the many microorganisms that cannot be cultured. Analysesof a metagenomic dataset provide insights into the functionality and diversity of the corresponding microbialcommunity. However, analyses of datasets can be challenging because of sequencing errors, chimeric readsand complex underlying biology with high inter-subject variability. Furthermore, the sheer volume of datamakes it difficult to identify key differences in the function and taxonomy between communities. Canonicaldiscriminate analysis (CDA) can be used to parse out nuances that separate different environments. CDAcombines the dimensionality of principal component analysis (PCA) with the classification of K-meansapproaches. In our project we present results of applying this approach to re-analyze sequence data frommultiple environmental metagenomic datasets with varying complexity and sampling levels.
Critique of Trends in Phase II TrialsRussell [email protected]
Phase II is a critical time in drug development. Success in answering key questions in this phase has beenshown to improve success in Phase III. In this talk, we talk about recent trends in the design of Phase IItrials. Adaptive trials are becoming more frequently observed, with many options available, in both oncologyand non-oncology settings. We shall discuss some of these designs, and offer suggestions for improvement.In many settings, fixed designs are still preferable, and here we shall discuss the current state of PhaseII designs. The learn-and-confirm paradigm of Sheiner, harkening to the TQC philosophy of Deming, isstarting to play a larger role in Phase II development, but still has substantial room for improvement. Weshall discuss how its use could improve both Phase II development, but also improve the odds for success inPhase III.
Securitization and Equilibrium Pricing Under Relative Performance ConcernsGoncalo dos ReisUniversity of Edinburgh, [email protected]
Coauthors: Jana Bielagk (Humboldt University of Berlin, Germany)
We investigate the effects of a finite set of agents interacting socially in an equilibrium pricing mechanism.A derivative written on non-tradable underlyings is introduced to the market and priced in an equilibrium
framework by agents who assess risk using convex dynamic risk measures expressed by Backward StochasticDifferential Equations (BSDE). An agent is not only exposed to financial and non-financial risk factors,but he also faces performance concerns with respect to the other agents. The equilibrium analysis leads tosystems of fully coupled multi-dimensional quadratic BSDEs.
Within our proposed models we prove the existence and uniqueness of an equilibrium. We show thataggregation of risk measures is possible and that a representative agent exists. We analyze the impact ofthe problem’s parameters in the pricing mechanism, in particular how the agent’s concern rates affect pricesand risk perception.
70

Protecting Confidentiality in an Era with No PrivacyJerome ReiterDuke [email protected]
Data stewards seeking to share large-scale social science data face a difficult challenge: they have torelease data that (i) protect privacy and confidentiality, (ii) are informative for a wide range of analyses,and (iii) are relatively straightforward for a large number of data analysts to use. As the size, richness, andquality of social science data have increased, so too have the threats to confidentiality and the scope of thedissemination challenge. In this talk, I discuss some of the approaches taken by statistical organizationswhen sharing confidential data. I focus particularly on releasing synthetic data, i.e., data simulated frommodels estimated with the confidential data, which is emerging as a potential solution to data sharing.
Imputation of Missing Data via Flexible, Mixture ModelingJerome ReiterDuke [email protected]
Multiple imputation is a common approach to handling missing values. It is usually implemented usingeither chained equation approaches (as in the software MICE and IVEWARE) or joint models. For thelatter, analysts typically use a multivariate normal or log-linear model as imputation engines. While useful,these models impose sets of assumptions that may not be satisfied in many data sets. In this talk, I describeseveral imputation engines based on nonparametric Bayesian models. I present comparisons against default(main effects only) implementations of chained equations in simulated and actual data.
Wilks Λ and the Growth Curve ModelDietrich von RosenSwedish university of agricultural [email protected]
Let WH0and WH1
be two independently distributed Wishart matrices which build up Wilks Λ, i.e.
Λ =|WH0 + WH1 ||WH1
|.
The matrices appear when testing H0: BG = 0 versus H1: B unrestricted in a MANOVA model, i.e.
X = BC + E,
where X is a random matrix which represents the observations, C and G are a known matrixes, andE ∼ Np,n(0,Σ, I), where B and Sigma are unknown matrices. The distribution for Λ equals a productof independently beta-distributed variables. When approximating the distribution several approaches areavailable, where the most commonly applied uses approximations of the gamma-function.
Somewhat remarkable is an old classical result which states that the likelihood ratio test for testing H0:FBG = 0e versus H1: B unrestricted in a GMANOVA model, i.e.
X = ABC + E,
where the difference with the MANOVA model is the known matrix A also follows a Wilks Λ distribution. Itis remarkable since the maximum likelihood estimators in the MANOVA and GMANOVA are very different.The talk will derive the distribution in a somewhat different way than what usually is applied which alsosheds some light on some conditional arguments.
71

Autoregressive Methodology In Detection of Irregular Spiking Activity in NeuronsSudip RoyUniversity of Texas at San [email protected]
Coauthors: Dr. Daijin Ko
Neuron emits different firing patterns such as bursts or pauses, which are important for informationprocessing in the brain. In dopaminergic neurons, prominent patterns include repetitive bursts, regularpacemakers and pauses. Bursts are more important than single spike for evoking responses in post synapticcells. We have introduced a method, robust way of detecting additive and innovative patches outliersconsidering them as bursts and pauses from contaminated autoregressive time series model of the singleneuron spike train, based on inter spike interval (ISI) length. Additive outlier in time series model is thetype that affects a single observation. After this disturbance, the series returns to its normal path as ifnothing happened. In neuroscience spike train analysis we call it as doublet. Innovation outliers are akind that affects subsequent observations starting from its position or an initial shock that propagates in thesubsequent observations, also characterized as additive patches of outliers. Similar things we look for in burstclusters and pause clusters in neuron spike train. We have standardized the log transformed ISIs (SLISI)with robust location and scale parameters and we will use this transformed data to analyze the behavior ofneural spike train. The robust serial correlation and neurophysiology literature show autoregressive nature ofspike trains. Robust AR regression model with high breakdown point (Gervini and Yohai, 2002) is fitted asthe model for regular firing pattern. The residuals from the fitted model are used in calculating significanceof outlyingness. In particular we developed an automated data adaptive method to identify outliers basedon the distribution of the standardized residuals and detect extended clusters of bursts and pauses. Mymethod is a modification to Ko et al., 2012, Detection of bursts and pauses method in spike trains where Ihave taken into account the autocorrelation of the inter event time (ISI) with its past few ISIs. In Ko et.al., Gaussian Surprise Method the central part of the spike train are determined by the function of E-center.In our method we have used robust autoregressive model to recognize the central part of the spike train.We have not go further with other time series modeling like Moving Average process or ARIMA to makeour analysis simple, function of the current ISI based on its near past ISIs. The distribution assumptionis made for the residuals of the fitted time series model for the ISIs of the spike train and based on it theoutliers are being detected. The question lies why the outliers are of concern to get the initial burst or pauseseeds. The reason behind for doing so is presumably the bursts or pauses are outlier subsequences whosefrequency differs from the expected frequency got from the usual distribution of the regular firing spikes inthe neuron. So if we can robustly model the regular spiking activity then significantly large positive andnegative residuals of the model can be due to those pause and burst respectively. My method furthermoreattenuate the fact that detection of outliers based on the residuals is data adaptive and not only lies on thethreshold based on the distribution of the residuals itself. The similarity with the Random Gaussian Methodby Ko et. al, is again the technique to evaluate the extension of burst or pause patches from its seed wehave used False Discovery Rate (FDR) for multiple testing whereas in the former method more conservativeBonferroni multiple testing method is been used . Our motivation of the study is to find a proper distributionfor the background regular firing part of the data which is more robust in nature and based on which wecan detect the irregular firing considering them as significant outlier from our distribution, considering thenegative autocorrelation of the ISIs.
Mentoring Interdisciplinary Research ProjectsJan RychtarThe University of North Carolina at [email protected]
In 2006 faculty members within the Departments of Biology, Mathematics and Statistics and the Officeof Undergraduate Research at the University of North Carolina at Greensboro came together to developan undergraduate MathBio program supported by the National Science Foundation. Our objectives are togenerate new knowledge at the interface of mathematics and biology, showcase the importance of mathematics
72
outside the discipline, increase the use of mathematics and statistics in the field of biology, and guide studentsto an increased proficiency of research skills while preparing them for interdisciplinary graduate education.During this talk, we will address how we began and how we evolved the program over the years; talk aboutthe successes and pitfalls of the program and discuss challenges we face as we move forward.
Ideal Cost-Free Distributions in Structured Populations for General Payoff FunctionsJan RychtarThe University of North Carolina at [email protected]
Coauthors: Mark Broom, City University London, UK
The important biological problem of how groups of animals should allocate themselves between differenthabitats, has been modelled extensively. Such habitat selection models have usually involved infinite well-mixed populations. In particular the problem of allocation over a number of food patches when movementis not costly, the ideal free distribution (IFD) model is well-developed. Here we generalize (and solve) ahabitat selection game for a finite structured population. We show that habitat selection in such a structuredpopulation can have multiple stable distributions (in contrast to the equivalent IFD model that is practicallyunique). We also define and study a “predator dilution game” where unlike in the habitat selection game,individuals prefer to aggregate (to avoid being caught by predators due to the dilution effect) and show thatthis model has a unique solution when movement is unrestricted.
Information Security in NoSQL Systems for Big DataJothilakshmi SAnnamalai [email protected]
Coauthors: Venkat N Gudivada (Marshall University)
Special needs of Big Data recently ushered in several new classes of systems for data management.They are referred to in the literature by various names including NoSQL, NewSQL, and non-RDBMS.These systems differ greatly in data models employed, architectures used for scalability and performance,approaches used for high availability, query languages and client interfaces provided. More importantly,some systems provide rudimentary security features and other provide no security and assume operationin a trusted environment. Given the availability of numerous NoSQL systems, selecting a right systemfor a given application is not a trivial task. To address this problem, Database as a Service (DBaaS) isemerging as a solution. DBaaS enables organizations to effectively leverage NoSQL choices by matching theright data model and query language with the type of data without requiring in-house resources such asspecialized and dedicated hardware and personnel. However, information security is an unsolved problem inDBaaS. In this talk, we describe information security issues of NoSQL systems under the DBaaS model. Acomparative study of security features of existing NoSQL systems will be discussed including their strengthsand limitations. Emergent security challenges that come into play when multiple NoSQL systems operateunder DBaaS model will also be presented.
73

Using Meta-Analysis to Obtain Desired Random Effect Structures in Cluster-RandomizedStudiesRoy T. SaboVirginia Commonwealth [email protected]
Coauthors: Ghalib Bello (Oklahoma Medical Research Center), Aobo Wang (Virginia Commonwealth Uni-versity), Alexander Krist (Virginia Commonwealth University)
Analysis of data from cluster-randomized trial (CRT) designs can be complicated by (i) multi-layered ornested clusters, (ii) large data-bases or cohorts, (iii) non-continuous outcomes, and (iv) repeated measureoutcomes, each of which requires sophisticated optimization techniques. The presence of any of these featuresor their combination can reduce the likelihood of estimator convergence and prohibit conceptual inferenceall-together. Fortunately, meta-analytic methods can be adjusted to allow for parameter estimation in CRTdesigns featuring the aforementioned characteristics, while continuing to capture and account for the com-plicated cluster design. This methodology effectively partitions the existing sample into several manageablesamples, based on either independent sampling or through use of the existing clusters. We show that thismethod allows for parameter estimation and inference in complicated situations, as shown in a contextualexample from a cancer screening study. The results suggest an iterative process of estimation works best.
Sudokus as Experimental DesignsJyotirmoy SarkarIndiana University - Purdue University [email protected]
Coauthors: Bikas Kumar Sinha, ISI (retired)
Viewing Sudokus as experimental designs, one can go a step beyond traditional Latin Square Designs.Subramani and Ponnuswamy (2009) introduced such an additional [third] component of variation in a Su-doku. But they did not properly account for the loss of orthogonality. A correct analysis was given by Sabaand Sinha (2014). We recover some lost orthogonality by constructing cylindrical-shift Sudokus by suitablecomposition of Latin Squares. We extend the idea to Sudokus of arbitrary order. Such Sudoku designsprovide extra utility and flexibility to the experimenters.
On a Generalized Class of Mean Estimators in Survey SamplingJavid ShabbirQuaid-I-Azam University, [email protected]
Coauthors: Sat Gupta
We propose an improved generalized class of estimators of finite population mean that leads to manymore classes of estimators including Singh and Solanki (2013) estimator. Expressions for bias and meansquared error for the proposed class of estimators are obtained up to first order of approximation. Theproposed class of estimators is more efficient than many other competing estimators.
74

Perceptions of Statistical Consulting in a University SettingJulia SharpClemson [email protected]
Coauthors: Pat Gerard, James Wrenn
The role that statistical consulting should play for an academic statistician has long been debated. Theaim of this study is to determine the perceived value of statistical consulting in a university setting. To gaugethis value, a survey was designed to obtain responses from statistical consultants in academia. Statisticalconsultants were asked questions about their personal value of statistical consulting and the perceived valuetheir universities place on statistical consulting. Our results show that statistical consulting is beneficial tothe university, department, and consulting statistician. A majority of statistical consultants strongly agreedor agreed that their consulting duties were and should be taken into consideration for tenure and partialfulfillment of research/publication requirements. A majority of statistical consultants not in a center wereeither neutral or did not agree that their statistical consulting duties are taken into consideration whenconsidered for a pay raise.
A Modified Binary Optional RRT ModelJeong Sep SihmThe University of North Carolina at Greensboroj [email protected]
We propose a modified two stage binary optional randomized response technique (RRT) model in whichrespondents are given the option of answering a sensitive question directly without using randomizationdevice in the second stage if they think they don’t need extra measures to protect their privacy. Thisparticular approach was proposed by Sihm and Gupta (2013) previously. However, instead of using thesplit sample technique and estimating the sensitivity level of the research question and the prevalence ofthe sensitive characteristic simultaneously, we propose to use the Warner (1965) method twice. First toestimate the sensitivity level of the research question, and then to estimate the prevalence of the sensitivecharacteristic in the same sample by asking two separate questions using two separate randomization devices.Simulation results of this new model are compared with those of the split sample based two stage binaryoptional RRT model. Computer simulation shows that the proposed model has smaller variance than theprevious two stage optional binary RRT model for two parameters.
Improved Exponential Methods Of Imputation In Estimation Of Current Population Mean InTwo-Occasion Successive SamplingG. N. SinghIndian School of Mines, Indiagnsingh [email protected]
Coauthors: M. Khetan and S. Maurya
This work suggests some improved exponential methods of imputation for missing data due to non-response and subsequently effective estimation procedures have been proposed to estimate the current pop-ulation mean in two-occasion successive sampling. Properties of the proposed estimation procedures havebeen examined and optimum replacement strategies are suggested which are helpful in reducing the cost ofthe survey. Empirical studies are carried out to assess the performance of suggested estimation proceduresand suitable recommendations have been made to the survey practitioners.
75

Test for the Mean in a Growth Curve Model for High DimensionsMartin SingullLinkoping [email protected]
Coauthors: Muni S. Srivastava (University of Toronto)
In this paper, we consider the problem of estimating and testing a general linear hypothesis in a generalmultivariate linear model, the so called Growth Curve Model, when the p×N observation matrix is normallydistributed with an unknown covariance matrix.
The maximum likelihood estimator (MLE) for the mean is a weighted estimator with the inverse of thesample covariance matrix which is unstable for large p close to N and singular for p larger than N . Wemodify the MLE to an unweighted estimator and propose a new test which we compare with the previouslikelihood ratio test (LRT) based on the weighted estimator, i.e., the MLE. We show that the performanceof the LRT and the new test based on the unweighted estimator are similar.
For the high-dimensional case, when p is larger than N , we construct two new tests based on the trace ofthe variation matrices due to the hypothesis (between sum of squares) and the error (within sum of squares).
To compare the performance of these four tests we compute the attained significance level and theempirical power.
Optimal Designs for Generalized Linear Mixed ModelsSanjoy SinhaCarleton University, [email protected]
Coauthors: Xiaojian Xu, Brock University
Generalized linear mixed models (GLMMs) are commonly used for analyzing clustered correlated discretebinary and count data including longitudinal data and repeated measurements. We explore techniques forthe design of experiments, where the design issue is formulated as a decision of choosing the values ofthe predictor(s) for GLMMs. The usual measures of performance of a design in GLMMs depend on theparameters being estimated. We investigate a sequential approach to choosing a design point that maximizesa measure of performance evaluated at the estimates obtained from observations made at previous designpoints. We assess the performance of the proposed design using simulations.
Influence of Climate Change on Extreme Weather EventsRichard SmithUniversity of North Carolina and [email protected]
Coauthors: Michael Wehner, Lawrence Berkeley National Laboratory
The increasing frequency of extreme weather events raises the question to what extent such events areattributable to human causes. The human influence may be characterized through the fraction of attributablerisk (FAR) or equivalently the risk ratio (RR), which is the ratio of the probability of a given extreme eventunder an anthropogenic forcing scenario to the same probability when only natural forcings are takinginto account. However, there is no generally accepted method of calculating these quantities. We proposea method based on extreme value theory, incorporated into a Bayesian hierarchical model for combiningclimate models runs and the observational record. The same method solves the closely related question ofprojecting changes in the probability of extreme events over some future period. These methods are appliedto three extreme events: (a) the extreme heatwave that occurred in parts of Europe in 2003, (b) the heatwaveof Russia in 2010, and (c) the central USA heatwave of 2011. In each case we find posterior median risk ratios(from anthropogenic versus control-run models) of between 2 and 3, with wide posterior intervals, but still atleast a two-thirds probability that the true risk ratio is greater than 1.5, implying substantial anthropogenic
76

influence. Projections of future probabilities for the same three extreme events show substantial differences:an event equivalent to Europe in 2003 has nearly a 90% probability of reoccurrence in any given year by2040; corresponding results for the other two events also show an increase, but much more slowly.
Assess the Uncertainty of Probability of Success in Phase III Trial after Phase II DataGuochen [email protected]
Coauthors: Ilya Lipkovich; Alex Dmitrienko
The Probability of Technical Success (PTS) assesses the probability that a clinical development programat a particular phase will meet its predefined efficacy and safety criteria and advance to the next stage ofdevelopment. However, the PTS depends heavily on assumptions. As PTS is calculated under the Bayesianframework, Bayesian robustness assessment can be used to evaluate the uncertainties of such calculation.
Bonds Historical Simulation Value at RiskJ. Beleza SousaM2A/ISEL/IPL CMA/FCT/[email protected]
Coauthors: M. L. Esquvel, R. M. Gaspar, P. C. Real
Bonds historical returns can not be used directly to compute VaR by historical simulation because thematurities of the interest rates implied by the historical prices are not the relevant maturities at time VaR iscomputed. In this paper we adjust bonds historical returns so that the adjusted returns can be used directlyto compute VaR by historical simulation. The adjustment is based on the prices, implied by the historicalprices, at the times to maturity relevant for the VaR computation. Besides other features, we show thatthe obtained VaR values agree with the usual market trend of smaller times to maturity being traded withsmaller interest rates, hence, carrying smaller risk and consequently having a smaller VaR.
Improved Mean Estimation Using Auxiliary Information in Stratified SamplingRita SousaNew University of [email protected]
Coauthors: Sat Gupta, Javid Shabbir and Pedro Corte-Real
In survey research, there are many situations when the primary variable of interest is sensitive. Thesensitivity of some queries can give rise to a refusal to answer or to false answers given intentionally. Surveycan be conducted in a variety of settings, in part dictated by the mode of data collection, and these settingscan differ in how much privacy they offer the respondent. A variety of techniques have been used toimprove reporting by increasing the privacy of the respondents. The Randomized Response Technique(RRT), introduced by Warner in 1965, develops a random relation between the individual’s response and thequestion. This technique provides confidentiality to respondents and still allows the interviewers to estimatethe characteristic of interest at an aggregate level. Sousa et al. (2010) introduced a ratio estimator for themean of a sensitive variable which performs better than the ordinary mean based on a RRT. Gupta et al.(2012) proposed a regression estimator that performs better than the ratio estimator based on the sametechnique. The present study considers the RRT focusing on estimating the mean of a sensitive variable instratified random sampling. In this paper, we present the combined ratio and regression estimators usingauxiliary information in order to estimate the population mean from a population divided into strata. Theperformance of the proposed estimators is evaluated based on a simulation study. Similarly to simple random
77

sampling, it is shown that the proposed estimators perform better than the ordinary mean estimator whichdoes not use auxiliary information unless in the strata definition. Also, we show that the proposed estimatorsperform better than the corresponding estimators based on simple random sampling.
Tests For Covariance Matrices in High Dimension with Less Sample SizeMuni SrivastavaUniversity of Toronto, [email protected]
Coauthors: Hirokazu Yanagihara, Hiroshima University Tatsuya Kubokawa, University of Tokyo
In this article, we propose tests for covariance matrices of high dimension with fewer observations thanthe dimension for a general class of distributions with positive definite covariance matrices. In one-samplecase, tests are proposed for sphericity and for testing the hypothesis that the covariance matrix Σ is anidentity matrix, by providing an unbiased estimator of tr[Σ2] under the general model which requires nomore computing time than the one available in the literature for normal model. In the two-sample case,tests for the equality of two covariance matrices are given. The asymptotic distributions of proposed testsin one-sample case are derived under the assumption that the sample size N = O(pδ), 1/2 < δ < 1, where pis the dimension of the random vector.
Economic and Mathematical Models of Credit Risk Assessment in Commercial BankO.P. StefanetsKyiv National University of Trade and [email protected]
Coauthors: O.A.Kharchenko
The purpose of the study is to develop a model of risk assessment of the commercial bank loan portfolio.As a result of the research basic phases of the commercial bank credit risk management have been substan-tiated. Strengths and weaknesses of the most famous models of credit risk assessment - Z-Score, Basel 2,Credit Metrics, Moody’s KMV Portfolio Manager, CreditRisk +, CreditPortfolioView have been analyzed.Requirements for their use in Ukrainian practice have also been formulated. The analysis of practice of usingand development methodology of the statistical model of credit risk assessment proved that there are nounique universally recognized methods for building credit risk assessment models. The problem of developinga model is complicated by the fact that local banks have not accumulated enough data to build such models.Periodic revision is required for a number of parameters. Borrowers risk rating system based on the defaultprobability model which takes into consideration both quantitative and qualitative factors has been devel-oped. Two algorithms for credit risk modeling using a Monte Carlo based method for obtaining empiricaldistribution function of the portfolio loss by taking correlation of the borrowers defaults probability intoaccount have been proposed. For this purpose covariance loss matrix is applied in the first algorithm, andcovariance default probability matrix is used in the second one. A cumulative default probability predictionmethod based on auto-regressive model has been recommended. Cumulative probabilities calculations from1998 to 2013 based on data from Moody’s have been made. Calculations confirm that the general form of theauto-regressive model of the cumulative default probability time dependence is maintained for long periodsof time. Economic and mathematical model for determining the cumulative default probability based onautoregressive models with supplement of additional variables has been created.
78

Modeling Savanna Water Resource Dynamics with Stochastic Daily RainfallChristopher StricklandSAMSI and the University of North Carolina, Chapel [email protected]
Coauthors: Adam Liedloff
Modeling has become an essential part of understanding ecosystem dynamics, and within the savannaecology community, models are used as a key tool to advance theories about the determinants of savannaas an ecological state between forest and grassland. Many of these models adopt mean annual precipitation(MAP) as the primary variable for water resources, based on the observation of Sankaran et al. (2005) thatMAP is highly correlated with an upper bound on maximum woody cover in African savannas and theirsubsequent hypothesis that MAP can be used to determine climatic savanna stability. In this talk, I willintroduce a new water-resource model based on FLAMES, a process-based, demographic model developedby Liedloff and Cook (2007) for Australian savannas. Analysis of this model using stochastic, daily rainfalldistributions suggests that length and severity of the dry season is the true driver behind climatic savannaequilibria, and also provides a method to predict the total basel area and structure of a stand given the localrainfall record. Finally, I will describe the effect of various fire regimes on the model, and the implicationsof these results for management.
On Optimal Designs for Nonlinear Mixed Effects ModelsJohn StufkenArizona State [email protected]
Coauthors: Linwei Hu, University of Georgia
Identifying optimal designs for correlated data is a problem for which few tools have been developed.Many classical results established for independent data have no obvious generalization to correlated data.Our proposed method identifies locally optimal designs for a class of linear and nonlinear mixed effects modelsunder commonly used optimality criteria by extending results for independent data. We demonstrate ourmethod by an example, and investigate robustness of design efficiency to mis-specification of the covariancematrix for the random effects.
Greater Mobility and Larger Neighborhood Size Inhibit the Evolution of CooperationDavid A. SuarezThe University of North Carolina at Greensborod [email protected]
Coauthors: Elizabeth Bergen (Cornell University) Jonathan Rowell (UNCG) Jan Rychtar (UNCG) PraveenSuthaharan (NCSU)
Researchers have long sought to identify which mechanisms can overcome basic selection pressures andsupport the establishment of cooperation within a population. In a slight variation of their traditionallyconception, cooperators are individuals who pay a cost for another individual to receive a benefit, whereaswildtype individuals are free-riders or defectors who receive but do not provide benefits, thus paying no cost.In models of well- mixed populations, free-riders are favored; however, cooperation can emerge and evolvein spatially structured populations. In this paper we extend previous results on the evolution of cooper-ation to a system of a finite, fixed population of mobile competitors. We conduct a stochastic simulationstudy examining how parameters controlling an individual’s mobility and neighborhood size influences thelikelihood that cooperation can evolve within the population. We find that both greater mobility and largerneighborhood size inhibit the evolution of cooperation because it allows the free-riders to find the cooperatorsfaster and exploit them more.
79

Analysis of Multi-Sequence Time Series Data from MS Lesions on Structural MRIElizabeth M. SweeneyJohns Hopkins Bloomberg School of Public [email protected]
Coauthors: Russell T. Shinohara, Daniel S. Reich, Ciprian M. Crainiceanu, Ani Eloyan
Structural magnetic resonance imaging (MRI) can be used to detect lesions in the brains of multiplesclerosis (MS) patients. The formation of these lesions is a complex sequence of inflammation, degeneration,and repair that MRI has been shown to be sensitive to. We characterize the lesion formation process withmulti-sequence structural MRI. We have longitudinal MRI from 10 MS patients, each with between 10 and 40studies. Each study consists of multiple sequences: a T1-weighted, T2-weighted, fluid attenuated inversionrecovery (FLAIR) and proton density (PD) volume. To identify voxels in the brain that are part of new andenlarging lesions, we use the algorithm Subtraction-Based Logistic Inference for Modeling and Estimation(SuBLIME). In the voxels that are identified by SuBLIME, we extract the multi-sequence time series of thevoxel intensities from the four volumes. We also collect the same information from a control area, the voxelsfrom the contralateral of the brain. From these times series we are able to develop and classify categories ofMS lesion formation.
Toxoplasmosis Vaccination StrategiesDavid SykesThe University of North Carolina at [email protected]
Coauthors: Jan Rychtar
The protozoan Toxoplasma Gondii is a parasite often found in wild and domestic cats, and it is the causeof the disease Toxoplasmosis. More than 60 million people in the United States carry the parasite, and theCenters for Disease Control have placed toxoplasmosis in their disease classification group Neglected ParasiticInfections in which there are five parasitic diseases targeted as priorities for public health action. In recentyears, there has been significant progress toward the development of a practical vaccine, so vaccinationprograms may soon be a viable approach to controlling the disease. Anticipating the availability of atoxoplasmosis vaccine, we are interested in determining when cat owners should vaccinate their own pets. Toinvestigate this, we have created a mathematical model describing the conditions under which vaccinationis advantageous for a person living with cats. Analysis of our model shows that under any fixed set ofparameters the population vaccination level will stabilize around a value that can be directly computed.We find that populations may achieve herd immunity if the cost of vaccine is zero, there is a critical costthreshold above which no one will use the vaccine, and a vaccine cost slightly below this critical thresholdresults in high usage of the vaccine, conferring a significant reduction in population seroprevalence.
Chronological Bias Caused by Unobserved Time Trends in Randomized Clinical TrialsMiriam TammRWTH Aachen [email protected]
Coauthors: Ralf-Dieter Hilgers ( RWTH Aachen University)
In clinical trials randomization is used to achieve comparable treatment groups in order to minimizebias in treatment comparison. Since in many clinical trials patients are recruited sequentially over time,one source of bias are time trends. Time trends occur e.g. because of (unobserved) changes in the patientscharacteristics, improvements in the concomitant therapy or for various other possible reasons. Even inrandomized clinical trials the time trend can bias the treatment comparison if, by chance, a large imbalancebetween the treatment groups occurs during the recruitment. To minimize this so called chronological bias,a suitable randomization procedure has to be chosen. The ICH E9 guideline recommends the randomization
80

of subjects in blocks. Nevertheless, to avoid predictability very short block lengths should be avoided. Theaim of the presentation is to evaluate and compare the amount of chronological bias in randomized clinicaltrials - with focus on the permuted block randomization and the choice of different block sizes. We usethe following setting: We consider a parallel group design where the response to treatment is measured bya continuous normally distributed random variable. To model different shapes of time trend, we considerlinear, logarithmic and stepwise trends. The impact of time trends on the treatment effect estimation and onthe test decision is investigated by considering the expected value and mean squared error of the treatmenteffect estimator and the empirical type I error rate when using the two-tailed t-test. Results regarding theoverall evaluation of the randomization procedure as well as results with respect to the maximum extent ofbias for a realized sequence in the analysis stage of a clinical trial are presented. This research is part of theIDeAl EU-FP7 project, Grant-Agreement No. 602 552.
Intrinsic-Objective Bayes Variable Selection for Site-Occupancy ModelsDaniel Taylor-RodriguezSAMSI/Duke [email protected]
Coauthors: Nikolay Bliznyuk, Andrew Womack
Colombia plays a central role in the success of the Jaguar Corridor Initiative (JCI). The corridors, thatare to be established across the country, aim to ensure an active pathway that preserves the link between thejaguar populations in South and Central America. A preliminary but crucial step in defining the corridor inColombian territory is to produce distribution maps for jaguars and their prey. Occupancy models are wellsuited for this purpose. They use repeated survey detection / non-detection data to estimate the percentageof area occupied after adjusting for imperfect detection. However, Bayesian variable selection methods usingsuitable testing priors, both on the parameter and model spaces, are yet to be put forth. By setting up theoccupancy model as an extension of Albert and Chib’s algorithm for probit regression, we build an ObjectiveBayes variable selection procedure based on intrinsic priors, using prior distributions on the model space thatautomatically correct for the multiplicity of the testing problem. We conduct several simulation experimentsto gauge the performance of our methods and, us the procedure to identify the drivers of jaguar populationoccupancy in Colombia.
Game-Theoretical Model of Oviposition Site-Selection of Gravid Female MosquitoesAna TognasoliUniversity of North Carolina at Greensboroa [email protected]
Coauthors: Jan Rychtar and Gideon Wasserberg, University of North Carolina at Greensboro.
We aim to produce a game-theoretical model for the oviposition site-selection behavior of gravid femalemosquitoes, which would allow us to further infer on the validity of the Hump-shaped model. Hematophagousmosquitoes can serve as vectors for many diseases, including but not limited to Chickengunya, Malaria andDengue. Fitness of the individual is dependent upon the optimal oviposition site-selection by the female.Thus the understanding of reproduction and behavioral patterns related to their oviposition site-selectionis essential to the creation of effective methods of population control of those species. A Hump shapedmodel for oviposition site-selection has been recently suggested, in which different densities of conspecifics,enlist different site-selection responses from gravid females. A trade-off occurs between the cost and benefitsrelated to the presence and density of conspecifics. It is assumed that every female will inherently behaveoptimally due to forces of natural selection, and the presence of conspecifics in immature stages is indicativeof the suitability of the site, since other offspring has persisted on that site. While enough nutrients, propera-biotic conditions and absence of predators are viewed as benefits, the larval competition will emerge as acost, hence the trade-off. An optimal density of conspecifics, will provide the best site for oviposition, whilesites with lower density of conspecifics are less attractive because of the lack of reassurance, and sites with
81

larger density are less attractive due to an increasing competition for resources. Within the same game-theoretical scheme, we may evaluate the importance of other aspects of site selection, such as predation andresource enrichment.
Implementing Personalized Medicine: Estimation of Optimal Dynamic Treatment Regimes.Part II: Value Search Estimators and Classification PerspectiveAnastasios A. TsiatisNorth Carolina State [email protected]
A dynamic treatment regime is a list of sequential decision rules that formalizes clinical practice. Eachrule corresponds to a key treatment decision point in the course of patient’s disease or disorder at whichclinicians would select a treatment for the patient from among the available options based on information onthe patient to that point. Given data from a clinical trial or observational study, the statistical problem is toestimate the optimal dynamic treatment regime, that leading to the most favorable outcome if followed by allpatients in the population. Regression-based methods have the drawback that they can yield estimators foran optimal regime that are far from a true optimal regime if the regression models involved are misspecified.Even if the models are correctly specified, complex models can lead to regimes that are infeasible for practicalimplementation. An alternative approach to estimating an optimal dynamic treatment regime that addressesthese issues is based on restricting attention to a practically feasible class of regimes and then maximizing asuitable estimator for the ”value” of a regime, the expected outcome if all patients in the population were tofollow it. We focus first on describing these so-called value search estimators in the case of a single treatmentdecision. We then discuss how this problem can be recast from a classification perspective. Extension tomultiple decision points is then discussed. This talk is based on joint work with Baqun Zhang, PhillipSchulte, Eric B. Laber, and Marie Davidian.
A Revisit to Testing the Equality of Several Poisson ParametersSuntaree UnhapipatUniversity of Louisiana at [email protected]
Coauthors: Montip Tiensuwan, Mahidol University (Thailand); Nabendu Pal, University of Louisiana atLafayette (USA).
Recently Chang et al (2010, Communication in Statistics-Simulation and Computation) considered testingthe equality of several Poisson parameters, and proposed a new parametric bootstrap (PB) method, calledCAT. The CAT was compared against fourteen other tests including the asymptotic likelihood ratio test(ALRT) as well as the parametric bootstrap version of the likelihood ratio test (henceforth, PBLRT), and allhave been found to be quite conservative unless the common parameter under the null hypothesis is not toosmall. In this paper we propose five new test procedures based on two broad adjustments, namely (i) usingdifferent metrics which measure deviation from the null hypothesis; and (ii) using shrinkage estimators inthe aforementioned metrics. All these five new tests, are PB in nature, and their critical values are obtainedinternally through computational steps (i.e., one does not need to provide the critical values explicitly forthese five tests). The resultant tests are then studied through simulation and compared against ALRT aswell as PBLRT in terms of size and power. In this study we also investigate the role of sample sizes indetermining the size and/or power of the tests. Finally, we apply our test methods to U.S. homicide data(FBI data) for comparing different states.
82

Training Statistical Consultants to Become Collaborative StatisticiansEric A. VanceVirginia [email protected]
At LISA, Virginia Tech’s Laboratory for Interdisciplinary Statistical Analysis, we train our students tobecome effective statistical collaborators who focus on helping researchers answer their research questionsrather than merely answering their statistics questions. This change in mindset can be difficult for some,but usually results in a successful collaboration that leaves the researcher happy and satisfied with LISA andmore appreciative of the contribution that statistics and statisticians can make to his or her research. Over95% of clients reporting about their collaborations with LISA statisticians report that the statisticians werehelpful and that they are satisfied with LISA. This talk will highlight the key features of LISAs trainingprogram, including our use of video to record data on our statistical practice and how we analyze that datato improve our statistical collaboration skills. These training methods form the basis for the LISA 2020program to train statisticians from developing countries to become collaborative statisticians and help themcreate a network of statistical collaboration laboratories to enable and accelerate research; help governmentofficials, NGOs, and local businesses make better decisions using data; and train the next generation ofcollaborative statisticians.
Bayesian Reliability Estimation of Inverted Exponential Distribution under Progressive Type-II Censored DataPradeep Kumar VishwakarmaBanaras Hindu University, [email protected]
Coauthors: Sanjay Kumar Singh, Umesh Singh and Abhimanyu Singh Yadav
The present study deals with the estimation procedure for the parameter, reliability function and hazardfunction of the inverted exponential distribution under progressive Type-II censored data. For estimationpurpose, we have considered both classical and Bayesian method of estimation. The Bayes estimates ofthe parameter, reliability function and hazard function are calculated under symmetric and asymmetric lossfunction and also computed the 95% highest posterior density (HPD) intervals of the parameter. Further,Monte Carlo simulation technique has been used to compare the performances of the Bayes estimators withcorresponding MLEs under both the loss functions. Finally, we analysed one data set for illustrative purposesof the study.
SMART Estimators for SMART StudiesAbdus S WahedUniversity of [email protected]
Coauthors: Semhar Ogbagaber
Hypothesis testing to compare adaptive treatment strategies (ATS) from a sequential multiple assignmentrandomization trial (SMART) are usually based on inverse probability weighting or g-estimation. However,regression methods that allow for comparison of treatment strategies that flexibly adjusts for baseline covari-ates using these methods are not as straight-forward due to the fact that one patient can belong to multiplestrategies. This poses a challenge for data analysts as it violates basic assumptions of regression modelingof unique group membership. In this talk, we will propose an artificial randomization” technique to makethe data appear that each subject belongs to a single ATS. This enables treatment strategy indicators to beinserted as covariates in a regression model and apply standard tests such as t- or F-tests. The propertiesof this method are investigated analytically and through simulation. We demonstrate the application of thismethod by applying to a SMART study of cancer regimens.
83

Optimal Algorithms for Logistic Regression with Big DataHaiYing WangUniversity of New [email protected]
Coauthors: Rong zhu, Ping Ma
For non-linear models with Big Data, it is computationally infeasible to obtain the maximum likelihoodestimates for unknown parameters. This paper proposes algorithms to approximate the maximum likelihoodestimates for logistic regression based on random sub-sampling. We prove the consistency of the sub-samplingalgorithms and the asymptotic normality of resultant estimators. Then we develop two optimal strategies byminimizing functions of the variance-covariance matrix of the asymptotic normal distribution. The proposedmethods are evaluated using synthetic and real data sets.
Releasing Synthetic Magnitude Microdata with Fixed MarginalLan WeiDuke [email protected]
Coauthors: Jerome P. Reiter
Establishment microdata is subjected to strict confidential protection. Releasing it while providingmeaningful statistical inference is a challenge. This is especially true for micro discrete data with fixedmarginal totals. We develop a new statistical disclosure limitation (SDL) technique based on data synthesis.We propose a nonparametric Bayesian mixture of Poisson distributions for multivariate count data andsynthesis methods subject to fixed marginal totals. We apply the procedure to data from the ColombianAnnual Manufacturing Survey. We also present methods for disclosure risk assessment.
Sparsity in Multivariate Dynamic ModelsMike WestDuke [email protected]
Bayesian model developments bringing a range of approaches to sparsity modelling in multivariate timeseries have recently been demonstrably valuable in a number of topical application areas. Practical de-ployment of models and coupled, relevant decision analytic strategies, have defined advances in evaluatingtime-varying inter-relationships among series, dynamic dependency networks (with time-evolving predictor-response interconnections and lagged structures), and applications in prediction and decisions across a rangeof financial, economic and scientific areas.
My talk will link to some of the history of Bayesian sparsity modelling in multivariate time series analysisand forecasting, and then discuss recent modelling innovations for dynamic sparsity modelling, and scaling ofBayesian dynamic model-based analysis, inference and decisions. Applications in dynamic network modelling,finance and econometrics will feature centrally for context and motivation. These applications will then alsohelp to convey experiences we have had in using these modelling approaches to aid in isolating and estimatingsparse, dynamic structures in complex multivariate, time-evolving systems, and the impact they can haveon improving predictions and decision making as a result.
84

Multiple-objective Optimal Designs for the 4-parameter Logistic ModelWeng Kee [email protected]
Coauthors: Guanghao Qi, Fudan University Seung Wong Hyun, North Dakota State University
Multiple-objective optimal designs have several advantages over traditional single-objective optimal de-signs. They can properly incorporate several study objectives at the design stage and deliver user-specifiedefficiencies according to their relative importance.
I demonstrate different ways of finding multiple-objective optimal designs using both meta-heuristic andnon-metaheuristic methods. To fix ideas, I use the flexible 4-parameter logistic model as a dose responsemodel and use different algorithms to generate 3-objective optimal designs. The objectives of interest are(i) estimate all parameters in the model,(2) estimate the IC50 and (3) estimate a user-specified minimaleffective dose. The constructed designs allow the possibility that each objective has unequal interest to theresearcher and they can all be verified to be globally optimum.
High Dimensional Sparse MANOVAYin XiaThe University of North Carolina at Chapel [email protected]
Coauthors: Tony Cai
This talk considers testing the equality of multiple high-dimensional mean vectors under dependency. Wepropose a test that is based on a linear transformation of the data by the precision matrix which incorporatesthe dependence structure of the variables. The limiting null distribution of the test statistic is derived andis shown to be the extreme value distribution of type I. The convergence to the limiting distribution is,however, slow when the number of groups is relatively large. An intermediate correction factor is introducedwhich significantly improves the accuracy of the test. It is shown that the test is particularly powerful againstsparse alternatives and enjoys certain optimality. A simulation study is carried out to examine the numericalperformance of the test and compare with other tests given in the literature. The numerical results showthat the proposed test significantly outperforms those tests against sparse alternatives.
High Dimensional Tests for Functional Brain NetworksJichun XieDuke [email protected]
Coauthors: Jian Kang, Emory University
Large-scale resting-state functional magnetic resonance imaging (fMRI) studies have been conducted forpatients with autism, and the existence of abnormalities in the functional connec- tivity between brain regions(containing more than one voxel) have been clearly demonstrated. Due to the ultra-high dimensionality ofthe data, current methods focusing on studying the connectivity pattern between voxels are often lack ofpower and computation-efficiency. In this paper, we introduce a new framework to identify the connectionpattern of gigantic networks with desired resolution. We propose two pairwise testing procedures to testregion dependence, and one multiple testing procedure to test global structures of the network. The limitingnull distributions of the test statistics are derived, together with their power. It is also shown that the testsare rate optimal when the alternative networks are sparse. The numerical studies show that the tests arevalid and powerful. We apply our method to a resting-state fMRI study on autism. The analysis yieldsinteresting insights about the mechanism of autism.
85

Joint Estimation of Multiple Dependent Gaussian Graphical Models with Applications toMouse GeneticsYuying XieUNC at Chapel [email protected]
Coauthors: Yufeng Liu and William Valdar
Gaussian graphical models are widely used to represent conditional dependence among random variables.In this paper we propose a novel estimator for data arising from a group of GGMs that are themselvesdependent. A motivating example is that of modelling gene expression collected on multiple tissues fromthe same individual: a multivariate outcome that is affected by dependencies defined at the level of both thetissue and the whole body. Existing methods that assume independence among graphs are not applicable inthis setting. To estimate multiple dependent graphs, we decompose the problem into two graphical layers:the systemic layer, which is the network affecting all outcomes and thereby inducing cross-graph dependency,and the category-specific layer, which represents the graph-specific variation. We propose a new graphicalEM technique that estimates the two layers jointly, establish the consistency and selection sparsistency of theproposed estimator, and confirm by simulation that the EM method is superior to a simple one-step method.Lastly, we apply our graphical EM technique to mouse genetic data and obtain biologically plausible results.
Evolution of Mobility in Predator-Prey SystemsFei XuWilfrid Laurier University, [email protected]
Coauthors: Ross Cressman and Vlastimil Krivan
In this talk, we investigate the dynamics of a predator-prey system with the assumption that both preyand predators use game theory-based strategies to maximize their per capita population growth rates. Thepredators adjust their strategies in order to catch more prey per unit time, while the prey, on the other hand,adjust their reactions to minimize the chances of being caught. We assume each individual is either mobileor sessile and investigate the evolution of mobility for each species in the predator-prey system. Whenthe underlying population dynamics is of the Lotka-Volterra type, we show that strategies evolve to theequilibrium predicted by evolutionary game theory and that population sizes approach their correspondingstable equilibrium (i.e. strategy and population effects can be analyzed separately). This is no longer thecase when population dynamics is based on the Holling II functional response, although the strategic analysisstill provides a valuable intuition into the long term outcome. Numerical simulation results indicate that, forsome parameter values, the system has chaotic behavior. Our investigation reveals the relationship betweenthe game theory-based reactions of prey and predators, and their population changes.
Optimal Design of Clinical Trials with Randomly Censored ‘‘Time-To-Event End PointsXiao Qiang [email protected]
Coauthors: Valerii Fedorov and Xiao Qiang Xue Predictive Analytics, Quintiles, USA
In the typical clinical trials the subject arrival times can be modeled as the outcomes of a point process.Subsequently the follow-up times can be viewed as random variables and they become known only aftertrial completion. Thus the information that is gained depends on the sample size (number of subjects) andrandom follow up times (specific for each subject). We present results for a few popular survival functionsthat follow from optimal design theory and illuminate them with numerical examples.
86

Two-Block Non-Negative Matrix Factorization for Unknown Chemical IdentificationS. Stanley YoungNational Institute of Statistical [email protected]
Coauthors: Chris Beecher, IORA Technologies, nextgenmetabolomics.com Paul Fogel, Consultant, Paris,France
Often two blocks of omic data are available that are linked as the same sample is matched in both blocks.It would be useful to links sets of variables in one block with sets of variables in the other block. An examplewould be genes in one block and proteins in the other. In our case we have known compounds in one blockand unknown compounds in the second block. If the known compounds in block one can be linked to theunknowns in block two, then the ability to identify the unknowns is greatly improved. Our idea is to usenon-negative matrix factorization on each block, grouping together sets of compounds that are statisticallyhighly related. The score vectors from each factorization are then correlated to link sets from each block. Thebenefit of this linking is to put the unknowns into a context of the knowns thereby facilitating identification.A compound from the block of unknowns could be in the same biochemical pathway as a known. Wedemonstrate the process with a metabolomics data set.
Sparse Learning Incorporating Graphical Structure among PredictorsGuan YuUniversity of North Carolina at Chapel [email protected]
Coauthors: Yufeng Liu, University of North Carolina at Chapel Hill.
With the abundance of high dimensional data in various disciplines, sparse regularized techniques are verypopular these days. In this paper, we make use of the structure information among predictors to improvesparse regression models. Typically, such structure information can be modeled by the connectivity of anundirected graph using all predictors as nodes of the graph. Most existing methods use this undirected graphinformation edge-by-edge to encourage the regression coefficients of corresponding connected predictors tobe similar. However, such methods may require expensive computation when the predictor graph has manymore edges than nodes. Furthermore, they do not directly utilize the neighborhood information of the graph.In this paper, we incorporate the graph information node-by-node, instead of edge-by-edge as used in mostexisting methods. To that end, we decompose the true p-dimensional regression coefficient vector as the sumof p latent parts and incorporate convex group penalty functions to utilize predictor graph neighborhoodstructure information. Our proposed method is very general and it includes adaptive Lasso, group Lassoand ridge regression as special cases. Both theoretical and numerical studies demonstrate the effectivenessof the proposed method for simultaneous estimation, prediction and model selection.
Detection of Very Short Signal SegmentsMing YuanUniversity of [email protected]
Motivated by a range of applications in engineering and genomics, we consider in this paper detection ofvery short signal segments in three settings: signals with known shape, arbitrary signals, and smooth signals.Optimal rates of detection are established for the three cases and rate-optimal detectors are constructed.The detectors are easily implementable and are based on scanning with linear and quadratic statistics. Ouranalysis reveals both similarities and differences in the strategy and fundamental difficulty of detection amongthese three settings.
87

Sorting Out Genuine and Spurious Discoveries in Large Scale Genetic StudiesDmitri ZaykinNational Institute of Environmental Health [email protected]
Imagine an utterly uninformed epidemiologist who is studying effects of various predictors on suscepti-bility to a disease. The epidemiologist is oblivious to any external knowledge regarding possible effects ofpredictors on the outcome and simply tests every predictor in sight. In this scenario, predictors that do infact influence the outcome, i.e., ”true signals” occur at a constant rate. In other words, the rate of truesignal occurrence does not diminish as additional predictors are tested. At the end of the day, the epidemi-ologist reports the predictor yielding the smallest P-value as a potentially true signal. This strategy is oftenperceived with disdain as ”data torturing”. However, a predictor with the smallest P-value in such a studybecomes increasingly less likely to be a spurious association as more tests are performed. More generally, aset of ”top hits” in a multiple-testing experiment becomes increasingly enriched with true signals as moretests are carried out. To understand and quantify this phenomenon, we develop theory for evaluating ratesof spurious findings among predictors with the smallest P-values. Our results can be used for evaluating theproportion of real discoveries in modern genetic association studies, where millions of variants are tested inan agnostic, hypothesis-generating manner.
A Two-Stage, Phase II Clinical Trial Design with Nested Criteria for Early Stopping andEfficacyDaniel ZeltermanYale [email protected]
A Phase II clinical trial is a hypothesis test on the probability of success in a binomial distribution, witha historical control value as the null hypothesis. We propose a two-stage design for a clinical trial with anearly stopping rule for safety. This design employs different criteria to assess early stopping and efficacy. Theearly stopping rule is based on criteria that can be determined more quickly than efficacy. These separatecriteria are also nested in the sense that efficacy is a special case of, but not identical to, the early stoppingcriteria. The design readily allows for planning in terms of statistical significance, power, and expectedsample size necessary to assess an early stopping rule. This method is illustrated with a Phase II designcomparing patients treated for lung cancer with a novel drug combination to a historical control. In thisexample, the early stopping rule is based on the number of patients who exhibit progression-free survival(PFS) at 2 months post treatment follow-up. Efficacy is judged by the number of patients who have PFS at6 months.
Estimating Biomarker-Adjusted Treatment Effects in Randomized Clinical Trials Using Aux-iliary Covariates: Application to a Phase 3 HIV-1 TrialBo ZhangFDA/[email protected]
Coauthors: Zhiwei Zhang,Yanping Qu, Lei Nie, Guoxing Soon
A biomarker-adjusted treatment effect (BATE) model describes the effect of one treatment versus anotheron a subpopulation of patients defined by a biomarker. Such a model can be estimated from clinical trialdata without relying on additional modeling assumptions, and the estimator can be made more efficient byincorporating information on the main effect of the biomarker on the outcome of interest. Motivated byan HIV trial known as THRIVE, we consider the use of auxiliary covariates, which are usually availablein clinical trials and have been used in overall treatment comparisons, in estimating a BATE model. Suchcovariates can be incorporated using an existing augmentation technique. For a specific type of estimating
88
functions for difference-based BATE models, the optimal augmentation depends only on the joint maineffects of marker and covariates. For a ratio-based BATE model, this result holds in special cases but notin general; however, simulation results suggest that the augmentation based on the joint main effects ofmarker and covariates is virtually equivalent to the theoretically optimal augmentation, especially when theaugmentation terms are estimated from data. Application of these methods and results to the THRIVEdata yields new insights on the utility of baseline CD4 cell count and viral load as predictive or treatmentselection markers. The research results were published by Statistical Methods in Medical Research (doi:10.1177/0962280213515572).
Smoothing Splines Using Compactly Supported, Positive Definite, Radial Basis FunctionsGuoyi ZhangUniversity of New [email protected]
In this research, we develop a fast algorithm for a smoothing spline estimator in multivariate regression.To accomplish this, we employ general concepts associated with roughness penalty methods in conjunctionwith the theory of radial basis functions and reproducing kernel Hilbert spaces. It is shown that throughthe use of compactly supported radial basis functions it becomes possible to recover the band structuredmatrix feature of univariate spline smoothing and thereby obtain a fast computational algorithm. Given ndata points in R2, the new algorithm has complexity O(n2) compared to O(n3), the order for the thin platemultivariate smoothing splines.
Covariance Structures of Axially Symmetric Spatial Processes on the SphereHaimeng ZhangUNCGh [email protected]
Coauthors: Chunfeng Huang and Scott Robeson
In this presentation, I will discuss a class of axially symmetric spatial processes in the analysis of global-scale data, whereby their covariance function depends on differences in longitude alone. In addition, asimplified representation of a valid axially symmetric process and its covariance function will be presented,and further construction of parametric covariance models for axially symmetric processes will be explored.
Accelerated Intensity Frailty Model for Recurrent Events DataJiajia ZhangUniversity of South [email protected]
Coauthors: Bo Liu; Wenbin Lu
We propose an accelerated intensity frailty (AIF) model for recurrent events data and derive a test forthe variance of frailty. In addition, we develop a kernel-smoothing-based EM algorithm for estimating regres-sion coefficients and the baseline intensity function. The variance of the resulting estimator for regressionparameters is obtained by a numerical differentiation method. Simulation studies are conducted to evalu-ate the finite sample performance of the proposed estimator under practical settings and demonstrate theefficiency gain over the Gehan rank estimator based on the AFT model for counting process (Lin et al.,1998, Biometrika 85, 605-618). Our method is further illustrated with an application to a bladder tumorrecurrence data.
89

Valid Post-Selection InferenceKai ZhangUniversity of North Carolina, Chapel [email protected]
Coauthors: Richard Berk, Lawrence D. Brown, Andreas Buja, Linda Zhao
It is common practice in statistical data analysis to perform data-driven model selection and derivestatistical inference from the selected model. Such inference is generally invalid. We propose to produce validpost-selection inference by reducing the problem to one of simultaneous inference. Simultaneity is requiredfor all linear functions that arise as coefficient estimates in all submodels. By purchasing simultaneityinsurance for all possible submodels, the resulting post-selection inference is rendered universally valid underall possible model selection procedures. This inference is therefore generally conservative for particularselection procedures, but it is always less conservative than full Scheffe protection. Importantly it does notdepend on the truth of the selected submodel, and hence it produces valid inference even in wrong models.We describe the structure of the simultaneous inference problem and give some asymptotic results.
Interpretable and Parsimonious Optimal Treatment Regime Using Decision ListYichi ZhangNorth Carolina State [email protected]
Coauthors: Eric Laber (North Carolina State University) Anastasios Tsiatis (North Carolina State Univer-sity) Marie Davidian (North Carolina State University)
A treatment regime is a rule that recommends a treatment for each patient based on his/her characteris-tics. Due to patient heterogeneity, using a treatment regime could lead to better clinical outcome than givingthe same treatment to every patient. We employ the concept of decision list, a finite sequence of if-thenstatements, to obtain a treatment regime that is readily interpretable and can potentially provide insightsinto the therapy. Moreover, by requiring the condition in each if-clause be some simple inequality involvingat most two variables, the most relevant variables are identified. We propose novel algorithms to learn theoptimal treatment regime from a randomized or observational study, by maximizing the augmented inverseprobability weighted estimator of the mean clinical outcome. The proposed method is robust against modelmisspecification, compared to regression-based methods like Q-learning. Simulation studies show that theproposed method performs favorably to competing methods. In addition, the proposed method is applied totwo clinical trials, one on breast cancer and the other on chronic depression.
New Analytical Methods for Non-Inferiority Trials: Covariate Adjustment and SensitivityAnalysisZhiwei [email protected]
Coauthors: Lei Nie, Guoxing Soon, Bo Zhang
Even though an active-controlled trial provides no information about placebo, investigators and regulatorsoften wonder how the experimental treatment would compare to placebo should a placebo arm be includedin the study. Such an indirect comparison often requires a constancy assumption, namely that the controleffect relative to placebo is constant across studies. When the constancy assumption is in doubt, there aread hoc methods that discount” the historical data in conservative ways. Recently, a covariate adjustmentapproach was proposed that does not require constancy or involve discounting, but rather attempts to adjustfor any imbalances in covariates between the current and historical studies. This covariate-adjusted approachis valid under a conditional constancy assumption which requires only that the control effect be constantwithin each subpopulation characterized by the observed covariates. Furthermore, a sensitivity analysis
90

approach has been developed to address possible departures from the conditional constancy assumption dueto imbalances in unmeasured covariates. This presentation describes these new approaches and illustratesthem with examples.
Universally Optimal Designs for Two Interference ModelsWei ZhengIndiana University-Purdue University [email protected]
A systematic study is carried out regarding universally optimal designs under the interference model,previously investigated by Kunert and Martin (2000) and Kunert and Mersmann (2011). Parallel results arealso provided for the undirectional interference model, where the left and right neighbor effects are equal. Itis further shown that the efficiency of any design under the latter model is at least its efficiency under theformer model. Designs universally optimal for both models are also identified. Most importantly, Kushner’stype linear equations system is developed as a necessary and sufficient condition for a design to be universallyoptimal. This result is novel for models with at least two sets of treatment-related nuisance parameters,which are left and right neighbor effects here. It sheds light on other models in deriving asymmetric optimalor efficient designs.
Extremal Risks: Paths and Indices of Maximal Tail DependenceRicardas ZitikisUniversity of Western [email protected]
Coauthors: Edward Furman and Jianxi Su (York University, Toronto)
Estimating extremal risks has been a particularly important problem for actuaries and risk analysts.When portfolios contain multiple business lines, extreme risks become even more troublesome and theirco-movements play a key role in risk management. When dependent risks are modeled using copulas, theco-movements are usually modeled by their upper tails in the case of insurance risks and by the lower tails inthe case of financial risks. In this talk, we shall argue that the classical indices of tail dependence quite oftenunderestimate the tail dependence in copulas and thus may not always convey useful information. We shallillustrate this phenomenon using a number of bivariate copulas and suggest an alternative way for assessingtail dependence.
Trends in DisguiseRicardas ZitikisUniversity of Western [email protected]
Coauthors: Vytaras Brazauskas (University of Wisconsin-Milwaukee) and Bruce L. Jones (University ofWestern Ontario)
Human longevity is changing; but at what rate? Insurance claims are increasing; but at what rate? Arethe trends that we glean from data true or illusionary? The shocking fact is that true trends might bequite different from those that we actually see from visualized data. Indeed, in some situations the upwardtrends (e.g., inflation) may even look decreasing (e.g., deflation). In this talk, we shall elucidate this trendsin disguise phenomenon, whose further mathematical and statistical details will soon be published by theAnnals of Actuarial Science in a joint paper with V. Brazauskas and B.L. Jones.
91

Contents
Conference Sponsors . . . . . . . . . . . . . . . . . . . . . . . . . . . . . . . . . . . . . . . . . . . . 1Local Organizing Committee . . . . . . . . . . . . . . . . . . . . . . . . . . . . . . . . . . . . . . . 2International Advisory Committee . . . . . . . . . . . . . . . . . . . . . . . . . . . . . . . . . . . . 3Welcome from the Hosts . . . . . . . . . . . . . . . . . . . . . . . . . . . . . . . . . . . . . . . . . . 4Welcome from Ratnasingham Shivaji, the Head Department of Mathematics and Statistics . . . . 5Welcome from Timothy Johnston, the Dean of the College of Arts & Sciences . . . . . . . . . . . . 6Welcome from Terri Shelton, the Vice Chancellor for Research and Economic Development . . . . 7Plenary Speakers: Workshop on Big Data . . . . . . . . . . . . . . . . . . . . . . . . . . . . . . . . 8
S.E. Ahmed . . . . . . . . . . . . . . . . . . . . . . . . . . . . . . . . . . . . . . . . . . . . . . 8D. B. Dunson . . . . . . . . . . . . . . . . . . . . . . . . . . . . . . . . . . . . . . . . . . . . . 8S. Guha . . . . . . . . . . . . . . . . . . . . . . . . . . . . . . . . . . . . . . . . . . . . . . . . 9L. Li . . . . . . . . . . . . . . . . . . . . . . . . . . . . . . . . . . . . . . . . . . . . . . . . . . 9J. Reiter . . . . . . . . . . . . . . . . . . . . . . . . . . . . . . . . . . . . . . . . . . . . . . . . 9M. Yuan . . . . . . . . . . . . . . . . . . . . . . . . . . . . . . . . . . . . . . . . . . . . . . . . 10
Plenary Speakers: Workshop on Mathematical Biology/Game Theory . . . . . . . . . . . . . . . . 11B. Allen . . . . . . . . . . . . . . . . . . . . . . . . . . . . . . . . . . . . . . . . . . . . . . . . 11M. Broom . . . . . . . . . . . . . . . . . . . . . . . . . . . . . . . . . . . . . . . . . . . . . . . 11R. Cressman . . . . . . . . . . . . . . . . . . . . . . . . . . . . . . . . . . . . . . . . . . . . . 12V. Krivan . . . . . . . . . . . . . . . . . . . . . . . . . . . . . . . . . . . . . . . . . . . . . . . 13A. Lloyd . . . . . . . . . . . . . . . . . . . . . . . . . . . . . . . . . . . . . . . . . . . . . . . . 13M. Mesterton-Gibbons . . . . . . . . . . . . . . . . . . . . . . . . . . . . . . . . . . . . . . . . 14D. Zaykin . . . . . . . . . . . . . . . . . . . . . . . . . . . . . . . . . . . . . . . . . . . . . . . 14
Plenary Speakers: AISC 2014 . . . . . . . . . . . . . . . . . . . . . . . . . . . . . . . . . . . . . . . 15C.S. Cheng . . . . . . . . . . . . . . . . . . . . . . . . . . . . . . . . . . . . . . . . . . . . . . 15M. Davidian . . . . . . . . . . . . . . . . . . . . . . . . . . . . . . . . . . . . . . . . . . . . . . 15A. Herring . . . . . . . . . . . . . . . . . . . . . . . . . . . . . . . . . . . . . . . . . . . . . . . 16A. F. Karr . . . . . . . . . . . . . . . . . . . . . . . . . . . . . . . . . . . . . . . . . . . . . . . 16B. Kedem . . . . . . . . . . . . . . . . . . . . . . . . . . . . . . . . . . . . . . . . . . . . . . . 17R. Smith . . . . . . . . . . . . . . . . . . . . . . . . . . . . . . . . . . . . . . . . . . . . . . . . 17J. Stufken . . . . . . . . . . . . . . . . . . . . . . . . . . . . . . . . . . . . . . . . . . . . . . . 18A. Tsiatis . . . . . . . . . . . . . . . . . . . . . . . . . . . . . . . . . . . . . . . . . . . . . . . 18M. West . . . . . . . . . . . . . . . . . . . . . . . . . . . . . . . . . . . . . . . . . . . . . . . . 19D. Zelterman . . . . . . . . . . . . . . . . . . . . . . . . . . . . . . . . . . . . . . . . . . . . . 20
Conference Program . . . . . . . . . . . . . . . . . . . . . . . . . . . . . . . . . . . . . . . . . . . . 21Parallel Sessions 1A-1H . . . . . . . . . . . . . . . . . . . . . . . . . . . . . . . . . . . . . . . 25Parallel Sessions 2A-2H . . . . . . . . . . . . . . . . . . . . . . . . . . . . . . . . . . . . . . . 27Parallel Sessions 3A-3G . . . . . . . . . . . . . . . . . . . . . . . . . . . . . . . . . . . . . . . 30Parallel Sessions 4A-4G . . . . . . . . . . . . . . . . . . . . . . . . . . . . . . . . . . . . . . . 32
Abstracts of the talks . . . . . . . . . . . . . . . . . . . . . . . . . . . . . . . . . . . . . . . . . . . 35Rajeev Agrawal . . . . . . . . . . . . . . . . . . . . . . . . . . . . . . . . . . . . . . . . . . . . 35S. Ejaz Ahmed . . . . . . . . . . . . . . . . . . . . . . . . . . . . . . . . . . . . . . . . . . . . 35Amer Ibrahim Al-Omari . . . . . . . . . . . . . . . . . . . . . . . . . . . . . . . . . . . . . . . 35Benjamin Allen . . . . . . . . . . . . . . . . . . . . . . . . . . . . . . . . . . . . . . . . . . . . 36Satoshi Aoki . . . . . . . . . . . . . . . . . . . . . . . . . . . . . . . . . . . . . . . . . . . . . 36
92

Chad Awtrey . . . . . . . . . . . . . . . . . . . . . . . . . . . . . . . . . . . . . . . . . . . . . 36David Banks . . . . . . . . . . . . . . . . . . . . . . . . . . . . . . . . . . . . . . . . . . . . . 37Scarlett Bellamy . . . . . . . . . . . . . . . . . . . . . . . . . . . . . . . . . . . . . . . . . . . 37Prithwish Bhaumik . . . . . . . . . . . . . . . . . . . . . . . . . . . . . . . . . . . . . . . . . . 37Vytaras Brazauskas . . . . . . . . . . . . . . . . . . . . . . . . . . . . . . . . . . . . . . . . . 38Aida Briceno . . . . . . . . . . . . . . . . . . . . . . . . . . . . . . . . . . . . . . . . . . . . . 38Jason Brinkley . . . . . . . . . . . . . . . . . . . . . . . . . . . . . . . . . . . . . . . . . . . . 38Jason Brinkley . . . . . . . . . . . . . . . . . . . . . . . . . . . . . . . . . . . . . . . . . . . . 39Mark Broom . . . . . . . . . . . . . . . . . . . . . . . . . . . . . . . . . . . . . . . . . . . . . 39Ramesh K. Budhraja . . . . . . . . . . . . . . . . . . . . . . . . . . . . . . . . . . . . . . . . . 39Chaganty, N. Rao . . . . . . . . . . . . . . . . . . . . . . . . . . . . . . . . . . . . . . . . . . . 40Christine Chai . . . . . . . . . . . . . . . . . . . . . . . . . . . . . . . . . . . . . . . . . . . . 40Hrishikesh Chakraborty . . . . . . . . . . . . . . . . . . . . . . . . . . . . . . . . . . . . . . . 40Kun Chen . . . . . . . . . . . . . . . . . . . . . . . . . . . . . . . . . . . . . . . . . . . . . . . 41Ying-Ju Chen . . . . . . . . . . . . . . . . . . . . . . . . . . . . . . . . . . . . . . . . . . . . . 41Ching-Shui Cheng . . . . . . . . . . . . . . . . . . . . . . . . . . . . . . . . . . . . . . . . . . 41Jerry Q. Cheng . . . . . . . . . . . . . . . . . . . . . . . . . . . . . . . . . . . . . . . . . . . . 42Anu Chhabra . . . . . . . . . . . . . . . . . . . . . . . . . . . . . . . . . . . . . . . . . . . . . 42Pallavi Chitturi . . . . . . . . . . . . . . . . . . . . . . . . . . . . . . . . . . . . . . . . . . . . 42Yunro Chung . . . . . . . . . . . . . . . . . . . . . . . . . . . . . . . . . . . . . . . . . . . . . 43Ross Cressman . . . . . . . . . . . . . . . . . . . . . . . . . . . . . . . . . . . . . . . . . . . . 43Nicole Dalzell . . . . . . . . . . . . . . . . . . . . . . . . . . . . . . . . . . . . . . . . . . . . . 43Kumer Pial Das . . . . . . . . . . . . . . . . . . . . . . . . . . . . . . . . . . . . . . . . . . . . 44Kumer Pial Das . . . . . . . . . . . . . . . . . . . . . . . . . . . . . . . . . . . . . . . . . . . . 44B. K. Dass . . . . . . . . . . . . . . . . . . . . . . . . . . . . . . . . . . . . . . . . . . . . . . 44Marie Davidian . . . . . . . . . . . . . . . . . . . . . . . . . . . . . . . . . . . . . . . . . . . . 45Sonia Davis . . . . . . . . . . . . . . . . . . . . . . . . . . . . . . . . . . . . . . . . . . . . . . 45Angela Dean . . . . . . . . . . . . . . . . . . . . . . . . . . . . . . . . . . . . . . . . . . . . . 45Karthik Devarajan . . . . . . . . . . . . . . . . . . . . . . . . . . . . . . . . . . . . . . . . . . 46Quan Do . . . . . . . . . . . . . . . . . . . . . . . . . . . . . . . . . . . . . . . . . . . . . . . 46Yuexiao Dong . . . . . . . . . . . . . . . . . . . . . . . . . . . . . . . . . . . . . . . . . . . . . 47David Dunson . . . . . . . . . . . . . . . . . . . . . . . . . . . . . . . . . . . . . . . . . . . . . 47Dawn Engels . . . . . . . . . . . . . . . . . . . . . . . . . . . . . . . . . . . . . . . . . . . . . 47Manuel L. Esquvel . . . . . . . . . . . . . . . . . . . . . . . . . . . . . . . . . . . . . . . . . . 48Jennifer L. Fenc . . . . . . . . . . . . . . . . . . . . . . . . . . . . . . . . . . . . . . . . . . . . 48Jennifer L. Fencl . . . . . . . . . . . . . . . . . . . . . . . . . . . . . . . . . . . . . . . . . . . 48Xiaoli Gao . . . . . . . . . . . . . . . . . . . . . . . . . . . . . . . . . . . . . . . . . . . . . . . 49Dursun Bulutoglu and Andrew Geyer . . . . . . . . . . . . . . . . . . . . . . . . . . . . . . . 49Sujit Ghosh . . . . . . . . . . . . . . . . . . . . . . . . . . . . . . . . . . . . . . . . . . . . . . 49Barry K. Goodwin . . . . . . . . . . . . . . . . . . . . . . . . . . . . . . . . . . . . . . . . . . 50Francesca Greselin . . . . . . . . . . . . . . . . . . . . . . . . . . . . . . . . . . . . . . . . . . 50Emily H Griffith . . . . . . . . . . . . . . . . . . . . . . . . . . . . . . . . . . . . . . . . . . . 50Akhil M Gudivada . . . . . . . . . . . . . . . . . . . . . . . . . . . . . . . . . . . . . . . . . . 51Sudipto Guha . . . . . . . . . . . . . . . . . . . . . . . . . . . . . . . . . . . . . . . . . . . . . 51Shaobo Han . . . . . . . . . . . . . . . . . . . . . . . . . . . . . . . . . . . . . . . . . . . . . . 51Christoph Hellmayr . . . . . . . . . . . . . . . . . . . . . . . . . . . . . . . . . . . . . . . . . 52Amy Herring . . . . . . . . . . . . . . . . . . . . . . . . . . . . . . . . . . . . . . . . . . . . . 52Jonathan Hibbard . . . . . . . . . . . . . . . . . . . . . . . . . . . . . . . . . . . . . . . . . . 52Kei Hirose . . . . . . . . . . . . . . . . . . . . . . . . . . . . . . . . . . . . . . . . . . . . . . . 53Martin Ho . . . . . . . . . . . . . . . . . . . . . . . . . . . . . . . . . . . . . . . . . . . . . . . 53Jingchen Hu . . . . . . . . . . . . . . . . . . . . . . . . . . . . . . . . . . . . . . . . . . . . . . 53Linwei Hu . . . . . . . . . . . . . . . . . . . . . . . . . . . . . . . . . . . . . . . . . . . . . . . 54Shinpei Imori . . . . . . . . . . . . . . . . . . . . . . . . . . . . . . . . . . . . . . . . . . . . . 54Bo Jin . . . . . . . . . . . . . . . . . . . . . . . . . . . . . . . . . . . . . . . . . . . . . . . . . 54
93

Robert E. Johnson . . . . . . . . . . . . . . . . . . . . . . . . . . . . . . . . . . . . . . . . . . 55Bruce Jones . . . . . . . . . . . . . . . . . . . . . . . . . . . . . . . . . . . . . . . . . . . . . . 55Anirudh Kadadi . . . . . . . . . . . . . . . . . . . . . . . . . . . . . . . . . . . . . . . . . . . 55Geeta Kalucha . . . . . . . . . . . . . . . . . . . . . . . . . . . . . . . . . . . . . . . . . . . . 56Alan Karr . . . . . . . . . . . . . . . . . . . . . . . . . . . . . . . . . . . . . . . . . . . . . . . 56Tena I. Katsaounis . . . . . . . . . . . . . . . . . . . . . . . . . . . . . . . . . . . . . . . . . . 57Kimberly Kaufeld . . . . . . . . . . . . . . . . . . . . . . . . . . . . . . . . . . . . . . . . . . . 57Benedicto Kazuzuru . . . . . . . . . . . . . . . . . . . . . . . . . . . . . . . . . . . . . . . . . 57Benjamin Kedem . . . . . . . . . . . . . . . . . . . . . . . . . . . . . . . . . . . . . . . . . . . 58Zaheen Khan . . . . . . . . . . . . . . . . . . . . . . . . . . . . . . . . . . . . . . . . . . . . . 58Jaehwan Kim . . . . . . . . . . . . . . . . . . . . . . . . . . . . . . . . . . . . . . . . . . . . . 58Janet S. Kim . . . . . . . . . . . . . . . . . . . . . . . . . . . . . . . . . . . . . . . . . . . . . 59Rajesh Babu Kodali . . . . . . . . . . . . . . . . . . . . . . . . . . . . . . . . . . . . . . . . . 59Priya Kohli . . . . . . . . . . . . . . . . . . . . . . . . . . . . . . . . . . . . . . . . . . . . . . 59Vlastimil Krivan . . . . . . . . . . . . . . . . . . . . . . . . . . . . . . . . . . . . . . . . . . . 60Ashok Kumar . . . . . . . . . . . . . . . . . . . . . . . . . . . . . . . . . . . . . . . . . . . . . 60Eddy Kwessi . . . . . . . . . . . . . . . . . . . . . . . . . . . . . . . . . . . . . . . . . . . . . 60Eric Laber . . . . . . . . . . . . . . . . . . . . . . . . . . . . . . . . . . . . . . . . . . . . . . . 61Lexin Li . . . . . . . . . . . . . . . . . . . . . . . . . . . . . . . . . . . . . . . . . . . . . . . . 61Yang Li . . . . . . . . . . . . . . . . . . . . . . . . . . . . . . . . . . . . . . . . . . . . . . . . 61Dungang Liu . . . . . . . . . . . . . . . . . . . . . . . . . . . . . . . . . . . . . . . . . . . . . 62Alun Lloyd . . . . . . . . . . . . . . . . . . . . . . . . . . . . . . . . . . . . . . . . . . . . . . 62Jared Lunceford . . . . . . . . . . . . . . . . . . . . . . . . . . . . . . . . . . . . . . . . . . . 63Abhishek Pal Majumder . . . . . . . . . . . . . . . . . . . . . . . . . . . . . . . . . . . . . . . 63Elizabeth Mannshardt . . . . . . . . . . . . . . . . . . . . . . . . . . . . . . . . . . . . . . . . 63J. S. Marron . . . . . . . . . . . . . . . . . . . . . . . . . . . . . . . . . . . . . . . . . . . . . 64Donald E.K. Martin . . . . . . . . . . . . . . . . . . . . . . . . . . . . . . . . . . . . . . . . . 64Ryan Martin . . . . . . . . . . . . . . . . . . . . . . . . . . . . . . . . . . . . . . . . . . . . . 65Mike Mesterton-Gibbons . . . . . . . . . . . . . . . . . . . . . . . . . . . . . . . . . . . . . . . 65Nicholas J. Meyer . . . . . . . . . . . . . . . . . . . . . . . . . . . . . . . . . . . . . . . . . . . 65Nutan Mishra . . . . . . . . . . . . . . . . . . . . . . . . . . . . . . . . . . . . . . . . . . . . . 66Prashant Mittal . . . . . . . . . . . . . . . . . . . . . . . . . . . . . . . . . . . . . . . . . . . . 66John P. Morgan . . . . . . . . . . . . . . . . . . . . . . . . . . . . . . . . . . . . . . . . . . . . 66Chitra Reddy Musku . . . . . . . . . . . . . . . . . . . . . . . . . . . . . . . . . . . . . . . . . 67Christopher Nyamful . . . . . . . . . . . . . . . . . . . . . . . . . . . . . . . . . . . . . . . . . 67Hyunju Oh . . . . . . . . . . . . . . . . . . . . . . . . . . . . . . . . . . . . . . . . . . . . . . 68Jordan Paris . . . . . . . . . . . . . . . . . . . . . . . . . . . . . . . . . . . . . . . . . . . . . 68Gina-Maria Pomann . . . . . . . . . . . . . . . . . . . . . . . . . . . . . . . . . . . . . . . . . 68Prajneshu . . . . . . . . . . . . . . . . . . . . . . . . . . . . . . . . . . . . . . . . . . . . . . . 69Meenakshi Prajneshu . . . . . . . . . . . . . . . . . . . . . . . . . . . . . . . . . . . . . . . . . 69Danang Teguh Qoyyimi . . . . . . . . . . . . . . . . . . . . . . . . . . . . . . . . . . . . . . . 69Dhana Rao . . . . . . . . . . . . . . . . . . . . . . . . . . . . . . . . . . . . . . . . . . . . . . 70Russell Reeve . . . . . . . . . . . . . . . . . . . . . . . . . . . . . . . . . . . . . . . . . . . . . 70Goncalo dos Reis . . . . . . . . . . . . . . . . . . . . . . . . . . . . . . . . . . . . . . . . . . . 70Jerome Reiter . . . . . . . . . . . . . . . . . . . . . . . . . . . . . . . . . . . . . . . . . . . . . 71Jerome Reiter . . . . . . . . . . . . . . . . . . . . . . . . . . . . . . . . . . . . . . . . . . . . . 71Dietrich von Rosen . . . . . . . . . . . . . . . . . . . . . . . . . . . . . . . . . . . . . . . . . . 71Sudip Roy . . . . . . . . . . . . . . . . . . . . . . . . . . . . . . . . . . . . . . . . . . . . . . . 72Jan Rychtar . . . . . . . . . . . . . . . . . . . . . . . . . . . . . . . . . . . . . . . . . . . . . . 72Jan Rychtar . . . . . . . . . . . . . . . . . . . . . . . . . . . . . . . . . . . . . . . . . . . . . . 73Jothilakshmi S . . . . . . . . . . . . . . . . . . . . . . . . . . . . . . . . . . . . . . . . . . . . 73Roy T. Sabo . . . . . . . . . . . . . . . . . . . . . . . . . . . . . . . . . . . . . . . . . . . . . 74Jyotirmoy Sarkar . . . . . . . . . . . . . . . . . . . . . . . . . . . . . . . . . . . . . . . . . . . 74Javid Shabbir . . . . . . . . . . . . . . . . . . . . . . . . . . . . . . . . . . . . . . . . . . . . . 74
94

Julia Sharp . . . . . . . . . . . . . . . . . . . . . . . . . . . . . . . . . . . . . . . . . . . . . . 75Jeong Sep Sihm . . . . . . . . . . . . . . . . . . . . . . . . . . . . . . . . . . . . . . . . . . . . 75G. N. Singh . . . . . . . . . . . . . . . . . . . . . . . . . . . . . . . . . . . . . . . . . . . . . . 75Martin Singull . . . . . . . . . . . . . . . . . . . . . . . . . . . . . . . . . . . . . . . . . . . . 76Sanjoy Sinha . . . . . . . . . . . . . . . . . . . . . . . . . . . . . . . . . . . . . . . . . . . . . 76Richard Smith . . . . . . . . . . . . . . . . . . . . . . . . . . . . . . . . . . . . . . . . . . . . 76Guochen Song . . . . . . . . . . . . . . . . . . . . . . . . . . . . . . . . . . . . . . . . . . . . . 77J. Beleza Sousa . . . . . . . . . . . . . . . . . . . . . . . . . . . . . . . . . . . . . . . . . . . . 77Rita Sousa . . . . . . . . . . . . . . . . . . . . . . . . . . . . . . . . . . . . . . . . . . . . . . . 77Muni Srivastava . . . . . . . . . . . . . . . . . . . . . . . . . . . . . . . . . . . . . . . . . . . . 78O.P. Stefanets . . . . . . . . . . . . . . . . . . . . . . . . . . . . . . . . . . . . . . . . . . . . . 78Christopher Strickland . . . . . . . . . . . . . . . . . . . . . . . . . . . . . . . . . . . . . . . . 79John Stufken . . . . . . . . . . . . . . . . . . . . . . . . . . . . . . . . . . . . . . . . . . . . . 79David A. Suarez . . . . . . . . . . . . . . . . . . . . . . . . . . . . . . . . . . . . . . . . . . . 79Elizabeth M. Sweeney . . . . . . . . . . . . . . . . . . . . . . . . . . . . . . . . . . . . . . . . 80David Sykes . . . . . . . . . . . . . . . . . . . . . . . . . . . . . . . . . . . . . . . . . . . . . . 80Miriam Tamm . . . . . . . . . . . . . . . . . . . . . . . . . . . . . . . . . . . . . . . . . . . . 80Daniel Taylor-Rodriguez . . . . . . . . . . . . . . . . . . . . . . . . . . . . . . . . . . . . . . . 81Ana Tognasoli . . . . . . . . . . . . . . . . . . . . . . . . . . . . . . . . . . . . . . . . . . . . . 81Anastasios A. Tsiatis . . . . . . . . . . . . . . . . . . . . . . . . . . . . . . . . . . . . . . . . . 82Suntaree Unhapipat . . . . . . . . . . . . . . . . . . . . . . . . . . . . . . . . . . . . . . . . . 82Eric A. Vance . . . . . . . . . . . . . . . . . . . . . . . . . . . . . . . . . . . . . . . . . . . . . 83Pradeep Kumar Vishwakarma . . . . . . . . . . . . . . . . . . . . . . . . . . . . . . . . . . . . 83Abdus S Wahed . . . . . . . . . . . . . . . . . . . . . . . . . . . . . . . . . . . . . . . . . . . . 83HaiYing Wang . . . . . . . . . . . . . . . . . . . . . . . . . . . . . . . . . . . . . . . . . . . . 84Lan Wei . . . . . . . . . . . . . . . . . . . . . . . . . . . . . . . . . . . . . . . . . . . . . . . . 84Mike West . . . . . . . . . . . . . . . . . . . . . . . . . . . . . . . . . . . . . . . . . . . . . . . 84Weng Kee Wong . . . . . . . . . . . . . . . . . . . . . . . . . . . . . . . . . . . . . . . . . . . 85Yin Xia . . . . . . . . . . . . . . . . . . . . . . . . . . . . . . . . . . . . . . . . . . . . . . . . 85Jichun Xie . . . . . . . . . . . . . . . . . . . . . . . . . . . . . . . . . . . . . . . . . . . . . . . 85Yuying Xie . . . . . . . . . . . . . . . . . . . . . . . . . . . . . . . . . . . . . . . . . . . . . . 86Fei Xu . . . . . . . . . . . . . . . . . . . . . . . . . . . . . . . . . . . . . . . . . . . . . . . . . 86Xiao Qiang Xue . . . . . . . . . . . . . . . . . . . . . . . . . . . . . . . . . . . . . . . . . . . . 86S. Stanley Young . . . . . . . . . . . . . . . . . . . . . . . . . . . . . . . . . . . . . . . . . . . 87Guan Yu . . . . . . . . . . . . . . . . . . . . . . . . . . . . . . . . . . . . . . . . . . . . . . . . 87Ming Yuan . . . . . . . . . . . . . . . . . . . . . . . . . . . . . . . . . . . . . . . . . . . . . . 87Dmitri Zaykin . . . . . . . . . . . . . . . . . . . . . . . . . . . . . . . . . . . . . . . . . . . . . 88Daniel Zelterman . . . . . . . . . . . . . . . . . . . . . . . . . . . . . . . . . . . . . . . . . . . 88Bo Zhang . . . . . . . . . . . . . . . . . . . . . . . . . . . . . . . . . . . . . . . . . . . . . . . 88Guoyi Zhang . . . . . . . . . . . . . . . . . . . . . . . . . . . . . . . . . . . . . . . . . . . . . 89Haimeng Zhang . . . . . . . . . . . . . . . . . . . . . . . . . . . . . . . . . . . . . . . . . . . . 89Jiajia Zhang . . . . . . . . . . . . . . . . . . . . . . . . . . . . . . . . . . . . . . . . . . . . . . 89Kai Zhang . . . . . . . . . . . . . . . . . . . . . . . . . . . . . . . . . . . . . . . . . . . . . . . 90Yichi Zhang . . . . . . . . . . . . . . . . . . . . . . . . . . . . . . . . . . . . . . . . . . . . . . 90Zhiwei Zhang . . . . . . . . . . . . . . . . . . . . . . . . . . . . . . . . . . . . . . . . . . . . . 90Wei Zheng . . . . . . . . . . . . . . . . . . . . . . . . . . . . . . . . . . . . . . . . . . . . . . . 91Ricardas Zitikis . . . . . . . . . . . . . . . . . . . . . . . . . . . . . . . . . . . . . . . . . . . . 91Ricardas Zitikis . . . . . . . . . . . . . . . . . . . . . . . . . . . . . . . . . . . . . . . . . . . . 91
Table of Contents . . . . . . . . . . . . . . . . . . . . . . . . . . . . . . . . . . . . . . . . . . . . . . 91
95