configurable visual representations for business process
TRANSCRIPT

Institut für Architektur von Anwendungssystemen
Universität Stuttgart
Universitätsstraße 38 D - 70569 Stuttgart
Diplomarbeit Nr. 3181
Configurable Visual Representations
for Business Process Monitoring
Andrejs Rapoports
Course of Study: Software Engineering
Examiner: Prof. Dr. Frank Leymann Supervisor: Dipl.-Inf. David Schumm Commenced: April 28, 2011 Completed: October 28, 2011 CR-Classification: D.2.2, H.4.1, H.5.2, I.3.2, I.3.3, I.3.4


Andrejs Rapoports Vipro Abstract
1
Abstract
Business processes are one of the most important assets that a company has. The success of the
business depends directly on the quality of these processes. This makes business process reengineering
and business process improvement the key task of a business analyst. To support monitoring and analysis
steps, an advanced approach for process visualization is required.
The main problem is that several different professionals have to collaborate in order to prepare an
expressive visualization for a monitoring and analysis application. Only advanced visualization will allow
the business analyst to analyze the process and improve it. It implies that a process can change rapidly.
Under these conditions the visualization has to be created rapidly, too.
This work proposes a concept of collaboration between professionals who prepare the visualization:
between the visual designer and information designer. The artifacts they work with are loosely coupled:
visual templates, visual configurations and data. The visual designer prepares visual templates and knows
very little details about the rest of the system. The information designer applies these templates to the
monitoring and analysis application, since it is very unlikely that visual designer will be able to do this.
This work proposes visual templates, which are decoupled from the rest of the system, and visual
configurations, which reference templates to build concrete process visualizations for analysis and
monitoring.
To prove this concept, it has been put in practice as part of this work. The realized framework is
named “Vipro”. A new template format, fully compatible with SVG (Scalable Vector Graphics), and a
visual configuration format have been defined. An editor for visual configurations has been developed.
Finally, a Web service for visualization has been developed to enable the integration with existing
systems.
In the very end, a set of test cases inspired by real requirements illustrate the capabilities of the Vipro
framework.

Table of Contents Vipro Andrejs Rapoports
2
Table of Contents
Abstract ................................................................................................................................................... 1
Table of Contents .................................................................................................................................... 2
1 Introduction ...................................................................................................................................... 6
1.1 Motivation ................................................................................................................................ 6
1.2 Objectives ................................................................................................................................. 7
1.3 Document Structure .................................................................................................................. 7
2 Concept ............................................................................................................................................. 9
2.1 Loose Coupling......................................................................................................................... 9
2.2 Use Cases ................................................................................................................................ 10
2.2.1 UC1 – Creation of the Business Process ........................................................................ 10
2.2.2 UC2 – Creation of Visual Templates.............................................................................. 10
2.2.3 UC3 – Creation of the Visual Representation Configuration ......................................... 10
2.2.4 UC4 – Deployment of the Visual Representation into the Monitoring and Analysis
Environment ....................................................................................................................................... 11
2.2.5 UC5 – Monitoring and Analyzing the Process Using the Visual Representation .......... 11
2.2.6 Design-Time vs. Run-Time ............................................................................................ 11
2.2.7 Artifacts Overview ......................................................................................................... 12
2.3 Editor Concept ........................................................................................................................ 12
2.4 Assumption about Visualization of Running Processes ......................................................... 13
2.5 Similar Works ......................................................................................................................... 14
2.5.1 “Customizable Representation of Process Models” ....................................................... 14
2.5.2 “Configurable Visualization of Complex Process Models” ........................................... 15
3 Vipro Specification ......................................................................................................................... 17
3.1 Process Formats and Editor .................................................................................................... 17
3.1.1 Process Definition Format .............................................................................................. 17
3.1.2 Process Editor ................................................................................................................. 17
3.1.3 Process Instance Data ..................................................................................................... 18
3.2 Visual Templates .................................................................................................................... 19

Andrejs Rapoports Vipro Table of Contents
3
3.2.1 Vector or Raster .............................................................................................................. 19
3.2.2 Which Vector Format ..................................................................................................... 19
3.2.3 SVG Editor ..................................................................................................................... 19
3.3 Visual Representation Configuration ..................................................................................... 20
3.3.1 Configuration Format ..................................................................................................... 20
3.3.2 Value Mapping ............................................................................................................... 20
3.3.3 Editor .............................................................................................................................. 21
3.4 Monitoring and Analysis Service ........................................................................................... 21
3.4.1 Layout Engine ................................................................................................................ 21
3.4.2 Visualization Service ...................................................................................................... 22
3.5 Process Views ......................................................................................................................... 23
3.6 Summary ................................................................................................................................ 23
4 Vipro Architecture .......................................................................................................................... 24
4.1 Vipro Web Service ................................................................................................................. 24
4.1.1 Structural View ............................................................................................................... 24
4.1.2 Behavioral View ............................................................................................................. 24
4.2 Vipro Editor ............................................................................................................................ 26
4.2.1 Structural View ............................................................................................................... 26
4.2.2 Behavioral View ............................................................................................................. 27
5 Vipro Artifacts ................................................................................................................................ 28
5.1 Artifacts Stack ........................................................................................................................ 28
5.2 Vipro Templates ..................................................................................................................... 28
5.2.1 Extensions Points ........................................................................................................... 28
5.2.2 Vipro SVG ...................................................................................................................... 29
5.2.2.1 Namespace Import ..................................................................................................... 29
5.2.2.2 Spots Definitions ........................................................................................................ 29
5.2.2.3 Node Values ............................................................................................................... 30
5.2.2.4 Size Definition ........................................................................................................... 31
5.2.3 Editor .............................................................................................................................. 32
5.3 Vipro Instance Metadata and Data ......................................................................................... 32

Table of Contents Vipro Andrejs Rapoports
4
5.3.1 Vipro Instance Metadata ................................................................................................. 32
5.3.1.1 Choice of Format ........................................................................................................ 32
5.3.1.2 Format Description ..................................................................................................... 33
5.3.2 Vipro Instance Data ........................................................................................................ 34
5.4 Vipro Configuration ............................................................................................................... 36
6 Vipro Implementation..................................................................................................................... 38
6.1 Components Overview ........................................................................................................... 38
6.2 Vipro Library .......................................................................................................................... 40
6.2.1 BPEL Parser ................................................................................................................... 40
6.2.2 Template Processor......................................................................................................... 40
6.2.3 Vipro Instance Metadata Processor ................................................................................ 43
6.2.4 Vipro Configuration Processor ....................................................................................... 44
6.2.5 Vipro Instance Data Processor ....................................................................................... 44
6.2.6 Layout Engine................................................................................................................. 44
6.2.6.1 BPI’s Layout Engine .................................................................................................. 44
6.2.6.2 Extended BPI’s Layout Engine .................................................................................. 45
6.2.7 Combiner ........................................................................................................................ 47
6.3 Vipro Web Service ................................................................................................................. 48
6.3.1.1 WSDL Definition ....................................................................................................... 48
6.3.1.2 Service Implementation .............................................................................................. 49
6.4 Vipro Editor ............................................................................................................................ 50
6.4.1 Vaadin ............................................................................................................................. 50
6.4.2 Main Window ................................................................................................................. 52
6.4.2.1 Step 1 – Select Process ............................................................................................... 53
6.4.2.2 Step 2 – Create RTD-Format ...................................................................................... 54
6.4.2.3 Step 3 – Select Templates .......................................................................................... 54
6.4.2.4 Step 4 – Create Configuration .................................................................................... 55
6.4.2.5 Step 5 – Preview ......................................................................................................... 56
6.4.3 Simple Client for Web Service ....................................................................................... 56
7 Challenges and Solutions................................................................................................................ 58
7.1 Integration of SVG Documents .............................................................................................. 58

Andrejs Rapoports Vipro Table of Contents
5
7.2 Icons in Templates .................................................................................................................. 59
7.3 SVG Integration into HTML5 Pages ...................................................................................... 60
8 Test Cases ....................................................................................................................................... 61
8.1 “Resource Consumption” ....................................................................................................... 61
8.1.1 BPEL Process ................................................................................................................. 61
8.1.2 Vipro Instance Metadata................................................................................................. 62
8.1.3 Vipro Templates ............................................................................................................. 62
8.1.4 Vipro Instance Data ........................................................................................................ 63
8.1.5 Vipro Configuration ....................................................................................................... 64
8.1.6 Result .............................................................................................................................. 64
8.1.7 Aggregated Data Visualization ....................................................................................... 65
8.2 “Security Levels” ................................................................................................................... 66
8.3 “Long Running Process” ........................................................................................................ 68
8.4 “Car Wash” ............................................................................................................................. 69
8.5 “Large Process” ...................................................................................................................... 71
8.6 Overview of Sample Templates ............................................................................................. 72
9 Summary and Outlook .................................................................................................................... 73
9.1 Summary ................................................................................................................................ 73
9.2 Outlook ................................................................................................................................... 73
Acknowledgments ................................................................................................................................. 75
Bibliography .......................................................................................................................................... 76
Table of Figures .................................................................................................................................... 80
Table of Listings ................................................................................................................................... 83
List of Tables ......................................................................................................................................... 83
Erklärung ............................................................................................................................................... 84

1 Introduction Vipro Andrejs Rapoports
6
1 Introduction
1.1 Motivation
Thousands of business processes are running every day all over the world in many companies. In order
to cope with them a company has to be able to monitor them effectively – to see where the problems are
and what can be improved. Processes are dynamic and so the monitoring has to be too.
Improvement of existing business processes happens quicker and quicker from year to year. The
possibility to react fast to the changing world is a major advantage. In the context of the Business Process
Lifecycle [1] (Figure 1) process improvement takes place on all steps except the “Execution”. One can
imagine that the processing of these steps (Monitoring, Analysis, Modeling, IT Refinement and
Deployment) will take five minutes in the nearest future and will be done by one person in a single Web
application.
Figure 1. Business Process Lifecycle [1].
The high cognitive effectiveness of graphical representations of running processes should allow a
person to see all important things at once. The person will be able to quickly decide what has to be
changed in the process in order to improve it. And if the process is changed its graphical representation
must be updated to match the new process model.
And this is the problem. Creation of a comprehensive and cognitive effective graphical representation
is a complex problem that is not automated yet. Although some techniques exist, they are far from being
perfect. Those, which are automated, cannot provide all relevant Run-Time information in an expressive
way. And vice versa – graphical representations, which are expressive, require lots of manual work.
KPIs
Modeling
IT Refinement
Deployment
Execution
Monitoring
Analysis

Andrejs Rapoports Vipro 1 Introduction
7
The key parameters of a good graphical representation were already mentioned: cognitive
effectiveness and comprehensiveness. Existing solutions require a trade-of between them. Let’s take a
closer look at each parameter.
Cognitive effectiveness is defined as the speed, ease and accuracy with which a representation can be
processed by the human mind [2] [3]. Creation of a graphical representation that meets these criteria is a
complex task that often requires creative skills.
Comprehensiveness means that the graphical representation reflects all relevant Run-Time
information. In the modeling step this information is not available to the modeler. For instance, the
industry standard for Web service-based workflows BPEL (Business Process Execution Language) [4]
does not standardize Run-Time data definitions. These definitions must be made by an expert who knows
how each step of the process is being performed, where the data is stored, and what data formats look
like.
So the creator of a graphical representation must be both: a good artist and a process insider. These
requirements are rarely met in a single person. The idea of this work is to decouple the task and let two
different people do their job.
1.2 Objectives
Based on the motivation following objectives were defined for this work:
O1: Create a concept for business process monitoring and analysis that would achieve a loose
coupling between visual templates and the rest of the system. It should be possible to separate
the work of the Template Designer and the Information Designer.
O2: Use process instance data in visualization of running processes without tight coupling to
templates or to any concrete WfMS (Workflow Management System).
O3: Create a tool that utilizes the concept and makes it usable in existing environments.
1.3 Document Structure
The document is divided into nine chapters. Chapter 1 “Introduction” contains introductory
information, explains the motivation, defines the problem, defines objectives and prepares the reader for
the rest of the document. Chapter 2 “Concept” makes the problem clearer, defines Use Cases and explains
the abstract solution to the problem. Chapter 3 “Vipro Specification” defines the term “Vipro”, specifies
the proposed concepts, and defines which formats and tools need to be invented. Chapter 4 “Vipro
Architecture” describes the chosen architecture that fulfills the specification. It describes how the
components work and what the relations between the components are. Chapter 5 “Vipro Artifacts”
defines all new formats that have been created in the framework of this work: Vipro Template, Vipro
Instance Metadata, Vipro Instance Data and Vipro Configuration. Chapter 6 “Vipro Implementation”

1 Introduction Vipro Andrejs Rapoports
8
begins with a coarse-grained overview of implemented components and then describes each of them in
detail: Vipro Library, Vipro Web service and Wipro Editor. Chapter 7 “Challenges and Solutions” is
dedicated to some challenging problems that have been solved and are worth discussing them in a
separate chapter. Chapter 8 “Test Cases” shows different scenarios that illustrate the capabilities of the
developed system. Chapter 9 “Summary and Outlook” summarizes the document and gives an outlook on
the problems that were identified by this work. Acknowledgments, bibliography, table of figures, table of
listings and list of table can be found in the very end.

Andrejs Rapoports Vipro 2 Concept
9
2 Concept
2.1 Loose Coupling
To set up an advanced business process monitoring and analysis environment different specialists have
to cooperate. At least two different sets of skills are required: one has to create comprehensive graphics
and the other has to deploy them in the monitoring and analysis tool. These sets of skills are rarely present
in a single person, because both are not trivial and require special knowledge and experience.
The main idea of this work is to decouple one from the other. It must be possible for the visual
designer to prepare graphics that do not depend on a concrete business process implementation. And for
those who work on the business process it should be possible to use any visual template for business
process monitoring and analysis.
Templates should not depend on a concrete workflow language. And they both should not depend on a
concrete WfMS, as there is no standard engine. All three pieces must be loosely coupled between
themselves. They should be composed by a component they are unaware of. Figure 2 illustrates this
statement. Visual configuration composes thisngs together.
Figure 2. Templates must be decoupled from both process and WfMS. Visual configuration brings the pieces
together.
The idea of loose coupling is also described in [5] where the following statement is made: “Graphical
configurations provide loose coupling of process elements, graphics, and data. Through such an
information linkage a process model can be augmented with data related to a particular analytical task
without polluting the process model. Design templates developed in-house or provided by third parties
provide custom visualization support for process elements in context of the augmented data and analytical
scenario.”
Process Templates WfMS
Visual configuration

2 Concept Vipro Andrejs Rapoports
10
2.2 Use Cases
As mentioned above different specialists will have to work together. In order to specify this statement
roles and Use Cases were defined.
Roles:
Business Analyst
Process Modeler
Template Designer
Information Designer [5]
Use Cases:
UC1 – Creation of the business process.
UC2 – Creation of visual templates.
UC3 – Creation of the visual representation configuration.
UC4 – Deployment of the visual representation into the monitoring and analysis environment.
UC5 – Monitoring the process using the visual representation.
2.2.1 UC1 – Creation of the Business Process
The business process is created by the Business Analyst and the Process Modeler. First Business
Analyst creates an abstract process in an informal way. Usually a Business Analyst is a businessman who
is not familiar with the formal notations used for process enactment. Process Modeler receives the
abstract process made by Business Analyst and implements it in a particular workflow language [1]. Also
Process Modeler specifies what the Run-Time data will look like – instance metadata.
This Use Case results in two artifacts:
Complete process definition (A1)
Run-Time data definition (A2)
2.2.2 UC2 – Creation of Visual Templates
Visual templates are created by the Template Designer. This is a more creative task and requires
knowledge of comprehensive visual communication. Template Designer creates templates based on the
request of Business Analyst. Template Designer uses a standard graphics editor and marks the variable
places of the template.
The result is a set of visual templates. (A3)
2.2.3 UC3 – Creation of the Visual Representation Configuration
The Information Designer receives the outputs from two previous Use Cases: process definition, Run-
Time data definition and visual templates. Using a visual editor, the Information Designer creates a visual

Andrejs Rapoports Vipro 2 Concept
11
representation configuration for the specified process: process activities are mapped to templates and
variable places of templates are mapped to Run-Time data definition.
As result a single visual representation configuration is created. (A4)
2.2.4 UC4 – Deployment of the Visual Representation into the Monitoring and Analysis
Environment
The Information Designer deploys a prepared visual representation configuration into the monitoring
and analysis environment.
2.2.5 UC5 – Monitoring and Analyzing the Process Using the Visual Representation
The Business Analyst monitors and analyses processes using their visual representations. The visual
representation configuration is interpreted automatically to produce visualizations of the running process.
To do this the monitoring and analysis environment retrieves Run-Time data from the WfMS and uses it
to fill templates and complete the visualization. This Run-Time data is also an important artifact but
unlike previous artifacts it is created automatically.
2.2.6 Design-Time vs. Run-Time
Use Cases mentioned above can be split in two phases:
Design-Time: UC1, UC2 and UC3. These Use Cases are preparation steps where artifacts are
created: process definition, templates and visual representation.
Run-Time: with UC4 and UC5. In these two Use Cases no more artifacts are created manually.
Results of first three Use Cases are executed.
Further these two phases will be often mentioned. The separation between them goes throughout the
whole work.

2 Concept Vipro Andrejs Rapoports
12
2.2.7 Artifacts Overview
In Use Cases many different artifacts are created. Table 1 summarizes them. Both Use Cases and
artifacts are numbered and will further be referenced by their codes.
Phase Use Case Role Output artifacts
Design-Time
Creation of the business process (UC1)
Business Analyst,
Process Modeler Process definition (A1);
Process Modeler Run-Time data definition
(A2)
Creation of visual templates (UC2) Template Designer Visual templates (A3)
Creation of the visual representation
configuration (UC3)
Information
Designer
Visual representation
configuration (A4)
Run-Time
Deployment of the visual
representation into the monitoring and
analysis environment (UC4)
Information
Designer None
Monitoring the process using the
visual representation (UC5) Business Analyst Run-Time data (A5)
Table 1. Use Cases and their outputs – artifacts.
2.3 Editor Concept
As mentioned above a new editor for visual representations of a process should be created in order to
support the Information Designer. Figure 3 shows a sketch that illustrates proposed inputs and outputs of
the editor. Different files holding process definition, Run-Time data definition and graphic templates are
imported in the editor, where the Information Designer combines them into a configuration of the
graphical representation for the process monitoring and analysis.
Figure 3. Sketch for the editor’s inputs and outputs.
Editor
Process Definition (A1)
Run-Time Data Definition (A2)
Graphic Templates (A3)
RepresentationConfiguration (A4)
Andrejs Rapoports Vipro 2 Concept
13
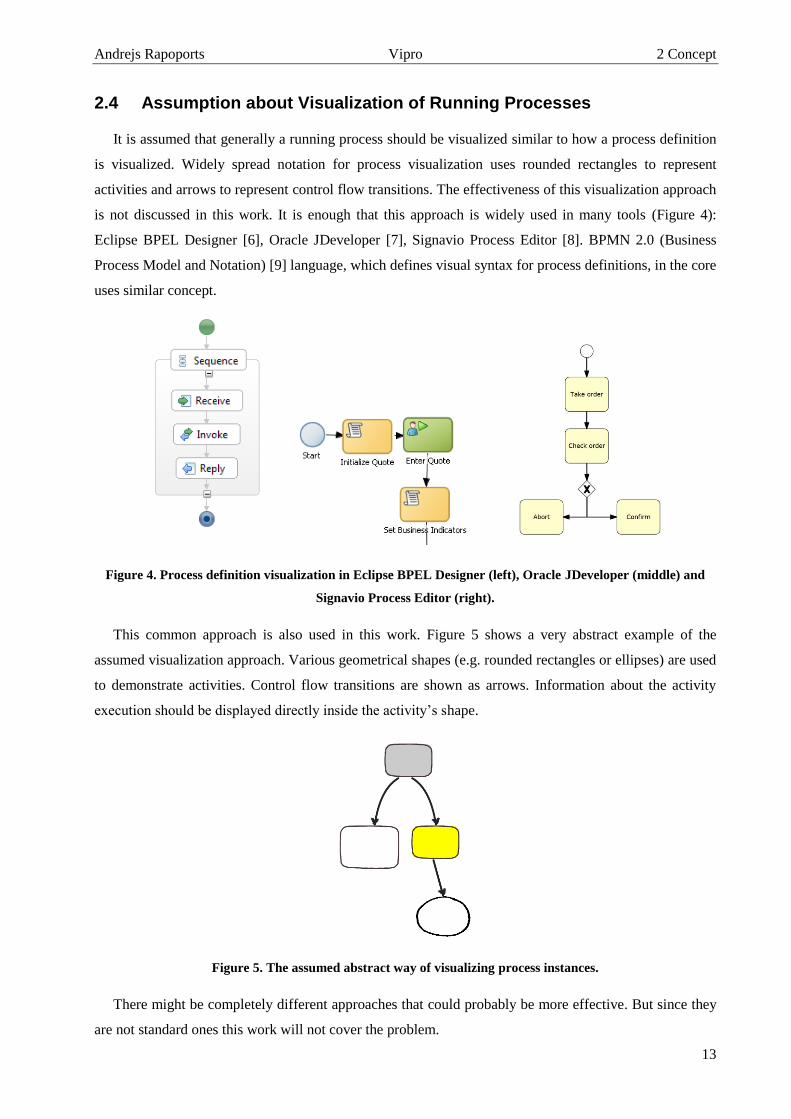
2.4 Assumption about Visualization of Running Processes
It is assumed that generally a running process should be visualized similar to how a process definition
is visualized. Widely spread notation for process visualization uses rounded rectangles to represent
activities and arrows to represent control flow transitions. The effectiveness of this visualization approach
is not discussed in this work. It is enough that this approach is widely used in many tools (Figure 4):
Eclipse BPEL Designer [6], Oracle JDeveloper [7], Signavio Process Editor [8]. BPMN 2.0 (Business
Process Model and Notation) [9] language, which defines visual syntax for process definitions, in the core
uses similar concept.
Figure 4. Process definition visualization in Eclipse BPEL Designer (left), Oracle JDeveloper (middle) and
Signavio Process Editor (right).
This common approach is also used in this work. Figure 5 shows a very abstract example of the
assumed visualization approach. Various geometrical shapes (e.g. rounded rectangles or ellipses) are used
to demonstrate activities. Control flow transitions are shown as arrows. Information about the activity
execution should be displayed directly inside the activity’s shape.
Figure 5. The assumed abstract way of visualizing process instances.
There might be completely different approaches that could probably be more effective. But since they
are not standard ones this work will not cover the problem.

2 Concept Vipro Andrejs Rapoports
14
2.5 Similar Works
2.5.1 “Customizable Representation of Process Models”
In his diploma thesis “Customizable representation of process models” [10] Eugen Krämer tried to
find a proper model for flexible representation of process activities. The aim was to find a way to
visualize running process instances where each activity would have its own graphic, which would
correspond to the state of the activity and make the whole visualization more readable.
He came up with a model that is based on rules that modify the used notation. The notation consists of
SVG (Scalable Vector Graphics) [11] graphics. These SVG graphics can be modified by special rules. He
used the fact that SVG is an XML format and any modification can be achieved by changing the DOM
(Document Object Model) node tree [12]. Three types of operations were defined: change attribute,
change content, replace target node. Using these operations a new element can be added to the graphics.
These rules can also be mapped to concrete activities of the process. Activities can be referenced only by
using their type or name. Rules can also be mapped to process data. How the process instance data is
obtained was out of scope of the work and only an abstract definition was given.
Modification rules, templates and abstract process data were composed together into “visual
configurations”. Figure 6 illustrates how this happens.
Figure 6. Composition of visual configurations in [10]. Figure is taken without any modifications from [10].
To check the model Eugen created a prototype for the template system. The prototype was based on
BPI – an existing framework for process visualization – a detailed report about BPI is provided in chapter
3.4.1. The prototype proved that the concept works. Additional tools were out of scope of the work.
However, the template rules were created manually and process data was not really used because Process
Mining was intentionally left out of the work.

Andrejs Rapoports Vipro 2 Concept
15
Following advantages and drawbacks of the solution, which Eugen proposed in his work, are
important for this work:
Advantages:
SVG, as the format for templates, works very well.
BPI, as the base for customizable process visualization, works well too.
Drawbacks:
The usage of modification rules, that are separate from the template, is not the best choice,
because they are difficult to maintain. Rules are maintained outside of the template, because the
template is a standard SVG file. Nevertheless, the rules are tightly coupled with the template and
cannot be reused without it.
Limited number of ways to reference activities. According to the BPEL specification “name”
attribute of an activity element is optional. As a result, in some cases the original process
definition must be changed and “name” attributes must be inserted.
Although the activities are visualized dynamically no additional Run-Time data can be shown.
Conclusion: Eugen’s work showed that it is possible to make process representation customizable. In
his work he defined most of the main problems: how to define templates, which visualization engine to
choose, how to reference activities. Also he showed possible ways to solve them. Some ways were
successful: BPI as visualization engine, SVG for graphics. Some proposed solutions were not
satisfactory: rules defined externally, referencing activities by name or type. All the solutions, regardless
of their success, are important and were taken into consideration when writing this work.
2.5.2 “Configurable Visualization of Complex Process Models”
In his PhD thesis [13] Ralph Bobrik described an approach for configurable visualization of processes.
It is also described in [14]. He proposed a way to make process visualizations configurable and
personalizable. Visual configurations are made by using a notation definition that is based on SVG.
Personalization is made by using CSS (Cascading Style Sheets) and allows different users, who monitor
the process, to have own settings applied. Notation definition consists of template definitions, where each
template definition “consists of three specification parts: 1) input parameters of the template, where
references to processes elements are handed over; 2) representation of the symbol in SVG; 3) parameters
(e. g. name of activity, activity state, starting time, etc.) to be filled with process data values. <…> Within
the parameter sections, XPath expressions (relative to the SVG-symbol root) are used to describe the
location of the corresponding text area” [14]. A template can define data transformations using Java
Script. Application of templates to a process is done in a complicated language “using ‘if-then-else’-like
statements together with a first-occurrence-wins policy” [14]. Both formats are shown in Listing 1.

2 Concept Vipro Andrejs Rapoports
16
Run-Time Data can be used to fill templates. The proposed approach requires, that in visual
configuration some sort of generic “data requests” are declared. They rely on a special generic data
provider component that can be connected to any WfMS. The architecture of the provider component is
quite complicated and allows both pull and push strategies for data collection (chapter 7.2.3 in [13]).
Listing 1. Definition of templates (left) and their usage (right) in [14]. Listing taken from [14].
The solution proposed by Ralph has the following (important for this work) properties:
Creation of templates requires knowledge of a specific format. It means that the template
creator must be familiar with this format and with technologies like XPath and Java Script.
Although templates are SVG-based, normal SVG files cannot be used – they must be cut in
pieces and put into the “symbol section” (Listing 1). Obviously this is a disadvantage.
Visual configuration format is complicated and not straight forward. The drawback is that the
visual configuration cannot be easily changed when the process changes.
The way, how the Run-Time data is integrated into the visual configuration, is tightly coupled
to the underlying data provider component. It makes the usage of the visualization
functionality impossible without installation of that component.
Conclusion: Ralph’s work showed that the idea of configurable visual representations works. But his
solution lacks loose coupling between the components. Visual templates cannot be created by a usual
visual designer, because many technical skills are required, too. Such specialists rarely exist. But in the
Vipro work one of the objectives (O1) is to make it possible for any visual designer to collaborate in an
efficient way. Although the proposed way of collecting Run-Time data satisfies the other objective (O2),
it is quite difficult and can be made in a simpler way.

Andrejs Rapoports Vipro 3 Vipro Specification
17
3 Vipro Specification
This chapter describes the solution to the concept described in chapter 2. Similar works were also
taken into account. The secondary aim here was to reuse existing formats and tools as much as possible.
In order to make the work more clear all new formats and tools got a prefix “Vipro” which stands for
“Visualized Process”. Further this prefix will be frequently used and will mark originally created formats
and tools or formats and tools that are based on some foreign solutions which were extended for needs of
this work.
Specification is based on Use Cases defined before. Each of Design-Time Use Cases got an editor and
file format which supports its execution.
3.1 Process Formats and Editor
Existing language BPEL and editor Eclipse BPEL Designer are used for creating process definition
(A1). Own formats are used for process instance data definition. This chapter explains these decisions.
3.1.1 Process Definition Format
The BPEL format is used for process definitions [4]. It is an industry standard for business process
definitions based on Web services technology. BPEL provides a language for the specification of abstract
and executable business processes. “Abstract processes describe process behavior partially without
covering every detail of execution. An Abstract Process can be ‘implemented’ by a set of executable
processes” [15]. This corresponds to the Use Case UC1 were Business Analyst first creates an abstract
process and then Process Modeler makes it concrete. The number of available tools and engines that
support BPEL is another advantage.
In January 2011 a new language BPMN 2.0 [9] was approved. It combines the features of both BPEL
and BPMN 1.2, which is purely graphic notation with no strict semantic. BPMN 2.0 is not widely
supported at this moment.
The main disadvantage of both formats (BPEL and BPMN 2.0) is that they do not describe data that is
created when a process runs. The reason is that there are many different WfMS supporting these
languages and they save instance data differently. The fact is that there is no standard way of getting
instance data. That is why a new format is required.
3.1.2 Process Editor
Since BPEL was chosen as the format for process definition any BPEL editor can be used to create
processes. For test cases used in this work the Eclipse BPEL Editor [6] was used. No changes to the
editor were required.

3 Vipro Specification Vipro Andrejs Rapoports
18
3.1.3 Process Instance Data
As mentioned above data that is created when process is executed is out of scope of the BPEL
standard. Usually the stored data is data about the state of activities – start time, stop time, result. More
diverse data is out of scope of the WfMS. For example, the amount of used electricity or security level.
Information like this must be specially collected when the activity is executed.
Apache ODE [16] was analyzed as an example. It uses a mediator called “ODE Data Access Objects”
that abstracts the data storage layer (Figure 7). It means that depending on concrete appliance different
DBMS (Database Management System) can be used. ODE stores only basic data about the executed
process that is required to restore execution in case of a crash. It is possible to get start time, end time,
current state of activities and that is all. Collection of other information is out of scope of ODE.
Figure 7. Architectural overview of ODE. Figure taken from [17].
This motivation resulted in the decision that somewhere the line must be drawn. As a result, a new
format for instance data has been created. The Vipro solution will use this format and if it will be
necessary to integrate it into a system then a corresponding mediator must be implemented. The creation
of mediators is left outside of this work. It is assumed that it is a simple task.
Requirements:
Format for Run-Time data (A5) must be found. Regardless of the implementation it is named
Vipro Instance Data.
Because the structure of instance data is also unknown and depends on a process there should
also be a way to specify it (A2). This format is named Vipro Instance Metadata.
Both formats must be based on XML since it is de-facto the base of all up-to-date formats.
Vipro Instance Metadata must help at Design-Time to build the configuration.
Vipro Instance Metadata must validate at Run-Time the incoming data instance data.

Andrejs Rapoports Vipro 3 Vipro Specification
19
3.2 Visual Templates
For visual templates (A3) an extended SVG format is used – Vipro SVG. This chapter explains why it
was chosen and what the requirements are.
3.2.1 Vector or Raster
The first question was whether to use a vector or a raster format.
Vector format – graphic consists of compose geometrical primitives such as point, lines, curves and
shapes. It can be scaled without any limits. Some elements may be made variable, because it is possible to
manipulate with the primitives. Main drawback is that vector format is not applicable for graphics that are
originally in raster format (like photos). But raster graphics can be included in some vector formats (this
is shown in chapter 7.2).
Raster format – consist of pixels. Main drawbacks are that it cannot be scaled and it is hard to make
some places dynamic. It is only possible to manipulate with pixels.
Vector format was chosen because it has fewer drawbacks, no open issues for required purposes.
3.2.2 Which Vector Format
Next question was which vector format to choose? It could be an own format but it would be an
extremely difficult solution, since both an editor and a viewer are required. There is already an industry-
standard open format for vector graphics: SVG (Scalable Vector Graphics) [11].
“SVG files are designed to be platform- and device-independent, with a hierarchical structure enabling
sets of vector graphic primitives to be grouped together and manipulated as shapes. <..> Certain graphics
elements (e.g. circle, polygon, rectangle) and groups are defined as XML elements. The properties of
these elements are defined using XML attributes to describe their appearance e” [18]
SVG can be viewed in any modern browser or converted to a raster format PNG (Portable Network
Graphics), which can be viewed anywhere.
[10] has also showed that SVG can be used for similar purpose. Critical drawback there was the
external rules definition. From this follows that a new format based on SVG should be defined and it
must remain compatible with SVG. Concrete realization of the Vipro SVG is discussed in chapter 5.2.2.
3.2.3 SVG Editor
An editor for templates was necessary. It could be any SVG editor because the chosen format is
compatible with SVG. For this work Inkspace [19] is proposed. It is available for free.

3 Vipro Specification Vipro Andrejs Rapoports
20
3.3 Visual Representation Configuration
The purpose of visual representation configuration is to compose the rest of the artifacts together.
Artifacts created in Use Cases UC1 and UC2 – process definition (A1), Run-Time data definition (A2)
and visual templates (A3) – are created independently. Visual representation configuration (A4) makes
them work together. It should have been a new format, as no analogous standards exist. The new format is
called “Vipro Configuration”. Vipro Configurations should be created by the Information Designer using
“Vipro Editor”. Requirements for both Vipro Configuration and Vipro Editor are described in this
chapter.
3.3.1 Configuration Format
Vipro Configuration file format has to meet following requirements:
XML-based. As any other format used in this work.
It should combine process definition, Vipro Templates, Vipro Instance Metadata and Vipro
Instance Data.
3.3.2 Value Mapping
Vipro Configuration defines how the values of the Vipro Instance Data should be brought into the
template. Vipro Configuration does not define any transformation for the values. However sometimes it
may be required.
It is intentionally not covered in this work in order to keep it simple. In this work this problem will be
only outlined but not solved.
The outline of the problem. Two value ranges are given. They may be of different types. Ssimple and
complex types are permitted: integer, string, boolean, HEX color (a string consisting of six HEX
numbers), enumeration etc. In general, there must be a way to map all possible combinations of these
types. For example a set of values (string enumeration) may be mapped to a HEX color representation.
Another example is easier: an integer range 1...100 should be mapped to an integer range 1...5.
Sometimes the ranges may be dynamic too and will be provided only at execution time.
A concrete and more complex example: WfMS provides information about electricity consumption by
each activity. It is measured in kWh (kilowatt hour). It should be visualized by using the size of the
activity rectangles. A corresponding template assigns width in range of 100 and 500 pixels. The range of
possible electricity consumption is generally not limited but Business Analyst wishes for the maximum
value to have the width of 500 pixels in each concrete case.
A formal notation that would support such transformations is not trivial. I. e. it is an inherently
complex task. Also another upcoming diploma thesis is going to cover it [20]. Those are the reasons why
it is left outside of this work.

Andrejs Rapoports Vipro 3 Vipro Specification
21
In some cases there may be another way to achieve the required functionality. As will be shown later
in chapter 4.1.2, the monitoring and analysis application has to transform the concrete WfMS instance
data to the Vipro Instance Data. Here the pattern “Messaging Mapper” can be a used. Figure 8 shows the
sketch of the “Messaging Mapper” pattern. When used, the monitoring and analysis application would
transform instance data talking into account the needs of the template. The main drawback would be tight
coupling between template and the mapper software.
Figure 8. Sketch of the “Messaging Mapper” pattern [21].
3.3.3 Editor
Vipro Configuration editor should be an application where a new Vipro Configuration can be built
from scratch.
3.4 Monitoring and Analysis Service
The purpose of the monitoring and analysis service is to utilize everything created before and create a
visualization of process that can be used for monitoring or analytical purposes.
3.4.1 Layout Engine
To create a complete visualization of a process a layout engine is required. It should arrange graphics
of single activities into a complete picture that represents the state of the process instance. For this
purpose the existing layout engine within BPI was used. BPI stands for “Business Process Illustrator” and
was developed as part of the diploma thesis “Business process views as tool for running instances
visualization” by Gregor Latuske [22].
The goal of that work was to define methods and techniques that would allow to use process view
transformations for business process monitoring purposes. The central point was the development of an
algorithm for process views visualization. In his work Gregor implemented a data model for process
models and process instances and kept it independent from process definition language. In the reference
application BPEL is used. Because of special interface, BPI does not depend on any WfMS. An adapter to
Apache ODE was also implemented. BPI works only with basic information about running process
requiring following properties for each activity: start time, stop time, state, type and name. But these
properties are enough to generate different views.

3 Vipro Specification Vipro Andrejs Rapoports
22
BPI features an advanced layout engine that is inspired by BPEL2SVG generator from Sun [23]. In the
kernel it utilizes a layout algorithm that consists of two steps: size calculation of each activity including
their child activities and positioning of activity boxes. Both steps start at the root activity and are
recursively executed on all child activities until leaf activities are processed. All graphics that represent
activities are made in SVG and hard-coded into BPI. Due to ability of BPI to support two different
display modes – full and compact – the layout engine can work with boxes of different sizes. Figure 9
shows an example visualization made by BPI.
Figure 9. Made with BPI visualization of a process.
Two major limitations –fixed set of activity properties and hard-coded graphics – prevent the direct
utilization of BPI for purposes of this work. However, the layout engine can be reused with relatively
small effort as shown by Krämer [10]. BPI is licensed under Apache Software License, Version 2 [24]
meaning that the source code is available and can be reused without any obligations (except license
notice). Krämer [10] has also shown that BPI can be extended.
3.4.2 Visualization Service
A monitoring and analysis service itself is out of scope of this work because it is a complex system
that usually depends on a concrete WfMS. But without any real service implementation at all this work
would be incomplete. In order to solve this problem a Web service should be created. It has to remain
stateless and get the complete context with every visualization request. Such an interface will make it
easy usable by any monitoring and analysis framework and this work will be logically complete.

Andrejs Rapoports Vipro 3 Vipro Specification
23
3.5 Process Views
A process view is an abstract variant of a process model, in which some details were omitted and some
transformations were applied [25]. Different process viewing patterns exist [25]: “four pattern groups that
concern transformations of (i.) process structure, (ii.) presentation, (iii.) inter-view relation and (iv.)
augmentation.” All the “Presentation patterns” do no transformation to the process and only affect its
visualization. Moreover, “Presentation patterns” are applied after all other types of patterns. “Presentation
patterns” are divided in few subgroups:
“Scheme patterns” – affect the fundamental visualization principle (graph, tree, block scheme
etc.).
“Layout patterns” – affect the layout (horizontal, vertical etc.)
“Theme patterns” – adds additional structuring to the visualization (activities can be grouped
according to some additional parameters)
“Appearance patterns” – affect the appearance of each activity being visualized (size, color etc.)
Vipro corresponds solely to the group “Presentation patterns”. It enables the custom “Appearance
patterns” to be used. It uses a fixed “Scheme pattern”, a fixed “Layout pattern” and no “Theme pattern”.
As shown in chapter 9.2 “Outlook”, Vipro can be improved to cover all the “Presentation patterns”.
All other process viewing patterns were left outside of this work. Vipro is focused of the “Presentation
Patterns” and might be used together with other transformations.
3.6 Summary
Many different pieces mentioned before are needed to realize the concept. Table 2 lists all those pieces
and decisions that were made for each of them.
Artifacts/Components Realization way
Process definition format (A1) Use existing – BPEL
Process definition editor Use existing – Eclipse BPEL designer
Process instance metadata format (A2) To define
Process instance data format (A5) To define
Template format (A3) To define (based on SVG)
Template editor Use existing – Inkspace
Visual representation configuration format (A4) To define
Visual representation configuration editor To create
Visualization service To create (based on BPI)
Table 2. Required components and documents and their realization way
Next chapters show the way how the elements in this list have been implemented.

4 Vipro Architecture Vipro Andrejs Rapoports
24
4 Vipro Architecture
This chapter describes the developed architecture. It is based on the specification from the previous
chapter and satisfies all the requirements stated there.
4.1 Vipro Web Service
As decided before a monitoring and analysis application was left outside of this work. Only a Web
service was implemented and this chapter explains its architecture.
4.1.1 Structural View
A monitoring and analysis application should work on top of Vipro Web service, WfMS and DBMS
as shown on the Figure 10. Vipro Web service is used to request visualizations of processes. The
information about the process instances or analytical data comes from DBMS that is augmented by the
WfMS or other components. Monitoring and analysis application can also directly communicate with
WfMS if there is an interface.
Figure 10. Place of Vipro Web service in overall architecture of a monitoring and analysis application.
4.1.2 Behavioral View
Vipro Web service is meant to be utilized by the monitoring and analysis application. Vipro Web
service is stateless and has a single operation that creates visualization for a specified context. That
context should be maintained by the monitoring and analysis application. To the context belong:
BPEL process definition – it is taken from the WfMS once in the very beginning.
Set of templates – templates produced by the Template Designer, they are deployed together
with Vipro Configuration.
Vipro Instance Metadata – Run-Time data format definition is prepared by the Information
Designer and describes what the Run-Time data should look like. It is deployed together with
Vipro Configuration.
Vipro Configuration – it is prepared by the Information Designer. It maps process definition
with templates and with instance metadata. It is deployed to the monitoring and analysis
application in the very beginning.
Vipro Web service WfMS
Monitoring and Analysis Application
DBMS

Andrejs Rapoports Vipro 4 Vipro Architecture
25
Vipro Instance Data – it should be generated by the monitoring and analysis application from
the Run-Time instance data provided by the WfMS. The concrete way depends on the WfMS
implementation but usually all the data can be read from the database that is used by the
WfMS.
Figure 11 illustrates the proposed behavior of a monitoring and analysis application that utilizes Vipro
Web service. Each time visualization is created two steps should be performed. First, retrieve the Run-
Time instance data (step 1). Then send it together with context data to the Vipro Web service and get the
requested graphic (step 2).
Figure 11. Reference behavior of the monitoring and analysis application that wants to utilize Vipro Web
service
Vipro Web service
Monitoring and analysis application
WfMS
DB
RuntimeData
BPEL(A1)
BPEL(A1)
Vipro InstanceData (A5)
Step 2
Step 1
TemplateSVGs (A3)
ViproCfg (A4)
Vipro Instance
Metadata(A2)
SVG

4 Vipro Architecture Vipro Andrejs Rapoports
26
4.2 Vipro Editor
4.2.1 Structural View
Vipro Editor allows Vipro Configuration and Vipro Instance Metadata to be created. It is a Web
application that uses three-tier architecture. User Interface runs in Web browser at the user side. Web
browser communicates with Servlet container at the server side. Servlet container is logic tier and uses a
file system to store data. Figure 12 illustrates this architecture.
Figure 12. Architecture of the Vipro Editor – it is a three-tier Web. Elements placed directly above other
elements utilize them.
This architecture’s main advantage is simplicity. The Information Designer does not need to install
anything and can start the application from any computer with a Web browser. Data tier is realized using
a file system. This is not a common solution for Web applications, usually a DBMS is used. But for needs
of Vipro Editor a DBMS is not necessary and file system is much easier to use and no installation is
needed. Since the purpose of this work is scientific, it is not necessary to fill the Vipro Editor with a
variety of functions and features for marketing or productizing.
Web Browser
Servlet Container
File System
Presentation tier:
Logic tier:
Data tier:

Andrejs Rapoports Vipro 4 Vipro Architecture
27
4.2.2 Behavioral View
Vipro Editor should be used by the Information Designer to help create Vipro Instance Metadata and
Vipro Configuration. The reference interaction is illustrated in Figure 13. First, required artifacts –
process and templates – are uploaded (step 1) and saved to the file system (step 2). Then, using interactive
interface, the user creates Vipro Instance Metadata (step 3) which is also saved to the file system (step 4).
After that the user creates a Vipro Configuration (step 3), which is also saved to the server’s file system
(step 4). Finally, the user downloads all artifacts as a single archive (step 5). The received archive
together with Vipro Instance Data can be used to request visualization from Vipro Web service.
Figure 13. Reference interaction of the user with Vipro Editor.
Vipro Editor File System
BPEL(A1)
BPEL(A1)
TemplateSVGs (A3)
Vipro Instance
Metadata(A2)
ViproCfg(A4)
TemplateSVGs(A3)
1. Upload existing files
2. Save files
3. Input new data interactively
4. Create new files
5. Request results
6. Get files
7. Receive results
Archive
Archive

5 Vipro Artifacts Vipro Andrejs Rapoports
28
5 Vipro Artifacts
This chapter describes all artifacts that were created for Vipro: Vipro SVG Template (A3), Vipro
Instance Metadata (A2), Vipro Instance Data (A5) and Vipro Configuration (A4). BPEL process
definition (A1) is not being discussed in detail because no changes to BPEL standard were made.
5.1 Artifacts Stack
A number of different artifacts was defined before. Figure 14 illustrates their dependencies. Elements
placed directly above other elements depend on them. BPEL process (A1) does not depend on any other
element. So do Vipro SVG templates (A3). Vipro Instance Metadata (A2) is build based on Database
schema that is used by WfMS. Vipro Instance Data (A5) depends only on Vipro Instance Metadata. Vipro
Configuration (A4) depends on all of them because it composes them together.
Figure 14. Artifacts and their dependencies. Elements placed directly above other elements depend on them.
5.2 Vipro Templates
Vipro Templates (A3) are created in UC2. As defined in chapter 3.2, Vipro Templates must be
compatible with SVG.
5.2.1 Extensions Points
The next question was how to make SVG serve as a template. Some places of the graphics must be
filled later at Run-Time. SVG does not support such a feature, so some changes had to be made.
Two options were possible:
Extend the SVG format.
Add an additional file that defines extension points in the SVG file.
BPELProcess (A1)
Vipro SVGTemplates (A3)
Vipro InstanceData (A5)
Vipro Configuration (A4)
WfMS Database
ViproInstance
Metadata (A2)

Andrejs Rapoports Vipro 5 Vipro Artifacts
29
Extended SVG file was chosen, because it does not require an additional file which would make the
management of the artifacts more complicated. The extensions can be made without breaking the
compatibility with existing SVG editors. It is possible because SVG is an XML-based format.
5.2.2 Vipro SVG
Through using own imported schema it is possible to add additional attributes to any node of the SVG
file.
5.2.2.1 Namespace Import
Own namespaces have to be added to the document first – prefixes “vipro” and “viprometa”. On the
Listing 2 two additional namespaces are imported.
<?xml version="1.0" encoding="UTF-8" standalone="no"?>
<svg
xmlns="http://www.w3.org/2000/svg"
...
xmlns:vipro="http://arapoport/vipro-svg"
xmlns:viprometa="http://arapoport/vipro-svg-meta"
> ...
</svg>
Listing 2. Import of additional namespaces into the ordinary SVG file.
The “vipro” prefix will allow attributes and nodes to be made dynamic. “viprometa” prefix will allow
to set the size for the template.
5.2.2.2 Spots Definitions
Places where the content of SVG file is made dynamic are called “Spots”. A Spot has an identifier that
is used to map it to a data field from Vipro Instance Data or to a static value. It serves as a placeholder.
Using two new namespaces it is possible to add own attributes to any node. Listing 3 shows the
attribute “vipro:style” that makes a new Spot from the ordinary attribute “style”.
<rect
id="rect2985"
...
style="fill:#0000ff;"
vipro:style="fill:#{BackgroundId:'Color of the background':hex-color};"
/>
Listing 3. Vipro attribute that makes ordinary attribute dynamic without breaking the SVG syntax. The
content of curly brackets describes the Spot and will be replaced at Run-Time.
Using the namespace “http://arapoport/vipro-svg” (mapped to the prefix “vipro”) any attribute or
node can be made a dynamic Spot. Each Spot will be filled with data at Run-Time. If something goes
wrong or no data is mapped to the Spot then the default value from the original attribute will stay in its
own place.

5 Vipro Artifacts Vipro Andrejs Rapoports
30
To make an attribute a Spot a new additional attribute next to it has to be inserted. The value of the
original attribute can stay unchanged – it will be replaced at Run-Time. Name of the additional attribute
has to consist of the namespace prefix (“vipro:”) and the name of the original attribute, where all colons
(“:”) are replaced by two underscores (“__”). The value of the additional attribute must have a dynamic
part marked by curly brackets (“{…}”). At Run-Time everything outside these curly brackets will be left
untouched and the curly brackets and their content will be replaced by the dynamic value. Inside the curly
brackets a special syntax applies:
[Spot ID]:'[Spot description]':[Type]:[Optional]
Each element in square brackets has its own semantic:
Spot ID – is the identifier of the Spot. Different Spots can have same identifier but in this case
they both will get same value at Run-Time. It can consist of any alphanumerical characters.
Spot description – is the description of this Spot. It will be shown to the Information Designer
who will work with the finished template. It can consist of any character that are allowed for
XML attributes except apostrophe (‘).
Type – is the type of value that can be put into this Spot. Allowed values are: “int”, “string”,
“hex-color”, “enum”.
Optional – is an optional parameter that may be required for some types.
Type declaration allows checking at Run-Time if the inserted values are valid. Type “int” corresponds
to an integer type, “string” – to a string, “hex-color” – to a hexadecimal number with 6 positions (a
common way to define colors), “enum” – an enumeration type, all possible values must be specified in
the “Optional” parameter as a comma separated string.
5.2.2.3 Node Values
In some cases a node value must be made dynamic. For example value of the “text” node in SVG. It is
solved using a special attribute too. Another solution would be a special additional node. But in this case
it would possibly break SVG schema in places where no additional child nodes are allowed.
The special additional attribute must belong to the node that needs to be dynamic. The name of the
attribute must be “vipro:viproNodeValue”. This will make the node value a Spot. The value of the
attribute has the same syntax as dynamic attributes. Listing 4 illustrates how it is done.
<text
id="text6658"
...
vipro:viproNodeValue="{NameId:'Name of the activity':string}"
> Name
</text>
Listing 4. Vipro attribute that makes a node value dynamic.

Andrejs Rapoports Vipro 5 Vipro Artifacts
31
The value of the node will be replaced with the dynamic value at Run-Time. The original value can
still be shown at Run-Time if no value was mapped to this Spot.
5.2.2.4 Size Definition
The Vipro SVG must have a special size definition. Width and height in pixels must be put into
special attributes in the SVG root element as shown in Listing 5.
<svg
...
xmlns:viprometa="http://arapoport/vipro-svg-meta"
viprometa:templateWidth="150"
viprometa:templateHeight="30"
> ...
</svg>
Listing 5. Two special attributes in the root element of an SVG document that tell the size of the template.
These values are necessary because not every SVG document has a fixed size. Concrete size is
required for working with the graphic and placing it in complex layouts where many activities are
displayed.
The size of the template can be made dynamic by making these two attributes dynamic. In order to do
this, two more attributes must be placed in the root element. They will make the “viprometa” attributes
dynamic. Also two additional attributes must be inserted into the SVG document at the place where
graphic’s normal width and height are set. Listing 6 illustrates this case.
<svg
...
viprometa:templateWidth="150"
viprometa:templateHeight="30"
vipro:viprometa__templateWidth="{WidthId:'Width':int}"
vipro:viprometa__templateHeight="{HeightId:'Height':int}"
>
...
<rect
width="150"
height="30"
vipro:width="{WidthId:'Width':int}"
vipro:height ="{HeightId:'Height':int}"
... />
...
</svg>
Listing 6. Two attributes that make width and height definition dynamic.
In this example first width and height are set to default values. Then both pairs of attributes are made
dynamic and get corresponding common Spot IDs. Due to common IDs there will be only two Spots –
“WidthId” and “HeightId” available in this template. Illustration of this behavior can be found in chapter
8.1.

5 Vipro Artifacts Vipro Andrejs Rapoports
32
5.2.3 Editor
The editing process consists of two steps: creating a graphic and adding Vipro Spots. The first step can
be done in Inkspace [19]. The second step can be completed in Inkspace or in any XML editor. Inkspace
has a built-in XML editor. If the Template Designer is aware of the SVG syntax then Vipro Spots must be
added by the Information Designer.
5.3 Vipro Instance Metadata and Data
Formats for two artifacts – Vipro Instance Metadata (A2) and Vipro Instance Data (A5) – are tightly
coupled because Vipro Instance Data must correspond to Vipro Instance Metadata. Figure 15 shows the
relation between Vipro Instance Data and Vipro Instance Metadata in context of 4-level modeling
architecture [26]. Vipro Instance Data describes the real data of a running process. Vipro Instance Data is
described semantically by Vipro Instance Metadata and syntactically by XML Schema [27]. XML
Schema describes both Vipro Instance Metadata and XML Schema (self-reference). XML Schema
appears because both formats must be XML formats (see 3.1.3).
Figure 15. Relation between Vipro Instance Data and Vipro Instance Metadata in 4-level modeling
architecture.
5.3.1 Vipro Instance Metadata
5.3.1.1 Choice of Format
Vipro Instance Metadata has three main purposes:
1. Metamodel for Run-Time data (model for Vipro Instance Data).
2. At Design-Time to help building the Vipro Configuration.
3. At Run-Time to validate the incoming Vipro Instance Data.
Two solutions are possible:
Data
Models
Metamodels
Meta-metamodel
Real data
Vipro Instance Data
Vipro Instance Metadata
XML Schema
described by
described by
described by XML Schema

Andrejs Rapoports Vipro 5 Vipro Artifacts
33
XML Schema
New format
XML Schema is an industry standard for metamodels. Another advantage is that many enterprises that
run WfMS might already have an XML Schema for their instance data and could reuse it. First drawback
is that it is too powerful. At Design-Time (Purpose 2) it would be a complex task to completely support
the XML Schema. Because of the time limit of this work it is not possible to create a tool that would
support XML Schema at Design-Time. Another drawback is that validation (Purpose 3) would not be
fault-tolerant. XML validators report an invalid document even if there is only a single error. For real-
world applications it is not a problem, but for the prototype, the main goal of which is proving the
concept, it would make things more complicated.
New format. Anything can be defined here. But since XML Schema would be the perfect solution for
the production use, the new format must fix its disadvantages for the use in this work. Also, it must be
simple and small errors like exceeding the range of a variable must be tolerated.
Only because of simplicity reasons the new format was chosen.
5.3.1.2 Format Description
Although XML Schema was not chosen as the format for Vipro Instance Metadata it is used to define
the syntax of the new format.
The new format was named RTD-Format (Run-Time Data Format). It contains a list of parameters.
Each parameter has a type. At Run-Time each activity must have a single value for each of the
parameters.
Namespace for the new format: “http://arapoport/rtd-format”. Figure 16 shows its root type –
“RTDFormatType”. It has two child nodes – optional “meta” of “MetaType” and required “parameters”
of “ParametersType”. “MetaType” holds information about the file, for example, name of the defined
format. “ParametersType” holds list “ParameterType” elements.
Figure 16. Root element of the Vipro Instance Metadata format. It has two child nodes – “meta” and
“parameters”.

5 Vipro Artifacts Vipro Andrejs Rapoports
34
Figure 17 shows “ParameterType”. It has two required attributes and three optional child nodes.
Attribute “name” holds the identifier of the parameter. Attribute “type” holds the type of the parameter
and can have only two values – “string” or “int”. The type “string” means string type and can be
constrained by optional “enumeration” node. “enumeration” node, if present, must contain a comma-
separated string of all allowed values. The type “int” means integer type. It can be limited to a specific
range using two optional nodes “min” and “max”. “min”, if present, defines the lower inclusive boundary
and “max” – the higher inclusive boundary. Error-tolerance: if “type” has an incorrect value then “string”
must be used. If an optional node contains an incorrect value or does not correspond with the type then it
must be ignored.
Figure 17. “ParameterType” of the Vipro Instance Metadata format. It has two required attributes and three
optional child nodes.
5.3.2 Vipro Instance Data
If XML Schema would be used as Vipro Instance Metadata then Vipro Instance Data would be a
normal XML document that corresponds to the schema. However, a new format was chosen for Vipro
Instance Metadata. It implies the content of Vipro Instance Data.
XML Schema is used to define the syntax of Vipro Instance Data. New format was named RTD-
Instance (Run-Time Data Instance). It contains a list of activities where each activity has a set of own
values for each parameter that were defined in Vipro Instance Metadata.
Namespace: “http://arapoport/rtd-instance”. Figure 18 shows the type of the root element. It has two
child nodes – “meta” and “activities”. “meta” of “MetaType” holds the name of the used Vipro Instance
Metadata format. “activities” is of “ActivitiesType” and holds a list of activities.

Andrejs Rapoports Vipro 5 Vipro Artifacts
35
Figure 18. Root element of the Vipro Instance Data format. It has two child nodes – “meta” and “activities”.
Figure 19 shows the “ActivityType”. It holds a list of “ParameterType” elements. Attribute “name” of
“ParameterType” references the parameter from Vipro Instance Metadata. Value of the “ParameterType”
node is the value of the referenced parameter. “ActivityType” also holds three optional attributes that are
used to reference one or more activities. With the use of “nodeName” the activity type can be specified –
in BPEL activity type is specified by the name of node that was used. Using two remaining attributes –
“attrName” and “attrValue” – it is possible to reference an activity by its attributes, for instance, by its
name. If an activity has an attribute with a name that is equal to “attrName” and value of the attribute
equals “attrValue” then it will be referenced.
Figure 19. “ActivityType” of the Vipro Instance Data format. It holds three attributes that reference an
activity and a list of parameter values.
All three attributes can be used. In that case both conditions must be satisfied. If none of the three
attributes is present then all activities are referenced. If an activity is referenced by multiple
“ActivityType” nodes then only one must be selected and following priority order applies:
Both type of activity and its attribute match the activity.
Only type was specified and it matches the activity.
Only custom attribute was specified and it matches the activity.
Nothing was specified.
In case of two “ActivityType” elements having same priority the first of them should be chosen.

5 Vipro Artifacts Vipro Andrejs Rapoports
36
5.4 Vipro Configuration
For the Vipro Configuration a new format was defined. It is described in this chapter. Editor for Vipro
Configurations is described in further chapters.
Vipro Configuration composes other artifacts: process definition, Vipro Templates and Vipro Instance
Metadata: each activity gets a template assigned and parameters of instance metadata are assigned to
variable places of the template
XML Schema is used to define the syntax of Vipro Configuration. Namespace used for it:
“http://arapoport/vipro-cfg”. Figure 20 shows the root type “ViproCfgType” of the Vipro Configuration.
It has a child “meta” that holds an optional description. The child “rtd-format” references Vipro Instance
Metadata. The child “process” – BPEL process definition. The child “mappings” holds a list of
“MappingType” elements.
Figure 20. Root element of the Vipro Configuration format. Besides of the meta information it references a
process definition and RTD-Format. Main content is the list of mapping rules.
Each “MappingType” contains two required child nodes (Figure 21) – “activity” of “ActivityType”
and template of “TemplateType”. “ActivityType” references one or more activities using their type or an
attribute. The same concept is used in Vipro Instance Data format, more details can be found in chapter
5.3.2. “TemplateType” references a single template by its file name. Also using list of “ParameterType”
elements it defines the way how the template must be filled with instance data.

Andrejs Rapoports Vipro 5 Vipro Artifacts
37
Figure 21. “MappingType” of the Vipro Configuration format defines a mapping rule – which activity gets
which template applied. “TemplateType” defines the template and how it should be filled.
“ParameterType” is described in Figure 22. “ParameterType” references a single Spot from template
using “spotid” attribute. It means that that Spot must be filled. It can be filled either with a value from
Vipro Instance Data or with a static value. “paramid” references a parameter from Vipro Instance
Metadata by its identifier. In that case parameter’s value from Vipro Instance Data will be inserted into
the template.
Figure 22. “ParameterType” of Vipro Configuration format defines how a single Spot (“spotid”) in Vipro
Template should be filled. It can be a static value (“staticValue”) or value from Vipro Instance Data
(“paramid”).
If “staticValue” is set, its value will be inserted into template without evaluating the Vipro Instance
Data. Two exceptions apply there. If “staticValue” equals “vipro:name” or “vipro:type” then respectively
name of the activity (“name” attribute in BPEL) or type of the activity will be used. Type of the activity is
limited to those which are used in BPEL: assign, catch, catchall, compensate, compensateScope,
compensationHandler, else, elseif, empty, end, eventHandlers, exit, extensionActivity, faultHandlers, flow,
forEach, if, invoke, onAlarm, onEvent, onMessage, opAqueactivity, pick, receive, repeatUntil, reply,
rethrow, scope, sequence, start, terminationHandler, throw, validate, wait, while.
These two shortcuts provide an easy way to reference most important properties of the BPEL process.
These properties do not depend on process execution results and it would be highly ineffective to put
them into Vipro Instance Data every time. Even icons that illustrate the type of the activity can be used,
since all possible values are explicitly defined.

6 Vipro Implementation Vipro Andrejs Rapoports
38
6 Vipro Implementation
This chapter describes all Vipro components and tools that have been implemented. Top-down
strategy is used for the explanation. First everything is explained on a very abstract level – which
components exist and what are the relations between them. Then the internal structure of each component
is described. Afterwards, every subcomponent is described.
6.1 Components Overview
The usage scenarios of Vipro Editor and Vipro Web service are completely different and belong to
different Use Cases: Vipro Editor helps the Information Designer in UC3. Vipro Web service is utilized
by the monitoring and analysis system in UC5. However, both applications deal with a common set of
Vipro artifacts: A1, A2, A3, A4, A5. It implies a common set of required functionality. The coarse-
grained component diagram (Figure 23) shows the relation of Vipro components. Common functionality
is covered by Vipro Library. Vipro Editor and Vipro Web service both use Vipro Library but do not
depend on each other.
Figure 23. Coarse-grained diagram of Vipro component shows that Vipro Library covers all common
functionality used by both Vipro applications that are independent between themselves.
Vipro Library does not depend on any other Vipro component and can be reused by external
applications.
Figure 24 shows the fine-grained diagram of Vipro components. The overall structure is the same with
Figure 23, but much more detail is shown. Everything is based on Java EE 6 (Java Enterprise Edition 6)
[28]. Vipro Library uses Apache Commons libraries [29] that contain some common functionality
missing in Java 6. Internally. Vipro Library has different subcomponents. “BPEL Parser” is responsible
for working with A1 (BPEL process definition) and was taken from BPI. Another subcomponent is
“Template Processor” that processes A3 (Vipro Templates) and produces visualizations for single
activities. Three subcomponents “Instance Metadata Processor”, “Cfg Processor” and “Instance Data
Processor” work respectively with following artifacts: A2 (Vipro Instance Metadata), A4 (Vipro
Configuration) and A5 (Vipro Instance Data). They utilize JAXB (Java Architecture for XML Binding)
[30] to work with corresponding files. Next subcomponent is “Layout Engine” which builds the resulting
Vipro Editor Vipro Web Service
Vipro Library
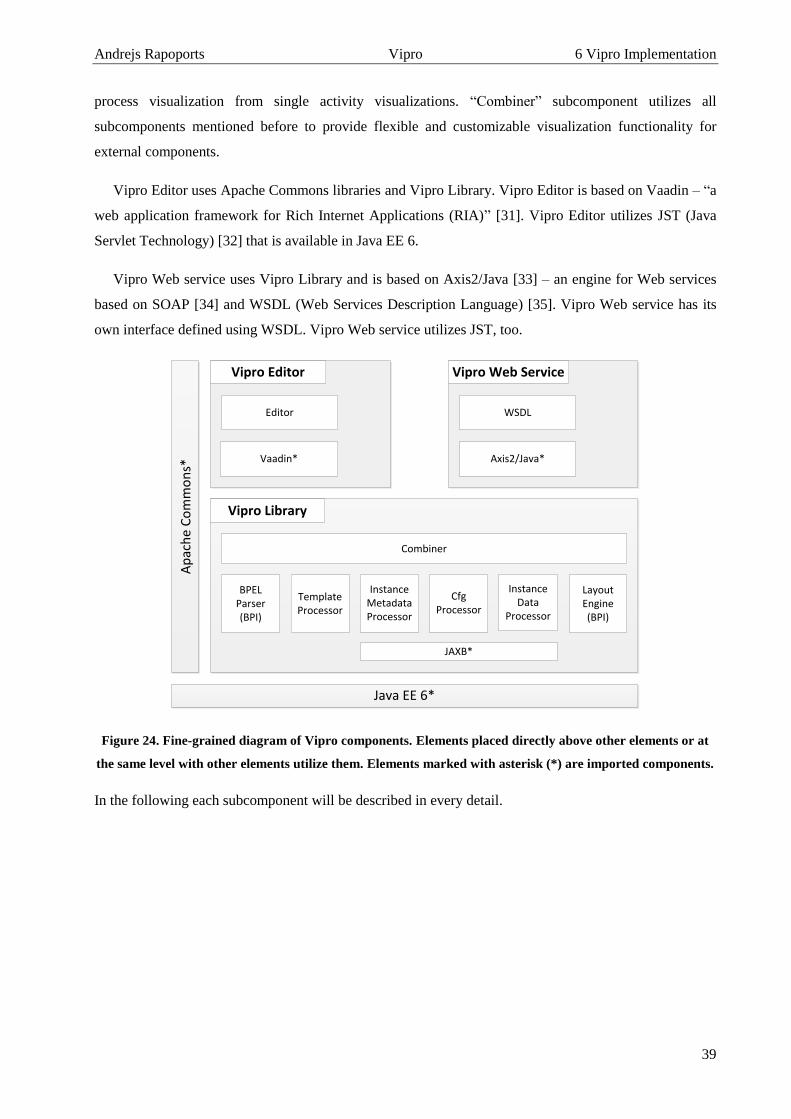
Andrejs Rapoports Vipro 6 Vipro Implementation
39
process visualization from single activity visualizations. “Combiner” subcomponent utilizes all
subcomponents mentioned before to provide flexible and customizable visualization functionality for
external components.
Vipro Editor uses Apache Commons libraries and Vipro Library. Vipro Editor is based on Vaadin – “a
web application framework for Rich Internet Applications (RIA)” [31]. Vipro Editor utilizes JST (Java
Servlet Technology) [32] that is available in Java EE 6.
Vipro Web service uses Vipro Library and is based on Axis2/Java [33] – an engine for Web services
based on SOAP [34] and WSDL (Web Services Description Language) [35]. Vipro Web service has its
own interface defined using WSDL. Vipro Web service utilizes JST, too.
Figure 24. Fine-grained diagram of Vipro components. Elements placed directly above other elements or at
the same level with other elements utilize them. Elements marked with asterisk (*) are imported components.
In the following each subcomponent will be described in every detail.
Editor
Vipro Editor
Axis2/Java*
Vipro Web Service
Vipro Library
TemplateProcessor
BPEL Parser(BPI)
Layout Engine(BPI)
Instance Metadata Processor
Instance Data
Processor
Combiner
Cfg Processor
WSDL
Vaadin*
Ap
ach
e C
om
mo
ns*
Java EE 6*
JAXB*

6 Vipro Implementation Vipro Andrejs Rapoports
40
6.2 Vipro Library
Vipro Library consists of multiple subcomponents. Each will be described in this chapter. Figure 25
shows the components diagram from Vipro Library’s point of view: it does not know what is on top of it.
It uses Apache Commons library and Java EE 6 and that is all.
Figure 25. Components diagram for Vipro Library.
6.2.1 BPEL Parser
This subcomponent’s main purpose is to parse BPEL files (A1). It was taken from BPI and was
slightly modified. It is placed in following Java package:
de.unistuttgart.iaas.viewService.service.bpel
The original variant [22] parses a BPEL file specified by an URL (Uniform Resource Locator). The
parsing result is a tree-like object model of the process. Each activity is represented by an object that
holds name, type and children. BPEL links are saved in one list that is associated with the process. For
Vipro some modifications were made: process file can be specified by a single string; all attributes of
each activity are also parsed and are available using the object model.
6.2.2 Template Processor
This subcomponent is responsible for processing of Vipro Templates. Used Java package:
arapoport.vipro.lib.template
It offers two functions:
1. Parse and get all Spots of a template. It is meant only for Design-Time.
2. Apply template to an activity. It is meant for both Design0Time and Run-Time.
Vipro Library
TemplateProcessor
BPEL Parser(BPI)
Layout Engine(BPI)
Instance Metadata Processor
Instance Data
Processor
Combiner
Cfg Processor
Ap
ach
e C
om
mo
ns
Java EE 6
JAXB

Andrejs Rapoports Vipro 6 Vipro Implementation
41
Function 1 is implemented by the public and static method getAllSpots. It takes the content of a
template file represented by a string. Then it creates a corresponding DOM (Document Object Model)
document using standard Java XML parser. Finally it goes recursively through the DOM document and
looks for attributes starting with “vipro:”. The method, that does this, is shown in Listing 7. It gets a node,
that needs to be parsed, and list, where all found Spots should be stored (line 1). First, it checks all
attributes of the node (line 3). If an attribute starts with “vipro:” (line 6), then it is parsed into
ViproTemplateSpot data structure (line 7) and added to the resulting list, if it is not already there (line
8). After that this method is invoked for all child nodes (line 17).
1: private static void getAllSpotsFromNode(Node node, ViproTemplateSpotList res) {
2:
2: /* Check in attributes. */
3: for (int i = 0; i < node.getAttributes().getLength(); i++) {
4: Node attr = node.getAttributes().item(i);
5:
6: if (attr.getNodeName().startsWith("vipro:")) {
7: ViproTemplateSpot spot = ViproTemplateSpot.factoryCreateInstance(attr.getNodeValue());
8: res.addIfNotAlreadyIn(spot);
9: }
10: }
11:
12: /* Recursively check child nodes. */
13: for (int i = 0; i < node.getChildNodes().getLength(); i++) {
14: Node child = node.getChildNodes().item(i);
15:
16: if (child.getNodeType() == Node.ELEMENT_NODE) {
17: getAllSpotsFromNode((Element) child, res);
18: }
19: }
20: }
Listing 7. Recursive method that looks for Spot definitions.
Each Spot definition (class ViproTemplateSpot) contains full information about the Spot: identifier,
description, type, type options and two strings with text that must be added before and after the value. All
created Spots are returned wrapped into a list (class ViproTemplateSpotList).

6 Vipro Implementation Vipro Andrejs Rapoports
42
Function 2 is implemented by another public and static method applyTemplate. It requires five
arguments to be specified. Their meaning and source are presented in Table 3.
Argument Description Source artifact
template template to be applied to the activity A3
Run-Time data instance data of the activity that should be used to fill template A5
mapping rules set of mapping rules that define how template should be filled A4
name of the activity string that can be used to fill the template A1
type of the activity string that can be used to fill the template A1
Table 3. Arguments used to fill in a template.
The template filling algorithm works as follows: it builds a DOM document from the template (A3)
and traverses it. In parallel, a new DOM document is created. While going through the original document,
the algorithm copies all the content to a new document. If a Spot is found, then it is processed and the
resulting value is put in the new document as shown in Listing 8.
First, the spot definition is parsed (line 5). Then it browses the in mapping rules (line 12) for a
corresponding rule (line 14). The rule tells what the parameter and static value are. If static value is set,
then it is used (line 24). The static value can reference name of the activity (line 27) or its type (line 29).
If neither of them matches, then the static value is used (line 31). If the static value is empty, instance data
is used (line 34). The algorithm looks for a corresponding parameter (line 39) in the values of the activity
(line 38). Finally, the value is applied to spot (line 48) and returned.

Andrejs Rapoports Vipro 6 Vipro Implementation
43
1: private String processValue(String value, String activity) {
2:
3: /* Parse Spot description. */
4:
5: ViproTemplateSpot spot = ViproTemplateSpot.factoryCreateInstance(value);
6:
7: /* Find which parameter should be put on the Spot. */
8:
9: String paramId = "";
10: String staticValue = "";
11:
12: for (ParameterType parameter : this.cfgMapping.getTemplate().getParameter()) {
13:
14: if (parameter.getSpotid().equals(spot.getId())) {
15: paramId = parameter.getParamid();
16: staticValue = parameter.getStaticValue();
17: }
18: }
19:
20: /* Find the value to be applied */
21:
22: String valueToApply = null;
23:
24: if (StringUtils.isStringEmptyOrNull(staticValue) == false) {
25: /* Static value was set. Use it an do not forget about shortcuts. */
26:
27: if (staticValue.toLowerCase(Locale.ENGLISH).equals("vipro:name")) {
28: valueToApply = this.activityName;
29: } else if (staticValue.toLowerCase(Locale.ENGLISH).equals("vipro:type")) {
30: valueToApply = this.activityType.toLowerCase();
31: } else {
32: valueToApply = staticValue;
33: }
34: } else {
35: /* Static value was not set. Look for a parameter's value. */
36:
37: if (this.activity != null) {
38: for (rtdinstance.binding.ParameterType param : this.activity.getParameter()) {
39: if (param.getName().equals(paramId)) {
40: valueToApply = param.getValue();
41: }
42: }
43: }
44: }
45:
46: /* Apply value to the Spot and return. */
47:
48: return spot.applyValue(valueToApply);
49: }
Listing 8. Method that calculates the value of a Spot.
In the end, the new XML document contains the template with all Spots filled with values.
Because Vipro Templates are fully compatible with SVG, there was no need of building a special
object model for SVG. A standard DOM for XML was enough to implement both functionalities, because
they do not require interpretation of SVG syntax.
6.2.3 Vipro Instance Metadata Processor
This subcomponent is responsible for processing of Vipro Instance Metadata. Used Java package:
arapoport.vipro.lib.rtdformat
Vipro Instance Metadata was defined using XML Schema. It allows to generate the binding classes
that can process files of this type. The binding was generated using JAXB. As a result an object model
was automatically created. This object model corresponds one-to-one to the Vipro Instance Metadata
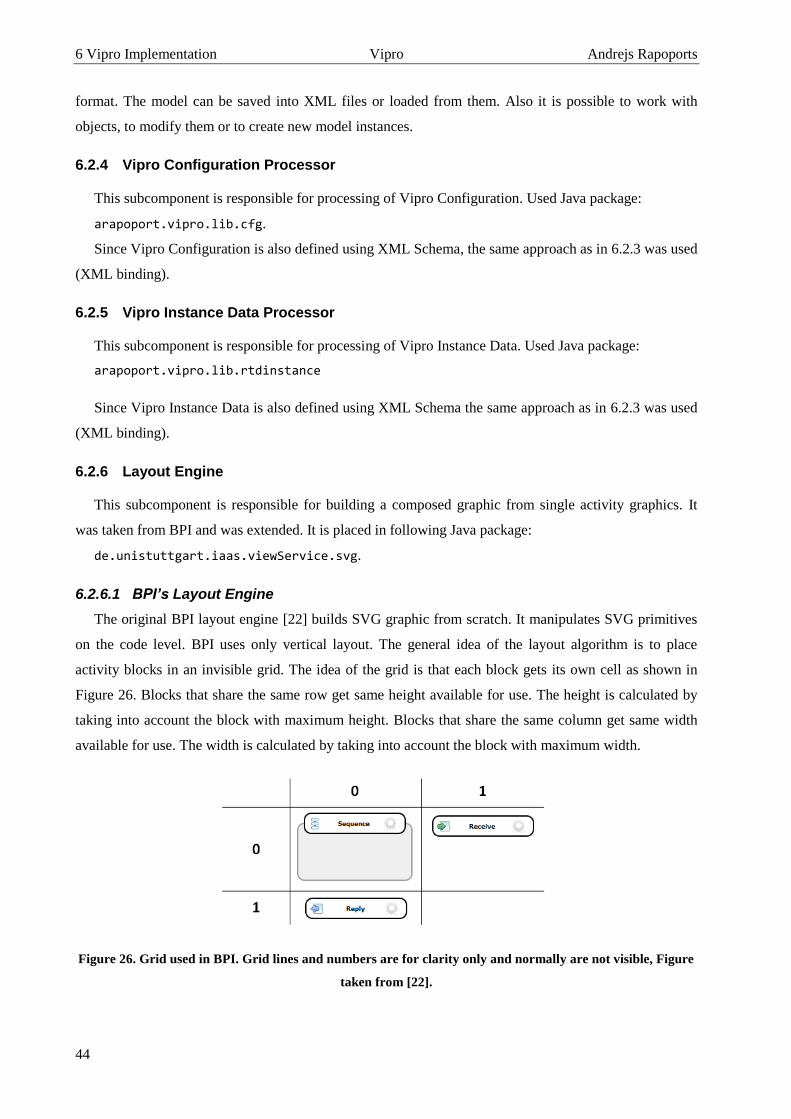
6 Vipro Implementation Vipro Andrejs Rapoports
44
format. The model can be saved into XML files or loaded from them. Also it is possible to work with
objects, to modify them or to create new model instances.
6.2.4 Vipro Configuration Processor
This subcomponent is responsible for processing of Vipro Configuration. Used Java package:
arapoport.vipro.lib.cfg.
Since Vipro Configuration is also defined using XML Schema, the same approach as in 6.2.3 was used
(XML binding).
6.2.5 Vipro Instance Data Processor
This subcomponent is responsible for processing of Vipro Instance Data. Used Java package:
arapoport.vipro.lib.rtdinstance
Since Vipro Instance Data is also defined using XML Schema the same approach as in 6.2.3 was used
(XML binding).
6.2.6 Layout Engine
This subcomponent is responsible for building a composed graphic from single activity graphics. It
was taken from BPI and was extended. It is placed in following Java package:
de.unistuttgart.iaas.viewService.svg.
6.2.6.1 BPI’s Layout Engine
The original BPI layout engine [22] builds SVG graphic from scratch. It manipulates SVG primitives
on the code level. BPI uses only vertical layout. The general idea of the layout algorithm is to place
activity blocks in an invisible grid. The idea of the grid is that each block gets its own cell as shown in
Figure 26. Blocks that share the same row get same height available for use. The height is calculated by
taking into account the block with maximum height. Blocks that share the same column get same width
available for use. The width is calculated by taking into account the block with maximum width.
Figure 26. Grid used in BPI. Grid lines and numbers are for clarity only and normally are not visible, Figure
taken from [22].

Andrejs Rapoports Vipro 6 Vipro Implementation
45
In order to do this, first the required size of each block is calculated. Complex activities (activities that
have children) get own internal grid and their size depends on their content. Grid is filled from top to
bottom. Additional columns are used only for flow and choice activities. More about the layout algorithm
can be found in the work of Gregor Latuske [22], pages 43-58.
6.2.6.2 Extended BPI’s Layout Engine
It was possible to use this layout engine in Vipro without making big changes. The main modification
was to let BPI use prepared SVG graphics for activities instead of creating them from SVG primitives.
Vipro Templates can have any size. It can even be calculated at Run-Time. But as shown before, BPI can
deal with custom sized blocks. In BPI, each activity block was rendered by one of the classes from the
following package: de.unistuttgart.iaas.viewService.svg.element.
Each class was replaced by a new one as shown in Table 4.
Original class New class
ActivitySimpleElement ActivityTemplatedSimpleElement
ActivityComplexElement ActivityTemplatedComplexElement
ActivitySequenceElement ActivityTemplatedSequenceElement
ActivityFlowElement ActivityTemplatedFlowElement
ActivityChoiceElement ActivityTemplatedChoiceElement
Table 4. Original classes from BPI that were replaced in Vipro by new classes.

6 Vipro Implementation Vipro Andrejs Rapoports
46
The class diagram in Figure 27 illustrates how the new classes were integrated into BPI. Most changes
are placed into two main classes: ActivityTemplatedSimpleElement and
ActivityTemplatedComplexElement. Other three classes are almost identical to original classes except
that they extend from ActivityTemplatedComplexElement.
Figure 27. Class diagram showing relations between original classes (blue) and new classes (green) in BPI.
Both main classes override two methods: one method returns the size of the activity block and the
other returns SVG markup of that block. Both classes prepare the template using the subcomponent
Template Processor immediately after they were created. Both classes return size taken from the prepared
template. ActivityTemplatedComplexElement also takes into account the size of its children. Both
classes also return the SVG markup of the prepared template. Possible options, that have been elaborated
to do this, are described in chapter 7.1.
In order to be able to use the Template Processor, both classes need the context with all required
artifacts. This context is passed using Settings class of the BPI. It was extended to contain the
ViproContext class that holds all artifacts.
Sequence diagram on Figure 28 illustrates the way the visualization is created. Everything starts when
a “processConfiguration” method of the “Combiner” component is invoked. It prepares the context and
invokes the “generate” method from the layout engine component. It creates the activity root element,
which recursively creates the complete activity tree model. Then “getSvg” method is invoked on the root
activity. It recursively calculates sizes and then recursively builds resulting SVG, which is then returned
back.

Andrejs Rapoports Vipro 6 Vipro Implementation
47
Figure 28. Sequence diagram for the visualization routine.
6.2.7 Combiner
Last subcomponent of Vipro library sits on top of other subcomponents, which means that it utilizes
them and provides visualization functionality for external components. Java Package:
arapoport.vipro.lib.combiner.
Basically, its main function is to process a Vipro Configuration and return its visualization. It is done
in public and static method processConfiguration(ViproStringModel) of the class ViproManager.
This method takes one argument that is a container for all artifacts represented by the strings. It parses all
of them using other subcomponents and stores them in a new container (class ViproContext). Then it
uses the layout engine to produce the visualization. Visualization is a single SVG file and its content is
returned.
ActivityRootElement
Combiner SVGGenerator
ActivityElement
processConfiguration()generate()
create
create
getSvg()
getDimension()
getSvg()
create
getDimension()
getSvg()
Rec
urs
ion

6 Vipro Implementation Vipro Andrejs Rapoports
48
6.3 Vipro Web Service
Second component is Vipro Web service. Figure 29 shows the components diagram from Vipro Web
service’s point of view: it uses Vipro Library and Java EE 6.
Figure 29. Components diagram for Vipro Web service.
Vipro Web service is a SOAP/WSDL Web service. It uses Axis2/Java [33] as engine. It was built
using a top-down approach – first service definition was created and only then the service was
implemented. Vipro Web service is made stateless. Another possibility would be to make it stateful.
Stateless approach has many advantages over stateful approach:
Web service can be easily deployed – no configuration is required.
Web service can be scaled out by deploying it on multiple nodes – they do not need to share
common state storage.
Web service is easy to use for demonstration purposes – for this work it is an advantage.
SOAP/WSDL Web services are stateless as such – a stateful service must be built on top of
them. It means more work and usage of additional components like WSRF (Web Services
Resource Framework) [36].
Main disadvantage is that each invocation is resource consuming – each time all artifacts have to be
passed to the Web service. In real-world it could be a possible bottleneck. A stateful Web service
implementation would be more efficient, but for the prototyping of concepts of this work it is less
important.
6.3.1.1 WSDL Definition
WSDL interface was named “viproService” and got the namespace “http://arapoport/viproService”.
It has only one operation – getViproVisualization. This operation is of type “Request-response” [35]
Figure 30 illustrates its request type. The request contains all artifacts: process definition, Vipro Instance
Axis2/Java
Vipro Web Service
Vipro Library
WSDL
Java EE 6

Andrejs Rapoports Vipro 6 Vipro Implementation
49
metadata, Vipro Instance Data, Vipro Configuration and templates. All artifacts, except templates, are
represented by a single string that should hold the complete XML markup of the corresponding artifact.
Templates are represented by a list of “SvgTemplateType” elements where each holds name of the
template file and its content. Template content is also represented by a single string that holds complete
XML markup of the corresponding template.
Figure 30. Request type for the operation getViproVisualization of the Vipro Web service.
The response type is much simpler and contains a single string. This string holds complete SVG
markup of the generated visualization.
6.3.1.2 Service Implementation
Service implementation was done on top of Axis2/Java. It provides both Run-Time library and tools
for code stubs generation. From the WSDL definition a service stub was generated. Java package for the
service implementation is arapoport.viproservice. Only one class was changed –
ViproServiceSkeleton. Method getViproVisualization was implemented there. It builds
ViproStringModel instance from request data and invokes processConfiguration method from Vipro
Library. The returned string with visualization is the response of the operation.

6 Vipro Implementation Vipro Andrejs Rapoports
50
6.4 Vipro Editor
The last Vipro component is Vipro Editor. Figure 31 shows the components diagram from Vipro
Editor’s point of view. Vipro Editor uses Vipro Library, Apache Commons library and Java EE 6.
Figure 31. Components diagram for Vipro Editor.
Vipro Editor uses three-tier architecture (chapter 4.2.1). Presentation tier runs in browser, logic tier is
the servlet and data tier is the file system.
6.4.1 Vaadin
Vipro Editor uses Vaadin – a web application framework for RIA. Vaadin is licensed under the
Apache Software License, Version 2 [24]. It allows to build Web applications rapidly without dealing
much with browser technologies – HTML (Hypertext Markup Language), Java-Script or CSS (Cascading
Style Sheets). The presentation tier is completely covered by the framework. The GUI (Graphical User
Interface) is defined on server-side in Java language. The overall concept is very much like Swing – a
very popular Java GUI toolkit. Applications created with Vaadin look almost like desktop applications –
they are single page applications, they are stateful and almost all operations are controlled by buttons.
Architecture of Vaadin is shown in Figure 32. “Client-Side Engine of Vaadin manages the rendering
in the Web browser using Google Web Toolkit (GWT). It communicates user interaction and UI changes
with the server-side Terminal Adapter using the User Interface Definition Language (UIDL), a JSON-
based language. The communications are made using asynchronous HTTP or HTTPS requests” [37]. The
Terminal Adapter is an abstraction layer that enables support of different browsers. Although modern
browsers claim to be compatible with HTML and Java Script standards, in real life there are still
differences in browser behavior.
Editor
Vipro Editor
Vipro Library
Vaadin
Ap
ach
e C
om
mo
ns
Java EE 6

Andrejs Rapoports Vipro 6 Vipro Implementation
51
Figure 32. Architecture of Vaadin. Figure taken from [37], Chapter 3.1.
Vaadin is fully compatible with Java Servlet Technology and is provided in a single-file library. Also
there is a beta version of WYSIWYG (What You See Is What You Get) editor that makes GUI building
even easier.
Vaadin was chosen because it is meant for Java applications, it is compatible with JST, it allows rapid
building of Web GUI applications, it requires only Java skills and it does all the browser rendering and
communication work.

6 Vipro Implementation Vipro Andrejs Rapoports
52
6.4.2 Main Window
To demonstrate the user interface, the test case “Long Operation Process” from chapter 8.3 will be
used. It is based on a simple BPEL process shown in Figure 33.
Figure 33. BPEL process for the “Long Running Process” test case. This visualization was made with Eclipse
BPEL Editor.
As shown in Figure 34, the Vipro Editor main window consists of three areas: header, left menu and
tab pane. Header holds the title and two links: one is a link to the Vipro Web service and the other is a
link to the Web service client. The left menu contains a list of projects and a form for creating new
projects. Tab pane is the main working area. It has five tabs and they correspond to five steps that are
necessary for creating a Vipro Configuration. Such structure of interface proposes sequential work with
the editor, but any step can be opened any time.
Figure 34. Main window of Vipro Editor consists of three areas. They are marked red.
Left menu
Tab pane
Header

Andrejs Rapoports Vipro 6 Vipro Implementation
53
All projects correspond to directories in working directory. Vipro Editor cannot work without a
working directory and asks the user to enter it when starting first time. If Vipro Editor is accessed from
the same computer where the servlet runs, then the absolute path to the project is shown in the menu. All
artifacts, which belong to the project, will be saved in its directory.
6.4.2.1 Step 1 – Select Process
The prepared BPEL process (A1) has to be uploaded here. Only files with “bpel” extensions can be
uploaded. As shown in Figure 35, the content of uploaded process is immediately previewed. No
visualization is used here.
Figure 35. Step 1 – Select Process of the Vipro Editor.
The uploaded process is saved immediately to the project directory under name “process.bpel”.

6 Vipro Implementation Vipro Andrejs Rapoports
54
6.4.2.2 Step 2 – Create RTD-Format
Vipro Instance Metadata has to be created here. As shown in Figure 36, it is presented as a table of
parameters. Columns of the table correspond to fields of “ParameterType” from Vipro Instance Metadata
format. Entries can be added and removed; all changes are automatically saved to the file “rtd-
format.xml” and are immediately available for other steps.
Figure 36. Step 2 – Create RTD-Format of the Vipro Editor.
6.4.2.3 Step 3 – Select Templates
Vipro Templates are uploaded here. As shown in Figure 37, many templates can be uploaded. They
are saved to the project directory. File names are saved and serve as an identifier. On the right to the list
of available templates a preview of the selected template is shown. Templates are shown in default mode
- no substitutions of Spots are made. A template can be made in such a way, that when it is displayed in
default mode, the placeholders are visible and give the user an impression about their capabilities.
Template’s SVG markup is inserted directly into HTML markup, this feature is supported by HTML5.
More about this is discussed later in chapter 7.3.
Figure 37. Step 3 – Select Templates of the Vipro Editor.
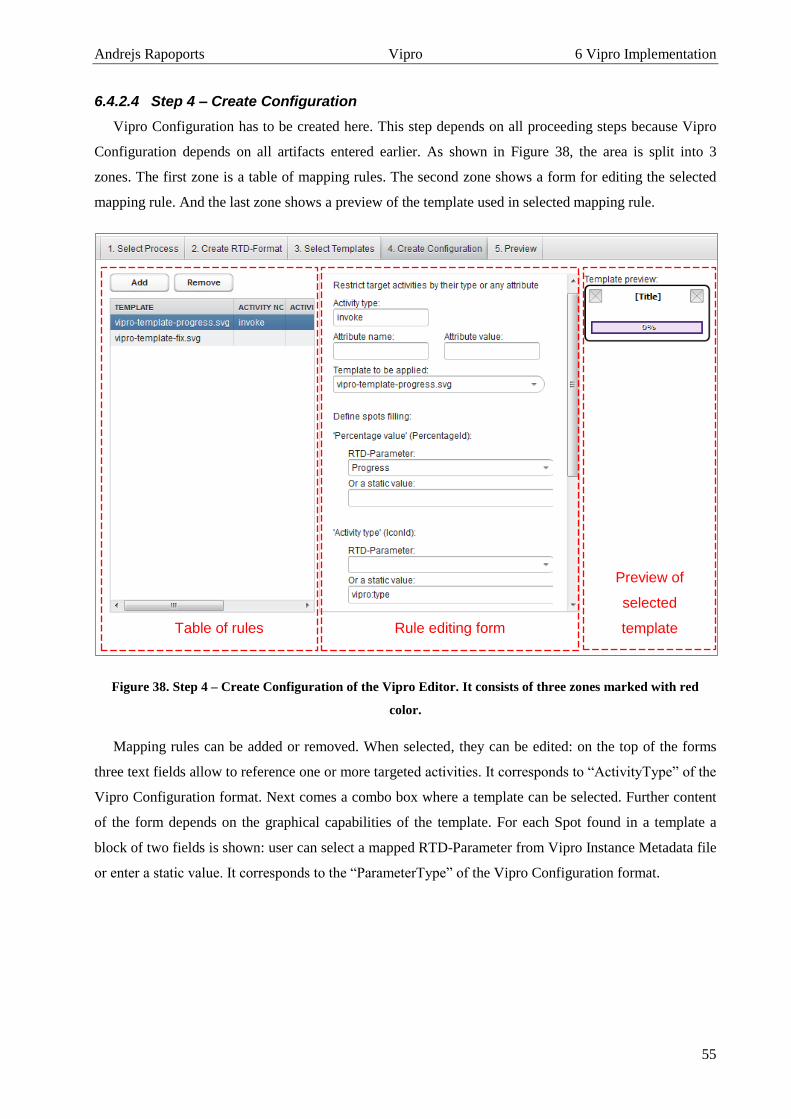
Andrejs Rapoports Vipro 6 Vipro Implementation
55
6.4.2.4 Step 4 – Create Configuration
Vipro Configuration has to be created here. This step depends on all proceeding steps because Vipro
Configuration depends on all artifacts entered earlier. As shown in Figure 38, the area is split into 3
zones. The first zone is a table of mapping rules. The second zone shows a form for editing the selected
mapping rule. And the last zone shows a preview of the template used in selected mapping rule.
Figure 38. Step 4 – Create Configuration of the Vipro Editor. It consists of three zones marked with red
color.
Mapping rules can be added or removed. When selected, they can be edited: on the top of the forms
three text fields allow to reference one or more targeted activities. It corresponds to “ActivityType” of the
Vipro Configuration format. Next comes a combo box where a template can be selected. Further content
of the form depends on the graphical capabilities of the template. For each Spot found in a template a
block of two fields is shown: user can select a mapped RTD-Parameter from Vipro Instance Metadata file
or enter a static value. It corresponds to the “ParameterType” of the Vipro Configuration format.
Table of rules Rule editing form
Preview of
selected
template

6 Vipro Implementation Vipro Andrejs Rapoports
56
6.4.2.5 Step 5 – Preview
In the last step the user can preview the configuration and download all artifacts as a single archive
file. Figure 39 shows this step and a preview of the entered process. The previewed visualization of the
process is incomplete because no Vipro Instance Data is available, yet. Only static values are applied to
the template. For example, in the visualized process only the left icons are set and the right icons show
placeholders. This is because left icons were mapped to the activity type, which is available at Design-
Time. And right icons were mapped to Run-Time data and cannot be filled at Design-Time.
Figure 39. Step 5 – Preview of the Vipro Editor.
6.4.3 Simple Client for Web Service
In addition to the Vipro Editor a simple Web service client was created. It is a single JSP (Java Server
Pages) page that uses code stub generated by Axis2/Java for the Vipro Web service. It accepts ZIP-
archive files. The content of the archive is used as artifacts for the request to the Web service. Archive file
must contain following files:
A single file with “bpel” extension – it is interpreted as BPEL process definition.
A file that ends with “format.xml” – it is interpreted as Vipro Instance Metadata file.
Files with “svg” extension – all of them are interpreted as Vipro Templates.
A file that ends with “instance.xml” – it is interpreted as Vipro Instance Data file.
A file that ends with “cfg.xml” – it is interpreted as Vipro Configuration.

Andrejs Rapoports Vipro 6 Vipro Implementation
57
All this artifacts are passed to the Vipro Web service and the output is visualized on the same page
(Figure 40). The same process as in Figure 39, is used but this time with a sample instance data. This and
more test cases will be explained in chapter 8.
Figure 40. A simple client for Vipro Web service showing a visualization of a process instance.

7 Challenges and Solutions Vipro Andrejs Rapoports
58
7 Challenges and Solutions
7.1 Integration of SVG Documents
As a result, Vipro should produce an SVG file built of other SVG files and additional notation
elements (arrows, borders etc.).
This technical task was formulated in a more abstract way: there are two graphics A (square) and B
(circle). The graphic B must be placed into graphic A. SVG format is flexible and provides many ways to
combine multiple graphics:
Define the graphic B directly in the graphic A in the right place. SVG files are XML documents
and it is possible to take pieces of one document and put them into another. There are some
caveats: SVG file might have a global style sheet and element definitions. These parts must be
integrated in the graphic A too. And there are possible name conflicts. So a complicated logic is
required to complete this task.
Insert the complete SVG markup of the graphic B directly into the graphic A. The root tag “svg”
of the graphic B must be changed and position coordinates must be set. This solution also has the
caveat that style sheet definitions will be global and the main document will override styles of
child documents.
Link the graphic B from the graphic A. This option is much easier to implement. But the graphic
B must be linked using a global identifier (URL). It means that it will not be possible to use the
graphic offline. It will consist of two files with no possibility to link them with a relative path.
This solution, however, allows the graphic B to be cached and reused it in different graphics. This
reduces resource consumption and should be used in real-world environments.
Embed the graphic B into the graphic A. SVG allows a graphic to be embedded using Base64
encoding [38]. Instead of an URL a complete file can be inserted as an encoded string. The
embedded document will be decoded by the viewer program and interpreted as a separate file.
This is easy to implement and the result is a single file that is context-independent. Mayor draw-
back is resource consumption: Base64 encoding will make the graphic B 150% the size of the
original. Another drawback is that the graphic B will not be reusable.
Now it is necessary to check if all the options are applicable to the concrete problem – how to
integrate multiple templates into one SVG file:
A single SVG file where all templates are merged into the main file.
A single SVG file with multiple appearances of large “svg” tags.
Multiple SVG files where the main file is linked to all the templates.
A single SVG file where all templates are embedded into the main file.

Andrejs Rapoports Vipro 7 Challenges and Solutions
59
No contradictions in these four options mean that all of them are possible. But the decision which
option to take should be made on an abstract level:
Taking into account that the aim of this work is to create a concept and to prove it, the fourth option is
the best choice, because it is easy to implement and the resulting file remains content-independent. The
problem with resource consumption is not important for the proof of concept.
Vipro thus uses the fourth option – embedding templates using Base64 directly into the final graphic.
7.2 Icons in Templates
Very often a template needs to contain one or more icons. Nowadays, icons are mostly distributed
using a raster format. SVG format is a purely vector format but allows raster images to be linked or
embedded.
The BPI used raster icons (for activity types and states) by linking them. This implied that icons must
be deployed on the Web server separately. This concept does not fit well in the Use Case UC2, where the
Template Designer creates templates independently and supplies only template files.
But there is another option to solve this problem. All icons can be embedded into the SVG file using
Base64 encoding [38]. Listing 9 shows the way how it can be done.
<image
xlink:href="data:image/png;base64,iVBOR...5CYII="
width="20"
height="20"
id="imageunknown"
/>
Listing 9. The way to embed graphics in the SVG document.
Mayor disadvantage is 33% overhead in size of the embedded graphic. Another disadvantage is that
the graphic cannot be cached or reused by different SVG documents.

7 Challenges and Solutions Vipro Andrejs Rapoports
60
The Template Designer might also decide to make the image dynamic. To limit the set of allowed
images Template Designer can define them all in the SVG file as shown in Listing 10. SVG has a section
“defs” where any element can be defined. Later in the document they can be used by referencing their id.
Template Designer can make this reference to a Spot which is filled later at Run-Time.
<defs>
<image ... id="unknown" />
<image ... id="flow" />
<image ... id="sequence" />
</defs>
...
<use
xlink:href="#unknown"
vipro:xlink__href="#{IconId:'Activity type':enum:unknown,flow,sequence}"
...
/>
Listing 10. The way to make a dynamic icon in a Vipro Template.
If this approach is mixed up with embedded icons then the template file can become very large. And
the final visualization will also be very large because each template is integrated into the resulting SVG.
This can be resolved by using compression or conversion into a raster graphic. With a compression it is
possible to reduce the size up to 20% of the original size [39]. Conversion of a vector graphic into a raster
graphic can be resource-consuming and has to happen on the server-side, but it can be then viewed on any
client, because raster formats are supported much widely.
7.3 SVG Integration into HTML5 Pages
The Vipro Web Editor displays final SVG graphic in a Web page using the HTML5 [40]. It allows the
SVG document to be directly inserted into the Web page document.
Nowadays, the real-world usage of SVG images in Web pages still requires work-arounds, like server-
side conversion into a raster format or usage of special plug-ins. The problem is that many old browsers
are still in use and have to be supported. For purposes of this work it is of less importance. Vipro Web
application requires a browser that supports HTML5.

Andrejs Rapoports Vipro 8 Test Cases
61
8 Test Cases
This chapter presents test cases that were executed using Vipro.
8.1 “Resource Consumption”
The following situation is modeled by this test case: a business process consumes a lot of energy while
being executed. Business Analyst wants to see where the most energy is consumed. The idea is to make
the size of visualized activity to depend on spent energy.
This test case is inspired by [41], where a methodology is proposed that enables organizations amongst
others things also “identify, localize and visualize their environmental impact”. Authors propose that
KEIs (Key Ecological Indicators) have to be visualized to “enable analyzing the current environmental
impact of a process model.” Energy consumption is one of the KEIs and the presented test case shows the
way how it can be visualized.
Further in this chapter all artifacts will be presented and the resulting visualization will be explained.
8.1.1 BPEL Process
BPEL process is very simple and consists of few activities. Listing 11 and Figure 41 show the used
BPEL file. Two activities – “InsertData” and “RemoveData” are assumed to be energy consuming steps.
Other activities are only control activites.
<bpel:process ...>
<bpel:scope name="Scope">
<bpel:invoke name="InsertData"></bpel:invoke>
<bpel:compensationHandler name="Compensation">
<bpel:compensate name="RemoveData"></bpel:compensate>
</bpel:compensationHandler>
</bpel:scope>
</bpel:process>
Listing 11. BPEL process (A1) for the “Resource consumption” test case.
The process is very simple for demonstration purposes. It consists of one operation that inserts data
into storage. It can be energy-consuming because magnetic tape data storage is used. If operation fails,
then compensation action has to be taken and data has to be removed. A Business Analyst wants to see if
the remove operation is consuming much more energy or not.
Figure 41. BPEL process for the “Resource Consumption” test case. The visualization was made with Eclipse
BPEL Editor.

8 Test Cases Vipro Andrejs Rapoports
62
8.1.2 Vipro Instance Metadata
Vipro Instance Metadata (Listing 12) contains only two parameters: “consumptionValue” – the
absolute energy consumption value and “consumptionCoefficient” – relative energy consumption
coefficient that is limited to values between 100 and 1000 inclusive.
<rtdformat xmlns="http://arapoport/rtd-format">
<parameters>
<parameter type="int" name="consumptionValue"/>
<parameter type="int" name="consumptionCoefficient">
<min>100</min>
<max>1000</max>
</parameter>
</parameters>
</rtdformat>
Listing 12. Vipro Instance Metadata (A2) for the “Resource consumption” test case.
8.1.3 Vipro Templates
Two templates are used in this test case:
“vipro-template-size.svg” – a template with dynamic width. Figure 42 shows what it looks
like without any applied values.
“vipro-template-fix.svg” – a template with fixed size. Figure 43 shows it.
Figure 42. Preview of the Vipro Template
featuring dynamic width, icon title and subtitle.
Figure 43. Preview of a Vipro Template featuring
dynamic icon and title.

Andrejs Rapoports Vipro 8 Test Cases
63
Listing 13 shows most important parts of the template with dynamic width. First two attributes of the
root element define Vipro namespaces. Next four attributes define the default size of the graphic. The last
two attributes make width attributes dynamic using Spot “WithId”. Apart from dynamic width this
template has three more Spots. “IconId” should be used to represent icons that correspond to the type of
the activity. “TitleId” is title text and “SubtitleId” is subtitle text.
<svg ...
xmlns:vipro="http://arapoport/vipro-svg" xmlns:viprometa="http://arapoport/vipro-svg-meta"
width="170" height="90" viprometa:templateWidth="170" viprometa:templateHeight="90"
vipro:width="{WidthId:'Width':int}"
vipro:viprometa__templateWidth="{WidthId:'Width':int}"
>
...
<use ...
xlink:href="#unknown"
vipro:xlink__href="#{IconId:'Activity type':string}"
/>
...
<text ...
vipro:viproNodeValue="{TitleId:'Title text':string}" >
[Title]
</text>
...
<text ...
vipro:viproNodeValue="{SubtitleId:'Subtititle text':string} kWh" >
[Energy consumption]
</text>
...
</svg>
Listing 13. Vipro Template for “Resource Consumption” test case. It features dynamic width, icon for
activity type and two custom texts.
8.1.4 Vipro Instance Data
A sample Vipro Instance Data was created manually for this test case because a real monitoring and
analysis system is out of scope of this work. The data used is shown in Listing 14. Only two activities got
instance data associated with them, because others were just control activities. “InsertData” consumed
smaller amount of energy than “RemoveData” did.
<rtdinstance xmlns="http://arapoport/rtd-instance">
<meta/>
<activities>
<activity attrName="name" attrValue="InsertData">
<parameter name="consumptionValue">2</parameter>
<parameter name="consumptionCoefficient">200</parameter>
</activity>
<activity attrName="name" attrValue="RemoveData">
<parameter name="consumptionValue">3</parameter>
<parameter name="consumptionCoefficient">300</parameter>
</activity>
</activities>
</rtdinstance>
Listing 14. Vipro Instance Data for the “Resource Consumption” test case.

8 Test Cases Vipro Andrejs Rapoports
64
8.1.5 Vipro Configuration
The last artifact – Vipro Configuration – is shown in Listing 15. There are three mapping rules
defined. First one matches all activities that are not matched by other rules. It assigns them the “vipro-
template-size.svg” template. Its width is mapped to the “consumptionCoefficient” parameter. Subtitle is
mapped to “consumptionValue”, icon – to activity’s type and title – to activity’s name. Two remaining
rules set “vipro-template-fix.svg” template for activities of types “scope” and “compensationHandler”.
This is done because these activities are control activities and do not have significant energy
consumption.
<vipro-cfg xmlns="http://arapoport/vipro-cfg">
<mappings>
<mapping>
<activity></activity>
<template name="vipro-template-size.svg">
<parameter spotid="WidthId" paramid="consumptionCoefficient"/>
<parameter spotid="SubtitleId" paramid="consumptionValue"/>
<parameter spotid="IconId" staticValue="vipro:type"/>
<parameter spotid="TitleId" staticValue="vipro:name"/>
</template>
</mapping>
<mapping>
<activity nodeName="scope"/>
<template name="vipro-template-fix.svg">
<parameter spotid="IconId" staticValue="vipro:type"/>
<parameter spotid="NameId" staticValue="vipro:name"/>
</template>
</mapping>
<mapping>
<activity nodeName="compensationhandler"/>
<template name="vipro-template-fix.svg">
<parameter spotid="IconId" staticValue="vipro:type"/>
<parameter spotid="NameId" staticValue="vipro:name"/>
</template>
</mapping>
</mappings>
...
</vipro-cfg>
Listing 15. Vipro Configuration for the “Resource Consumption” test case.
8.1.6 Result
All prepared artifacts were submitted to Vipro Web service. Produced visualization is shown in
Figure 44. Although the test case process has only few activities, it is immediately clear that
“RemoveData” consumes more energy than “InsertData” does.

Andrejs Rapoports Vipro 8 Test Cases
65
Figure 44. Visualization made by Vipro for the “Resource Consumption” test case. From the visualization it
becomes immediately clear that “RemoveData” consumes more energy than “InsertData” does.
Also it is visible that icons and titles were set for all activities.
8.1.7 Aggregated Data Visualization
The situation modeled in this test case may also require showing the aggregated information about
multiple executions of the process and not about a single process instance as before. Aggregated
information can also be visualized using Vipro. To do this only Vipro Instance Data must be changed: the
single execution values must be replaced with aggregated values.

8 Test Cases Vipro Andrejs Rapoports
66
8.2 “Security Levels”
The following situation is modeled in this test case: some activities of the process communicate with
external processes and services. A different communication protocol is in use. They provide different
level of security. A Business Analyst wants to check how secure the process is.
There are 4 security levels (Table 5).
Level Name Description Color
0 n/a (not applicable) No communication takes place White
1 None Not secure at all – anybody can access the data Red
2 Low Anybody within the involved companies can access the data Yellow
3 High Only sender and recipient have access to data Green
Table 5. Security levels for the “Security Levels” test case.
Possible communication protocols are:
HTTP (Hypertext Transfer Protocol) – a standard protocol of the Web. It is not secure at all
and can be easily read by intermediaries. It corresponds to level 1.
VPN (Virtual Private Network) – a virtual private network that is secured from rest of the
internet. It corresponds to level 2.
HTTPS (Hypertext Transfer Protocol Secure) – is a protocol that works over HTTP and
provides secure communication between user and Web server. It corresponds to level 3.
SSH (Secure Shell) – is another network protocol for secure data communication. It
corresponds to level 3.
The used BPEL fulfills the order of the customer. First a customer places an order over the internet
(using HTTP, or, probably, HTTPS). Then the order gets validated and is either processed or refused. If it
gets processed then the shipping department is asked to make the shipping. The billing department also
gets involved to charge the customer. Communication between departments can happen in different ways.
In the last step the customer gets a confirmation over the internet. If the order is refused then the customer
also gets a reply.
Vipro Template shown in Figure 45 is used for all activities. It has dynamic background color: four
available colors are explicitly defined in the template using numbers from 0 to 3. It also features icons for
type and state of the activity. Two titles can be set on it.

Andrejs Rapoports Vipro 8 Test Cases
67
Figure 45. Vipro Template for the “Security Levels” test case. It features dynamic background color, two
icons and two titles. Figure shows two possible background colors from four.
In the Vipro Configuration background color was mapped to the security level used by each activity.
Title was mapped to the name of the activity. Subtitle was mapped to the used communication protocol.
Vipro Instance Data was also created manually and had following data: customer made order over
HTTP, shipping was requested over VPN, billing was requested over SSH and the reply was made using
HTTPS. Refusal branch was not executed at all.
The resulting visualization is shown in Figure 46. The Business Analyst can immediately see that a
user makes an order over an insecure protocol and this is the weakest place of the process. The Business
Analyst can also see that shipping requests can be more secure but is not critical. Other activities are OK
or do not communicate at all.
Figure 46. Resulting visualization for the “Security Levels” test case.

8 Test Cases Vipro Andrejs Rapoports
68
8.3 “Long Running Process”
Another test case that shows that templates can easily use progress bars.
The test case process is very simple: it has two long running activities executed in parallel (it was
introduced before in Figure 33). One burns a DVD disc and another prints a manual. Because both of
them take some time it is imaginable that somebody will want to check their progress.
To visualize the progress a template with a progress bar is used, as shown in Figure 47. Progress bar
can show any value between 0 and 100.
Figure 47. Vipro Template for the “Long Running Process” test case. It features a progress bar.
It is achieved solely using SVG. The progress value is controlled by a single Spot, as shown in Listing
16. The filling of the progress is represented by a single rectangle (Line 1). Its height is fixed because the
progress bar is positioned horizontally. Its width should be 0 pixels if the value is 0% and 146 pixels if
the value is 100%. To map two different intervals the SVG “scale” transformation is used (Line 3). It
takes two arguments: the first is multiplied with original width of the element and the second is multiplied
with the height. To use this transforamtion the original width of the rectangle is set to “1.46” (Line 2).
First parameter of the “scale” transformation is made dynamic and second is set to 1 because the height
must stay fixed (Line 4). The percentage value shown on top of the progress bar uses the same Spot ID
and shows exactly the same value as drawn in the progress bar.
Line 1: <rect ...
Line 2: width="1.46"
Line 3: transform="scale(0,1)"
Line 4: vipro:transform="scale({PercentageId:'Percentage value':int},1)"
Line 5: />
Listing 16. Implementation of the filling for a progress bar in a Vipro Template.
All other Spots in the template are identical to the Spots in previous test cases. Vipro Instance
Metadata, Vipro Instance Data and Vipro Configuration have nothing special or interesting and were left
out.
The resulting visualization is shown in Figure 48. State icons (on the right) show, that “BurnDVD”
and “PrintManual” activities are executed. Their progress is 14% and 76%.

Andrejs Rapoports Vipro 8 Test Cases
69
Figure 48. Resulting visualization for the “Long Running Process” test case.
8.4 “Car Wash”
Another test case is also inspired by resource consumption. The process model used is a car washing
process, which consists of several sequential steps: prewash, soap, optional underbody wash, exterior
wash, dry and optional wax polishing. The Business Analyst wants to check how much water is spent on
each step. A straightforward solution with a standard template is shown in Figure 49 for some sample
data. Although the information about water consumption is presented, the visualization is not very
expressive.
Figure 49. Straightforward visualization for the “Car Wash” test case.

8 Test Cases Vipro Andrejs Rapoports
70
To make it more expressive a special template is used. It is shown in Figure 50.
Figure 50. Vipro Template for the “Car Wash” test case. Size of the water drop is dynamic.
The resulting visualization made by Vipro is shown in Figure 51 for the same sample data. It is much
more expressive. It is immediately clear that the most quantity of water is spent on the “exterior wash”
step. “Wax polishing” step spends so little water that it is hard to read. And “dry” step is not visible at all,
because it got a zero size assigned.
Figure 51. Resulting visualization for the “Car Wash” test case.
This test case shows that any kind of template graphics may be used.
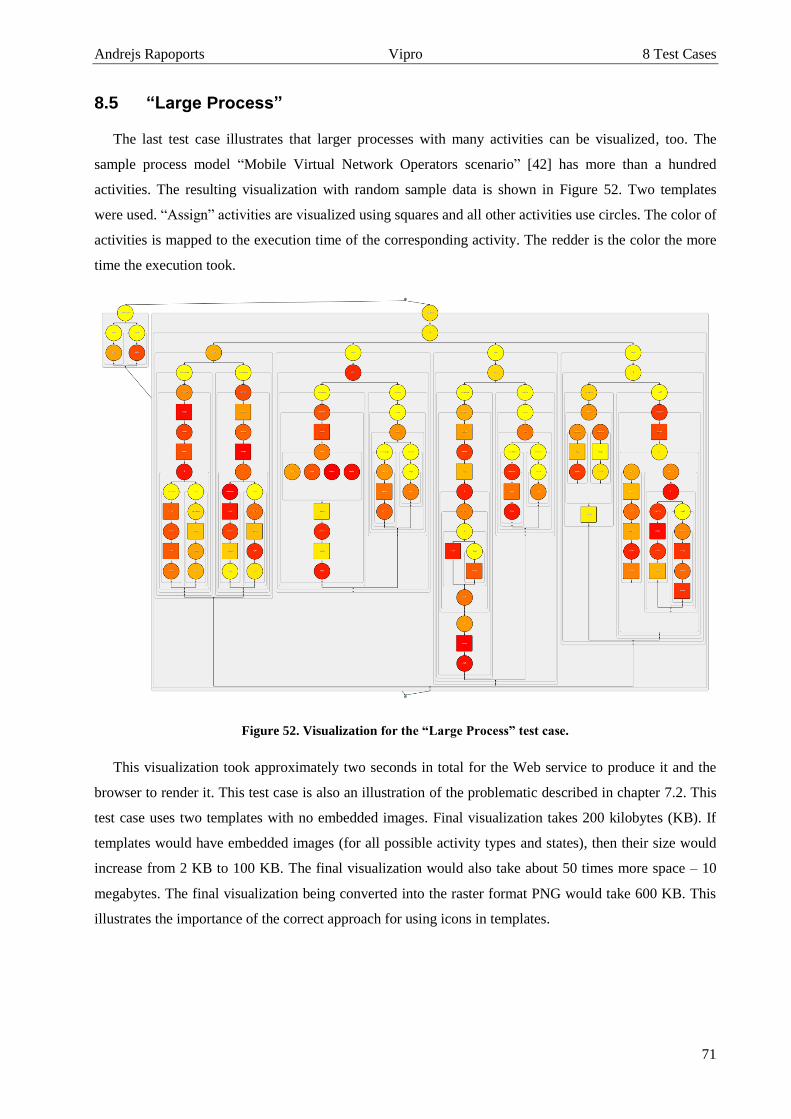
Andrejs Rapoports Vipro 8 Test Cases
71
8.5 “Large Process”
The last test case illustrates that larger processes with many activities can be visualized, too. The
sample process model “Mobile Virtual Network Operators scenario” [42] has more than a hundred
activities. The resulting visualization with random sample data is shown in Figure 52. Two templates
were used. “Assign” activities are visualized using squares and all other activities use circles. The color of
activities is mapped to the execution time of the corresponding activity. The redder is the color the more
time the execution took.
Figure 52. Visualization for the “Large Process” test case.
This visualization took approximately two seconds in total for the Web service to produce it and the
browser to render it. This test case is also an illustration of the problematic described in chapter 7.2. This
test case uses two templates with no embedded images. Final visualization takes 200 kilobytes (KB). If
templates would have embedded images (for all possible activity types and states), then their size would
increase from 2 KB to 100 KB. The final visualization would also take about 50 times more space – 10
megabytes. The final visualization being converted into the raster format PNG would take 600 KB. This
illustrates the importance of the correct approach for using icons in templates.

8 Test Cases Vipro Andrejs Rapoports
72
8.6 Overview of Sample Templates
Table 6 shows an overview of templates used in test cases.
Template Spots Preview
“Small box” Activity type icon
Title
“Normal box”
Background color
(white/red/yellow/green)
Activity type icon
Activity state icon
Title
Subtitle
“Sizeable box”
Width
Activity type icon
Title
Subtitle
“Progress bar”
Progress bar
Activity type icon
Activity state icon
Title
Subtitle
“Drop”
Width
Height
Title
Subtitle
“Circle” Background color (yellow to red)
Title
“Square” Background color (yellow to red)
Title
Table 6. Overview of templates used in test cases.

Andrejs Rapoports Vipro 9 Summary and Outlook
73
9 Summary and Outlook
9.1 Summary
Concept and solution for configurable visual representations for business process monitoring have
been created in this work. The concept enables the loose coupling between templates, processes and data.
That, in its turn, allows visual designer, business analysts and information designer to collaborate in an
efficient and independent way.
The concept has been prototypically realized and four new formats have been defined. Vipro format
for template definitions is fully compatible with SVG because of special Vipro attributes that can be
easily added to any SVG document. It allows any visual designer to prepare templates, because no
technical knowledge is required. In comparison to [10] and [14], which keep the template format very
complicated, this constitutes a major improvement. Vipro Instance Metadata describes the Run-Time data
format. It is a metamodel for the Run-Time data and allows usage of any data provider without making
any statements about its nature. In comparison to [13], it is a more simple and architecture-independent
solution. Vipro Instance Data format is a model for the Run-Time data that meets the requirements of a
concrete Vipro Instance Metadata. The fourth format is the Vipro Configuration, which composes all
artifacts to define configured process visualization.
The Vipro prototype has been developed as proof of concept. It consists of three components. One is
Vipro Library that provides functionality for work with each of the formats, plus it provides visualization
functionality. The second component is Vipro Web service, which uses Vipro Library and provides
visualization functionality to any kind of clients. The last component – Vipro Editor – is a Web
application where Vipro Instance Metadata and Vipro configurations can be built using a GUI.
From the more general point of view, Vipro is an implementation of “Appearance Patterns” from [25].
Test cases that have been presented in the very end to illustrate the capabilities of Vipro.
9.2 Outlook
While this work was conducted, many new problems became clear. In some places it was necessary to
draw a line and limit the work to some abstractions or assumptions. All of them can be developed further.
In this last chapter they are all presented.
Instance data metamodel. Vipro Instance Metadata is a quite simple solution. As shown in chapter
5.3.1.1, XML Schema is a better solution but requires more advanced implementation.
“Presentation patterns”. Vipro realizes only “Appearance Pattern” from [25]. But there are also
“Scheme pattern” and “Layout pattern”, which were not realized. Vipro can be extended to support them,

9 Summary and Outlook Vipro Andrejs Rapoports
74
too. For example, current layout engine can be extended to support horizontal layout, too. “Theme
pattern” would require deeper changes in Vipro in order to be supported.
Interchangeable layout engine. Vipro uses a layout engine that extends BPI. It is possible to define the
interface to the layout engine and make it interchangeable. This is directly connected with “Scheme
pattern” because it is unlikely that one engine will be able to support different “scheme patterns”. It is
more likely that different schemes are supported by different engines.
Instance Data transformation. Vipro Instance Data is put directly into the template. But often the data
has to be transformed first (chapter 3.3.2). Here loose coupling is not yet fully achieved.
Embedding vs. linking. Vipro Templates can become relatively large because of embedded icons.
Final visualization can have duplicate definitions of embedded style sheets (chapter 7.1). To solve this,
images and style sheet should be linked using URLs. This will enable caching and reuse of resources, but
will make templates tightly coupled to the resources used. This is already possible because Vipro
templates are completely transparent and both approaches work well.
Stateful Web service. Vipro Web service is stateless (chapter 6.3). It implies that each time the full
context must be provided with the request. This approach can be resource consuming. This problem can
be solved by making the Web service stateful. For example, a session mechanism can be used. In this case
process model, templates, Vipro Instance Metadata and Vipro configuration can be uploaded once and
then be reused. Later in each request only the latest Vipro Instance Data will be provided. This will save
not only the network traffic but also parsing time for artifacts.
Interactivity. Currently, visualizations made with Vipro are completely static and the user cannot
interact with templates. But templates are SVG based and in SVG it is possible to add Java Script code to
any elements. It makes an interaction with the user possible. For example, an activity can show more
details when a user clicks it. In combination with HTML5, which supports SVG, even more is possible.
Vipro Editor can be made much better. Probably, the most useful feature would be the visually-
enabled editing of a Vipro Configuration. For example, the process model can be visualized so that the
user could select activities, which should be targeted by a mapping rule.

Andrejs Rapoports Vipro Acknowledgments
75
Acknowledgments
This work would not have been possible without the support of two people.
The author wishes to express his gratitude to his supervisor, David Schumm who was abundantly
helpful and offered invaluable guidance and support.
The author wishes to express his love and gratitude to his wife Kate for her patience, love and
language support.

Bibliography Vipro Andrejs Rapoports
76
Bibliography
[1] F. Leymann, Skript Workflow Mamagement, 2010.
[2] D. L. Moody, The “Physics” of Notations: Towards a Scientific Basis for Constructing Visual
Notations in Software Engineering, IEEE, 2008.
[3] J. Larkin and H. Simon, "Why a Diagram is (Sometimes) Worth," Cognitive Science, no. 11, 1987.
[4] OASIS Open, "Web Services Business Process Execution Language Version 2.0," 11 04 2007.
[Online]. Available: http://docs.oasis-open.org/wsbpel/2.0/OS/wsbpel-v2.0-OS.html. [Accessed 19
10 2011].
[5] D. Schumm, Information Design for Business Process Management, The 5th Summer School on
Service Oriented Computing (Summer SOC), Poster Session, 2011.
[6] Eclipse Foundation, "BPEL Designer Project," 2011. [Online]. Available:
http://www.eclipse.org/bpel. [Accessed 18 10 2011].
[7] Oracle, "Oracle JDeveloper," 2011. [Online]. Available:
http://www.oracle.com/technetwork/developer-tools/jdev/overview/index.html. [Accessed 18 10
2011].
[8] Signavio GmbH, "Signavio Process Editor," 2011. [Online]. Available:
http://www.signavio.com/en/products/process-editor-as-a-service.html. [Accessed 18 10 2011].
[9] Object Management Group, Inc., "Business Process Model and Notation (BPMN) Version 2.0," 01
2011. [Online]. Available: http://www.omg.org/spec/BPMN/2.0/. [Accessed 18 10 2011].
[10] E. Krämer, "Anpassbare Darstellung von Prozessmodellen, Diplomarbeit Nr.3062," Universität
Stuttgart, Fakultät Informatik und Elektrotechnik, 2010.
[11] W3C, "Scalable Vector Graphics (SVG) 1.1 (Second Edition)," 16 08 2011. [Online]. Available:
http://www.w3.org/TR/SVG/. [Accessed 24 10 2011].
[12] W3C, "Document Object Model (DOM) Technical Reports," 2004. [Online]. Available:
http://www.w3.org/DOM/DOMTR.html. [Accessed 18 10 2011].

Andrejs Rapoports Vipro Bibliography
77
[13] R. Bobrik, "Konfigurierbare Visualisierung komplexer Prozessmodelle, PhD Thesis," 2008.
[14] R. Bobrik, T. Bauer and M. Reichert, "Proviado – Personalized and Configurable Visualizations of
Business Processes," in Proc. 7th Int'l Conf. on Electronic Commerce and Web Technologies (EC-
WEB'06), Krakow, 2006.
[15] OASIS Open, "WS-BPEL 2.0 Primer," 09 05 2007. [Online]. Available: http://docs.oasis-
open.org/wsbpel/2.0/Primer/wsbpel-v2.0-Primer.pdf. [Accessed 19 10 2011].
[16] The Apache Software Foundation, "Apache ODE," 06 02 2011. [Online]. Available:
http://ode.apache.org/. [Accessed 19 10 2011].
[17] The Apache Software Foundation, "ODE - Architectural Overview," [Online]. Available:
http://ode.apache.org/architectural-overview.html. [Accessed 19 10 2011].
[18] S. Probets, J. Mong, D. Evans and D. Brailsford, "Vector Graphics: From PostScript and Flash to
SVG," New York, NY, USA, 2001.
[19] Inkspace, "Inkspace," [Online]. Available: http://inkscape.org/. [Accessed 16 10 2011].
[20] "Proposal for a diploma thesis "Environmentally-aware Visualization of Business Processes","
[Online]. Available: http://www.iaas.uni-
stuttgart.de/lehre/studarb/diplomarbeiten/DA_Environmentally-
aware_Visualization_of_Business_Processes.pdf. [Accessed 26 10 2011].
[21] F. Leymann, Skript - Message‐Based Applications - Messaging Endpoints, 2010.
[22] G. Latuske, "Sichten auf Geschäftsprozesse als Werkzeug zur Darstellung laufender
Prozessinstanzen, Diplomarbeit Nr. 3036," Universität Stuttgart, Fakultät Informatik und
Elektrotechnik, 2010.
[23] Oracle, "BPEL2SVG Generator," 2008. [Online]. Available:
http://blogs.oracle.com/toxophily/entry/open_esb_tip_generating_svg. [Accessed 16 10 2011].
[24] The Apache Software Foundation, "Apache License, Version 2.0," 01 2004. [Online]. Available:
http://www.apache.org/licenses/LICENSE-2.0.html. [Accessed 16 10 2011].
[25] D. Schumm, F. Leymann and A. Streule, "Process Viewing Patterns," in Proceedings of the 14th
IEEE International EDOC Conference, EDOC 2010, 25‐29 October 2010, Vitória, 2010.

Bibliography Vipro Andrejs Rapoports
78
[26] F. Leymann, Skript "Foundations Of Architecture Of Application Systems", 2009.
[27] W3C, "XML Schema," 28 10 2004. [Online]. Available: http://www.w3.org/XML/Schema.
[Accessed 21 10 2010].
[28] Oracle, "Java EE at a Glance," [Online]. Available:
http://www.oracle.com/technetwork/java/javaee/overview/index.html. [Accessed 21 10 2011].
[29] The Apache Software Foundation, "Apache Commons project," 13 10 2011. [Online]. Available:
http://commons.apache.org/. [Accessed 21 10 2011].
[30] Oracle, "Java Architecture for XML Binding (JAXB)," 03 2003. [Online]. Available:
http://www.oracle.com/technetwork/articles/javase/index-140168.html. [Accessed 21 10 2011].
[31] Vaadin Ltd, "Vaadin," 2011. [Online]. Available: https://vaadin.com. [Accessed 21 10 2011].
[32] Oracle, "Java Servlet Technology," [Online]. Available:
http://www.oracle.com/technetwork/java/javaee/servlet/index.html. [Accessed 21 10 2011].
[33] The Apache Softwtware Foundation, "Apache Axis2/Java," 30 08 2011. [Online]. Available:
http://axis.apache.org/axis2/java/core/. [Accessed 21 10 2011].
[34] W3C, "SOAP Specifications," 27 04 2007. [Online]. Available: http://www.w3.org/TR/soap/.
[Accessed 21 10 2011].
[35] W3C, "Web Services Description Language (WSDL) Version 1.1," 15 03 2001. [Online]. Available:
http://www.w3.org/TR/wsdl. [Accessed 24 10 2011].
[36] OASIS, "OASIS Web Services Resource Framework (WSRF) TC," 2011. [Online]. Available:
www.oasis-open.org/committees/wsrf/. [Accessed 22 10 2011].
[37] Vaadin Ltd., "Book of Vaadin," 22 10 2011. [Online]. Available: https://vaadin.com/download/book-
of-vaadin/current/pdf/book-of-vaadin.pdf. [Accessed 23 10 2011].
[38] Network Working Group, "The Base16, Base32, and Base64 Data Encodings (rfc4648)," 10 2006.
[Online]. Available: http://tools.ietf.org/html/rfc4648. [Accessed 23 10 2011].
[39] Adobe Systems Incorporated, "Saving compressed SVG (SVGZ)," 2011. [Online]. Available:
http://www.adobe.com/svg/illustrator/compressedsvg.html. [Accessed 24 10 2011].

Andrejs Rapoports Vipro Bibliography
79
[40] W3C, "HTML5," 25 05 2011. [Online]. Available: http://www.w3.org/TR/html5/. [Accessed 23 10
2011].
[41] A. Nowak, F. Leymann, D. Schumm and B. Wetzstein, "An Architecture and Methodology for a
Four-Phased Approach to Green Business Process Reengineering," in Proceedings of the 1st
International Conference on ICT as Key Technology for the Fight against Global Warming - ICT-
GLOW, 2011.
[42] The COMPAS Project: WatchMe Case Study, 2010.

Table of Figures Vipro Andrejs Rapoports
80
Table of Figures
Figure 1. Business Process Lifecycle [1]. ............................................................................................... 6
Figure 2. Templates must be decoupled from both process and WfMS. Visual configuration brings the
pieces together. ............................................................................................................................................. 9
Figure 3. Sketch for the editor’s inputs and outputs. ............................................................................. 12
Figure 4. Process definition visualization in Eclipse BPEL Designer (left), Oracle JDeveloper (middle)
and Signavio Process Editor (right). ........................................................................................................... 13
Figure 5. The assumed abstract way of visualizing process instances. ................................................. 13
Figure 6. Composition of visual configurations in [10]. Figure is taken without any modifications from
[10]. ............................................................................................................................................................ 14
Figure 7. Architectural overview of ODE. Figure taken from [17]. ...................................................... 18
Figure 8. Sketch of the “Messaging Mapper” pattern [21]. ................................................................... 21
Figure 9. Made with BPI visualization of a process. ............................................................................. 22
Figure 10. Place of Vipro Web service in overall architecture of a monitoring and analysis application.
.................................................................................................................................................................... 24
Figure 11. Reference behavior of the monitoring and analysis application that wants to utilize Vipro
Web service ................................................................................................................................................ 25
Figure 12. Architecture of the Vipro Editor – it is a three-tier Web. Elements placed directly above
other elements utilize them. ........................................................................................................................ 26
Figure 13. Reference interaction of the user with Vipro Editor. ........................................................... 27
Figure 14. Artifacts and their dependencies. Elements placed directly above other elements depend on
them. ........................................................................................................................................................... 28
Figure 15. Relation between Vipro Instance Data and Vipro Instance Metadata in 4-level modeling
architecture. ................................................................................................................................................ 32
Figure 16. Root element of the Vipro Instance Metadata format. It has two child nodes – “meta” and
“parameters”. .............................................................................................................................................. 33
Figure 17. “ParameterType” of the Vipro Instance Metadata format. It has two required attributes and
three optional child nodes. .......................................................................................................................... 34
Figure 18. Root element of the Vipro Instance Data format. It has two child nodes – “meta” and
“activities”. ................................................................................................................................................. 35
Figure 19. “ActivityType” of the Vipro Instance Data format. It holds three attributes that reference an
activity and a list of parameter values. ....................................................................................................... 35
Figure 20. Root element of the Vipro Configuration format. Besides of the meta information it
references a process definition and RTD-Format. Main content is the list of mapping rules. ................... 36
Figure 21. “MappingType” of the Vipro Configuration format defines a mapping rule – which activity
gets which template applied. “TemplateType” defines the template and how it should be filled. ............. 37

Andrejs Rapoports Vipro Table of Figures
81
Figure 22. “ParameterType” of Vipro Configuration format defines how a single Spot (“spotid”) in
Vipro Template should be filled. It can be a static value (“staticValue”) or value from Vipro Instance
Data (“paramid”). ....................................................................................................................................... 37
Figure 23. Coarse-grained diagram of Vipro component shows that Vipro Library covers all common
functionality used by both Vipro applications that are independent between themselves. ........................ 38
Figure 24. Fine-grained diagram of Vipro components. Elements placed directly above other elements
or at the same level with other elements utilize them. Elements marked with asterisk (*) are imported
components. ................................................................................................................................................ 39
Figure 25. Components diagram for Vipro Library. ............................................................................. 40
Figure 26. Grid used in BPI. Grid lines and numbers are for clarity only and normally are not visible,
Figure taken from [22]. .............................................................................................................................. 44
Figure 27. Class diagram showing relations between original classes (blue) and new classes (green) in
BPI. ............................................................................................................................................................. 46
Figure 28. Sequence diagram for the visualization routine. .................................................................. 47
Figure 29. Components diagram for Vipro Web service. ..................................................................... 48
Figure 30. Request type for the operation getViproVisualization of the Vipro Web service. .... 49
Figure 31. Components diagram for Vipro Editor. ............................................................................... 50
Figure 32. Architecture of Vaadin. Figure taken from [37], Chapter 3.1. ............................................. 51
Figure 33. BPEL process for the “Long Running Process” test case. This visualization was made with
Eclipse BPEL Editor. ................................................................................................................................. 52
Figure 34. Main window of Vipro Editor consists of three areas. They are marked red. ..................... 52
Figure 35. Step 1 – Select Process of the Vipro Editor. ........................................................................ 53
Figure 36. Step 2 – Create RTD-Format of the Vipro Editor. ............................................................... 54
Figure 37. Step 3 – Select Templates of the Vipro Editor. ................................................................... 54
Figure 38. Step 4 – Create Configuration of the Vipro Editor. It consists of three zones marked with
red color. ..................................................................................................................................................... 55
Figure 39. Step 5 – Preview of the Vipro Editor. .................................................................................. 56
Figure 40. A simple client for Vipro Web service showing a visualization of a process instance........ 57
Figure 41. BPEL process for the “Resource Consumption” test case. The visualization was made with
Eclipse BPEL Editor. ................................................................................................................................. 61
Figure 42. Preview of the Vipro Template featuring dynamic width, icon title and subtitle. ............... 62
Figure 43. Preview of a Vipro Template featuring dynamic icon and title. .......................................... 62
Figure 44. Visualization made by Vipro for the “Resource Consumption” test case. From the
visualization it becomes immediately clear that “RemoveData” consumes more energy than “InsertData”
does............................................................................................................................................................. 65
Figure 45. Vipro Template for the “Security Levels” test case. It features dynamic background color,
two icons and two titles. Figure shows two possible background colors from four. .................................. 67

Vipro Andrejs Rapoports
82
Figure 46. Resulting visualization for the “Security Levels” test case.................................................. 67
Figure 47. Vipro Template for the “Long Running Process” test case. It features a progress bar. ....... 68
Figure 48. Resulting visualization for the “Long Running Process” test case. ..................................... 69
Figure 49. Straightforward visualization for the “Car Wash” test case. ................................................ 69
Figure 50. Vipro Template for the “Car Wash” test case. Size of the water drop is dynamic. ............. 70
Figure 51. Resulting visualization for the “Car Wash” test case. .......................................................... 70
Figure 52. Visualization for the “Large Process” test case. .................................................................. 71

Andrejs Rapoports Vipro Table of Listings
83
Table of Listings
Listing 1. Definition of templates (left) and their usage (right) in [14]. Listing taken from [14]. ........ 16
Listing 2. Import of additional namespaces into the ordinary SVG file. .............................................. 29
Listing 3. Vipro attribute that makes ordinary attribute dynamic without breaking the SVG syntax. The
content of curly brackets describes the Spot and will be replaced at Run-Time. ....................................... 29
Listing 4. Vipro attribute that makes a node value dynamic. ................................................................ 30
Listing 5. Two special attributes in the root element of an SVG document that tell the size of the
template. ..................................................................................................................................................... 31
Listing 6. Two attributes that make width and height definition dynamic. ........................................... 31
Listing 7. Recursive method that looks for Spot definitions. ................................................................ 41
Listing 8. Method that calculates the value of a Spot. .......................................................................... 43
Listing 9. The way to embed graphics in the SVG document. .............................................................. 59
Listing 10. The way to make a dynamic icon in a Vipro Template. ..................................................... 60
Listing 11. BPEL process (A1) for the “Resource consumption” test case. ......................................... 61
Listing 12. Vipro Instance Metadata (A2) for the “Resource consumption” test case. ......................... 62
Listing 13. Vipro Template for “Resource Consumption” test case. It features dynamic width, icon for
activity type and two custom texts. ............................................................................................................ 63
Listing 14. Vipro Instance Data for the “Resource Consumption” test case. ........................................ 63
Listing 15. Vipro Configuration for the “Resource Consumption” test case. ....................................... 64
Listing 16. Implementation of the filling for a progress bar in a Vipro Template. ............................... 68
List of Tables
Table 1. Use Cases and their outputs – artifacts. ................................................................................... 12
Table 2. Required components and documents and their realization way ............................................ 23
Table 3. Arguments used to fill in a template. ...................................................................................... 42
Table 4. Original classes from BPI that were replaced in Vipro by new classes. ................................. 45
Table 5. Security levels for the “Security Levels” test case. ................................................................. 66
Table 6. Overview of templates used in test cases. ............................................................................... 72

84
Erklärung
Ich versichere, dass ich diese Arbeit selbstständig verfasst und nur die angegebenen Hilfsmittel
verwendet habe.
_______________________________
(Andrejs Rapoports)