confined animal feeding operation (cafo) …...2019 cafo program annual report page 7 of 22 • wym...
TRANSCRIPT

Oregon Department of Agriculture
CONFINED ANIMAL FEEDING OPERATION (CAFO) PROGRAM
2019 ANNUAL REPORT

2019 CAFO Program Annual Report
Page 2 of 22
This page intentionally blank.

2019 CAFO Program Annual Report
Page 3 of 22
TABLEOFCONTENTSINTRODUCTION................................................................................................................................5
CAFOPROGRAMOVERVIEW.........................................................................................................6CAFOGeographicBoundaries.................................................................................................................6Figure1:CAFOGeographicBoundariesMap............................................................................................................6
CAFOProgramStaff...................................................................................................................................72019CAFOPROGRAMSTATISTICS.............................................................................................7GeneralStatistics........................................................................................................................................7Table1:CAFOPermitTypebyAreaandDesignation..........................................................................................8Table2:NAICS(NorthAmericanIndustryClassificationSystem)byArea..............................................9Table3:CAFODesignationbyArea..............................................................................................................................9
2019CAFOINSPECTIONS.............................................................................................................10InspectionType........................................................................................................................................10Table4:TotalNumberofInspectionsbyType(PermittedandNon-PermittedFacilities............11
InspectionOutcome................................................................................................................................11Table5:InspectionOutcome(PermittedandNon-PermittedFacilities.................................................12
PermittedCAFOs......................................................................................................................................12Table6:InspectionTypebyAreaforPermittedCAFOs...................................................................................12Table7:InspectionOutcomebyAreaofPermittedCAFOs............................................................................13Table8:DamSafetyInspections...................................................................................................................................13Table9:WaterSampling....................................................................................................................................................14
Non-PermittedCAFOs.............................................................................................................................14Table10:InspectionTypebyAreaforNon-PermittedCAFOs.....................................................................14
Table11:InspectionOutcomebyAreaofNon-PermittedCAFOs...............................................................15 Table12:NumberofWaterSamplingEventsonNon-PermittedCAFOsbyInspectionType.....152019CAFOENFORCEMENTACTIVITIES..................................................................................16FormalEnforcementActions................................................................................................................16NoticeofCivilPenaltiesAssessment(NCPA.....................................................................................16Table13:NCPAsissuedforadministrativepermitviolations......................................................................16Table14:NCPAsissuedfordischargeorotherpermitnon-compliance................................................16
OtherEnforcementActions...................................................................................................................17Table15:OtherEnforcementActions.......................................................................................................................17
LegalActions.............................................................................................................................................17Table16:Appeals.................................................................................................................................................................17Table17:CourtProceedings..........................................................................................................................................17
2019ADMINISTRATIVEACTIVITIES.........................................................................................18Table18:AWMPTypeandConstructionstatusbyArea.................................................................................18
CancellationofCAFOPermits...............................................................................................................19Table19:NumberofCAFOPermitscancelledbyNAICSCodeandArea................................................19
CAFOPermitsIssued...............................................................................................................................19Table20:NumberofCAFOPermitsissuedbyNAICSCodeandAreafor2019CY............................19
PendingCAFOPermitApplications.....................................................................................................19 Table21:PendingPermitApplications....................................................................................................................19PublicNoticeandParticipation(S1.H.).............................................................................................20Table22:PublicNoticingActivitybyDesignationandArea.........................................................................20
AnnualReport(S4.D.2)...........................................................................................................................20Table23:2018AnnualReportsReceivedbyArea..............................................................................................20

2019 CAFO Program Annual Report
Page 4 of 22
FinancialAgreementsAdministered..................................................................................................21PublicRecordsRequests........................................................................................................................212019GeneralCAFOPermitRenewal..................................................................................................21CAFOAdvisoryCommittee.....................................................................................................................21NewCAFOProgramActivities...............................................................................................................22

2019 CAFO Program Annual Report
Page 5 of 22
INTRODUCTION The mission of the Oregon Department of Agriculture (ODA) Natural Resources Program Area is to ensure healthy natural resources, environment, and economy for Oregonians now and in the future through inspection and certification, regulation and promotion of agriculture and food. The Oregon Department of Agriculture remains able to serve the changing needs of Oregon’s diverse agricultural and food sectors to maintain and enhance a healthy natural resource base and strong economy in rural and urban communities across the state. Oregon Department of Agriculture Core Values: Honesty, integrity and fairness Diversity, equity and inclusion Respect for people and property Practical collaborative approaches to problem solving Science-based approaches: technical and professional competence Transparency Quality customer service As part of protecting Oregon’s natural resources, the Oregon Legislature established a special regulatory program for Confined Animal Feeding Operations (CAFO) in 1989. The legislation required the Oregon Department of Environmental Quality (DEQ) to issue CAFO permits and directed ODA to inspect CAFO facilities. In 1993, the CAFO statutes were amended to direct the Environmental Quality Commission (EQC) and ODA to enter into a formal memorandum of understanding (MOU). The MOU authorizes ODA to perform the CAFO related functions of DEQ and the EQC. ODA has continued to operate the CAFO Program in concert with DEQ under this MOU. The most current CAFO Program MOU was signed on December 23, 2015 and expires December 31, 2020. This report has been prepared as required by the MOU. The 2019 CAFO Program Annual Report describes the CAFO Program’s activities that have occurred over the last year. The report includes:
• Program statistics • Permitted CAFO inspection types and results • Non-permitted CAFO inspection types and results • Enforcement actions • Administrative functions

2019 CAFO Program Annual Report
Page 6 of 22
CAFO PROGRAM OVERVIEW
CAFO Geographic Boundaries Permitted CAFO facilities are located across the entire State of Oregon. The CAFO Program has divided the state into six geographic regions. The CAFO areas have been created to capitalize on geographic similarities, CAFO facility similarities, and equitable distribution of work responsibilities. Below is a map detailing the six CAFO areas. The number of permitted CAFO facilities located in each area can be found in Table 1, Page 8.
CAFO Program Staff
The CAFO Program has a staff of 9.0 FTE. The program is led by the CAFO and Fertilizer Program Manager. The CAFO Program includes six regional Livestock Water Quality Specialists (LWQS). The LWQS is primarily responsible for assessing a facility’s compliance with the CAFO Program. In addition to the LWQS, the CAFO Program has a Program Analyst and a Program Support staff. A complete list of CAFO Program staff in 2019 is available below: Figure 1: CAFO Geographic Boundaries Map
LAKE
HARNEY
MALHEUR
LANE
GRANT
KLAMATH
DOUGLAS
LINN
BAKER
CROOK
UMATILLA
WASCO
COOS
WALLOWA
UNION
JACKSONCURRY
DESCHUTES
MORROW
WHEELERJEFFERSON
CLACKAMAS
JOSEPHINE
GILLIAM
MARIONPOLK
LINCOLN
CLATSOP
TILLA
MOOK
SHERMAN
YAMHILL
BENTON
COLUMBIA
WASHINGTON
HOODRIVERMULTNOMAH
AREA V
AREA
VI
AREA IV
AREA II AREA IIIAREA I
This product is for informational purposes andmay not have been prepared for, or be suitablefor legal, engineering, or surveying purposes.Users of this information should review or consults the primary data and informationsources to ascertain the usability of theinformation.
50 0 50 10025Miles
CAFO Geographic Boundaries
Prepared By: dlwalkerDate Saved: 2/7/2017Date Printed: 2/7/2017Scale: 1:3,000,000Projection: NAD 1983 Oregon Statewide Lambert Feet IntlPath:V:\NRPA\CAFO\BoundaryMap.mxd
Livestock WaterQuality Specialists
CAFO Program ManagerWym Matthews(503) [email protected]
Area IVChris Anderson(541) 673-0805cell: (541) 660-9611
Area IIIBen Krahn(503) 986-6468cell: (503) 510-8213
Area IArmando Macias(503) 842-6278cell: (503) 801-1630
Area V
Kevin Coughlincell: (541) 969-6679
Area VI
Hilary Collinsworthcell: (541) 881-6020
Area IICharlene Olson(503) 986-4780cell: (503) 931-7778

2019 CAFO Program Annual Report
Page 7 of 22
• Wym Matthews, CAFO and Fertilizer Program Manager (located at ODA, Salem)
• Area I - Tillamook county o Armando Macias, Livestock Water Quality Specialist
• Area II - Benton, Clatsop, Columbia, Lincoln, Polk, Washington, and Yamhill counties o Charlene Olson, Livestock Water Quality Specialist
• Area III - Clackamas, Marion, and Multnomah counties o Ben Krahn, Livestock Water Quality Specialist
• Area IV - Coos, Curry, Douglas, Jackson, Josephine, Lane and Linn counties o Chris Anderson, Area IV Livestock Water Quality Specialist
• Area V - Crook, Deschutes, Gilliam, Grant, Harney, Hood River, Jefferson, Klamath, Lake, Morrow, Sherman, Umatilla, Wasco, and Wheeler counties o Kevin Coughlin, Livestock Water Quality Specialist
• Area VI - Baker, Malheur, Union, and Wallowa counties o Hilary Collinsworth, Livestock Water Quality Specialist
• Program Analyst: Christy Caldwell (Located at ODA, Salem) • Program Support Staff: Janet Short (Located at ODA, Salem)
2019 CAFO PROGRAM STATISTICS
General Statistics Together, ODA and DEQ issued the Oregon CAFO National Pollutant Discharge Elimination System (NDPES) General Permit Number 01-2016. This permit was issued on March 31, 2016, was effective on April 20, 2016, and expires February 28, 2021. On October 1, 2015, the Oregon CAFO Water Pollution Control Facilities General Permit Number 01-2015 was issued, was effective on October 21, 2015 and expires September 30, 2025. An update of the Permit renewal activities is on page 21. In addition to the General Permit, ODA and DEQ also administer Individual NDPES Permits. At the end of 2019, the CAFO Program had a total of 508 permitted CAFO facilities. Of the permits issued:
• 370 CAFO operators are registered to the General NPDES Permit. • 5 CAFO operators are registered to Individual NPDES Permits. • 133 CAFO operators are registered to the General WPCF Permit. • Dairy cattle (milk production) are the species with the largest number of permits. • Almost one-half of the facilities registered to the CAFO Permit meet the size designation of
Medium. Tables 1, 2 and 3 Summary of CAFO Permit type by area and designation, NAICS by area and CAFO designation by area.

2019 CAFO Program Annual Report
Page 8 of 22
Table 1: CAFO Permit Type by Area and Designation
General Permit
registrations Individual Permits WPCF Permit registrations Total
Area 1 87 0 21 108 Large Concentrated 8 0 0 8 Large Confined 0 0 0 0 Medium Concentrated 51 0 0 51 Medium Confined 0 0 7 7 Small Concentrated 28 0 0 28 Small Confined 0 0 14 14
Area 2 58 0 10 68 Large Concentrated 17 0 0 17 Large Confined 0 0 1 1 Medium Concentrated 22 0 0 22 Medium Confined 0 0 1 1 Small Concentrated 19 0 0 19 Small Confined 0 0 8 8
Area 3 60 0 19 79 Large Concentrated 17 0 0 17 Large Confined 0 0 0 0 Medium Concentrated 24 0 0 24 Medium Confined 0 0 6 6 Small Concentrated 19 0 0 19 Small Confined 0 0 13 13
Area 4 40 0 50 90 Large Concentrated 11 0 0 11 Large Confined 0 0 5 5 Medium Concentrated 15 0 0 15 Medium Confined 0 0 12 12 Small Concentrated 14 0 0 14 Small Confined 0 0 33 33
Area 5 53 5 17 75 Large Concentrated 28 4 0 32 Large Confined 0 1 5 6 Medium Concentrated 17 0 0 17 Medium Confined 0 0 6 6 Small Concentrated 8 0 0 8 Small Confined 0 0 6 6
Area 6 72 0 16 88 Large Concentrated 23 0 0 23 Large Confined 0 0 3 3 Medium Concentrated 42 0 0 42 Medium Confined 0 0 9 9 Small Concentrated 7 0 0 7 Small Confined 0 0 4 4
Total 370 5 133 508

2019 CAFO Program Annual Report
Page 9 of 22
Table 2: NAICS (North American Industry Classification System) by Area NAICS Area 1 Area 2 Area 3 Area 4 Area 5 Area 6 Total All Other Animal Production, includes, dog kennels, alpaca, bison, worm production, and llama production
0 0 0 5 2 0 7
Auction Yard 0 0 1 1 1 1 4 Beef Cattle Ranching and Farming, Back Grounding Cattle, Veal Calf Production
0 4 4 12 2 6 28
Broiler Chicken Production 0 11 8 7 0 0 26 Cattle Feedlots, Fattening cattle 12 10 4 10 35 60 131 Chicken Egg Production 0 0 7 1 1 0 9 Dairy Cattle and Milk Production 96 34 43 38 25 15 251 Fur-Bearing Animal and Rabbit Production, includes mink, chinchilla, and fox
0 2 8 2 0 0 12
Goat Farming (e.g., meat, milk, mohair production) 0 2 1 4 3 3 13
Hog and Pig Farming 0 5 3 2 1 1 12 Horses and Other Equine Production, includes burro, donkey, mule, and pony
0 0 0 2 2 1 5
Nature Parks and Other Similar Institutions 0 0 0 1 0 0 1
Other Poultry Production 0 0 0 1 0 0 1 Sheep and Lambs 0 0 0 4 3 1 8 Total 108 68 79 90 88 88 508
Table 3: CAFO Designation by Area
CAFO Designation Area 1 Area 2 Area 3 Area 4 Area 5 Area 6 Total Large Concentrated 8 17 17 11 32 23 108 Large Confined 0 1 0 5 6 3 15 Medium Concentrated 51 22 24 15 17 42 171 Medium Confined 7 1 6 12 6 9 41 Small Concentrated 28 19 19 14 8 7 95 Small Confined 14 8 13 33 6 4 78 Total 108 68 79 90 75 88 508

2019 CAFO Program Annual Report
Page 10 of 22
2019 CAFO INSPECTIONS
Inspection Type The CAFO Program conducts multiple types of inspections on permitted and non-permitted facilities. The vast majority of the inspections conducted are routine inspections of permitted facilities. Routine inspections are used to assess the facility’s compliance with permit conditions and state water quality laws. In 2019, the twenty-first year of performance-based inspections, CAFO Program staff completed 872 inspections of all types. These inspections took place on both permitted and non-permitted operations. 47 complaints were received in 2019, 34 of these complaints resulted in complaint inspections (CI) with various outcomes. The complaints not resulting in an inspection were transferred to other programs or agencies or they were solved over the phone. Below is a list, and descriptions, of the inspection types completed by the CAFO Program. Table 4 also provides a summary of the number of inspections, by type, completed during 2019.
• Administrative (ADMS): Business transaction completed in the office. • Close Out: A final facility inspection conducted to assess if the permitted facility is appropriately
prepared to prevent discharge during a permit transfer or permit cancellation. • Complaint (CI): Complaint investigations for water quality concerns on permitted and non-
permitted animal agriculture facilities. • Drive By: A visual inspection of a facility (permitted or non-permitted) from public access. Contact
is not typically made with landowner of the facility. Typically used when the program receives a complaint. The drive-by allows for a quick assessment to determine next steps.
• Educational Review (EDR): Requested by permitted CAFO operators, LWQS discusses performance standards and best management practices for enabling producers to attain permit compliance. LWQS may also evaluate new proposals from producers. An EDR is not a formal inspection and generally will not result in enforcement action.
• Fall Storage Check (Fall S/C): Inspect liquid and solid storage to ensure sufficient winter storage. • Follow-up (FUP): Follow-up inspections are performed to determine whether a facility found to be
in violation during a prior inspection is now in compliance with the terms of their permit. • Planning Assistance (PA): LWQS provided both planning and technical assistance designed to
increase client awareness of pollution prevention practices and innovative technologies to enhance their environmental performance and maintain Permit compliance.
• Routine (RI): An announced regular, routine inspection on a scheduled frequency determined by overall program resources and workload, number of facilities, and size of inspection staff.
• Self-Reported Discharge (SR): CAFO operator reports a discharge to surface water.

2019 CAFO Program Annual Report
Page 11 of 22
Table 4: Total Number of Inspections by Type (Permitted and Non-Permitted Facilities) Inspection Type Number of Inspections Percentage (%) ADMS 42 4.70 CI 34 3.90 Close Out 20 2.41 Drive By 4 0.45 EDR 18 2.06 FALL S/C 40 4.59 FUP 72 8.26 PA 40 4.59 RI 596 68.35 SR 6 0.69 Total 872 100%
Inspection Outcome During the closing conference of each inspection, an inspection result is issued. An inspection report form is completed and records compliance, or noncompliance, with permit conditions or state water quality laws or rules. Inspection results may be delivered after ODA receives results of sampling, confirms data, and/or confers with management on matters identified during the inspection. Below is a list and descriptions of the inspection outcomes used by the CAFO Program. Table 5 also provides a summary of the inspection outcomes completed during CY 2019.
• Close Out: A final facility inspection conducted to assess if the permitted facility is appropriately prepared to prevent discharge during a permit transfer or permit cancellation
• Educational Review (EDR): Educational review was completed. • Facility in Compliance (FIC): The permittee operated in compliance with their permit, state water
quality law or rule. • Final Inspection Result Pending (FIRP): Additional time needed to assess the full extent of an
inspection. This result is often issued if samples have been collected and results are needed before a conclusion can be issued.
• Follow Up (FUP): Follow-up inspections are performed to determine whether a facility found to be in violation during a prior inspection is now in compliance with the terms of their permit.
• Notice of Noncompliance/Plan of Correction (NON/POC): See 2019 CAFO Enforcement Activities - Formal Enforcement Actions.
• Notice of Civil Penalty Assessment (NCPA): See 2019 CAFO Enforcement Activities - Formal Enforcement Actions.
• On-Schedule (O/S): The owner/operator is completing the step-by-step required actions (RAs) of their compliance schedule and is currently on schedule with all RAs.
• On-Schedule (O/S) A: On schedule Written • On-Schedule (O/S) B: On Schedule Verbal • Planning Assistance (PA): LWQS provided both planning and technical assistance to prepare and
submit required AWMP(s), reports, or applications. • Termination: A notice of intent to terminate an operation(s) CAFO permit. • Water Quality Advisory (WQA): The permittee was in compliance during the inspection event,
however, potential problems were noted, and voluntary efforts were encouraged to prevent permit violations.

2019 CAFO Program Annual Report
Page 12 of 22
Table 5: Inspection Outcome (Permitted and Non-Permitted Facilities)1 Inspection Outcome Number of Inspections Percentage (%) CFUP 1 0.11 EDR 16 1.84 FIC 588 67.43 FIRP 54 6.20 N/A 2 0.23 NCP 3 0.34 NON/POC 49 5.62 NON/POC to be issued 1 0.11 O/S 68 7.8 O/S A 1 0.11 O/S B 3 0.34 PA 45 5.16 Termination 6 0.69 WQA 35 4.02 Total 872 100%
Permitted CAFOs A total of 831 inspections were completed on permitted CAFOs in 2019. Of all of the inspection activities completed, routine compliance inspections are the greatest number of inspections completed on permitted CAFO facilities, followed by follow-up inspections. Of the inspections completed during the 2019, 93% of the inspection outcomes were facilities in compliance with permit conditions. Tables 6 and 7 summarize the number of inspections completed, and the associated outcome, on permitted CAFO facilities. Table 6: Inspection Type by Area for Permitted CAFOs 2
Inspection Type Area 1 Area 2 Area 3 Area 4 Area 5 Area 6 Total ADMS 7 13 3 8 8 1 40 CI 4 1 4 7 1 8 25 Close Out 3 4 4 7 1 1 20 Drive By 1 0 0 1 2 0 4 EDR 1 0 0 0 1 2 4 FALL S/C 40 0 0 0 0 0 40 FUP 2 16 10 23 15 2 68 PA 1 4 8 4 2 13 32 R 126 81 81 111 84 109 592 SR 0 4 2 0 0 0 6 Total 185 123 112 161 114 136 831
2Also includes facilities in the process of applying for permit coverage.

2019 CAFO Program Annual Report
Page 13 of 22
Table 7: Inspection Outcome by Area of Permitted CAFOs Inspection Outcome Area 1 Area 2 Area 3 Area 4 Area 5 Area 6 Total CFUP 0 0 0 0 0 1 1 EDR 1 0 0 0 0 3 4 FIC 136 79 76 111 78 105 585 FIRP 6 12 9 12 9 4 52 N/A 0 0 0 0 1 0 1 NCP 2 0 0 0 1 0 3 NON/POC 8 7 4 19 8 2 48 NON/POC to be issued 0 1 0 0 0 0 1 O/S 22 9 9 11 11 1 63 O/S A 0 0 0 0 1 0 1 O/S B 0 0 1 1 1 0 3 PA 1 4 8 4 2 14 33 Termination 0 4 1 0 0 1 6 WQA 9 7 4 3 2 5 30 Total 185 123 112 161 114 136 831
Dam Safety Inspections In 2011, the Oregon Department of Agriculture entered into a Memorandum of Understanding (MOU) with the Oregon Water Resources Department. This MOU allows the CAFO Program to conduct dam safety inspections on statutory dams (as defined by ORS 540.340 through 540.400) during site inspections. OWRD has completed rulemaking that includes the dam safety program and the agencies will be updating the MOU to an Internal Agency Agreement (IAA) in early 2020. Statutory dams on CAFO operations are earthen manure lagoons that have an earthen embankment of 10 feet or higher and have a storage capacity of equal, or greater than, 9.2 acre-feet. Of the 508 permitted CAFO facilities, there are 26 earthen manure lagoons that meet the definition of a statutory dam. Each of these manure lagoons is classified as a ‘low hazard’ by the WRD. According to the MOU with the Oregon Water Resource Department, inspections for low hazard dams need to be conducted at least once every six years. In addition to conducting dam safety inspections on the 26 statutory dams, the CAFO Program has also adopted the dam safety inspection protocol for all other earthen manure storage lagoons on permitted CAFO operations. See Table 8 for a summary of the dam safety inspection activities for both statutory dams and non-statutory dams.
Table 8: Summary of Dam Safety Inspections completed on Permitted CAFOs3 Number of CAFOs that received Dam Safety
Inspection Statutory Dams
Inspections Non-Statutory Dams
Inspections 111 21 90
3Some of the CAFOs have more than one lagoon.

2019 CAFO Program Annual Report
Page 14 of 22
Water Sampling Collecting water samples is another tool that is utilized by the CAFO Program in order to assess the operator's compliance with the CAFO permit. Water samples are typically collected when CAFO Program staff visually observe an active discharge or suspects a recent discharge. In 2019, there were a total of 20 sampling events with seven of the sampling events taking place during complaint inspections, nine events during follow-up inspections, one during routine inspections and three during planning assistance inspections. A total of 77 samples were collected in the sampling events. 18 of the 20 water sampling events were conducted on permitted CAFO facilities. See Table 12 on pg. 15 for Non-Permitted. See Table 9 for a summary of the water sampling events that occurred on permitted facilities by area.
Table 9: Number of Water Sampling Events on Permitted CAFOs by Inspection Type and Area Inspection Type Area 1 Area 2 Area 3 Area 4 Area 5 Area 6 Total CI 18 0 0 10 4 5 37 FUP 0 6 0 24 3 0 33 PA 0 0 1 0 0 0 1 RI 3 0 0 0 0 0 3 Total 21 6 1 34 7 5 74
Non-Permitted CAFOs Although the majority of the inspection activity completed by the CAFO Program takes place on permitted facilities, the CAFO Program interacts with non-permitted operations as well. During the 2019, the CAFO Program conducted 41 non-permitted CAFO inspections. Of which, half were a request from the operator to conduct Planning Assistance or an Educational Review. See Tables 10 and 11 for a summary of inspection types, and associated outcomes, completed on non- permitted CAFO facilities. Table 10: Inspection Type by Area for Non-Permitted CAFOs
Inspection Type Area 1 Area 2 Area 3 Area 4 Area 5 Area 6 Total ADMN 0 1 0 0 1 0 2 CI 0 0 0 4 4 1 9 EDR 1 2 3 4 4 0 14 FUP 0 0 1 3 0 0 4 PA 0 0 0 4 3 1 8 RI 1 1 2 0 0 0 4 Total 2 4 6 15 12 2 41
2019 CAFO Program Annual Report
Page 15 of 22
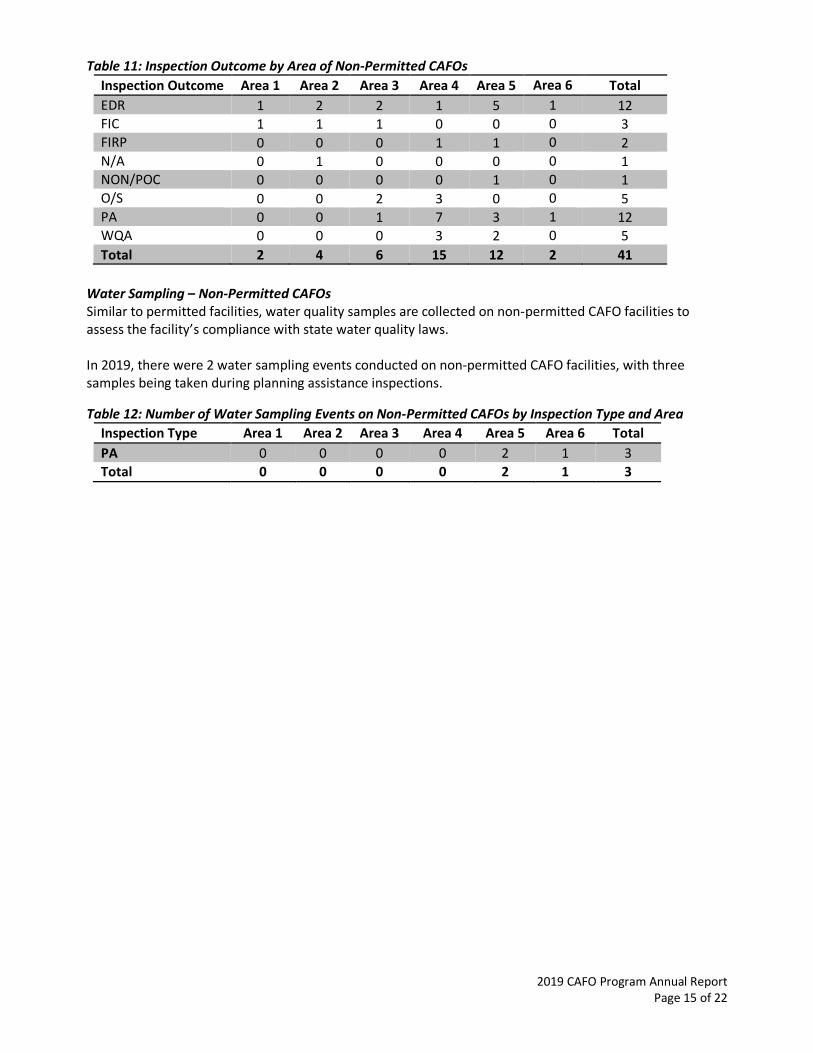
Table 11: Inspection Outcome by Area of Non-Permitted CAFOs Inspection Outcome Area 1 Area 2 Area 3 Area 4 Area 5 Area 6 Total EDR 1 2 2 1 5 1 12 FIC 1 1 1 0 0 0 3 FIRP 0 0 0 1 1 0 2 N/A 0 1 0 0 0 0 1 NON/POC 0 0 0 0 1 0 1 O/S 0 0 2 3 0 0 5 PA 0 0 1 7 3 1 12 WQA 0 0 0 3 2 0 5 Total 2 4 6 15 12 2 41
Water Sampling – Non-Permitted CAFOs Similar to permitted facilities, water quality samples are collected on non-permitted CAFO facilities to assess the facility’s compliance with state water quality laws. In 2019, there were 2 water sampling events conducted on non-permitted CAFO facilities, with three samples being taken during planning assistance inspections.
Table 12: Number of Water Sampling Events on Non-Permitted CAFOs by Inspection Type and Area Inspection Type Area 1 Area 2 Area 3 Area 4 Area 5 Area 6 Total PA 0 0 0 0 2 1 3 Total 0 0 0 0 2 1 3

2019 CAFO Program Annual Report
Page 16 of 22
2019 CAFO ENFORCEMENT ACTIVITIES
Formal Enforcement Actions If a discharge occurs or violation has been identified and the CAFO operator fails to complete corrective action(s) as required, the CAFO Program can take enforcement actions. Formal enforcement actions include, but are not limited to, Notice of Noncompliance, Notice of Civil Penalty Assessment (NCPA), and permit modification. Listed below are the types of enforcement actions the CAFO Program used by the CAFO Program.
• Consent Order (C/O): a department order signed by ODA Director and CAFO Permit Operator agreeing to set terms in order to AREA
• Final Order Incorporating Settlement Agreement (FO): A department order issued after settlement conference between CAFO operator and department representative. The FO reflects modifications to the orginial order issued by the department.
• Notice of Noncompliance/Plan of Correction (NON/POC): A negotiated department order that contains milestones describing required actions (RAs) that must be completed by the owner or operator to correct permit violations.
• Notice of Civil Penalty Assessment (NCPA): A department order assessed against an owner or operator of a CAFO for failure to comply with a provision of Oregon Revised Statutes (ORS) Chapter 468 or 468B or any rule adopted under a permit relating to the control and prevention of water pollution from a CAFO.
• Permit Registration Modification: A department order that is used to change the permit conditions for a permitted operator. The modification of the permit is based on the permittee’s program compliance history.
Notice of Civil Penalties Assessment (NCPA) During 2019, 3 NCPAs were issued for a total of $28,040. All 3 NCPAs were issued for discharge or other permit non-compliance. Table 13 and 14 summarize the NCPAs issued in 2019. Table 13: NCPAs issued for administrative permit violations
County Amount CAFO Permit Violation No NCPA were issued for administrative permit violations Sub Total
Table 14: NCPAs issued for discharge or other permit non-compliance
County Amount CAFO Permit Violation Morrow $3,200.00 S2.A Prohibitions and Discharge Limitations
S2.B Production Area Limitations S4.D Reporting Requirements-24 hr. reporting for Discharge ORS 468B.025(a) Prohibited Activities
Tillamook $4,320.00 S2.A Prohibitions and Discharge Limitations Tillamook $20,520.00 S2.A Prohibitions and Discharge Limitations
S2.H Proper Operation and Maintenance Sub Total $28,040.00
Total $28,040.00

2019 CAFO Program Annual Report
Page 17 of 22
Other Enforcement Actions Following the issuance of a NCPA, the CAFO operator has the opportunity to file an appeal and to request an informal meeting to discuss the enforcement action or complete a Contested Case Hearing. In 2019, the CAFO Program had one Order and Mutual Agreement. A Final Order Incorporating Settlement Agreement, Final Order or an appeal are the possible outcomes of this process. S4.E Order on Permit Modification. The Permit directs ODA to consider a Permit modification when a registrant has more than 2 discharges in any 24-month period. ODA also may issue a Permit modification to registrants that are experiencing difficulty maintaining Permit compliance Legal Actions See Table 15, 16 and 17 for a summary of enforcement actions other than NCPAs. Table 15: Other Enforcement Actions
Notice of Permit Modification County Total 0
Table 16: Appeals
Table 17: Court Proceedings Program Wide Outcome Circuit Court Cases 0 Stipulated Final Order / Pending Federal District Court 0 0
2019 ADMINISTRATIVE ACTIVITIES In addition to conducting field inspections, the CAFO Program staff performs several administrative functions. The largest administrative function performed by the CAFO Program includes the review and approval of Animal Waste Management Plans (AWMP). The AWMP is a document unique to the CAFO facility that describes the CAFO’s manure production, storage, transfer and application activities. Every permitted CAFO operator must implement an ODA approved AWMP. The approved AWMP is incorporated into the CAFO permit by reference (S3.A.). Every AWMP submitted to the CAFO Program is reviewed to ensure that it meets the required AWMP Elements (S3.C.) of the CAFO permit. In certain circumstances, the AWMP may require public notice (S3.B.) therefore; the AWMP approval process can be quite lengthy. Once the AWMP has been approved, LWQS review the AWMP in advance of inspections to ensure that the AWMP still reflects the CAFO’s operation and maintenance. If there is a discrepancy between the operation
Appeals Area 1 Area 2 Area 3 Area 4 Area 5 Area 6 Total Order and Mutual Agreement 0 0 0 0 1 0 1 Total 0 0 0 0 1 0 1
2019 CAFO Program Annual Report
Page 18 of 22
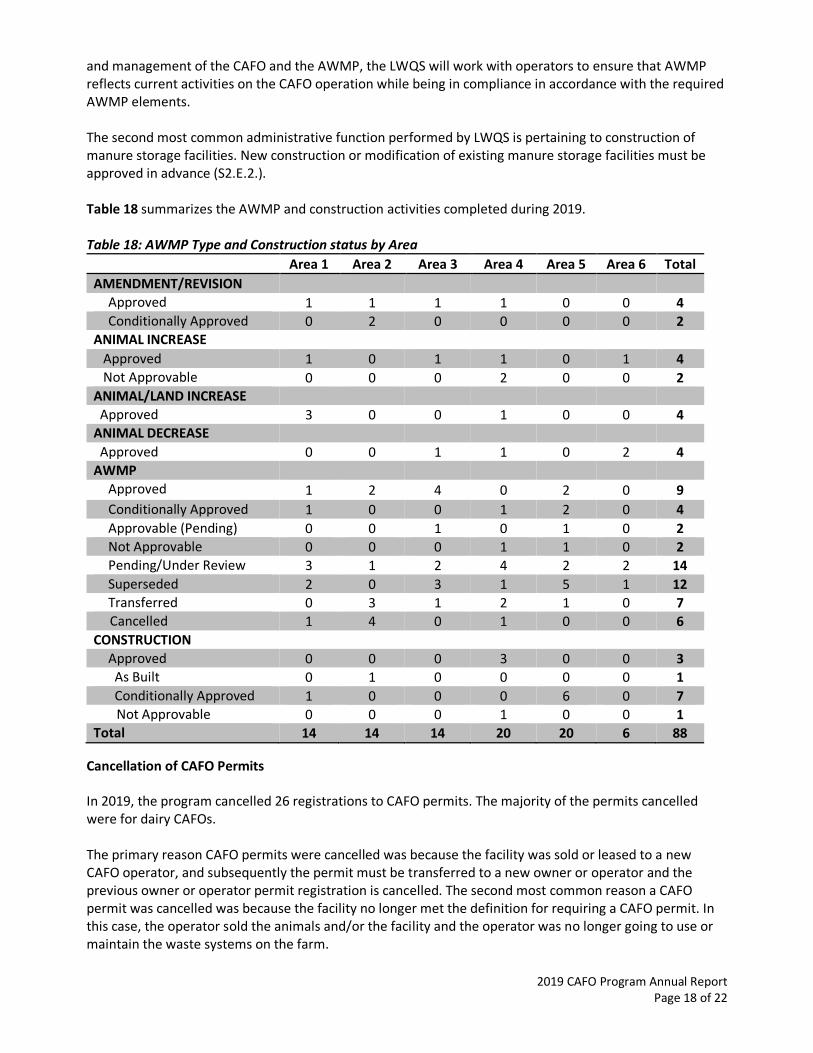
and management of the CAFO and the AWMP, the LWQS will work with operators to ensure that AWMP reflects current activities on the CAFO operation while being in compliance in accordance with the required AWMP elements. The second most common administrative function performed by LWQS is pertaining to construction of manure storage facilities. New construction or modification of existing manure storage facilities must be approved in advance (S2.E.2.). Table 18 summarizes the AWMP and construction activities completed during 2019. Table 18: AWMP Type and Construction status by Area
Area 1 Area 2 Area 3 Area 4 Area 5 Area 6 Total AMENDMENT/REVISION
Approved 1 1 1 1 0 0 4 Conditionally Approved 0 2 0 0 0 0 2
ANIMAL INCREASE Approved 1 0 1 1 0 1 4 Not Approvable 0 0 0 2 0 0 2 ANIMAL/LAND INCREASE Approved 3 0 0 1 0 0 4 ANIMAL DECREASE Approved 0 0 1 1 0 2 4 AWMP
Approved 1 2 4 0 2 0 9 Conditionally Approved 1 0 0 1 2 0 4 Approvable (Pending) 0 0 1 0 1 0 2 Not Approvable 0 0 0 1 1 0 2 Pending/Under Review 3 1 2 4 2 2 14 Superseded 2 0 3 1 5 1 12 Transferred 0 3 1 2 1 0 7
Cancelled 1 4 0 1 0 0 6 CONSTRUCTION
Approved 0 0 0 3 0 0 3 As Built 0 1 0 0 0 0 1 Conditionally Approved 1 0 0 0 6 0 7
Not Approvable 0 0 0 1 0 0 1 Total 14 14 14 20 20 6 88
Cancellation of CAFO Permits In 2019, the program cancelled 26 registrations to CAFO permits. The majority of the permits cancelled were for dairy CAFOs. The primary reason CAFO permits were cancelled was because the facility was sold or leased to a new CAFO operator, and subsequently the permit must be transferred to a new owner or operator and the previous owner or operator permit registration is cancelled. The second most common reason a CAFO permit was cancelled was because the facility no longer met the definition for requiring a CAFO permit. In this case, the operator sold the animals and/or the facility and the operator was no longer going to use or maintain the waste systems on the farm.

2019 CAFO Program Annual Report
Page 19 of 22
Table 19: Number of CAFO Permits cancelled by NAICS Code and Area NAICS Code Area 1 Area 2 Area 3 Area 4 Area 5 Area 6 Total Beef Cattle Ranching and Farming, Back Grounding Cattle, Veal Calf Production 0 2 0 1 0 0 3
Broiler Chicken Production 0 0 1 0 0 0 1 Cattle Feedlots, Fattening cattle 0 1 0 1 0 0 2 Dairy Cattle and Milk Production 8 2 2 1 0 1 14 Fur-Bearing Animal and Rabbit Production, includes mink, chinchilla, and fox 0 0 1 0 0 0 1
Goat Farming (e.g., meat, milk, mohair production) 0 0 0 1 0 0 1
Hog and Pig Farming 0 0 2 0 0 2 Other Poultry Production 0 0 1 1 0 0 2 Total 8 5 5 7 0 1 26
CAFO Permits Issued A total of 15 CAFO permits were issued in 2019. The primary reason for issuance of a new CAFO permit was a transfer of permit from a previously permitted operator. The transfer activity is highest in Area 2 and Area 4. Table 20: Number of CAFO Permits issued by NAICS Code and Area for 2019 CY
NAICS Code Area 1 Area 2 Area 3 Area 4 Area 5 Area 6 Total Broiler chicken production 0 4 0 0 0 0 4 Cattle Feedlots, Fattening cattle 0 0 0 1 1 0 2 Chicken Egg Production 0 0 0 0 1 0 1 Dairy Cattle and Milk Production 2 1 2 0 0 0 5 Goat Farming 0 0 0 1 0 1 2 Sheep and Lambs 0 0 0 1 0 0 1 Total 2 5 2 3 2 1 15
Pending Permit Applications A total of 8 applications to register (ATR) were received in 2019. 5 applications received in 2019 remain pending, 2 applications were cancelled. 6 pending applications were submitted previous years.
Table 21: Pending Permit Applications NPDES Permit Area 1 Area 2 Area 3 Area 4 Area 5 Area 6 Total Small Concentrated 0 0 0 0 0 0 0 Medium Concentrated 0 0 0 0 1 1 2 Large Concentrated 0 0 0 0 3 0 3
Total 0 0 0 0 4 1 5 WPCF Permit Small Confined 0 0 2 3 0 0 5 Medium Confined 0 0 0 0 0 1 1 Large Confined 0 0 0 0 0 0 0
Total 0 0 2 3 0 1 6

2019 CAFO Program Annual Report
Page 20 of 22
Public Notice and Participation (S1.H.)4 Prior to approving new permit coverage, renewing permit coverage or approving proposed substantial changes to an AWMP, the CAFO Program will provide public notice and participation. In 2019, the CAFO Program completed one noticing activities. Of the different public notice and participation opportunities, the CAFO Program received two requests for additional information and comments from one of the public noticing opportunities. The department reviewed and responded to these comments. Table 22 summarizes the public notice and participation opportunities by designation and the noticing activities are below. Table 22: Public Noticing Activity by Designation and Area.
Area 2 Area 3 Area 5 Area 6 Total Substantial Change to AWMP/Adding land and animal increase
Large Concentrated 0 1 0 1 2 Change to Permit Type Small Concentrated 1 0 0 0 1 New Registration Large Concentrated 0 0 1 0 1
Total 1 1 1 1 4
Annual Report (S4.D.2.) Each year the CAFO operator registered to an NPDES General or Individual Permit must submit an annual report to the CAFO Program by March 15th of each year. The Annual Report documents the number of animals, amount of manure, litter and/or process waste water generated and exported by the facility, land application information and information about the operation’s AWMP. Once the reports have been received, they are then reviewed by the regional LWQS for completeness. If the Annual Report is incomplete, the LWQS will work with the operator to resolve the issues. In 2019, the CAFO Program collected and processed a total of 389, Annual Reports for 2018. Below is a table that summarizes the 2018 Annual Reports received by area. Table 23: 2018 Annual Reports Received by Area
Area 1 Area 2 Area 3 Area 4 Area 5 Area 6 Total Total 90 61 63 43 58 74 389
4For the full public notice and participation schedule, see Table 2: CAFO Public Notice Requirements, page 8 of the CAFO NPDES General Permit #01-2016. http://www.oregon.gov/ODA/shared/Documents/Publications/NaturalResources/NPDESGeneralPermit.pdf

2019 CAFO Program Annual Report
Page 21 of 22
Financial Agreements Administered When the CAFO Program issues a Notice of Civil Penalty Assessment (NCPA), the money received from these activities are placed into an account that can only be used for educational projects and efforts that will benefit the CAFO operators. Funds are awarded through a financial agreement process. In 2019, the CAFO Program awarded two financial agreements for a total of $26,797.71. The financial agreements were for the following projects: Nutrient Management Planning Tool (NMPT), H&R Engineering LLC
Develop HTML computer program for a producer based nutrient management planning tool that is accessible on the internet using a login and password. To be fully executed by December 2019.
Projected Total ................................................................................................................ $25,000 Total Paid in 2019……………………………………………………………………………………………………………. $14,735 2020 CAFO Record Keeping Calendars, Oregon Dairy Farmers Association
A record keeping tool developed and printed for permitted CAFO operators to maintain the required CAFO records.
Final amount billed for project ..................................................................................... $1,797.71
Public Records Requests Most information associated with the CAFO NPDES or WPCF Permit is subject to Oregon’s Public Records Law (ORS Chapter 192) and NPDES Program and Permit (S1.G) and Clean Water Act requirements and is publicly available. The CAFO Program receives numerous requests for program files and information. Requests range from a single document to complete registrant files. In 2019, the CAFO Program responded to 133 different public records requests. A public records request is not required when program or permit records are requested during a public notice and participation opportunity.
2019 General CAFO Permit Renewal Activities There were no renewal activities in 2019. The CAFO NPDES General Permit No. 01-2016 will expire on February 28, 2021. The CAFO WPCF General Permit N0. 01-2015 will expire on September 30, 2025.
CAFO Advisory Committee Each year the CAFO Program holds three regularly scheduled CAFO Advisory Committee (CAC) meetings. The CAC was created to provide feedback to the department about the CAFO Program. The membership of the committee is comprised of permitted CAFO operators, technical advisors, stakeholder representatives, and the public.
In addition to holding regularly scheduled CAC meetings, the CAFO program has held additional meetings with the subcommittee that was formed to provide feedback to the agency concerning CAFO Fee Increases. There is a Proposed Agency Legislative Concept for CAFO Fee Increases for the 2019 Legislative session.

2019 CAFO Program Annual Report
Page 22 of 22
To increase fee revenue for the program, the Oregon Department of Agriculture submitted a legislative concept that passed in the 2019 Oregon Legislative Session. House Bill 2061 raised the statutory caps for general and individual permit application and transfer fees, as well as the annual permit fees. A hearing for a Notice of Proposed Rulemaking that would raise annual permit fees, application fees and transfer fees for CAFO operations was held on December 10, 2019. The last day to comment to the agency was December 20th, 2019 by 5 p.m. A Permanent Administrative Order was filed and became effective on December 23, 2019.
New CAFO Program Activities The agricultural community continues to embrace and incorporate new technology into their operations. Technologies that impact nutrient management, include, but are not limited to, low-pressure manure application systems, manure nutrient concentration systems, manure digesters with off-farm feed stocks, and robotic milking equipment. When these technologies are incorporated, it requires the CAFO permit registrant’s AWMP to be revised to reflect these changes and additions. Staff must review these AWMP updates to ensure that the technology is accurately represented and integrated into waste system calculations. Substantial changes to AWMPs, as defined in the permits have public notice and participation requirements.