confirmatory factoral validity of public housing ... · confirmatory factoral validity of public...
TRANSCRIPT
Page 1 of 17
MANAGEMENT | RESEARCH ARTICLE
Confirmatory factoral validity of public housing satisfaction constructsBala Ishiyaku, Rozilah Kasim and Adamu Isa Harir
Cogent Business & Management (2017), 4: 1359458

Ishiyaku et al., Cogent Business & Management (2017), 4: 1359458https://doi.org/10.1080/23311975.2017.1359458
MANAGEMENT | RESEARCH ARTICLE
Confirmatory factoral validity of public housing satisfaction constructsBala Ishiyaku1*, Rozilah Kasim2 and Adamu Isa Harir3
Abstract: Validation of housing satisfaction constructs using different perspec-tives is necessary with increasing relevance of Modelling in post occupancy evalu-ation (POE). This paper used building components theory to identify tangible and intangible building features and assess the factorial validity of the constructs, with the intention to create substantial and reliable measurement models which can efficiently measure occupants’ satisfaction constructs in public housing evalua-tion. A total of 300 questionnaires were administered in Gombe metropolis, Nigeria. Some 246 were collected, and 212 were used for final analysis after data screening. Tangible and intangible building satisfaction constructs were produced as inde-pendent latent constructs while building component satisfaction as the dependent latent construct. The validity of the constructs was confirmed by AMOS software. Results demonstrated the factorability of occupants’ satisfaction using building components, tangible and intangible features, and provided a standard for a holistic understanding of building satisfaction components. Hence, this supports the use of building component theory in POE studies. Future studies can identify the relation-ship between dependent and independent building satisfaction construct. Findings are useful for performance evaluation in public housing studies, Users’ satisfaction analyses and formulation of policies to achieve public housing satisfaction.
*Corresponding author: Bala Ishiyaku, Faculty of Environmental Technology, Department of Estate Management, Abubakar Tafawa Balewa University, Bauchi, NigeriaE-mail: [email protected]
Reviewing editor:Elena Kostadinova, University of National and World Economy, Bulgaria
Additional information is available at the end of the article
ABOUT THE AUTHORSBala Ishiyaku obtained his PhD in Real Estate and Facilities Management from University Tun Hussein Onn Malaysia. He bagged his MTech and BTech in Estate Management from Federal University of Technology Minna and Abubakar Tafawa Balewa University Bauchi, Nigeria, respectively. He is a lecturer with Department of Estate Management and Valuation, Abubakar Tafawa Balewa University Bauchi, Nigeria.
Rozila Kasim received her PhD in Property and Facilities Management from Salford University, UK and masters’ degree from University Technology Malaysia. She obtained her bachelor’s degree from the University of East London. She is an associate professor with University Tun Hussein Onn Malaysia.
Adamu Harir Isa holds a Bachelor of Science in Geography from the University of Jos and master’s degree in Urban and Regional Planning from Ahmadu Bello University Zaria, Nigeria. He is a PhD fellow in Real Estate and Facilities Management of University Tun Hussein Onn Malaysia and a senior lecturer with Abubakar Tafawa Balewa University, Bauchi, Nigeria.
PUBLIC INTEREST STATEMENTPublic housing satisfaction evaluation has been a subject of research in recent time, due to public concern about effectiveness of public housing programmes. As such, agitation for use of second-generation methods of analyses such as structural equation modelling in public housing satisfaction evaluation is high, with several scholars proposing for it. The limitation to this agitation is inadequacy or unavailability of valid building satisfaction tools (constructs) that can show the causal relationship between the building features as factors. This study bridge the gap by confirming the validity of the public housing satisfaction constructs. It opens the gate for future studies that can develop public housing satisfaction models and prove the relationship between building features satisfaction. The uniqueness of this study is in use of building components theory to validate satisfaction constructs based on independent (tangibles/intangibles) and dependent (components) variables. This informs the possibility of grouping building features satisfaction for effective assessment.
Received: 21 November 2016Accepted: 17 July 2017First Published: 26 July 2017
© 2017 The Author(s). This open access article is distributed under a Creative Commons Attribution (CC-BY) 4.0 license.
Page 2 of 17
Bala Ishiyaku
Page 3 of 17
Ishiyaku et al., Cogent Business & Management (2017), 4: 1359458https://doi.org/10.1080/23311975.2017.1359458
Subjects: Facilities Management; Built Environment; Property; Estate and Facilities Management
Keywords: housing satisfaction; public housing; housing performance evaluation; confirmatory factor analysis; post-occupancy evaluation
1. IntroductionPublic housing programmes are designed for the satisfaction of the housing users. Apparicio and Seguin (2006) pointed out that evaluation of such developments is derived from the need to assess the level of acceptability of social amenities and how it affects occupants’ quality of life. Hanson, Lloyd, and Lorimer (2004) highlighted the necessity for public housing evaluation to generate data that can explain the different policies supporting public housing and assess their performance in use. In particular, Sengupta and Tipple (2007) proposed utilisation of public housing evaluation to produce parameters for assessing efforts of governments towards housing provision. Studies in the area of public housing are limited, as a result of that negligible consideration is given to differences in houses and that influences on satisfaction (Djebarni & Al-Abed, 2000). It was also pointed out by Bordass and Leaman (2005) that even though such studies provide information that is necessary for future use, attention is given to design aspects by the evaluation scholars.
The terms building satisfaction, building performance and Post Occupancy Evaluation (POE) are terms used to describe building evaluation methods which over time have developed to include not only the physical and environmental attributes of housing developments, but also psychological, sociological, economic and cultural attributes of the occupants. Performance and satisfaction sur-veys were carried out to collect feedback on residents’ views about certain features such as physical characteristics of properties, environmental features available and socio-economic impacts of the house (Sinou & Kyvelou, 2006). However, POE is a general term referring to the evaluation of the performance of buildings after occupation, with a sole objective of assessing the results of contact between houses and users in order to suggest improvements (Nawawi & Khalil, 2008). POE utilises human conduct to assess physical, natural and administrative factors that impact the performance of houses (Wheeler, Boughlagem, & Malekzadeh, 2011). Therefore, housing performance evaluation is step-by-step turning into an obligatory and vital activity from design stage of the housing life cycle as observed by Fernández-Solís et al. (2011) and Wheeler et al. (2011) to its final stage of manage-ment, to encourage sustainability in policies related to public housing developments. Ozturk, Arayici, and Coates (2012, p. 2) observed that “if we fail to adequately learn by evaluating our existing build-ing stock effectively, then we fail to avoid avoidable mistakes”.
Awareness of satisfaction models and theories is important to the understanding of the validity of satisfaction measurement models. Consequently, an appraisal of the theoretical underpinning of satisfaction was performed to emphasise their importance to housing satisfaction evaluation. These comprise Building component theory, Attitude–Behaviour theory, Expectations–Disconfirmation theory, Perceived Performance theory, Norms in the concept of satisfaction, Multiple Process Theory, Equity theory, Affective Theory and Complexity Theory as in Ishiyaku, Kasim, and Harir (2016). The building component theory by Ishiyaku (2016) opined that satisfaction with a housing unit com-prises tangible and intangible features’ satisfaction, which serve as independent factors to building components’ satisfaction. The Expectations–Disconfirmation theory contended that expectations play a passive role in satisfaction decision (Hom, 2000). This paradigm opined that consumers are believed to have expectations before purchasing a product and after using the product, consumer can then determine whether the performance of the product is above, equal or below his expecta-tions. Churchill and Suprenant (1982) and Erevelles and Leavitt (1992) proposed broadening of Expectations–Disconfirmation theory by including direct effects of perceived performance. They ar-gued that satisfaction with durable products is different from satisfaction with non-durable ones. Therefore, they suggested Perceived Performance theory. Pre-experience standards and norms were cited as possible means of comparison (LaTour & Peat, 1979) to attain satisfaction in Norms theory of satisfaction. This suggests that there are different grounds for comparison to attain satisfaction
Page 4 of 17
Ishiyaku et al., Cogent Business & Management (2017), 4: 1359458https://doi.org/10.1080/23311975.2017.1359458
other than expectations. Therefore, the theory suggested that besides expectations, other values are taken into consideration to arrive at satisfaction judgment.
Multiple Process theory cited satisfaction formation as multi-dimensional and requires more than one standard comparison (Hom, 2000). Other authors like Oliver and DeSarbo (1988) and Cadotte, Woodruff, and Jenkins (1987) have observed the interaction between different variables in measur-ing satisfaction. Equity theory put forward the view that inputs used in acquiring product and output received by the consumer should be fairly comparable. This refers to consumers’ feeling of being equitably treated based on the efforts, cost and expenses incurred and benefits derived after con-sumption (Oliver & DeSarbo, 1988; Oliver & Swan, 1989). Equity theory provides an opportunity for modelling satisfaction in consideration of other factors that are not directly related to satisfaction construct. Affective theory viewed that factors like emotion, liking and mood appear to influence satisfaction or otherwise (Hom, 2000). Rainer and Harrison (1993) argued that satisfaction con-structs are multiple-act constructs that comprise satisfaction with different related activities based on Complexity Theory.
The complexity of satisfaction construct was identified by scholars long ago. Vroom (1964) cited that satisfaction is made up of at least two partially independent sub-components. Erevelles and Leavitt (1992) concluded that satisfaction constructs are very complex and there is a need for more studies to further give a thorough understanding of variables and factors that influence it. A work by Melone (1990) suggested determination of satisfaction construct based on Attitude–Behaviour the-ory. This theory opined that attitude is a product of belief, from which the behavioural intentions will develop. It is the intention that influences the behavioural experience which in turn determines satisfaction (Harrison & Rainer, 1996). This theoretical review indicated the complicated character-istics of satisfaction as a construct, especially in relation to housing.
In the same views, this study considered occupants’ satisfaction with the building as a multi-di-mensional construct, both in scope and content, as in Rainer and Harrison (1993). A building, unlike other commodities, was considered as a product of features and components (Frontczak et al., 2012; Underwood & Isikdag, 2009). Hence, Frontczak et al. (2012) opined that houses comprise two broad classifications of features. These are building components and building features. Going by studies of Santos (2002), Green and Ryan (2005), Allee (2008) and Alsaqre (2011), building features were sub-divided into tangible (such as a floor, lighting facilities) and intangible features (such as privacy, ventilation). This was conceptualised and modelled into building tangible, intangible and compo-nents in Ishiyaku, Kasim, Harir, and Sabo (2016). This grouping was supported by literature as dis-cussed above. However, Frontczak et al. (2012) pointed that “building components are parts of a building”. They stressed that the term component may equally be applied as part of the grouping of building elements which range from building materials through parts, components, (sub) systems to entire buildings. As different names were given to features that make up the tangible and intangible factors in literature (Gopikrishnan & Topkar, 2015), inappropriate use of features in place of compo-nents and vice versa was elaborated by Frontczak et al. (2012). Tangible factors in Gann, Salter, and Whyte (2003) and Frontczak et al. (2012) were called physical factors in Amole (2009) and Leaman, Stevenson, and Bordass (2010). These comprise features such as floor, ceiling, doors and windows, etc. Intangible factors in Gann et al. (2003) were also called social factors in Amole (2009). These comprise features like design, lighting, ventilation and privacy.
As such, this study serves as litmus test, to validate building satisfaction construct, as done in its twin study for building performance constructs based on occupants’ experience in Ishiyaku, Kasim and Harir (2016). Hence, the objectives of this study are to develop measurement models for build-ing satisfaction evaluation based on tangible, intangible and building components and to assess the factorial validity of the constructs, with intention to create acceptable and reliable measurement models which can efficiently measure occupants’ satisfaction constructs. This can encourage para-digm shift in housing satisfaction evaluation to modelling dependent and independent building fea-tures for effective facilities planning and management.
Page 5 of 17
Ishiyaku et al., Cogent Business & Management (2017), 4: 1359458https://doi.org/10.1080/23311975.2017.1359458
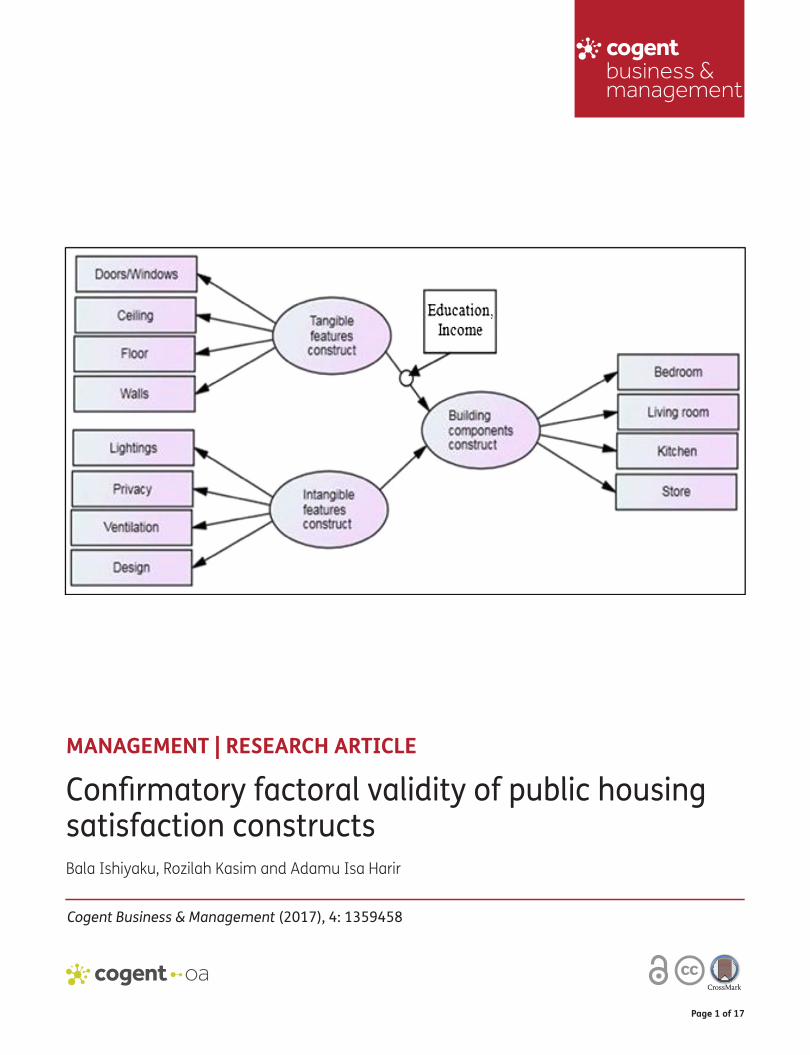
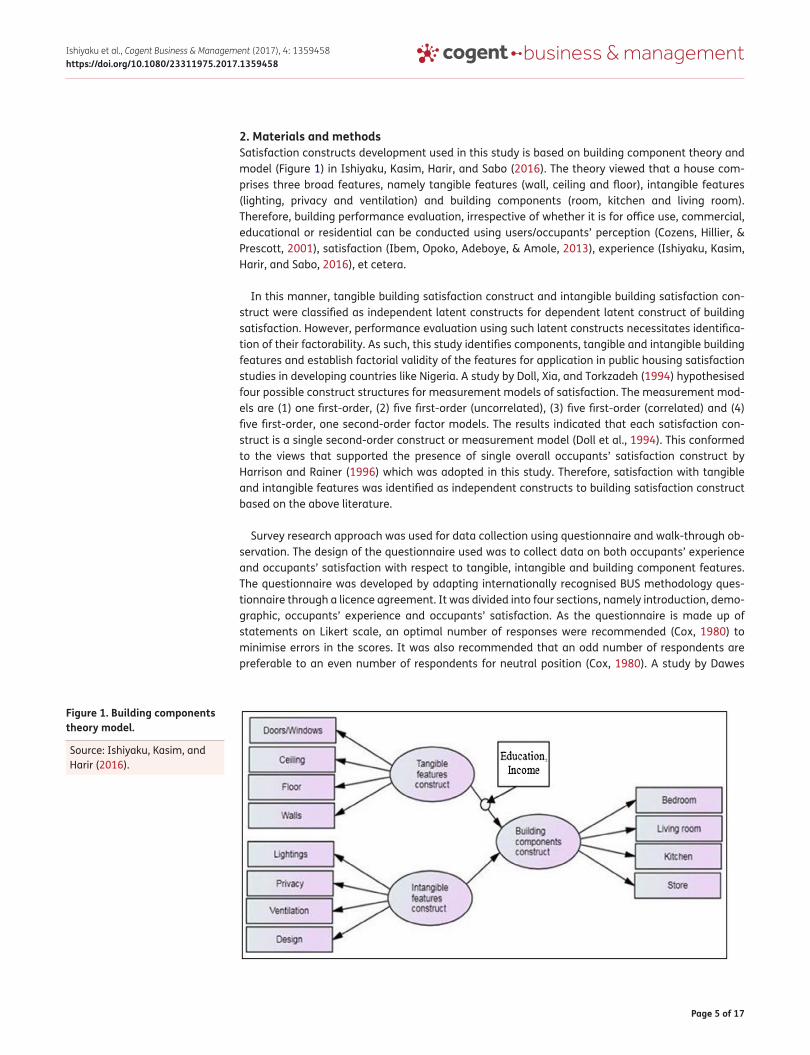
2. Materials and methodsSatisfaction constructs development used in this study is based on building component theory and model (Figure 1) in Ishiyaku, Kasim, Harir, and Sabo (2016). The theory viewed that a house com-prises three broad features, namely tangible features (wall, ceiling and floor), intangible features (lighting, privacy and ventilation) and building components (room, kitchen and living room). Therefore, building performance evaluation, irrespective of whether it is for office use, commercial, educational or residential can be conducted using users/occupants’ perception (Cozens, Hillier, & Prescott, 2001), satisfaction (Ibem, Opoko, Adeboye, & Amole, 2013), experience (Ishiyaku, Kasim, Harir, and Sabo, 2016), et cetera.
In this manner, tangible building satisfaction construct and intangible building satisfaction con-struct were classified as independent latent constructs for dependent latent construct of building satisfaction. However, performance evaluation using such latent constructs necessitates identifica-tion of their factorability. As such, this study identifies components, tangible and intangible building features and establish factorial validity of the features for application in public housing satisfaction studies in developing countries like Nigeria. A study by Doll, Xia, and Torkzadeh (1994) hypothesised four possible construct structures for measurement models of satisfaction. The measurement mod-els are (1) one first-order, (2) five first-order (uncorrelated), (3) five first-order (correlated) and (4) five first-order, one second-order factor models. The results indicated that each satisfaction con-struct is a single second-order construct or measurement model (Doll et al., 1994). This conformed to the views that supported the presence of single overall occupants’ satisfaction construct by Harrison and Rainer (1996) which was adopted in this study. Therefore, satisfaction with tangible and intangible features was identified as independent constructs to building satisfaction construct based on the above literature.
Survey research approach was used for data collection using questionnaire and walk-through ob-servation. The design of the questionnaire used was to collect data on both occupants’ experience and occupants’ satisfaction with respect to tangible, intangible and building component features. The questionnaire was developed by adapting internationally recognised BUS methodology ques-tionnaire through a licence agreement. It was divided into four sections, namely introduction, demo-graphic, occupants’ experience and occupants’ satisfaction. As the questionnaire is made up of statements on Likert scale, an optimal number of responses were recommended (Cox, 1980) to minimise errors in the scores. It was also recommended that an odd number of respondents are preferable to an even number of respondents for neutral position (Cox, 1980). A study by Dawes
Figure 1. Building components theory model.
Source: Ishiyaku, Kasim, and Harir (2016).

Page 6 of 17
Ishiyaku et al., Cogent Business & Management (2017), 4: 1359458https://doi.org/10.1080/23311975.2017.1359458
(2008) suggested that none of 5-, 7- and 10-point Likert scales available in literature is less desirable for regression, CFA and SEM. However, seven-point Likert scale was chosen because it is an odd number and it gives more response to avoid concentration on midpoint (neutral) position and to agree with the BUS Methodology questionnaire adapted for this study. An equal interval scale point description was used as suggested by Myers and Warner (1968) and Braunsberger and Gates (2009).
Going by the recommended satisfaction and performance descriptors in Braunsberger and Gates (2009), Seshadhri and Topkar (2014), and the BUS methodology questionnaire adapted, the descrip-tors used in the questionnaire for gauging satisfaction are Highly Satisfied, Very Satisfied, Satisfied, Neutral, Dissatisfied, Very Dissatisfied and Highly Dissatisfied. The descriptors used for performance (experience) are Excellent, Very Good, Good, Neutral, Bad, Very Bad and Extremely Bad and Defect Free, Highly Not Defective, Not Defective, Neutral, Defective, Highly Defective, and Totally Defective. Even though a target range of 10–15 minutes’ time for completing the questionnaire was employed to avoid boredom and fatigue (Lindell & Whitney, 2001), adequacy of attributes and responses were not compromised. Instead, adequate sample size and involvement of staff in Gombe State Investment and Property Development Company Ltd (GSIPDC) were employed as recommended by Seshadhri and Topkar (2014). The instrument was pre-tested using discussing with professional col-leagues (Fowler, 2008). It was also reviewed by experts in field of facilities management to establish appropriateness of questionnaire items and revise in terms of simplicity and eligibility. Questionnaire pre-testing is important to guarantee the respondents understanding of the questionnaire. Inputs from the pre-tests were used to enrich the questions before pilot survey. A pilot study was carried out before field survey. This was to collect input from occupants on the questionnaire for improve-ment. The pilot survey questionnaire contained a letter detailing the study aim, promise on anonym-ity of respondent, approximate time for completing the survey, and proposed modifications and improvements if any. Outcomes of pilot survey demonstrated assured response regarding organisa-tion and presentation of the questions. However, to enhance face validity, it was refined as recom-mended in the pilot survey outcomes.
Walk-through observation strategy includes performing a walk-through examination of the hous-es domain in study area to evaluate their current conditions, as reported in Ishiyaku, Kasim and Harir (2016). This is to ascertain the physical conditions of the housing facilities and identify obvious dura-bility and quality issues from the evaluators’ perspective. Some targeted occupants were notified in advance of the visit through the GSIPDC site-office. The exercise was carried out together with two technical staffs of the GSIPDC for introduction. A checklist was used for recording the observations. It contained information on aesthetic condition, physical quality (durability), sizes in proportion to the contents and negative activities observed at the housing estates. Such information was collect-ed on the building components (living rooms, circulation space, bedrooms, toilets/baths, garage, store, dining and kitchen), tangible building features (doors/windows, ceiling, floor, walls, roof, bur-glar proof, nets on window, doors/windows, ceiling, safety equipment, perimeter fence, water facili-ties, cooling facilities, disable facilities, and energy saving facilities) and intangible building features (house design, internal appearance, external appearance, privacy, ventilation, lighting generally, natural/sun flare and artificial light). Therefore, the strength of the survey approach for this study is identified from the research questions used and the degree of focus on contemporary as against historical event (Yin, 2003).
Four housing estates were certified to have met the criteria of been public housing; constructed by government parastatals for civic use. The four housing estates are Shongo Housing Estate A, Shongo Housing Estate B, Idrisa Housing Estate, Kwami Housing Estate and Tumfure Housing Estate. A total number of 300 questionnaires were administered as suggested by Barlett, Kotrlik, and Higgins (2001) for sample size of about 1,000 houses. Estate housing units were normally clustered in nature by virtue of being located in heterogeneous units of two-bedroom and three-bedroom units called housing estates. The houses are prototype semi-detached flats, designed in multiple blocks. The
Page 7 of 17
Ishiyaku et al., Cogent Business & Management (2017), 4: 1359458https://doi.org/10.1080/23311975.2017.1359458
flats were numbered serially in the housing estates, with the numbering in some cases continuing in another housing estate. The systematic sampling method was used in selecting houses to collect the response. The houses were selected systematically using their serial numbers in the estates. The housing flats with odd serial numbers (2, 4, 6 … 100) were chosen from the housing estates for the pilot survey, while third numbers each was chosen from the estates’ serial numbers (3, 6, 9 … 300) for the field survey. As the sampling frame covered the vast majority of public houses in the study region, sample data were expected to represent the population data. The administrative and techni-cal staffs of GSIPDC (which are the developers and the property’s administrative managers) were fully involved in the administration of the questionnaire. This was to achieve high response rates, guarantee accuracy of the sampling, ensure completeness of the data and simplify the follow-up stage. There were no data collected from other local government areas of the state, despite the fact that there are some public houses there. This is because the houses were too small in number and the houses were assigned to the respective local government councils. Therefore, the demographic data collected were from the representative sample, typical of the occupants in public houses in Gombe metropolis and Gombe state.
A total of 246 were retrieved (82%). The high response rate was realised because of the inclusion of administrative and technical staff of GSIPDC in the questionnaire administration processes. A to-tal of 32 were discarded due to incomplete response and missing data. Some two others were ex-cluded as outliers. Therefore, 212 (about 71%) were used for the analysis. The Statistical Package for Social Science (SPSS) software was utilised in preparatory investigations. Following data inspection, characteristics of occupants were assessed by percentages. Normality of data was examined by descriptive analysis of skewness and kurtosis. Exploratory factor analysis (EFA) was employed to determine unidimensionality of the data. Unidimensionality was measured by ensuring that all measuring items have acceptable factor loadings. It was assessed to ascertain essential data pat-tern of every construct on the grounds that there is a deficiency of studies in that area (Anderson & Gerbing, 1988; Harrison & Rainer, 1996). Factors with lower loadings were excluded. The confirma-tory factor analysis (CFA) was carried out using AMOS software version 21. Convergent validity was tested for all measurement models using average variance extracted (AVE) for every construct, which ≥0.5 was recommended (Awang, 2014). Modification Indices (MI) was used to identify the discriminant validity of the constructs. It was done by certifying that all measurement models are free from redundant variables wherever it existed; free parameter estimates were added to the measurement models to resolve the redundancy. It was also ascertained that no correlations among exogenous constructs are greater than 0.85 as recommended in Awang (2014). Construct validity was measured using parsimonious fit, incremental fit and absolute fit. Even though chi-square (χ2) was recognised as a common indicator of an overall absolute fitness (Bollen, 1989), it was faulted for being responsive to large sample size like 200 (Hair, Anderson, Tatham, & Black, 1995). Therefore, as sample collected for this study is above 200, chi-square was ignored in this paper, as in Ishiyaku, Kasim, and Harir (2016). Instead, the Goodness-of-Fit Index (GFI) that was put forward in Jöreskog and Sörbom (1981) which assesses relative extent of variance and covariance together explained by the measurement model (Byrne, 1995) and root-mean-square error of approximation (RMSEA) was used to measure the absolute fitness. Normed fit index (NFI), Tucker–Lewis Index (TLI), comparative fit index (CFI) and adjusted goodness-of-fit index (AGFI) were further employed to as-sess incremental fit of each measurement model, which indicates the level of model fit in relation to null model. The Chi-square (χ2/df) was level for each of the fitness index used is presented in Table 1, with their respective sources.

Page 8 of 17
Ishiyaku et al., Cogent Business & Management (2017), 4: 1359458https://doi.org/10.1080/23311975.2017.1359458
3. Results and discussion
3.1. Respondents’ characteristicsCharacteristic profile of occupants’ results showed that 85% of the occupants were males and 15% were females. A total of 41% of them stayed mostly at home while about 59% did not stay mostly at home. Low-income earners; those earning less than N100,000) constituted almost 67% of occu-pants, while about 33% are the high-income group (earning more than N100,000).
3.2. Results for descriptive analysesAfter imputation of missing data using variable means as suggested by Coakes (2006), data were examined to ascertain the normality of its distribution by Skewness and kurtosis as a condition for factor analysis (Hair et al., 1995; Tabachnick & Fidell, 2001). Even though a sample size of more than 200 may not be easily influenced (Tabachnick & Fidell, 2001) and data in practice are in most cases not normally distributed (Micceri, 1989), it was carried out to ascertain. It was recommended by George and Mallery (2010) that the acceptable values for normal univariate distribution are within ±2. Results in Table 2 shows that every one of the qualities is within that interval. Hence, the result which shows the direction of variation of the data-set indicates that the variables frequencies were acceptably distributed. This means that there is acceptably normal distribution of the occupants’ responses among the alternative options in the questionnaire.
3.3. Results for EFAEFA was performed to ascertain unidimensionality of constructs before carrying out the CFA. Table 3 presents the results of unrotated factor assessment, which indicated large and significant (p < 0.01) values for Bartlett test of sphericity for all the factors, with values ranging between 153.407 (IBSC) and 708.586 (TBSC). These results indicated that the study sample is from population with equal variances. This means all correlations that are available within the correlation matrix have an overall significance level. The significant value of this analysis leads us to presume that there are enough relationships in study data-set that are suitable for factor analysis (Ishiyaku, Kasim, & Harir, 2016). Hence, this analysis meets that prerequisite, that there is sampling adequacy. In the same vein, all the Kaiser–Meyer–Olkin (KMO) measures of sampling adequacy are greater than 0.50, indicating factorability of the correlation matrix of the constructs. Since the KMO measure of sampling adequa-cy meets the minimum criteria, there is no problem that requires the examination of Anti-Image correlation matrix. Analyses of total variance explained by each construct were carried out, which showed values that range from 52 to 70%; indicating acceptable results. These explained the
Table 1. Index category and levels of acceptanceCategory of fit Index name Acceptance level Comments SourceAbsolute fit Chi-square (Chisq) p > 0.05 Sensitive to sample size >200 Wheaton et al. (1977)
Root-mean-square error of approximation (RMSEA)
RMSEA < 0.08 Range 0.05–0.1 is acceptable Browne and Cudeck (1993)
Goodness-of-fit index (GFI) GFI ≥ 0.80 Value greater than 0.80 suggests a good fit
Forza and Filippini (1998), Greenspoon and Saklofske (1998)
Incremental fit Adjusted goodness-of-fit index (AGFI)
AGFI ≥ 0.80 Value greater than 0.80 suggests a good fit
Forza and Filippini (1998)
Comparative fit index (CFI) CFI > 0.90 Value greater than 0.90 suggests an acceptable fit
Byrne (1995), Hair et al. (2010)
Tucker–Lewis index (TLI) TLI > 0.90 Value greater than 0.90 suggests a good fit
Vandenberg and Scarpello (1994)
Normed fit index (NFI) NFI ≥ 0.80 Value greater than 0.80 suggests a good fit
Forza and Filippini (1998)
Parsimonious fit Chi-square difference (χ2/df) Chi square/df < 5.0 The value should be less than 5.0
Marsh and Hocevar (1985)

Page 9 of 17
Ishiyaku et al., Cogent Business & Management (2017), 4: 1359458https://doi.org/10.1080/23311975.2017.1359458
proportion to which constructs account for the variation (dispersion) of the given data-set. Hence, the values reported are the summation of rates for explained variance to every component that was retained, i.e. the total percentage for explained variance. The items’ total correlations were also above 0.03 (Flynn, Schroeder, Flynn, Sakakibara, & Bates, 1997; Nunnally & Bernstein, 1994) which ascertained that each variable or item in the constructs tested is consistent with the averaged be-haviour of the others except in IBS4. The Alpha was 0.677 due to the low correlation by IBS4 with the value of 0.278. Hence, the variable was excluded to improve the Cronbach’s Alpha to 0.726.
3.4. Measurement models’ reliability and validityReliability and validity of reflective measurement models were analysed. The process entails evalu-ation of indicator reliability, internal consistency reliability, discriminant validity and convergent va-lidity. Composite Reliability (CR) and Cronbach alpha presented by Table 4 were both utilised to measure internal consistency and indicator reliability of the reflective constructs, as suggested by Flynn et al. (1997) and Nunnally and Bernstein (1994). The CR appraises the degree to which a set of individual variables in a particular construct offer in their estimation of a construct. Recommended value of CR is 0.6 and above, which the constructs here achieved (Fornell & Larcker, 1981; Hair, Black, Babin, & Anderson, 2010; Henseler, Ringle, & Sinkovics, 2009). This means that the overall reliability of the variables which are heterogeneous but similar items under each construct was achieved. Even though some scholars (Hair et al., 2010; Henseler et al., 2009; Tabachnick & Fidell, 2001) recom-mended factor loadings in ranges of 0.5 and 0.7, acceptable item reliability is attained if factor load-ings values are ≥0.4, with sample ≥200 (Hair et al., 2010). Therefore, the result indicated that there is a mutual relationship or connection between each indicator with the composite (construct factor). Table 4 presented the result of the manifest items’ factor loadings which all achieved factor loading
Table 2. Building satisfaction constructs normality testConstructs Variable codes Variable names Mean Skewness KurtosisTangible building satisfaction construct (TBSC)
TBS3 Burglar proof 4.09 0.502 −0.434
TBS4 Nets on window 4.14 0.208 −0.396
TBS5 Doors/windows 3.62 0.380 0.178
TBS6 Ceiling 3.81 0.765 0.389
TBS7 Floor 3.83 0.734 0.204
TBS8 Water facilities 4.41 0.393 −0.647
TBS9 Cooling facilities 4.11 0.307 −0.168
TBS10 Heating facilities 4.14 0.275 −0.210
TBS12 Walls 3.75 0.817 0.725
Intangible building satisfaction construct (IBSC)
IBS1 Lighting general 3.71 0.456 0.260
IBS2 Sun light 3.53 0.669 1.035
IBS3 Artificial lighting 3.54 0.407 1.160
IBS4 Privacy 3.40 0.661 0.982
Building satisfaction construct (BSC)
BS1 Rooms size 3.73 0.032 0.038
BS2 Living room 3.60 0.655 1.016
BS3 Roof 3.84 0.794 0.555
BS4 Number of rooms 3.53 0.229 0.071
BS6 Kitchen 3.47 0.796 1.105
BS7 Store 3.88 0.644 0.859
BS8 Garage 4.58 0.198 −1.101
BS9 Dining space 3.80 0.814 0.098
Overall values BS10 Overall IBS 3.34 0.497 1.117
BS11 Overall TBS 4.02 0.648 0.876

Page 10 of 17
Ishiyaku et al., Cogent Business & Management (2017), 4: 1359458https://doi.org/10.1080/23311975.2017.1359458
above >0.4. AVE was used to assess the convergent validity. It determines the level of which a group of variables stands for one and the same construct. Hair et al. (2010) recommended a value of ≥0.5, which was achieved as shown in Table 4. Dillon and Goldstein (1984) cited that AVE above 0.50 shows that both construct and individual variables have high validity. Hence, the latent constructs were explained by their observed variables.
3.5. Evaluating the fitness of the measurement modelsThe good fit indices implied that measurement model achieved acceptable model fit according to normal practice (Ishiyaku, Kasim, & Harir, 2016). There is no specification on which among fitness indexes or how many can be presented between model fit group of parsimonious fit, incremental fit and absolute fit presented in Table 1. Anderson and Gerbing (1988) suggested that one might use one or more overall indices. Kline (1998) in contrast recommended presentation of at least four in-dices. Even though Chisq was recognised as a traditional indicator in constructing an overall abso-lute fitness (Bollen, 1989), scholars criticised it due to its sensitivity to sample size more than 200 (Hair et al., 1995).
3.6. CFA for measurement modelsEven though the GFI and CFI achieved an acceptance level (GFI = 0.929, CFI = 0.926) in Tangible Building Satisfaction Construct (TBSC) Measurement model (Figure 2), the model show inadequate model fit, in respect to some other conventional fit indices. Standardised Root-Mean-Square Residual
Table 3. EFA results for all the building satisfaction research constructs
***p < 0.001.
Constructs Variables Item-total correlation
Kaiser–Meyer–
Olkin (KMO)
Bartlett’s test of
sphericity
Total variance
explained
Cronbach’s alpha
TBSC TBS3 0.325 0.787 708.586*** 70.169 0.815
TBS4 0.586
TBS5 0.488
TBS6 0.630
TBS7 0.611
TBS8 0.426
TBS9 0.501
TBS10 0.546
TBS12 0.499
IBSC IBS1 0.538 0.688 153.407*** 51.632 0.726
IBS2 0.628
IBS3 0.481
IBS4 0.278
BSC BS1 0.476 0.790 474.915*** 56.198 0.782
BS2 0.538
BS3 0.448
BS4 0.485
BS6 0.388
BS7 0.357
BS8 0.306
BS9 0.394
BS10 0.434
BS11 0.639

Page 11 of 17
Ishiyaku et al., Cogent Business & Management (2017), 4: 1359458https://doi.org/10.1080/23311975.2017.1359458
Figure 2. Tangible building satisfaction construct.
Figure 3. Reviewed tangible building satisfaction construct.
Table 4. Satisfaction constructs’ reliability and validityConstruct Items Factor loadings Cronbach’s alpha CR AVETBSC TBS3 0.869 0.815 0.943 0.651
TBS4 0.780
TBS5 0.675
TBS6 0.841
TBS7 0.828
TBS8 0.746
TBS9 0.841
TBS10 0.889
TBS12 0.769
IBSC IBS1 0.798 0.726 0.829 0.619
IBS2 0.833
IBS3 0.725
BSC BS1 0.766 0.782 0.905 0.613
BS2 0.730
BS3 0.804
BS4 0.762
BS6 0.817
BS11 0.814

Page 12 of 17
Ishiyaku et al., Cogent Business & Management (2017), 4: 1359458https://doi.org/10.1080/23311975.2017.1359458
was above 0.08 (RMSR = 0. 108). The AGFI = 0.866 and TLI = 0.891 were a little above rejection levels and the ChiSq difference was 3.491, which is acceptable. Low factor loading was observed in TBS8, while MI showed the redundancy issue between TBS5 and TBS6. Therefore, the model needs im-provement to correct the shortcomings; hence a second iteration was carried out.
The variable (TBS8) with low factor loading was removed and the covariance was inserted be-tween TBS5 and TBS6. Results of the second iteration (Figure 3) indicated that the RMSEA improved to 0.069, GFI = 0.969, AGFI = 0. 927, CFI = 0.980, TLI = 0. 965, NFI = 0. 962, and χ2 df improved to 2.005. This shows that all the mandatory indicators of reliability were obtained and the priori model fits the sample data.
The GFI for the Building Satisfaction Construct (BSC) in Figure 4 is at an acceptable level of 0.995. The recommended fit was also obtained in AGFI = 0.945, CFI = 0.991, TLI = 0.943, NFI = 0.984, RMSEA = 0.079 and χ2 df = 2.326. It shows how well the Building Satisfaction Construct (BSC) is rep-resented by the observed measures.
The IBSC construct has three variables indicating good factor loadings of > 0.5 (Figure 5). Literature indicated that scholars were of the opinion that at least three variables can be used in measuring
Figure 4. Building satisfaction construct.
Figure 5. Intangible building satisfaction construct.
Figure 6. Multiple regressions for building satisfaction constructs.

Page 13 of 17
Ishiyaku et al., Cogent Business & Management (2017), 4: 1359458https://doi.org/10.1080/23311975.2017.1359458
one factor (Aigbavboa & Thwala, 2013). However, the individual model fitness cannot be indicated due to insufficient variables. Hence, this necessitates the use of Pooled Measurement Model (PMM).
PMM was carried out (Figure 6) to assess the fitness indexes, factor loadings of each item with its R2 and correlations between the constructs (TBSC, BSC, and IBSC) computed simultaneously. Even though TBSC and BSC have two components each, they were correlated together. The result indi-cated that the pooled model has achieved unidimensionality with all the factor loadings ≥0.5. The construct validity was achieved as all the models’ fitness indexes achieved the recommended levels. In addition, discriminant validity was also achieved as all redundant items were excluded and the correlation between the exogenous constructs is lower than 0.85.
In summary, the EFA and CFA analyses were performed to examine the underlying structure in building features’ satisfaction. This was to confirm the validity and reliability indices of grouping them as occupants’ satisfaction constructs. Therefore, the results support the view that the various building features contained as items in each of the factors (IBSC and TBSC) and the building compo-nent (BSC) have the same characteristics. Accordingly, the constructs evaluated based on occu-pants’ satisfaction representing them were effectively measuring the same factor groupings. Hence, the data confirmed the existence of one latent characteristic or trait underlying the items in each factor. The results from the model fit indicated how well the proposed theory and models fit the data as suggested by Hooper, Coughlan, and Mullen (2008). The findings from the walk-through inspec-tion uncovered that the kitchen, bedrooms, toilets/baths, living rooms, dining and store were in de-lightful and appealing state, with satisfactory spaces when compared to the occupants’ contents. Movement space provided seems inadequate when compared to sizes of the houses. There is no garage in most of the houses, they have carports and were mostly adequate. The design of the house is simple, with good interior design and aesthetic external appearance. The remote neigh-bourhood of the estates has given them distinctive seclusion and sufficient ventilation. To improve security and privacy, perimeter fences were built in most of the houses. The building materials used in roofing, doors/windows, ceiling, floor, walls, burglar proof and nets on window were of good qual-ity as reported in Ishiyaku, Kasim, and Harir (2016). However, there are indications of roof licking in some houses and sagging ceilings. The nature of the materials used in fixtures such as water and electrical facilities were of good quality, however, there was no light and water supply when the visit was carried out. It was also observed that no provision was made for energy saving facilities, safety equipment and disable facilities in the houses, apart from those made available by the residents.
Hence, this study was able to develop three housing satisfaction measurement models achieving recommended reliability and validity. The study also pointed that building satisfaction is an outcome of both tangible and intangible features’ satisfaction. The factors extracted in three constructs of Building Satisfaction Construct (BSC), Tangible Building Satisfaction Construct (TBSC) and Intangible Building Satisfaction Construct (IBSC) indicated the most relevant building features that influence housing satisfaction in study area. The EFA for BSC revealed that privacy and ventilation are less important in determining intangible satisfaction. This may be due to the fact that occupants have made some expansions in the houses. Hence, going by their income levels in profile above and their nature of staying in the houses (evenings and weekends), they can afford extra cooling and heating electronics. The availability of mostly over 9 metres wall fencing around the houses provides enough security and privacy in the houses. The EFA for TBSC indicated that satisfaction with factors such as TBS1, TBS2 and TBS11 which are safety facilities, fence and electrical facilities, respectively, have low factor loadings. This is possible because in developing countries, in most cases safety and security facilities were not given adequate attention (Husin, Nawawi, Ismail, & Khalil, 2011; Ibem & Amole, 2011; Laryea & Leiringer, 2012). In most cases, there are no special electrical facilities provided in public housing by the government. It is mostly the conventional lighting and ceiling fans for cooling, which are available everywhere. Therefore, in the BSC construct, only BSC5 (satisfaction with toilet) was removed due to factor loading. The measurement models presented in this paper centred on identifying possible constructs that may be used in structural equation modelling (SEM) evaluation of building satisfaction features based tangible and intangible building satisfaction constructs as
Page 14 of 17
Ishiyaku et al., Cogent Business & Management (2017), 4: 1359458https://doi.org/10.1080/23311975.2017.1359458
independent variables. Therefore, these constructs can be applied in developing SEM causal effect model of building or housing satisfaction. The model can explain the influence of tangible and intan-gible housing features’ satisfaction on overall housing satisfaction as dependent construct (Ishiyaku, Kasim, & Harir, 2016).
In the same scenario, measurement models developed in this study can be used for environmental performance evaluation. Measurement models developed from constructs for environmental perfor-mance evaluation can comprise tangible environmental features like roads and drainages, while intan-gible environmental features include features like safety and noise. As cited by Aigbavboa and Thwala (2013), there is need to carry out CFA using public housing features for low income with a view to con-firm their factorial validity for use in housing satisfaction evaluation models, particularly in developing countries. This is because public houses were developed at low cost and offered on subsidised rates and targeted low-income beneficiaries. Therefore, this study identified the tangible and intangible building features with statistically significant relationship with the building satisfaction. This study also indicated building features which can significantly affect housing satisfaction, hence served as a guide for policy design in respect to future public housing programmes. The basic aim of public housing policies is to ensure that low-income groups have access to housing and related facilities (Hamzah, 1997). These related facilities are subject to interpretation. This study provided a guide for identifying the related fa-cilities needed at every building component level. However, the features that influence building perfor-mance or occupants’ satisfaction with each component of the house may differ. Therefore, this study provides a guide for improving policies on facility specifications to meet the requirements of the people. The study further sheds light on the features to emphasise in the property management, which can relatively better improve occupants’ satisfaction. It provides a guide for a planned maintenance to the occupants and the facilities managers. This can save cost and encourage effective utilisation of re-sources by directing finance to where it is needed most. Academically, the results of this study add to existing knowledge of the relationship between building features and building components. This prompts new direction for further research to measure the relationship between the tangible features, intangible features and the housing components.
4. ConclusionThe study identified nets on window, floor, ceiling, doors/windows, cooling facilities, water facilities, heating facilities and walls as the tangible building features. The building features of general light-ing, sunlight and artificial lighting were identified as intangible building features. However, the other building features of room sizes, living rooms, number of rooms and kitchen are components or com-ponent’s description than a tangible or intangible feature. They were identified as building features or components which are different from other features because of their component characteristics. Accordingly, occupants’ satisfaction with the building features were categorised based on the tangi-bility of the building features to confirm their relationship and factorability. Tangible and intangible building features satisfaction constructs were developed based on building components theory and EFA. The outcomes showed factorability of occupants’ satisfaction as construct and measurement model based on tangible and intangible building features. It suggested a means for understanding housing satisfaction components, accordingly provides meaningful insights into how occupants’ satisfaction with houses can be improved. This can be a milestone achievement in the process of attaining sustainable public housing developments in developing countries.
FundingThis work was supported by TETFUND, ATBU, Nigeria.
Author detailsBala Ishiyaku1
E-mail: [email protected] ID: http://orcid.org/0000-0002-9455-3276Rozilah Kasim2
E-mail: [email protected] Isa Harir3
E-mail: [email protected] Faculty of Environmental Technology, Department of Estate
Management, Abubakar Tafawa Balewa University, Bauchi, Nigeria.
2 Faculty of Technology Management and Business, Department of Real Estate Management, University Tun Hussein Onn Malaysia(UTHM), Parit Raja, Batu Pahat, Johor, Malaysia.
3 Faculty of Environmental Technology, Department of Urban and Regional Planning, Abubakar Tafawa Balewa University, Bauchi, Nigeria.

Page 15 of 17
Ishiyaku et al., Cogent Business & Management (2017), 4: 1359458https://doi.org/10.1080/23311975.2017.1359458
Citation informationCite this article as: Confirmatory factoral validity of public housing satisfaction constructs, Bala Ishiyaku, Rozilah Kasim & Adamu Isa Harir, Cogent Business & Management (2017), 4: 1359458.
Cover imageModel of Building Components theorySource: Ishiyaku, Kasim, and Harir (2016).
ReferencesAigbavboa, C. O., & Thwala, W. D. (2013). The confirmatory
factorial validity of neighborhood features amongst South Africa low-income housing occupants’. Journal of Economics and Behavioral Studies, 5, 825.
Allee, V. (2008). Value network analysis and value conversion of tangible and intangible assets. Journal of Intellectual Capital, 9, 5–24. https://doi.org/10.1108/14691930810845777
Alsaqre, O. Z. E. (2011). Investigating the effects of tangible and intangible factors on customers’ perceived service quality and loyalty in hotel industry in Al-Ladhiqiyah, Syria (a master degree thesis). School of Housing, Planning and Building, Universiti Sains Malaysia, Penang.
Amole, D. (2009). Residential satisfaction in students’ housing. Journal of Environmental Psychology, 29, 76–85. https://doi.org/10.1016/j.jenvp.2008.05.006
Anderson, J. C., & Gerbing, D. W. (1988). Structural equation modeling in practice: A review and recommended two-step approach. Psychological Bulletin, 103, 411. https://doi.org/10.1037/0033-2909.103.3.411
Apparicio, P., & Seguin, A. M. (2006). Measuring the accessibility of services and facilities for residents of public housing in Montreal. Urban Studies, 43, 187–211. https://doi.org/10.1080/00420980500409334
Awang, Z. (2014). A handbook on structural equation modeling for academicians and practitioners. Kuala Lumpur: MPWS rich resources.
Barlett, J. E., Kotrlik, J. W., & Higgins, C. C. (2001). Organizational research: Determining appropriate sample size in survey research. Information Technology, Learning, and Performance Journal, 19, 43.
Bollen, K. A. (1989). Structural equations with latent variables. New York, NY: John Wiley & Sons. https://doi.org/10.1002/9781118619179
Bordass, B., & Leaman, A. (2005). Making feedback and post-occupancy evaluation routine 1: A portfolio of feedback techniques. Building Research & Information, 33, 347–352. https://doi.org/10.1080/09613210500162016
Braunsberger, K., & Gates, R. (2009). Developing inventories for satisfaction and Likert scales in a service environment. Journal of Services Marketing, 23, 219–225. https://doi.org/10.1108/08876040910965557
Browne, M. W., & Cudeck, R. (1993). “Alternative ways of assessing models fit”. In K. A. Bollen & J. S. Long (Eds.), Testing structural equation models. Newbury Park, CA: Sage.
Byrne, B. M. (1995). One application of structural equation modeling from two perspectives: Exploring the EQS and LISREL strategies.
Cadotte, E. R., Woodruff, R. B., & Jenkins, R. L. (1987). Expectations and norms in models of consumer satisfaction. Journal of Marketing Research, 305–314. https://doi.org/10.2307/3151641
Churchill, Jr., G. A., & Surprenant, C. (1982). An investigation into the determinants of customer satisfaction. Journal of Marketing Research, 491–504.
Coakes, S. J. (2006). SPSS: Analysis without anguish: Version 14.0 for Windows. Milton: John Wiley & Sons.
Cox, E. P. III (1980). The optimal number of response alternatives for a scale: A review. Journal of Marketing Research, 17, 407–422.
Cozens, P., Hillier, D., & Prescott, G. (2001). Crime and the design of residential property – exploring the perceptions of planning professionals, burglars and other users. Property Management, 19, 222–248. https://doi.org/10.1108/EUM0000000005784
Dawes, J. G. (2008). Do data characteristics change according to the number of scale points used? An experiment using 5 point, 7 point and 10 point scales. International journal of market research, 51(1).
Dillon, W., & Goldstein, M. (1984). Multivariate analysis: Methods and applications. New York, NY: Wiley.
Djebarni, R., & Al-Abed, A. (2000). Satisfaction level with neighbourhoods in low-income public housing in Yemen. Property Management, 18, 230–242. https://doi.org/10.1108/02637470010348744
Doll, W. J., Xia, W., & Torkzadeh, G. (1994). A confirmatory factor analysis of the end-user computing satisfaction instrument. MIS Quarterly, 18, 453–461. https://doi.org/10.2307/249524
Erevelles, S., & Leavitt, C. (1992). A comparison of current models of consumer satisfaction/dissatisfaction. Journal of Consumer Satisfaction, Dissatisfaction and Complaining Behavior, 5, 104–114.
Fernández-Solís, J. L., Pathak, R., Lavy, S., Beltrán, L. O., Son, K., & Kim, K. (2011). Framework for selecting performance assessment tools for achieving LEED 3.0 credits. Architectural Engineering and Design Management, 7, 236–250. https://doi.org/10.1080/17452007.2011.594577
Flynn, B. B., Schroeder, R. G., Flynn, E. J., Sakakibara, S., & Bates, K. A. (1997). World‐class manufacturing project: Overview and selected results. International Journal of Operations & Production Management, 17, 671–685. https://doi.org/10.1108/01443579710175592
Fornell, C., & Larcker, D. F. (1981). Evaluating structural equation models with unobservable variables and measurement error. Journal of Marketing Research, 18, 39–50. https://doi.org/10.2307/3151312
Forza, C., & Filippini, R. (1998). TQM impact on quality conformance and customer satisfaction: A causal model. International Journal of Production Economics, 55, 1–20.
Fowler, F. J. (2008). Survey research methods (applied social research methods). New York, NY: Sage.
Frontczak, M., Schiavon, S., Goins, J., Arens, E., Zhang, H., & Wargocki, P. (2012). Quantitative relationships between occupant satisfaction and satisfaction aspects of indoor environmental quality and building design. Indoor Air, 22, 119–131. https://doi.org/10.1111/ina.2012.22.issue-2
Gann, D., Salter, A., & Whyte, J. (2003). Design quality indicator as a tool for thinking. Building Research & Information, 31, 318–333. https://doi.org/10.1080/0961321032000107564
George, D., & Mallery, M. (2010). SPSS for windows step by step: A simple guide and reference, 17.0 update (10th ed.). Boston, MA: Pearson.
Gopikrishnan, S., & Topkar, V. M. (2015). Attributes and descriptors for building performance evaluation. HBRC Journal. doi:10.1016/j.hbrcj.2015.08.004
Green, A., & Ryan, J. C. H. (2005). A framework of intangible valuation areas (FIVA). Journal of Intellectual Capital, 6, 43–52. https://doi.org/10.1108/14691930510574654
Greenspoon, P. J., & Saklofske, D. H. (1998). Confirmatory factor analysis of the multidimensional students’ life satisfaction scale. Personality and Individual Differences, 25, 965–971.
Hair Jr., J. F., Black, W. C., Babin, B. J., & Anderson, R. E. (2010). Multivariate data analysis: A global perspective (7th ed.). New Jersey: Pearson Education.
Hair, J. F., Anderson, R. E., Tatham, R. L., & Black, W. C. (1995). Multivariate data analysis with readings (4th ed.). Englewood Cliffs, NJ: Prentice-Hall.
Page 16 of 17
Ishiyaku et al., Cogent Business & Management (2017), 4: 1359458https://doi.org/10.1080/23311975.2017.1359458
Hamzah, M. B. (1997). Housing policy in Malaysia: Conditions, perspectives and Islamic values (Unpublished doctoral dissertation). University of Leeds, Leeds.
Hanson, G., Lloyd, R., & Lorimer, B. (2004). Evaluation of the social housing programme Yukon. Whitehorse: Yukon Housing Corporation.
Harrison, A. W., & Rainer, R. K. (1996). A general measure of user computing satisfaction. Computers in Human Behavior, 12, 79–92. https://doi.org/10.1016/0747-5632(95)00020-8
Henseler, J., Ringle, C. M., & Sinkovics, R. R. (2009). The use of partial least squares path modeling in international marketing. Advances in International Marketing, 20, 277–320.
Hom, W. (2000). An overview of customer satisfaction models. San Rafael, CA: RP Group Proceedings.
Hooper, D., Coughlan, J., & Mullen, M. (2008). Structural equation modelling: Guidelines for determining model fit. Electronic Journal of Business Research Methods, 6, 53–60.
Husin, H. N., Nawawi, a. H., Ismail, F., & Khalil, N. (2011). Development of hierarchy for safety elements and its attributes for Malaysia’s low cost housing. Procedia Engineering, 20, 71–79. https://doi.org/10.1016/j.proeng.2011.11.140
Ibem, E. O., & Amole, O. O. (2011). Assessment of the qualitative adequacy of newly constructed public housing in Ogun State, Nigeria. Property Management, 29, 285–304. https://doi.org/10.1108/02637471111139437
Ibem, E. O., Opoko, A. P., Adeboye, A. B., & Amole, D. (2013). Performance evaluation of residential buildings in public housing estates in Ogun State, Nigeria: Users’ satisfaction perspective. Frontiers of Architectural Research, 2, 178–190. https://doi.org/10.1016/j.foar.2013.02.001
Ishiyaku, B. (2016). Evaluation of Nigerian public housing performance using occupants’ experience and satisfaction (PhD thesis). UTHM Malaysia, Johor.
Ishiyaku, B., Kasim, R., & Harir, A. I. (2016). Confirmatory factoral validity of public housing performance evaluation constructs. Journal of Building Performance, 7(1).
Ishiyaku, B., Kasim, R., Harir, A. I., & Sabo, I. A. (2016). Exploration for the building component theory. Paper presented at International Conference on Trends in Information, Management, Engineering and Sciences (ICTIMESJan’ 2016), Malla Reddy College of Engineering, Hyderabad, India.
Jöreskog, K., & Sörbom, D. (1981). LISERL V: Analysis of linear structural relationships by the method of maximum likelihood. Chicago, IL: National Education Resources.
Kline, R. B. (1998). Principles and practice of structure equation modeling (1st ed.). New York, NY: The Guildford Press.
Laryea, S., & Leiringer, R. (2012). Built environment research in West Africa: Current trends and future directions. Paper presented in 4th West Africa Built Environment Research (WABER) conference proceedings, Abuja, Nigeria, 797–804.
LaTour, S. A., & Peat, N. C. (1979). Conceptual and methodological issues in consumer satisfaction research. Advances in consumer research, 6, 431–437.
Leaman, A., Stevenson, F., & Bordass, B. (2010). Building evaluation: Practice and principles. Building Research & Information, 38, 564–577. https://doi.org/10.1080/09613218.2010.495217
Lindell, M. K., & Whitney, D. J. (2001). Accounting for common method variance in cross-sectional research designs. Journal of Applied Psychology, 86, 114–121. https://doi.org/10.1037/0021-9010.86.1.114
Marsh, H. W., & Hocevar, D. (1985). Application of confirmatory factor analysis to the study of self-concept: First- and higher order factor models and their invariance across groups. Psychological Bulletin, 97, 562–582.
Melone, N. P. (1990). A theoretical assessment of the user-satisfaction construct in information systems research. Management Science, 36, 76–91. https://doi.org/10.1287/mnsc.36.1.76
Micceri, T. (1989). The unicorn, the normal curve, and other improbable creatures. Psychological Bulletin, 105, 156–166. https://doi.org/10.1037/0033-2909.105.1.156
Myers, J. H., & Warner, W. G. (1968). Semantic properties of selected evaluation adjectives. Journal of Marketing Research, 409–412.
Nawawi, A., & Khalil, N. (2008). Post-occupancy evaluation correlated with building occupants’ satisfaction: An approach to performance evaluation of government and public buildings. Journal of Building Appraisal, 4, 37–41.
Nunnally, J. C., & Bernstein, I. H. (1994). Psychometric theory (3rd ed.). New York, NY: McGraw-Hill.
Oliver, R. L., & DeSarbo, W. S. (1988). Response determinants in satisfaction judgments. Journal of Consumer Research, 495–507. https://doi.org/10.1086/jcr.1988.14.issue-4
Oliver, R. L., & Swan, J. E. (1989). Equity and disconfirmation perceptions as influences on merchant and product satisfaction. Journal of Consumer Research, 372–383. https://doi.org/10.1086/jcr.1989.16.issue-3
Ozturk, Z., Arayici, Y., & Coates, S. (2012). Post occupancy evaluation (POE) in residential buildings utilizing BIM and sensing devices: Salford energy house example.
Rainer, R. K., & Harrison, A. W. (1993). Toward development of the end user computing construct in a university setting. Decision Sciences, 24, 1187–1202. https://doi.org/10.1111/deci.1993.24.issue-6
Santos, J. (2002). From intangibility to tangibility on service quality perceptions: A comparison study between consumers and service providers in four service industries. Managing Service Quality: An International Journal, 12, 292–302. https://doi.org/10.1108/09604520210442083
Sengupta, U., & Tipple, A. G. (2007). The performance of public-sector housing in Kolkata, India, in the Post-reform Milieu. Urban Studies, 44, 2009–2027.
Seshadhri, G., & Topkar, V. (2014). Validation of a questionnaire for objective evaluation of performance of built facilities. Journal of Performance of Constructed Facilities, 30, 04014191.
Sinou, M., & Kyvelou, S. (2006). Present and future of building performance assessment tools. Management of Environmental Quality: An International Journal, 17, 570–586. https://doi.org/10.1108/14777830610684530
Tabachnick, B. G., & Fidell, L. S. (2001). Using multivariate statistics (4th ed.). Needham Heights, MA: Allyn & Bacon.
Underwood, J., & Isikdag, U. (Ed). (2009). Handbook of research on building information modeling and construction informatics: Concepts and technologies: Concepts and technologies. Hershey, PA: IGI Global.
Vandenberg, R. J., & Scarpello, V. (1994). A longitudinal assessment of the determinant relationship between employee commitments to the occupation and the organization. Journal of Organizational Behavior, 15, 535–547.
Vroom, V. H. (1964). Work and Motivation. New York, NY: Wiley.Wheaton, B., Muthen, B., Alwin, D. F., & Summer, G. F. (1977).
Assessing reliability and stability in panel models. In D. R. Heise (Ed.), Sociological methodology (pp. 84–136). San Francisco: Jossy-Bass.
Wheeler, A., Boughlagem, D., & Malekzadeh, M. (2011). Developing a child-friendly post-occupancy assessment methodology for sustainable schools. In Third International Conference on Applied Energy (pp. 1–19). Perugia. Retrieved from https://dspace.lboro.ac.uk/dspace-jspui/handle/2134/8909
Yin, R. K. (2003). Case study research: Design and methods (3rd ed.). London: Sage.

Page 17 of 17
Ishiyaku et al., Cogent Business & Management (2017), 4: 1359458https://doi.org/10.1080/23311975.2017.1359458
© 2017 The Author(s). This open access article is distributed under a Creative Commons Attribution (CC-BY) 4.0 license.