conformity assessment of the g7 databaserycppr.cias.rit.edu/publication_2012_2014/2013_taga_g7...
TRANSCRIPT

Conformity Assessment of the G7® Database
Pierre Urbain* and Robert Chung*
Keywords: G7®, conformance, ANSI/CGATS TR015, tolerances, database Abstract: There is a need for certification in the printing industry worldwide. Printing certification systems, such as the G7® developed by IDEAlliance, have been adopted successfully in the U.S. and Asian printing industries. In order to increase the value of certification, there is a need to analyze the percent pass/fail (%pass) of all jobs submitted as a whole and by printing process. Indeed, it is in the mutual interests of printers and print buyers to find out how a certification scheme performs as it applies to the real printing industry. Are the tolerances too tight or too loose? It is equally valuable to determine if a particular conformity requirement and its associated tolerance causes more non-conformance than other requirements. A database of more than 700 data files, measured from the P2P25 targets and made available from Rochester Institute of Technology (RIT), was analyzed. The results of this analysis showed that: (1) 59% of the submissions passed the official G7® criteria, while 82% passed the relaxed tolerances; (2) gray balance (∆Ch) was the major cause of non-conformance as opposed to tone reproduction requirements; and (3) digital printing yielded more passing files (73%) than offset printing (56%) under the G7® criteria Additionally, Fujifilm has proposed a different conformity assessment system with three requirements and one metric (∆E00). These results showed that this method had a lower %pass than the official G7® method.
Research objectives Initially, there were three objectives in this research: (1) to determine %pass of all printing processes by two tolerance settings; (2) to compare %pass between offset and digital printing processes by two tolerance settings; and (3) to determine %pass of individual printing processes by two tolerance settings. An objective added after the research began was: (4) to determine %pass of all printing processes according to Fujifilm’s suggested ∆E00 tolerances.
Methodology
This research investigated the tolerances used by IDEAlliance for G7® Master Printer qualification throughout the entire G7® database owned by RIT Printing Application Laboratory (RIT PAL). A certified X-Rite i1iO issued the measurement files. All measurements were completed in ISO M0, D50/2° via MeasureTool. About 10% of the data contained spectral information. Computation included the G7® aim point determination, color difference, and the conformance assessment based on the G7® Pass/Fail criteria. All formulas (described in TR015) were implemented with the use of Microsoft Excel®. Specifically, the Annex C formula was used as a more rigorous estimate of the CIELab values of the G7® triplets than Equations 2 and 3 (which are similar to the G7® specifications) as shown in Figure 1.
* Rochester Institute of Technology, NY, USA

Figure 1. Flow chart showing the data analysis procedure
Results The results of this study are presented in four parts: (1) %pass of all printing processes by two tolerance settings; (2) a comparison between %pass of offset and digital printing processes by two tolerance settings; (3) %pass of individual printing processes by two tolerance settings; and (4) %pass of all printing processes using Fujifilm’s suggested tolerances.
Part One -- Percentage pass for all printing processes This section discusses the overall %pass of the G7® Master Printer submissions based on qualified jobs in the database owned by RIT PAL.
P2P Measurement Data(TV, CIEXYZ, CIELab, Spectral)
Determining Colorimetric Aims K & CMY ramps
TR015
TV
TVI K(eq.16)
Yr K(eq. 13)
NPD of K (TV)(eq. 11 & 12)
MeasurementExtract K & CMY ramps
Compute and plot (w)∆L* vs. TV for K rampCompute and plot (w)∆L* vs. TV for CMY ramp
G7 Pass/Fail per eq. §3.1Compute and plot (w)∆Ch vs. TV for CMY ramp
G7 Pass/Fail per eq. §3.2
Determination Job Pass/FailG7 & G7PC Pass - Fail Guidelines 20120604 PDF
Compute and plot ∆L* vs. TV for K rampCompute and plot ∆L* vs. TV for CMY rampCompute and plot (w)∆L* vs. TV for K ramp
Compute and plot (w)∆L* vs. TV for CMY ramp
CIE_XYZ of K(Annex C)
CIE_Lab of K(Annex C)
CIE_X'Y'Z' of K(Annex C)
CIELAB of K (tv) ramps
CIELAB of CMY (tv) ramps
NPD of CMY (TV)(eq. 4 & 5)
CIE_XYZ of CMY(Annex C)
CIE_Lab of CMY(Annex C)
CIE_X'Y'Z' of CMY(Annex C)
TVI CMY(eq.10)
Yr CMY(eq. 6)
Inputs for Colorimetric
Aims Determination
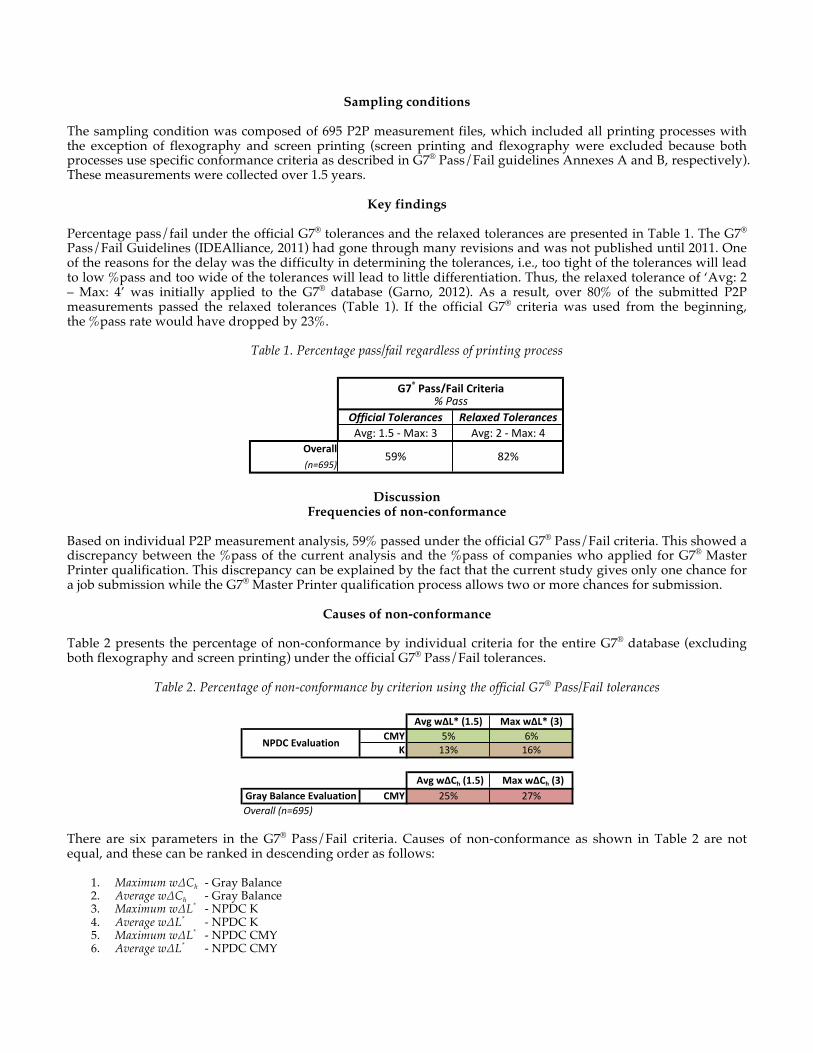
Sampling conditions The sampling condition was composed of 695 P2P measurement files, which included all printing processes with the exception of flexography and screen printing (screen printing and flexography were excluded because both processes use specific conformance criteria as described in G7® Pass/Fail guidelines Annexes A and B, respectively). These measurements were collected over 1.5 years.
Key findings
Percentage pass/fail under the official G7® tolerances and the relaxed tolerances are presented in Table 1. The G7® Pass/Fail Guidelines (IDEAlliance, 2011) had gone through many revisions and was not published until 2011. One of the reasons for the delay was the difficulty in determining the tolerances, i.e., too tight of the tolerances will lead to low %pass and too wide of the tolerances will lead to little differentiation. Thus, the relaxed tolerance of ‘Avg: 2 – Max: 4’ was initially applied to the G7® database (Garno, 2012). As a result, over 80% of the submitted P2P measurements passed the relaxed tolerances (Table 1). If the official G7® criteria was used from the beginning, the %pass rate would have dropped by 23%.
Table 1. Percentage pass/fail regardless of printing process
Discussion Frequencies of non-conformance
Based on individual P2P measurement analysis, 59% passed under the official G7® Pass/Fail criteria. This showed a discrepancy between the %pass of the current analysis and the %pass of companies who applied for G7® Master Printer qualification. This discrepancy can be explained by the fact that the current study gives only one chance for a job submission while the G7® Master Printer qualification process allows two or more chances for submission.
Causes of non-conformance Table 2 presents the percentage of non-conformance by individual criteria for the entire G7® database (excluding both flexography and screen printing) under the official G7® Pass/Fail tolerances.
Table 2. Percentage of non-conformance by criterion using the official G7® Pass/Fail tolerances
There are six parameters in the G7® Pass/Fail criteria. Causes of non-conformance as shown in Table 2 are not equal, and these can be ranked in descending order as follows:
1. Maximum w∆Ch - Gray Balance 2. Average w∆Ch - Gray Balance 3. Maximum w∆L* - NPDC K 4. Average w∆L* - NPDC K 5. Maximum w∆L* - NPDC CMY 6. Average w∆L* - NPDC CMY
������ �������� ��������� ����������������������� ����� ��������
����������
�������������� ��� �����
��� � �
�����&"� #�%! ����&"� $!� � �
� �� ��
�����&��� #�%! ����&��� $!� �� ��
����������� �
���������������
�����������������������

Gray balance—measured using ∆Ch—represents the criterion that caused the highest frequency of non-conformance. It is also important to note that, for all metrics, the “Maximum” criterion had the highest frequency of non-conformance even though a weighted factor was applied to the ∆ values. As a comparison, Table 3 shows the same analysis under relaxed tolerances. Use of the relaxed tolerances reduced non-conformity of NPDC by a factor of 2 and by a factor of 3 for gray balance.
Table 3. Percentage of non-conformance by criterion under the relaxed tolerances
Part Two -- Comparison between percentage pass of Offset and Digital Printing This section compares the percentage pass/fail of G7® Master Printer qualification between the two main printing processes in use today: digital and offset.
Sampling conditions In the offset printing category, there were a total of 551 offset measurement files, with 505 sheetfed offset and 46 web offset. In the digital printing category, there were a total of 144 digital measurement files with 61 inkjet, 25 laser, and 58 unidentified. Figure 2 illustrates the sample distribution of these files by printing process and by press type.
Figure 2. Visual representation of sample distribution by printing process (left) and press type (right)
Key findings The overall analysis represents 695 P2P measurements files, divided into two categories: offset and digital, see Table 4.
�����$!��" ����$!��# � �� ��
� �� ��
�����$����" ����$����# � �� ��
����������� �
���������������
�����������������������
�����$&)�
��������"!)�
$#)�
$)�
&)�
#)� %)� �� � ����� ��
����� ��
���� ����������
�� ����������
���� ��� ����������� �� ��

Table 4. Percentage pass/fail for offset and digital printing
Overall, there was a higher percentage of conformance with digital printing than with offset under either criteria. Specifically, under the official G7® Pass/Fail criteria, 56% of the offset printing files passed, while 73% of the digital printing files passed. This outcome was similar to the results under the relaxed tolerances (80% of the offset printing and 90% of the digital printing files passed).
Discussion Causes of non-conformance
Tables 5 and 6 illustrate the percentage of non-conformance by individual criteria for all offset and digital P2P measurements using the official G7® tolerances.
Table 5. Percentage of non-conformance by criterion for offset printing under the G7® Pass/Fail criteria
Table 6. Percentage of non-conformance by criterion for digital printing under the G7® Pass/Fail criteria
Gray balance was still the main factor of non-conformance for both processes, although digital printing had a lower frequency of non-conformance for gray balance than offset. However, NPDC CMY had a higher frequency of non-conformance in digital (7%) than offset (4%). One plausible cause might be that Master NPDC curves are modeled based on several commercial CtP-based print runs and therefore the “natural” tonality of offset printing seems to be different than that of the digital process (which sometimes has a low TVI, with one example being the HP Indigo®). Moreover, numerous digital presses are not able to reproduce pure color channels. Therefore, some impurities might also be a cause of non-conformance. For example, NPDC K has more non-conformances in offset (14%) than digital (7%). It is also important to remember that non-quality printing criteria (i.e., slur) is only involved in offset printing. Tables 7 and 8 show the same P2P measurements from the two processes evaluated under relaxed tolerances. Extending tolerances reduced the percentage of non-conformance by a factor of 2 for NPDC and a factor of 3 for gray balance. In this case, digital printing had a very low rate of non-conformance: approximately 3% for all criteria, with the exception of 6% for Maximum w∆Ch, see Table 8.
������������ �� ����������� ����������������� ��������������
�������������������
������ ����������������
������������ ��������������
��� � �
��� � �
�����&"� #�%! ����&"� $!� � �
� �� ��
�����&��� #�%! ����&��� $!� �� ��
��������������������
���������������
�����������������������
�����&"� #�%! ����&"� $!� � �
� � �
�����&��� #�%! ����&��� $!� �� ��
����������������� ���
���������������
�����������������������

Table 7. Percentage of non-conformance by criterion for offset printing under the relaxed tolerances
Table 8. Percentage of non-conformance by criterion for digital printing under the relaxed tolerances
The main questions to answer regarding the use of relaxed tolerances are: Will excessive color variation be allowed? What will be the implications in the mind of the print buyer? Based on the results of this research, the use of multi-level tolerances might be more appropriate than only one set of tolerances. As shown in the results, digital printing was about 50% more accurate than conventional processes in terms of color reproduction.
Part Three -- Percentage pass of individual printing processes This section discusses the percentage pass/fail by printing process of the G7® Master Printer qualification submissions owned by RIT PAL.
Sampling conditions A breakdown of the database files by print process is shown in Figure 3.
Figure 3. P2P measurement files by print process (n = 743)
Key findings This analysis represents 743 P2P measurements files, divided into seven print process categories as shown Table 9.
�����$!��" ����$!��# � � �
� � �
�����$����" ����$����# � �� ��
��������������������
���������������
�����������������������
�����$!��" ����$!��# � �� ��
� �� ��
�����$����" ����$����# � �� ��
����������������� ���
���������������
�����������������������
Flexography:
>ĂƐĞƌ�WƌŝŶƟŶŐ͗
^ĐƌĞĞŶ�WƌŝŶƟŶŐ͗
tĞďͲKīƐĞƚ͗
hŶŝĚĞŶƟĮĞĚ��ŝŐŝƚĂů͗
/ŶŬũĞƚ�WƌŝŶƟŶŐ͗
^ŚĞĞƞĞĚͲKīƐĞƚ͗
7
25
41
46
58
61
505

Table 9. Percentage pass/fail under the official and relaxed tolerances by print process
• Digital processes had the highest percentage of conformance out of all of the categories (except Screen printing as explained below).
• Flexography—with its specific assessment criteria (See G7® Pass/Fail – Annex B)—had about the same percentage of conformance (57%) as other conventional processes under the official G7® Pass/Fail criteria.
• Screen printing had the highest percentage of conformance (83%) among all other categories with specific tolerances (See G7® Pass/Fail – Annex A).
Discussion
Causes of non-conformance
By breaking down results by category, it shows that a significant difference in %pass exists between conventional and digital processes. Specifically, the official G7® Pass/Fail criteria had a 55% pass for sheetfed-offset submissions, while the %pass for inkjet printing is 74%. Screen printing process must use specific assessment criteria.
Screen printing submission assessed with usual criteria and tolerances (relaxed or not), result in pass/fail of 2% and 15% respectively. Relaxed tolerances produced a very high compliance frequency regardless of the process used.
Table 10. Percentage of non-conformance by criterion for screen printing under the official G7® Pass/Fail tolerances (using Annex A)
Causes of non-conformance for both digital and offset were studied in the previous section. Table 10 indicates the causes of non-conformance for screen printing. Screen printing uses different criteria than the other printing processes, as there are less patches measured and larger tolerances. The results corresponded to a similar percentage of non-conformance by individual criterion as the other processes experienced under relaxed tolerances. It is interesting to note that the Maximum w∆Ch was not
������������ �� ����������� ����������������� ��������������
�&%�����#���������!��
�&%�����#���������!��
���!������" �������
����� ���������� ���������� ��� ���������
����������� ��� ���������
����� ����� ������ � �
�������������� ���
��� ���������
�&%�����#�������� ����������
���� ���$���� ��� � �
����������$����
��� ��������
�����'"� #�%! ����'"� %!� �� ���
� �� ���
�����'��� $! ����'��� &!� �� ��
����������������� �
���������������
�����������������������

the highest cause of non-conformance for screen printing as it was for the other printing processes. Instead, Maximum w∆L* for both NPDC K and CMY was the highest cause of non-conformance. Use of the relaxed tolerances resulted in a higher level of non-conformance for the gray balance measurement, see Table 11.
Table 11. Percentage of non-conformance by criterion for screen printing under the relaxed tolerances (using Annex A)
Flexography uses the official G7® Pass/Fail tolerances with different criteria for assessment per Annex B, see Table 12.
Table 12. Percentage of non-conformance by criterion for flexography under the official G7® Pass/Fail criteria (using Annex B)
The population studied was composed of seven measurements, but it appears that there was not any non-conformance due to the Average w∆L* for NPDC. Only the Maximum w∆L* CMY caused non-conformance of 14%. However, the gray balance evaluation was the highest cause of non-conformance among all of the printing processes at 43%. Use of the relaxed tolerances did not result in any non-conformance for the NPDC evaluation, and reduced non-conformance for the gray balance evaluation by a factor of 1.5, see Table 13.
Table 13. Percentage of non-conformance by criterion for flexography under the relaxed tolerances (using Annex B)
Part Four -- Percentage pass for all Printing Processes using the Fujifilm suggested tolerances This section compares the percentage pass/fail under two different criteria:
1. IDEAlliance G7® Pass/Fail Criteria, and 2. Fujifilm suggested tolerances, see Table 14.
�����$!��" ����$!��# � �� ���
� �� ���
�����$����" ����$����# � ��� ���
����������������� �
���������������
�����������������������
�����&"� #�%! ����&"� $!� �� ���
� �� ��
�����&��� #�%! ����&��� $!� ��� ���
�������� ������
���������������
�����������������������
�����$!��" ����$!��# � �� ��
� �� ��
�����$����" ����$����# � ��� ���
�������� ������
���������������
�����������������������

Table 14. Fujifilm tolerances
Sampling conditions The sampling condition was the entire database (n = 743).
Key Findings The analysis relied on 743 P2P measurements files divided into seven print process categories and analyzed using the two different criteria, see Table 15.
Table 15. Percentage pass/fail by print process under two different criteria (G7® and Fujifilm)
• The Fujifilm suggested tolerances resulted in an overall lower %pass. However, the Fujifilm suggested tolerances were much closer in %pass to the official G7® Pass/Fail criteria than the relaxed tolerances.
• The Fujifilm suggested tolerances were more aligned with digital printing (∆ +4%) than offset printing (∆ -8%). However, these tolerances did not provide similar results for screen printing (∆ -76%) and flexography (∆ -28%).
Discussion Comparison of G7® Pass/Fail criteria and Fujifilm suggested tolerances
The ∆E00 metrics suggested by Fujifilm demonstrate a %pass close to the current G7® Pass/Fail criteria for almost all print processes. The most frequent cause of non-conformance is indicated in Table 16.
������$���������#����� ����$������ �#����� ����$���� �����#�����
��� � �
��� � ����������
FFuujjiiffiillmm TToolleerraanncceess SScchheemmee%% PPaassss
OOffffiicciiaall TToolleerraanncceess RReellaaxxeedd TToolleerraanncceess PPrrooppoosseedd TToolleerraanncceessAAvvgg:: 11..55 -- MMaaxx:: 33 AAvvgg:: 22 -- MMaaxx:: 44 ��EE0000 BBaasseedd
Specific Criteria
GG77®® PPaassss//FFaaiill CCrriitteerriiaa%% PPaassss
OOvveerraallll 5599%% 8822%% 5544%%(n=695)
PPrriinntt PPrroocceessss
OOffffsseett PPrriinnttiinngg 5566%% 8800%% 4488%%(n=551)DDiiggiittaall PPrriinnttiinngg 7733%% 9900%% 7777%%(n=144)
PPrriinnttiinngg TTyyppee
SShheeeettffeedd--OOffffsseett 55% 80% 50%(n=505)WWeebb--OOffffsseett 59% 72% 30%(n=46)
IInnkkjjeett PPrriinnttiinngg 74% 90% 80%(n=61)LLaasseerr PPrriinnttiinngg 64% 92% 64%(n=25)
UUnniiddeennttiiffiieedd DDiiggiittaall 76% 88% 79%(n=58)
SSccrreeeenn PPrriinnttiinngg 83% - 7%(n=41)FFlleexxooggrraapphhyy 57% - 29%(n=7)
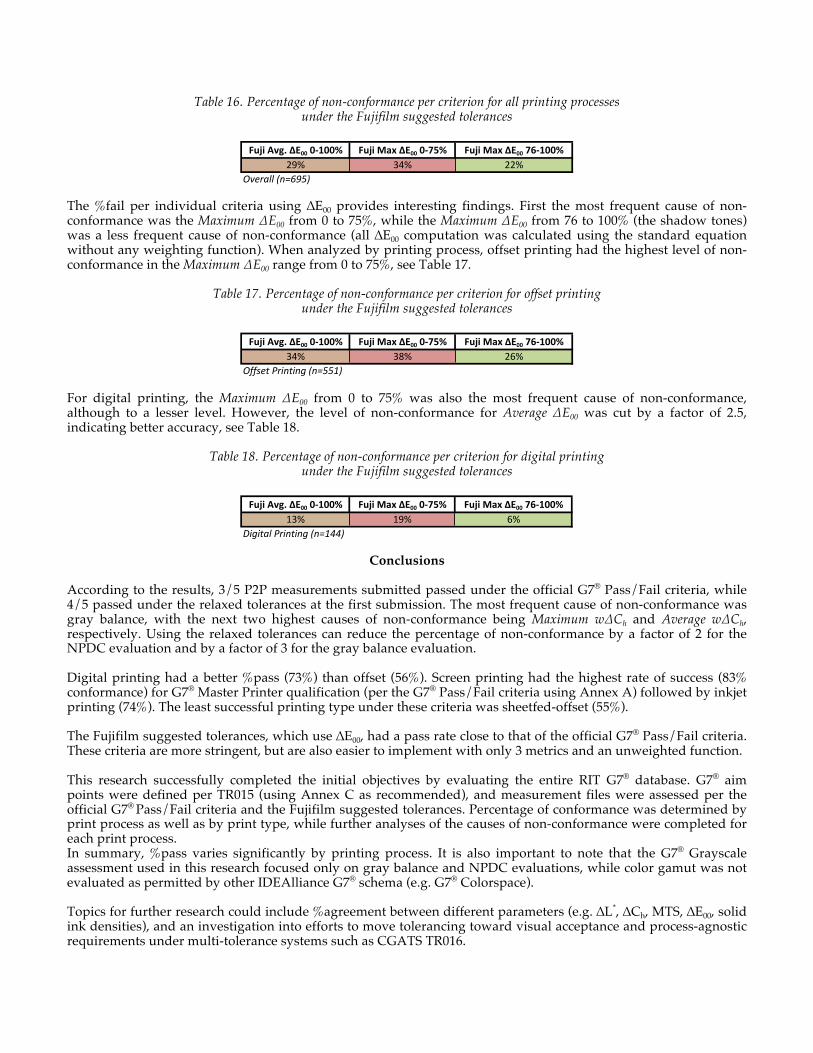
Table 16. Percentage of non-conformance per criterion for all printing processes under the Fujifilm suggested tolerances
The %fail per individual criteria using ∆E00 provides interesting findings. First the most frequent cause of non-conformance was the Maximum ∆E00 from 0 to 75%, while the Maximum ∆E00 from 76 to 100% (the shadow tones) was a less frequent cause of non-conformance (all ∆E00 computation was calculated using the standard equation without any weighting function). When analyzed by printing process, offset printing had the highest level of non-conformance in the Maximum ∆E00 range from 0 to 75%, see Table 17.
Table 17. Percentage of non-conformance per criterion for offset printing
under the Fujifilm suggested tolerances
For digital printing, the Maximum ∆E00 from 0 to 75% was also the most frequent cause of non-conformance, although to a lesser level. However, the level of non-conformance for Average ∆E00 was cut by a factor of 2.5, indicating better accuracy, see Table 18.
Table 18. Percentage of non-conformance per criterion for digital printing under the Fujifilm suggested tolerances
Conclusions According to the results, 3/5 P2P measurements submitted passed under the official G7® Pass/Fail criteria, while 4/5 passed under the relaxed tolerances at the first submission. The most frequent cause of non-conformance was gray balance, with the next two highest causes of non-conformance being Maximum w∆Ch and Average w∆Ch, respectively. Using the relaxed tolerances can reduce the percentage of non-conformance by a factor of 2 for the NPDC evaluation and by a factor of 3 for the gray balance evaluation. Digital printing had a better %pass (73%) than offset (56%). Screen printing had the highest rate of success (83% conformance) for G7® Master Printer qualification (per the G7® Pass/Fail criteria using Annex A) followed by inkjet printing (74%). The least successful printing type under these criteria was sheetfed-offset (55%). The Fujifilm suggested tolerances, which use ∆E00, had a pass rate close to that of the official G7® Pass/Fail criteria. These criteria are more stringent, but are also easier to implement with only 3 metrics and an unweighted function. This research successfully completed the initial objectives by evaluating the entire RIT G7® database. G7® aim points were defined per TR015 (using Annex C as recommended), and measurement files were assessed per the official G7® Pass/Fail criteria and the Fujifilm suggested tolerances. Percentage of conformance was determined by print process as well as by print type, while further analyses of the causes of non-conformance were completed for each print process. In summary, %pass varies significantly by printing process. It is also important to note that the G7® Grayscale assessment used in this research focused only on gray balance and NPDC evaluations, while color gamut was not evaluated as permitted by other IDEAlliance G7® schema (e.g. G7® Colorspace). Topics for further research could include %agreement between different parameters (e.g. ∆L*, ∆Ch, MTS, ∆E00, solid ink densities), and an investigation into efforts to move tolerancing toward visual acceptance and process-agnostic requirements under multi-tolerance systems such as CGATS TR016.
������������������� ����������������� ���������������������� ��� ���
����������� �
������������������� ����������������� ��������������������� �� ��
��������������������
������������������� ����������������� ���������������������� ��� ��
����������������� ���
Acknowledgments The authors wish to express their appreciation to the following individuals and organizations: Mr. Joe Fazzi of IDEAlliance for his support of this research toward a better understanding of conformance in the printing industry; Mr. Bill Garno of RIT Printing Applications Laboratory for his comments regarding the G7® relaxed tolerances; and Mr. David McDowell and Mr. Michael Rodriguez for their insights regarding CGATS TR015.
Selected Bibliography ANSI/CGATS TR015.
2011, Graphic technology — Methodology for Establishing Printing Aims Based on a Shared Near-neutral Gray-scale. Retrieved from www.idealliance.org/specifications/g7.
Fujifilm USA.
2012, January. Fuji Proposed Simplified Tolerances. Email thread. Garno, W.
2012, Private communication. IDEAlliance.
2011, July. G7® How To Specification 2008. Retrieved from www.idealliance.org/downloads/g7-how-specification-2008. IDEAlliance.
2012, June. Pass-Fail Guidelines G7® Master & G7® Process Control Master Qualification Programs. Retrieved from http://files.idealliance.org/G7/Experts/Pass_Fail_G7_G7PC_20120604.pdf.
Sheng, J.
2013, Determination of Chromaticness Difference Tolerance of Offset Printing by Means of Simulation, Thesis.