conifer translational genomics network coordinated ... genetics.pdf · population genetics...
TRANSCRIPT

Conifer Translational Genomics Network
Coordinated Agricultural Project
www.pinegenome.org/ctgn
Genomics in Tree Breeding and
Forest Ecosystem Management
-----
Module 3 – Population Genetics
Nicholas Wheeler & David Harry – Oregon State University

www.pinegenome.org/ctgn
Population genetics
Population genetics is the
study of genetic differences
within and among populations
of individuals, and how these
differences change across
generations
In the classic view, it is the
study of the amount and
distribution of genetic variation
in populations and species,
and how it got that way
Population genetics describes
the mechanics of how
evolution takes place
Image Credit: Nicholas Wheeler, Oregon State University
www.pinegenome.org/ctgn
Why study genes in populations?
In natural populations:
– Adaptation – the ability to survive and exploit an environmental niche –
involves the response of populations, not individuals
In breeding populations:
– Genetic gain – improving the average performance of populations for
desired breeding objectives – depends on selecting and breeding
parents with the best genetic potential

www.pinegenome.org/ctgn
Population genetics addresses many topics
How genetically diverse is a species or population?
– Contrast diversity in populations that differ in life-history traits, pop size,
breeding structure, etc
Are different populations closely related to one another?
– Monitor diversity for conservation purposes
What is the potential for inbreeding depression?
– What is the minimum viable population size from a genetic standpoint?
How is genetic variation maintained?
Which genes/alleles are responsible for phenotypic variation?
How are species related (phylogenetics) and how did they acquire
their current distribution (biogeography)?

www.pinegenome.org/ctgn
What do population geneticists typically
measure?
Locus ‘X’ in pop #1
Typical descriptive statisticsTypical descriptive statistics
Genotype Frequency
A1 A1 0.1A1 A2 0.1A1 A3 0.1A2 A2 0.3A2 A3 0.3A3 A3 0.1
Sum = 1.0
Allele Frequency
A1 0.2A2 0.5A3 0.3
Total = 1.0
A (# alleles) = 3
With data from more loci, you an also calculate, P (% polymorphic loci) = % of loci with >1 allele
Ho (observed heterozygosity) = 0.5Ho (observed heterozygosity) = 0.5
Figure Credit: Glenn Howe, Oregon State University

www.pinegenome.org/ctgn
The Hardy-Weinberg principle
The frequencies of alleles and genotypes in a population will
remain constant over time (given certain assumptions which
describe a static, or non-evolving population)
The frequencies of alleles and genotypes can be described
mathematically, where p and q are the frequencies of the alleles A1
and A2
p2 + 2pq + q2 = 1.0p2 + 2pq + q2 = 1.0
Freq. A1A1 homozygote Freq. A2A2 homozygote
Freq. A1A2 heterozygote
p2 + 2pq + q2 = 1.0p2 + 2pq + q2 = 1.0
Freq. A1A1 homozygote Freq. A2A2 homozygote
Freq. A1A2 heterozygote

www.pinegenome.org/ctgn
Random mating restores HW proportions
each generation
Figure Credit: White, T. L, W. T. Adams, and D. B. Neale. 2007. Forest genetics. CAB International, Wallingford, United Kingdom. Used with permission.

www.pinegenome.org/ctgn
HW equilibrium conditions
For Hardy-Weinberg equilibrium to exist, a number of assumptions
must be met. For instance, the population under consideration must
– Be random mating (translation = all possible pairings of mates are
equally likely)
– Be infinitely large (translation = sampling with replacement)
– Have no selection (which biases genotype frequencies)
– Have no migration (since all alleles must be sampled from the same
pool)
– Have no mutation (which introduces new variants)
Obviously, such “ideal” populations rarely (if ever) exist
Still, minor violations of assumptions generally have little impact

www.pinegenome.org/ctgn
HW : Non-random mating
When individual genotypes do not mate randomly, HW equilibrium
proportions are not observed among the offspring
We’ll look at two kinds of non-random mating
– Population substructure/admixture
– Inbreeding (mating among related individuals)
www.pinegenome.org/ctgn
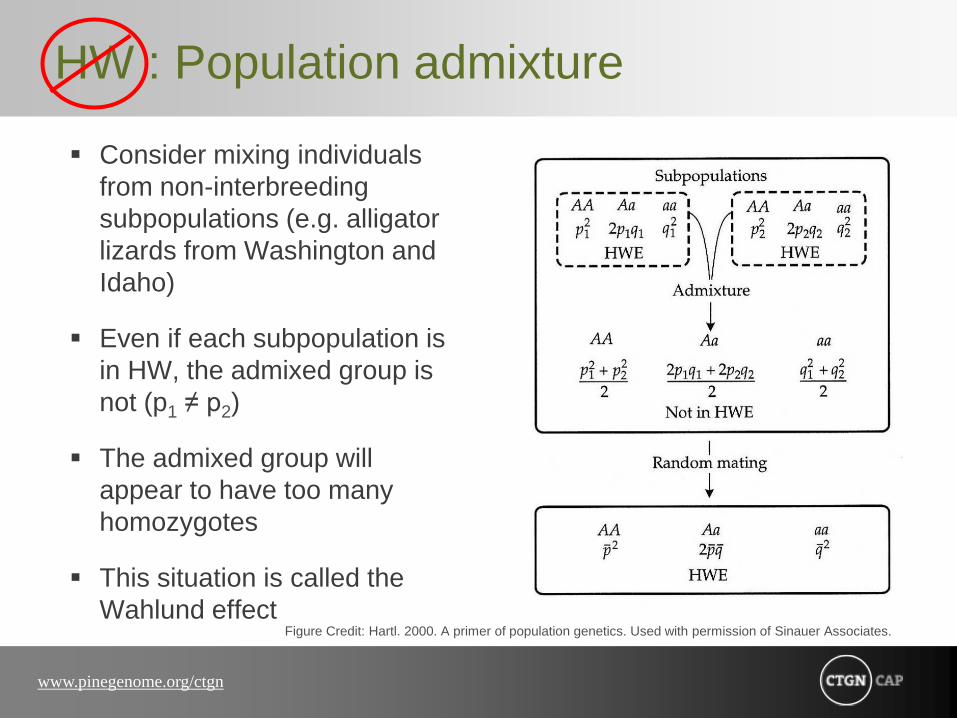
HW : Population admixture
Consider mixing individuals
from non-interbreeding
subpopulations (e.g. alligator
lizards from Washington and
Idaho)
Even if each subpopulation is
in HW, the admixed group is
not (p1 ≠ p2)
The admixed group will
appear to have too many
homozygotes
This situation is called the
Wahlund effect
Figure Credit: Hartl. 2000. A primer of population genetics. Used with permission of Sinauer Associates.

www.pinegenome.org/ctgn
Population structure: Wahlund’s effect
Wahlund’s effect: As long as allele frequencies vary among
subpopulations, even if each subpopulation exhibits HW
proportions, then more homozygotes will be observed than would
be expected based on the allele frequency of the metapopulation
The relative increase in homozygosity is proportional to the
variance in allele frequencies among subpopulations, as measured
by F (where 0 ≤ F ≤ 1)
F is commonly known as Wright’s fixation index and may be most
simply interpreted as F = 1 – (Hobs / Hexp ), where the values
represent observed and expected levels of heterozygosity

www.pinegenome.org/ctgn
Inbreeding
Inbreeding (mating among relatives) increases homozygosity
relative to HW
– Rate is proportional to degree of relationship
– Distant cousin < first cousin < half-sib < full-sib < self
Recurrent inbreeding leads to a build-up of homozygosity, and a
corresponding reduction in heterozygosity
Inbreeding affects genotype frequencies, but not allele frequencies
How does inbreeding affect deleterious recessive alleles?

www.pinegenome.org/ctgn
Inbreeding and homozygosity
F reflects a proportional reduction in heterozygosity, and a build-up
of genetic relatedness. HW implies F = 0. With recurrent selfing, F
goes to 1 Figure Credit: White, T. L, W. T. Adams, and D. B. Neale. 2007. Forest genetics. CAB International, Wallingford, United Kingdom. Used with permission. (Table 5.1 in Falconer and Mackay, 1996)

www.pinegenome.org/ctgn
Inbreeding depression
Inbreeding often leads to
reduced vitality (growth,
fitness)
Deleterious recessive alleles
are made homozygous
Outcrossing species are more
likely to suffer higher
inbreeding depression
Image Credit: White, T. L, W. T. Adams, and D. B. Neale. 2007. Forest genetics. CAB International, Wallingford, United Kingdom. Used with permission. (Photo courtesy of F. Sorensen, USFS, Pacific Northwest Research Station)

www.pinegenome.org/ctgn
Evolutionary forces change allele frequencies
Mutation a random heritable change in the genetic material
(DNA) – ultimate source of all new alleles
Migration (gene flow) the introduction of new alleles into a
population via seeds, pollen, or vegetative propagules
Random genetic drift the random process whereby some alleles
are not included in the next generation by chance alone
Natural selection the differential, non-random reproductive
success of individuals that differ in hereditary characteristics
www.pinegenome.org/ctgn
Mutation
Mutations are the ultimate source of genetic variation on which
other evolutionary forces act (e.g. natural selection)
Mutations at any one locus are rare, but with sufficient time,
cumulative effects can be large
Heritable changes in DNA sequence alter allele frequencies as
new alleles are formed
Effects on populations – Mutations promote differentiation (but
effects are gradual in the absence of other evolutionary forces)

www.pinegenome.org/ctgn
Gene flow: Migration of alleles
Gene flow – the movement of
alleles among populations
Movement may occur by
individuals (via seed) or
gametes (via pollen) between
populations
Effects on populations –
gene flow hinders
differentiation. It is a
cohesive force which tends to
bind populations together
Pollen(high gene flow)
Seed(low gene flow)
Pollen(high gene flow)
Seed(low gene flow)
Image Credit: Glenn Howe, Oregon State University

www.pinegenome.org/ctgn
Migration rates
Modest migration rates will
prevent divergence of
populations
The absolute number of
migrants per generation
affects Fst, the fixation index,
independent of subpopulation
size
Figure Credit: Hartl. 2000. A primer of population genetics. Used with permission of Sinauer Associates.

www.pinegenome.org/ctgn
Genetic drift
Drift reflects sampling in small
populations. Subgroups follow
independent paths. Allele
frequencies will vary among
subgroups while frequencies in
the metapopulation remain
relatively stable. Major impacts of
drift are:
Reduced genetic diversity (loss of
alleles.
Reduced average heterozygosity.
Increased genetic differentiation
among populations. Figure Credit: Modified from White et al. Forest Genetics. 2007. Fig. 5.10

www.pinegenome.org/ctgn
Random genetic drift: Bottlenecks
Bottleneck effect: A type of
genetic drift that occurs when
a population is severely
reduced in size such that the
surviving population is no
longer genetically
representative of the original
population
Figure credit: Nicholas Wheeler, Oregon State University
www.pinegenome.org/ctgn
Natural selection
Natural selection First proposed by Charles Darwin in mid-1800s. The differential reproductive success of individuals that differ in hereditary characteristics – Not all offspring survive and reproduce
– Some individuals produce more offspring than others (mortality, disease, bad luck, etc)
– Offspring differ in hereditary characteristics affecting their survival (genotype and reproduction are correlated)
– Individuals that reproduce pass along their hereditary characteristics to the next generation
– Favorable characteristics become more frequent in successive generations
Effects on populations: – Promotes differentiation between populations that inhabit dissimilar
environments
– Hinders differentiation between populations that inhabit similar environments
www.pinegenome.org/ctgn
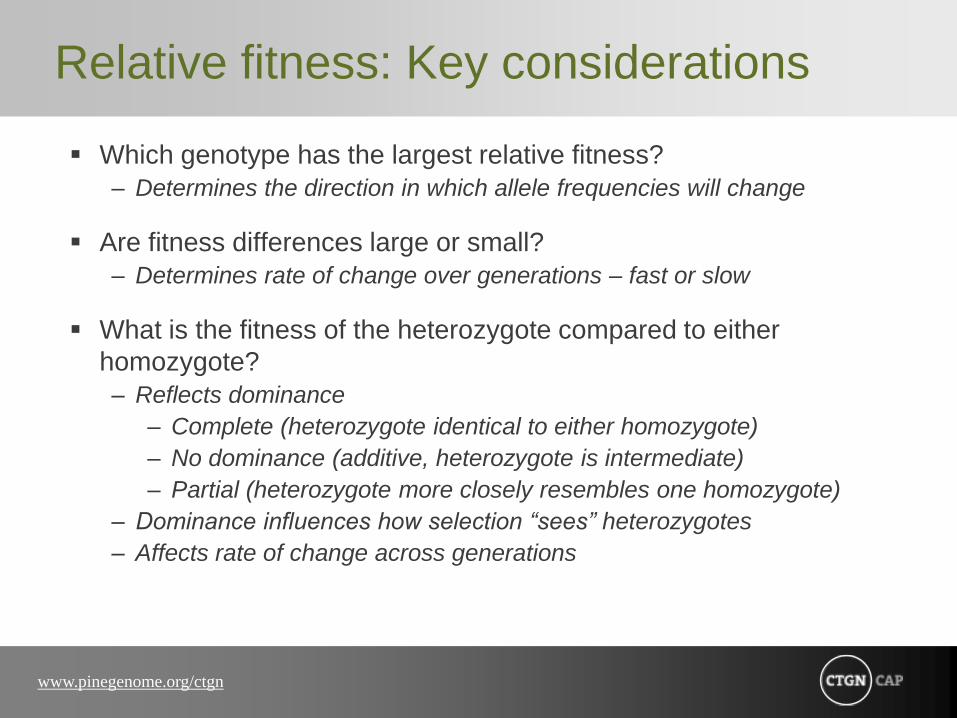
Relative fitness: Key considerations
Which genotype has the largest relative fitness?
– Determines the direction in which allele frequencies will change
Are fitness differences large or small?
– Determines rate of change over generations – fast or slow
What is the fitness of the heterozygote compared to either
homozygote?
– Reflects dominance
– Complete (heterozygote identical to either homozygote)
– No dominance (additive, heterozygote is intermediate)
– Partial (heterozygote more closely resembles one homozygote)
– Dominance influences how selection “sees” heterozygotes
– Affects rate of change across generations

www.pinegenome.org/ctgn
Gene action: Additive vs. dominance
additive
partial dominance
complete dominance
overdominance
A1A1A2A2 A1A2
A1A1A2A2 A1A2
1-s 1-(1/2)s 1
1-s 1-hs 1
A1A1A2A2
A1A2
1-s 1
A1A1A2A2 A1A2
1-s2 1-s1 1
A1A1A2A2 A1A2 A1A1A2A2 A1A2
A1A1A2A2 A1A2
1-s 1-(1/2)s 1
1-s 1-hs 1
A1A1A2A2
A1A2
1-s 1
A1A1A2A2
A1A2
1-s 1
A1A1A2A2 A1A2
1-s2 1-s1 1
A1A1A2A2 A1A2
1-s2 1-s1 1
phenotypeFigure Credit: Falconer and Mackay. 1996. Used with permission of Pearson Education.

www.pinegenome.org/ctgn
Dominance and rate of change
Figure Credit: Hartl. 2000. A primer of population genetics. Used with permission of Sinauer Associates.

www.pinegenome.org/ctgn
Table Credit: White, T. L, W. T. Adams, and D. B. Neale. 2007. Forest genetics. CAB International, Wallingford, United Kingdom. Used with permission.
Selection: Numerical example

www.pinegenome.org/ctgn
Natural selection: Fitness and selection
Fitness: The relative contribution an individual (genotypic class)
makes to the gene pool of the next generation
Figure Credit: Nicholas Wheeler, Oregon State University

www.pinegenome.org/ctgn
What if selection is weak or absent?
We’ve already seen that mutation can supply new variation that
selection may act upon
Most mutations are deleterious and are lost, but rarely,
advantageous mutations can occur
What about mutations that cause no effect either way?
The neutral theory of evolution pertains to alleles that confer no
difference in relative fitness – as if selection is oblivious to them
www.pinegenome.org/ctgn
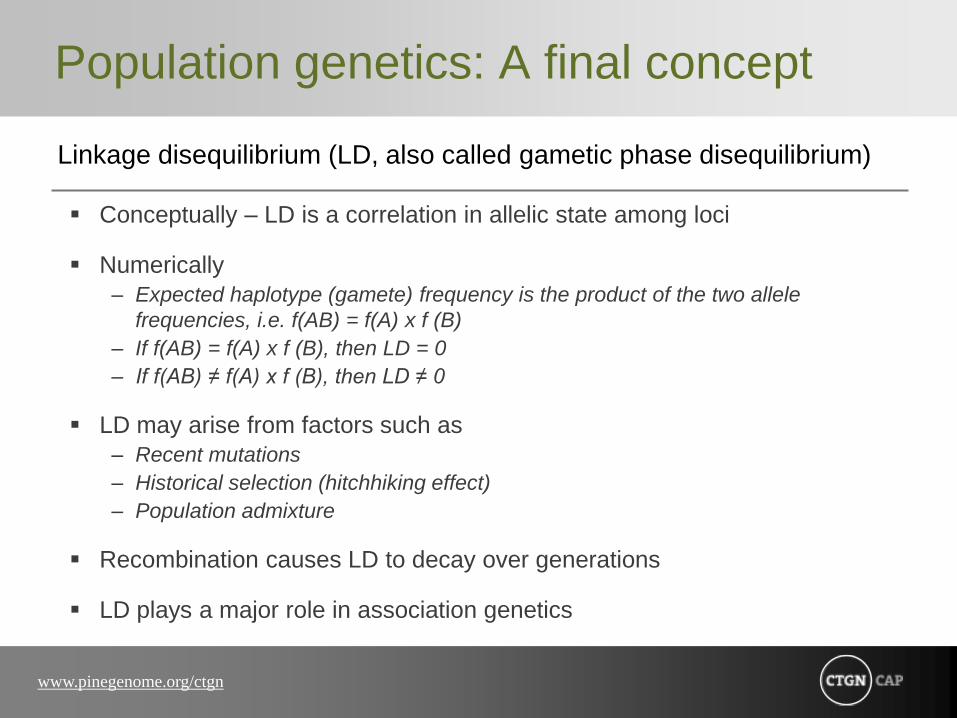
Population genetics: A final concept
Linkage disequilibrium (LD, also called gametic phase disequilibrium)
Conceptually – LD is a correlation in allelic state among loci
Numerically
– Expected haplotype (gamete) frequency is the product of the two allele
frequencies, i.e. f(AB) = f(A) x f (B)
– If f(AB) = f(A) x f (B), then LD = 0
– If f(AB) ≠ f(A) x f (B), then LD ≠ 0
LD may arise from factors such as
– Recent mutations
– Historical selection (hitchhiking effect)
– Population admixture
Recombination causes LD to decay over generations
LD plays a major role in association genetics

www.pinegenome.org/ctgn
A numeric example of LD
Determine allele frequencies
Ask whether f(A) x f(B) = f(AB)
Repeat for f(Ab), f(aB), and f(ab)
Linkage disequilibrium (LD) reflects this difference
A BA B
ba ba
bA bA
a Ba B
No LD Higher LD Lower LD
0.42 0.60 0.55
0.28 0.10 0.15
0.18 -- 0.05
0.12 0.30 0.25
No LD Higher LD Lower LD
0.42 0.60 0.55
0.28 0.10 0.15
0.18 -- 0.05
0.12 0.30 0.25
f(A) = 0.7f(a) = 0.3
f(B) = 0.6f(b) = 0.4
Gamete Type(linked)
Gamete Frequency
Allele Frequencies
ba
bA
A B
a B
f(A) = 0.7f(a) = 0.3
f(B) = 0.6f(b) = 0.4
Gamete Type(unlinked)
ba ba
bA bA
A BA B
a Ba B
f(A) = 0.7f(a) = 0.3
f(B) = 0.6f(b) = 0.4
Gamete Type(unlinked)
Image Credit: David Harry, Oregon State University

www.pinegenome.org/ctgn
Some concluding remarks
The central themes of population genetics remain
– How much genetic diversity is there?
– How is it distributed?
– How did it get that way?
The foundation of population genetics, identifying and quantifying
genetic diversity, is no longer constrained by the lack of genetic
markers. We can now measure diversity in literally thousands of
genes simultaneously, and study how it is distributed
Molecular population genetics

www.pinegenome.org/ctgn
References cited
Falconer, D. S., and T.F.C. Mackay. 1996. Introduction to Quantitative Genetics. 4th Ed.
Pearson Education (Longman Group Ltd.), Essex, England.
Hamrick, J. L., and M.J.W. Godt. 1990. Allozyme diversity in plant species. p. 43-63. In Brown,
A.H.D., Clegg, M. T., Kahler, A. L., and B. S. Weir (ed.) Plant population genetics, breeding,
and genetic resources. Sinauer Associates, Sunderland, MA.
Hartl, D. L. 2000. A primer of population genetics. Sinauer Associates, Sunderland, MA.
Hartl, D. L., and E. W. Jones. 2001. Genetics: Analysis of genes and genomes, 5th edition.
Jones and Barlett, Sudbury, MA.
Kimura, M. 1983. The neutral theory of molecular evolution. Cambridge University Press, New
York.
• White, T. L, W. T. Adams, and D. B. Neale. 2007. Forest genetics. CAB International,
Wallingford, United Kingdom. Available online at:
http://bookshop.cabi.org/?page=2633&pid=2043&site=191 (verified 26 May 2011).

www.pinegenome.org/ctgn
External link
Wikipedia contributors. 2011. Neutral theory of molecular evolution. Wikipedia, The Free
Encyclopedia. Available at:
http://en.wikipedia.org/w/index.php?title=Neutral_theory_of_molecular_evolution&oldid=421184
222 (verified 26 May, 2011).
www.pinegenome.org/ctgn
Thank You. Conifer Translational Genomics Network
Coordinated Agricultural Project