connecticut economic competitiveness diagnostic on economic... · | 1 topics for today’s...
TRANSCRIPT

Connecticut Economic
Competitiveness Diagnostic Summary Results
Presentation to Commission for
Economic Competitiveness
April 8, 2016

1 |
Topics for today’s discussion
▪ Context for the Connecticut Economic Competitiveness Diagnostic
▪ Connecticut’s long run of strong economic growth
▪ Recent trends that have created a new economic normal
▪ Connecticut’s distinctive assets
▪ Five potential themes for further exploration

2 |
The Economic Competitiveness Diagnostic provides a fact
base for discussion but is limited in scope
This diagnostic did…
Assemble an
independent, data-
driven fact base
Incorporate a diverse
range of perspectives
Identify potential
themes for the
Commission
consideration
This diagnostic did not…
Intend to be
comprehensive in
scope
Engage all possible
stakeholders
Make policy or strategy
recommendations
Importantly, this diagnostic is just one element of the work that will help
shape the Commission's’ focus and priorities
CONTEXT FOR THE CONNECTICUT ECONOMIC COMPETITIVENESS DIAGNOSTIC
Commission on Economic Competitiveness

3 |
The diagnostic is one element of a broader effort to understand
and improve Connecticut's economic competitiveness
CONTEXT FOR THE CONNECTICUT ECONOMIC COMPETITIVENESS DIAGNOSTIC
3. Execution 2. Strategy development 1. Diagnostic
Fact-based assessment of
current strengths and
challenges
Additional
competitiveness
diagnostics (e.g., on
taxes)
Launch of ongoing
stakeholder engagement
Alignment around shortlist
of priorities
Integrated plan and vision
Detailed strategies for high
priority near term
opportunities (e.g., best
practice research, detailed
initiative design, feasibility
testing, implementation
plan, budgeting)
Resourcing and
implementation of near-term
opportunities
Strategy design for longer-
term opportunities
Performance management
and reporting

4 |
The diagnostic was developed through data analysis and
qualitative input from interviews
Assembled an independent,
data-driven fact base
▪ Federal, state, and private data
sources
▪ Existing reports and analyses
▪ Comparison of Connecticut
versus regional peer states and
by MSA
Incorporated a diverse range of
perspectives
▪ 75+ interviews across sectors
and regions
▪ Engagement with ~200
economic development
professionals
Private
sector
▪ Large companies
▪ Start-ups
▪ Site selection firms
▪ Trade associations
Public
Sector
▪ Executive branch
▪ Legislators
▪ Commission on Economic
Competitiveness members
▪ City and town officials
Social
sector
▪ Foundations
▪ Direct service organizations
▪ Academia
CONTEXT FOR THE CONNECTICUT ECONOMIC COMPETITIVENESS DIAGNOSTIC

5 |
The Connecticut Economic Competitiveness diagnostic:
Key takeaways
Connecticut has had a long run of strong economic performance, making it a great state to
live and work
Recent trends have created a new economic normal and pose challenges for the state’s
competitiveness
– A. Global and national forces are reshaping Connecticut’s traditional core sectors
– B. Peers are closing the gap on Connecticut’s livability and cost advantages
– C. Population trends are reshaping Connecticut’s workforce
– D. Perceptions are hardening on state governance and fiscal uncertainty
Connecticut has a portfolio of distinctive assets to address these trends and ensure long-
term competitiveness
Five themes have emerged as potential areas for the Commission to consider exploring
in further detail
– 1. Cities: How should Connecticut revitalize its urban cores?
– 2. Growth sectors: How can Connecticut support its high potential, fast-changing sectors?
– 3. Transportation: What investments will best connect talent and businesses?
– 4. Fiscal outlook: How can Connecticut address its pension and budget challenges to
restore business confidence?
– 5. Public-private engagement: How can the State and the private sector collaborate to
jointly support long-term growth?

6 |
Connecticut’s economy performs well along several important
indicators, reflecting a long run of strong economic performance
SOURCE: Moody's Analytics; BLS; US Census Bureau
Median household income, 2014 Productivity1, 2014
1 Measured as GDP per worker
State
1 Alaska: $143.1K
2 New York: $139.8K
3 Connecticut: $138.6K
4 California: $133.2K
Rank Rank State
1 Maryland: $76.2K
2 New Hampshire: $73.4K
3 Hawaii: $71.2K
4 Connecticut: $70.2K
GDP per capita, 2014
Rank State
1
2
3
4
Alaska: $66.2K
North Dakota: $65.2K
New York: $64.8K
Connecticut: $64.7K
CONNECTICUT’S LONG RUN OF STRONG ECONOMIC PERFORMANCE

7 |
The recession disrupted Connecticut's long run of solid
economic growth
SOURCE: Moody’s Analytics; BLS; ACS; US Census
0
0.5
1.0
1.5 US GDP (+147%)
CT GDP (+126%)
Real GDP, population, and employment, 1980-2014
1980 1990 2000 2010
Recession Indexed to year 1980
A NEW ECONOMIC NORMAL FOR CONNECTICUT
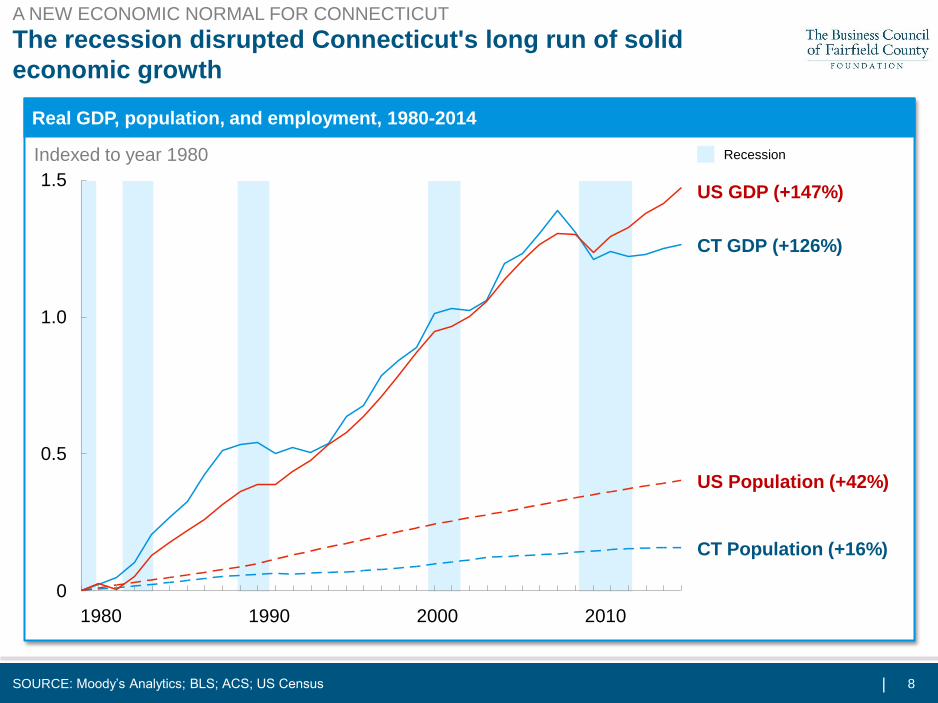
8 |
The recession disrupted Connecticut's long run of solid
economic growth
SOURCE: Moody’s Analytics; BLS; ACS; US Census
1.5
1.0
0
0.5
CT Population (+16%)
CT GDP (+126%)
US GDP (+147%)
US Population (+42%)
Real GDP, population, and employment, 1980-2014
1980 1990 2000 2010
Recession Indexed to year 1980
A NEW ECONOMIC NORMAL FOR CONNECTICUT

9 |
The recession disrupted Connecticut's long run of solid
economic growth
SOURCE: Moody’s Analytics; BLS; ACS; US Census
1.5
1.0
0
0.5
CT Population (+16%)
CT GDP (+126%)
US Employment (+47%)
US GDP (+147%)
US Population (+42%)
CT Employment (+18%)
Real GDP, population, and employment, 1980-2014
1980 1990 2000 2010
Recession Indexed to year 1980
A NEW ECONOMIC NORMAL FOR CONNECTICUT

10 |
Emerging trends have created a new economic normal and
pose challenges for the state’s competitiveness
Global and national forces are reshaping Connecticut’s
traditional core sectors
Peers are closing the gap on Connecticut’s livability
and cost advantages
Population trends are reshaping Connecticut’s
workforce
Perceptions are hardening on state governance and
fiscal uncertainty
A NEW ECONOMIC NORMAL FOR CONNECTICUT

11 |
Emerging trends have created a new economic normal and
pose challenges for the state’s competitiveness
Global and national forces are reshaping Connecticut’s
traditional core sectors
Peers are closing the gap on Connecticut’s livability
and cost advantages
Population trends are reshaping Connecticut’s
workforce
Perceptions are hardening on state governance and
fiscal uncertainty
A NEW ECONOMIC NORMAL FOR CONNECTICUT

12 |
Connecticut industry mix, 1980-2014
% of GDP
SOURCE: Moody’s Analytics; US Bureau of Labor Statistics
0
5
10
15
20
25
30
2014 2010 2000 1990 1980
FORCES ARE RESHAPING CONNECTICUT’S CORE SECTORS
Manufacturing, Finance and Insurance have faced
recent challenges
Finance and Insurance
Manufacturing

13 | SOURCE: U.S. Bureau of Labor Statistics (BLS): Current Employment Statistics (CES),
Quarterly Census of Employment and Wages (QCEW); Moody's Analytics
Connecticut industries adding the most jobs pay below
the state’s current average wage
Note: all figures are based on December 2014 data; excludes Agriculture and Mining related sectors
Measured as total wages & disbursements divided by total employees in industry
Industries
with growing
employment
(2004-2014)
Industries
with
shrinking
employment
(2004-2014)
$54,018
$75,246
Average wage Fastest changing industries
▪ Educational Services
▪ Accommodation and
Food Services
▪ Health Care and
Social Assistance
▪ Manufacturing
▪ Information
▪ Construction
$65K, CT current average wage
FORCES ARE RESHAPING CONNECTICUT’S CORE SECTORS

14 |
Connecticut job creation by age of firm
Number of jobs
Job creation by young companies in recent years has not
returned to pre-recession levels
SOURCE: U.S. Census Longitudinal Business Database
2004 2006 2008 2010 2012 2014
70,000
0
100,000
90,000
120,000
110,000
80,000
130,000
60,000
> 5 years 0 to 5
0-5 year old firms accounted for 33% of total firms and 54% of jobs created in
2013, ranking Connecticut 40th (lowest) in the U.S.
NOTE: Excludes data for companies where establishment data is unknown (~10-15% of total Connecticut firms)
2004 2006 2008 2010 2012 2014
25,000
0
40,000
30,000
45,000
35,000
50,000
> 5 years 0 to 5
2004 2006 2008 2010 2012 2014
40,000
45,000
50,000
0
35,000
30,000
25,000
0 to 5 > 5 years
Connecticut firms by age
Number of firms
FORCES ARE RESHAPING CONNECTICUT’S CORE SECTORS

15 | SOURCE: Moody’s Analytics, US Bureau of Labor Statistics
FORCES ARE RESHAPING CONNECTICUT’S CORE SECTORS
However, Manufacturing, Finance and Insurance remain
competitive growth engines for Connecticut
Connecticut projected sector performance (2014-2023) compared to specialization
0
0.5
1.0
1.5
2.0
2.5
3.0
3.5
4.0
4.5
5.0
1.60 1.15 1.10 0.95 0.90 0.80 0 1.05 1.00 0.85 1.50 1.40 1.35 1.30 1.25 1.20 1.55 1.45
Connecticut GDP growth CAGR, 2014-2023 Percent
Retail trade
Industry specialization as compared to US overall (LQ), 2014
Construction
Arts and entertainment
Transportation & warehousing
Information
Management
Education
Health care
Wholesale trade
Professional services
Manufacturing
Finance & insurance
Admin.; support; waste
Government
Accommodation & food
Majority
non-tradable
Majority
tradable
Semi
tradable
Size represents
2014 GDP
Projected
US GDP
Growth
Rate

16 |
Emerging trends have created a new economic normal and
pose challenges for the state’s competitiveness
Global and national forces are reshaping Connecticut’s
traditional core sectors
Peers are closing the gap on Connecticut’s livability
and cost advantages
Population trends are reshaping Connecticut’s
workforce
Perceptions are hardening on state governance and
fiscal uncertainty
A NEW ECONOMIC NORMAL FOR CONNECTICUT

17 | SOURCE: U.S. Department of Justice, FBI Uniform Crime Reporting Statistics
While Connecticut has always been safe and livable,
peers have closed the gap
Violent crime rate, 1985-2012
200
400
600
800
1,000
1,200
1,400
1,600
1,800
2,000
2,200
2,400
NYC
Boston
2012 2005 1995
CT
1985
PEERS ARE CLOSING THE GAP ON CONNECTICUT’S ADVANTAGES
Number of violent crimes per 100k residents

18 | SOURCE: Federation of Tax Administrators (2016); U.S. Census; Tax Foundation
Connecticut’s tax rates are higher than U.S. averages and,
in some cases, peers
Statutory tax rates by state, 2015
PEERS ARE CLOSING THE GAP ON CONNECTICUT’S ADVANTAGES
Estate Tax3
Sales Tax
Personal
Income Tax1
Property
Tax2
1 Represents the highest marginal personal income tax rate
2 Mean Property Taxes on Owner-Occupied Housing as Percentage of Mean Home Value as of Calendar Year 2011
3 Tax Foundation data
U.S. Avg.
5.1%
Connecticut All other states XX% CT rate Massachusetts New York
39th
35th U.S. Avg.
5.5%
CT-6.4%
CT-6.7%
U.S. Avg.
1.1%
CT-1.5%
40th
U.S. Avg.
4.3%
38th CT-12%
CT state rank

19 |
Connecticut’s urban cores underperform
rest of State on key livability questions
% of respondents satisfied in area
in which they live
% of respondents saying their area
and quality of life is “worsening”
80% 90% 82% 82% 68%
24%
14%
27% 20% 21%
% of respondents saying area does
not have adequate goods and
services to meet needs
40%
21% 30%
17% 24%
% of respondents saying they are
NOT able to obtain suitable
employment
60% 67%
42% 49% 50%
SOURCE: CT Data Haven, Apr-Oct 2015
Suburban1 Rural2
Urban
Periphery3 Urban Core
NOTE: Survey based on 16,219 responses—28% suburban, 13% rural residents, 38% urban periphery, 17% urban core residents, 5% “wealthy”
1 Includes locations such as North Haven and Granby located near larger urban centers 2 Includes locations such as Putnam and Sharon located
farther from an urban core 3 Includes locations such as Norwalk and East Haven located around urban cores
Lowest performing
Best performing
CT overall
PEERS ARE CLOSING THE GAP ON CONNECTICUT’S ADVANTAGES

20 |
Livability metrics by city, 2014
Quality of life measures vary widely
across Connecticut’s cities
SOURCE: Social Science Research Council; FBI U.S. Crime Database,
US Department of Housing and Urban Development; ACS 2014,
US Department of Education
Insurance coverage
% of population without health
insurance
School ranking
Nationally of 13,506 school districts1
Crime rates
Violent crime per 100k residents
Cost of living
Median gross rent as a percentage
of household income
Homelessness
Percent of total population
NOTE: Quartiles are determined using cities >50,000 residents 1 School ranking calculated through surveys, health, safety, student culture, diversity and
state test scores 2 Unemployment based on ACS 2014 one year survey estimate for purposes of comparison with city-level data
Unemployment2
Percent
8.5%
-
263
31.9%
0.13%
Stamford
17.3%
1,318
240
32.5%
0.31%
Hartford
15.5%
7,499
1,104
36.2%
0.57%
New Haven
12.3%
6,002
1,054
36.4%
ND
Bridgeport
20.3%
10,196
905
37.4%
0.30%
Waterbury
12.6%
9,021
373
35.2%
1.57%
Norwalk
17.0%
2,717
296
30.3%
0.28%
7.9% 9.3% 19.4% 11.2% 14.6% ND 8.5%
Top quartile
Middle 50%
Bottom quartile
CT overall
PEERS ARE CLOSING THE GAP ON CONNECTICUT’S ADVANTAGES

21 |
Connecticut freeway commute times by urban area, 2014 Annual auto delays by urban area, 2014
Many of Connecticut’s auto commuters face significant
congestion challenges
SOURCE: Texas A&M Urban Mobility Scorecard
1 Based on the commuter stress index: the ratio of peak period (in peak direction) versus free flow travel time
2 Based on the planning time index: the ratio of peak period versus free flow time including buffer to ensure 95% on-time arrival
3 Top 101 US urban areas ranked by planning time index, from longest to shortest additional travel time
176%
188% 232% Bridgeport-
Stamford 44%
19% 105%
Springfield
MA 65% 14%
Worcester
MA 15%
New Haven
51%
71% 56%
86%
Hartford 130% 23% 107%
New York-
New Jersey 215% 39%
5
11
38
58
86
90
Freeway
congestion rank3
(out of 101 urban
areas)
Avg. rush hour1 Buffer to arrive on time2
43
64
40
45
74
49
Boston, MA
New York-
New Jersey
New Haven
Providence,
RI
Hartford CT
Bridgeport-
Stamford
Annual hours of
delay per auto
commuter
Rank
(of 101
urban
areas)
4
6
35
Medium-
size urban
area rank
29 5
19 2
49 11
Example:
In New Haven, rush
hour commute takes
an average 19%
longer (e.g., 36 vs 30
minutes)
To be sure to arrive
on time, you must
depart 105% earlier
during peak vs. non
peak periods (e.g., 62
vs. 30 minutes)
Urban
area
Percent additional time required during peak travel
compared to free flow periods
PEERS ARE CLOSING THE GAP ON CONNECTICUT’S ADVANTAGES

22 |
Emerging trends have created a new economic normal and
pose challenges for the state’s competitiveness
Global and national forces are reshaping Connecticut’s
traditional core sectors
Peers are closing the gap on Connecticut’s livability
and cost advantages
Population trends are reshaping Connecticut’s
workforce
Perceptions are hardening on state governance and
fiscal uncertainty
A NEW ECONOMIC NORMAL FOR CONNECTICUT

23 |
Connecticut population change, 2001-2014
SOURCE: U.S. Census Bureau Population Estimate Program; Internal Revenue
Service 2013; U.S. Census American Community Survey
-17 -21
-8-13
-17
-27
15 11 12 11 1116 16 19
98 9 13 12
76
-7
2014 2005
5
2009 2003 2013 2011 2007
0
2001
Births less deaths
Net domestic migration
Net international migration
0.4% 0.3% 0.1% -0.1% 0.5% 0.6% 0.1% 0.1%
% net change in total population
Population in thousands
Post 9/11 & economic expansion Recession & recovery
Connecticut’s population growth has been negligible,
driven by high domestic out-migration
POPULATION TRENDS AND RESHAPING CONNECTICUT'S WORKFORCE
NOTE: Population data is unavailable for 2010

24 |
Three of the top six MSAs losing the greatest percentage of
their population to other states are in Connecticut
SOURCE: Bloomberg analysis of U.S. Census data, 2013-14 data
The cities Americans are leaving, 2013-2014
Note: This data only looks at out-migration. Many of these cities also attract significant volumes of inward-migration
POPULATION TRENDS AND RESHAPING CONNECTICUT'S WORKFORCE
Percent of resident out-migration, top 20 out of 100 cities

25 |
Connecticut is losing young and educated people to other
states
-5,928
-3,805
987
-1,837
No high school diploma
Some college or
associate's degree
Bachelor's
High school graduate
Graduate
846
921
1 to 17 4,691
18 to 24 -7,709
25 to 34
35 to 44
-4,571
-5,198
-889
Age 65+
45 to 64
SOURCE: U.S. Census 2014 American Community Survey
Net domestic migration by age, 2014 Net domestic migration by education, 2014
POPULATION TRENDS AND RESHAPING CONNECTICUT'S WORKFORCE
Population 25 years and older Population 1 year and older

26 |
Poverty rate, 2010-2014
SOURCE: 2010-2014 American Community Survey 5-Year Estimates
% of population living below the poverty level
While Connecticut has a lower poverty rate than the
US, it has been growing at a higher rate
POPULATION TRENDS AND RESHAPING CONNECTICUT'S WORKFORCE
10.510.210.09.5
15.615.414.9
14.313.8
2012 2010 2012 2013
9.2
2014
CT
US
US CAGR, 2010-2014:
3.1%
CT CAGR, 2010-2014:
3.4%

27 |
Emerging trends have created a new economic normal and
pose challenges for the state’s competitiveness
Global and national forces are reshaping Connecticut’s
traditional core sectors
Peers are closing the gap on Connecticut’s livability
and cost advantages
Population trends are reshaping Connecticut’s
workforce
Perceptions are hardening on state governance and
fiscal uncertainty
A NEW ECONOMIC NORMAL FOR CONNECTICUT

28 |
Four factors are feeding the perception of a
“negative business climate” in Connecticut
PERCEPTIONS ARE HARDING ON GOVERNANCE AND FISCAL UNCERTAINTY
Factors affecting the State and
national discussion on
Connecticut’s business climate
1. Fiscal fundamentals
2. Negative national publicity
3. Unpredictable governance
4. Perceived lack of engagement
Connecticut's
ranking nation-wide
in cost of doing
business (2015)
“[Businesses] say increasing pension
costs borne by the state government
could trigger tax increases that could
scare off companies in the state or
those looking to relocate” - 1/2016
“Immelt said the company's ‘taxes have
been raised five times since 2011, while
support for our strategies has been
uneven.’” - 6/2015
45th
47th

29 |
To address these trends and ensure long-term competitiveness,
Connecticut can build on its distinctive assets
▪ 7th in the country in number of S&P 500 headquarters
▪ 3.3% of all Fortune 1000 companies by revenue are in
Connecticut vs. 2.0% in Massachusetts and 2.9% in New Jersey
▪ Growing sub-sectors of strength, e.g., aerospace added 1,400
jobs in 2015
Talented population
▪ 6th best K-12 education system based on test scores and
funding levels, and #1 in some national rankings
▪ 7th highest AP participation rate in county, and 2nd highest
percentage of students scoring 3 or higher
▪ 50+% of enrolled college students attend a public institution
Strong education
system
Blue-chip companies
and growth sectors
▪ 38% of those 25+ have at least a bachelor's degree vs. 30%
nationwide
▪ 3rd highest productivity in the country
CONNECTICUT’S DISTINCTIVE ASSETS
SOURCE: US Census; BLS; Education Week; Smart Asset; IPEDS; S&P Capital IQ; Fortune Magazine

30 |
To address these trends and ensure long-term competitiveness,
Connecticut can build on its distinctive assets
▪ 40% lower cost per sq. ft. of housing in Stamford vs. NYC
▪ 7th busiest Interstate system in the US by number of cars
▪ ~40+M Metro-North New Haven Line and ~11.5M Amtrak train
ridership each year
Strong research
output
▪ #3 in quality of life of any US state (Forbes)
▪ 3rd highest life expectancy in the US at 81 years
▪ 2nd lowest among peers in violent crime rates, 9th nation-wide
High quality of life
Strategic location
▪ 8th in the U.S. on R&D as a share of GDP
▪ Academic research surged 38% from ’09 to ’13, moving CT from
32nd to 12th in the U.S. on academic R&D spend
CONNECTICUT’S DISTINCTIVE ASSETS
SOURCE: National Science Foundation; Social Science Research Council; Forbes; FBI; Zillow; Federal
Highway Adminstration

31 |
Potential themes for the Commission to consider exploring
THEMES TO EXPLORE
Growth sectors: How can Connecticut
support its high potential, fast-changing
sectors?
Skills & workforce development
Enabling infrastructure (e.g., broadband)
Modernized and aligned tax code and
regulatory/incentive regime
Transportation: What investments will
best connect talent and businesses?
Performance and expansion aligned with
growth priorities
Funding certainty
Access to jobs
Cities: How should CT revitalize its
urban cores?
Urban appeal and attraction of young talent
Economic opportunities for all
Entrepreneurship
Public-private engagement: How can
the State and the private sector
collaborate to jointly support long-term
growth?
Reignited dialogue, trust, and commitment
Sector- and opportunity-specific partnerships
Co-ownership of initiatives
Fiscal confidence: How can
Connecticut address its pension and
budget challenges to restore business
confidence?
Pension sustainability
Budget stability

32 |
The Connecticut Economic Competitiveness diagnostic:
Key takeaways
Connecticut has had a long run of strong economic performance, making it a great state to
live and work
Recent trends have created a new economic normal and pose challenges for the state’s
competitiveness
– A. Global and national forces are reshaping Connecticut’s traditional core sectors
– B. Peers are closing the gap on Connecticut’s livability and cost advantages
– C. Population trends are reshaping Connecticut’s workforce
– D. Perceptions are hardening on state governance and fiscal uncertainty
Connecticut has a portfolio of distinctive assets to address these trends and ensure long-
term competitiveness
Five themes have emerged as potential areas for the Commission to consider exploring
in further detail
– 1. Cities: How should Connecticut revitalize its urban cores?
– 2. Growth sectors: How can Connecticut support its high potential, fast-changing sectors?
– 3. Transportation: What investments will best connect talent and businesses?
– 4. Fiscal outlook: How can Connecticut address its pension and budget challenges to
restore business confidence?
– 5. Public-private engagement: How can the State and the private sector collaborate to
jointly support long-term growth?

33 |
Thank you