connecticut labor force data for affirmative action plans · labor force data for affirmative...
TRANSCRIPT

Connecticut Department of Labor - Office of Research - Labor Market Information
ConnecticutConnecticutConnecticut Labor Force Labor Force Labor Force
Data for Data for Data for Affirmative Affirmative Affirmative
Action PlansAction PlansAction Plans
111ststst Qtr Qtr Qtr --- 2010 2010 2010
“All of us do not have equal talent, but all of us should have an equal opportunity
to develop our talents.” John F. Kennedy

Connecticut Data for Affirmative Action Plans ~ 1st Quarter 2010
Connecticut Data for Affirmative Action Plans
Connecticut Data for Affirmative Action Plans provides labor force information for Connecticut and its nine labor market areas (LMAs). The data presented are designed to meet the requirements of the Office of Federal Contract Compliance Programs (OFCCP) and/or the Connecticut Commission on Human Rights and Opportunities (CHRO) for companies, State agencies, and municipalities that submit an Affirmative Action Plan. If you are completing an Affirmative Action Plan for a private company and you require regulations/guidelines to assist you in setting up your plan, please contact the OFCCP at (860) 240-4277. If you are completing an Affirmative Action Plan for a State agency, municipality, or any political subdivision, and you require regulation guidelines for setting up your plan, please contact the CHRO, Office of Diversity Programs at (860) 541-3400 or visit their contract compliance website at: http://www.ct.gov/chro/taxonomy/ct_taxonomy.asp?DLN=45583&chroNav=l45585l To order Equal Employment Opportunity posters at no charge, please contact either the OFCCP or the CHRO at the numbers listed above. If you need a listing of minority/female owned businesses, visit the Department of Administrative Services, Supplier Diversity Program’s website at: http://www.biznet.ct.gov/DASOpenAccess/SupplierDiversity/SDSearch.aspx Acknowledgement: John B. Toomey, Jr., Dana W. Placzek, and Todd Bentsen prepared this report for publication.
This publication is available online at: www.ct.gov/dol
‘Labor Market Information’

Connecticut Department of Labor - Office of Research - Labor Market Information
Connecticut Data for Affirmative Action Plans TABLE OF CONTENTS
Connecticut Map .................................................................................................................................................... 1 Shows boundaries and town composition of Connecticut’s labor market areas Estimated Total, Minority and Female Unemployment ..................................................................................... 2 Includes estimates of total State unemployment and of unemployed job seekers registered with CTWorks Career Centers Connecticut Job Seekers by Occupational Group .............................................................................................. 3 A graph showing the proportion of job seekers by major occupational group Characteristics of Job Seekers (Statewide and LMAs) ....................................................................................... 4-43 Provides information on the broad occupational skills of job seekers, including female and minority job seekers, registered with CTWorks Career Centers
CONNECTICUT - STATEWIDE .................................................................................................................. 4-7
Bridgeport-Stamford Labor Market Area .................................................................................................... 8-11
Danbury Labor Market Area ......................................................................................................................... 12-15
Enfield Labor Market Area ............................................................................................................................ 16-19
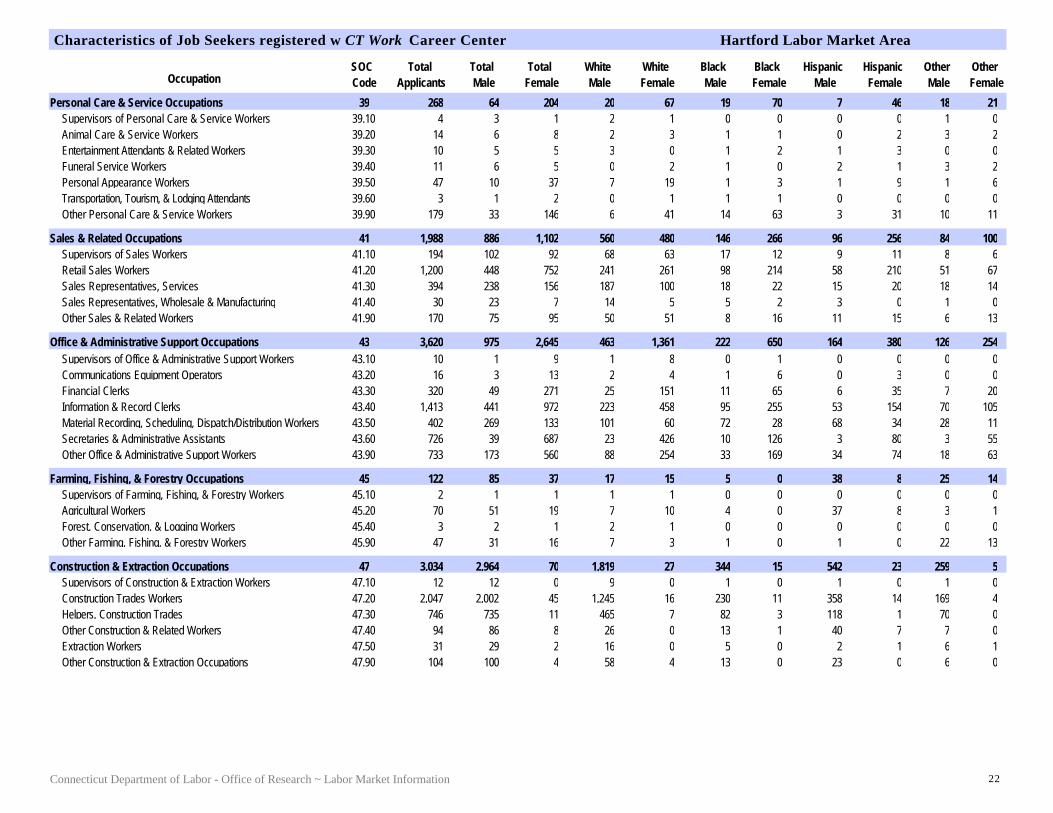
Hartford Labor Market Area ......................................................................................................................... 20-23
New Haven Labor Market Area ..................................................................................................................... 24-27
Norwich-New London Labor Market Area .................................................................................................. 28-31
Torrington Labor Market Area ..................................................................................................................... 32-35
Waterbury Labor Market Area ..................................................................................................................... 36-39
Willimantic-Danielson Labor Market Area .................................................................................................. 40-43

Connecticut Data for Affirmative Action Plans ~ 1st Quarter 2010 1

Connecticut Department of Labor - Office of Research - Labor Market Information 2
Estimated Total, Minority and Women Unemployment of Job Seekers Registered at CTWorks Career Centers by Labor Market Area
March 2010
TOTAL MINORITY UNEMPLOYED WOMEN UNEMPLOYED
Labor Force
UnemployedUnemployment
RateTotal
% of Total Unemployed
Black Hispanic Total% of Total
UnemployedMinority Black Hispanic
BRIDGEPORT-STAMFORD 478,100 40,600 8.5 23,420 57.7 9,940 8,700 17,400 42.9 10,310 4,870 3,400
DANBURY 90,600 7,300 8.1 1,990 27.2 420 830 3,000 41.2 810 200 320
ENFIELD 49,300 4,400 8.8 1,240 28.3 270 510 1,640 37.2 430 120 140
HARTFORD 600,700 56,900 9.5 28,670 50.4 11,360 10,820 23,180 40.7 12,460 5,340 4,490
NEW HAVEN 317,000 29,400 9.3 13,630 46.4 5,700 5,040 11,930 40.6 5,800 2,750 1,860
NORWICH-NEW LONDON 139,700 12,200 8.7 3,870 31.7 1,470 1,050 5,100 41.8 1,760 690 490
TORRINGTON 54,300 5,400 9.9 1,010 18.8 160 300 1,920 35.6 400 50 150
WATERBURY 102,000 12,800 12.6 5,660 44.2 1,950 2,470 5,140 40.2 2,490 880 1,150
WILLIMANTIC-DANIELSON 59,300 6,300 10.6 1,300 20.6 200 570 2,440 38.8 540 80 270
STATE TOTAL 1,891,100 175,300 9.3 76,260 43.5 28,820 28,840 71,210 40.6 32,870 13,650 11,730
NOTE: State totals may not agree with the sum of these areas because they are estimated independentlySOURCE: Connecticut Department of Labor - Office of Research
LABOR MARKET

Connecticut Data for Affirmative Action Plans ~ 1st Quarter 2010 3
Service16%
Sales & Related10%
Production12%
Management, Business, & Financial
10%
Professional & Related
11%
Office & Administrative Support
16%
Farming, Fishing,
& Forestry1%
Installation, Maintenance,
& Repair4%
Construction & Extraction
12%
Military-Specific0%
Transportation & Material Moving
6%
Professional & Related Occupational Category Computer & Mathematical Architecture & Engineering Life, Physical, & Social Science Community & Social Services Legal Education, Training, & Library Arts, Design, Entertainment, Sports, & Media Healthcare Practitioners & Technical
Service Occupational Category Healthcare Support Protective Service Food Preparation & Serving Related Building & Grounds Cleaning & Maintenance Personal Care & Service
Production Occupational Category Assembling & Fabricating Food Processing Metal & Plastic Printing Textile, Apparel, & Furnishings Woodworking Plant & System Operation
Connecticut Job Seekers by Occupational Category 1st Quarter 2010

Connecticut - StatewideCharacteristics of Job Seekers registered w CT Work Career Center
SOC CodeOccupation
Total Applicants
Total Male
Total Female
White Male
White Female
Black Male
Black Female
Hispanic Male
Hispanic Female
Other Male
Other Female
00Total - All Occupations 86,171 51,167 35,004 29,839 18,847 7,453 6,712 8,408 5,768 5,467 3,677
11Management Occupations 5,322 2,987 2,335 2,330 1,732 217 206 197 201 243 19611.10Top Executives 2,022 1,217 805 955 599 76 63 66 69 120 7411.20Advertising, Marketing, Promotions, Public Rel. Occupations 825 498 327 392 252 41 22 33 26 32 2711.30Operations Specialties Managers 914 335 579 267 430 30 56 17 43 21 5011.90Other Management Occupations 1,561 937 624 716 451 70 65 81 63 70 45
13Business & Financial Operations Occupations 2,508 1,136 1,372 812 885 150 236 72 113 102 13813.10Business Operations Specialists 865 395 470 302 316 43 79 21 32 29 4313.20Financial Specialists 1,185 562 623 386 391 75 102 36 53 65 7713.90Other Business & Financial Operations Occupations 458 179 279 124 178 32 55 15 28 8 18
15Computer & Mathematical Occupations 1,586 1,098 488 720 276 129 63 74 40 175 10915.10Computer Specialists 1,373 966 407 656 251 116 59 68 32 126 6515.20Mathematical Scientists 20 11 9 6 4 4 0 1 2 0 315.90Other Computer & Mathematical Occupations 193 121 72 58 21 9 4 5 6 49 41
17Architecture & Engineering Occupations 1,315 1,090 225 810 147 80 21 76 22 124 3517.10Architects, Surveyors, & Cartographers 112 86 26 68 18 8 0 5 3 5 517.20Engineers 815 683 132 507 87 46 12 38 10 92 2317.30Drafters, Engineering, & Mapping Technicians 332 279 53 205 33 22 6 29 8 23 617.90Other Architecture & Engineering Occupations 56 42 14 30 9 4 3 4 1 4 1
19Life, Physical, & Social Science Occupations 426 199 227 144 152 13 19 10 24 32 3219.10Life Scientists 39 19 20 15 11 0 3 1 3 3 319.20Physical Scientists 54 35 19 26 13 1 1 0 1 8 419.30Social Scientists & Related Workers 220 88 132 66 95 7 9 2 12 13 1619.40Life, Physical, & Social Science Technicians 60 34 26 23 12 2 4 5 6 4 419.90Other Life, Physical, & Social Science Occupations 53 23 30 14 21 3 2 2 2 4 5
21Community & Social Services Occupations 979 361 618 126 247 138 207 59 107 38 5721.10Counselors, Social Workers, Other Cmmty./Soc. Svcs. Workers 718 248 470 87 178 105 182 29 71 27 3921.20Religious Workers 20 6 14 4 6 1 2 1 4 0 221.90Other Community & Social Services Occupations 241 107 134 35 63 32 23 29 32 11 16
23Legal Occupations 394 100 294 64 200 11 45 11 27 14 2223.10Lawyers, Judges, & Related Workers 106 53 53 37 37 3 9 5 0 8 723.20Legal Support Workers 233 30 203 17 141 5 30 4 19 4 1323.90Other Legal Occupations 55 17 38 10 22 3 6 2 8 2 2
4Connecticut Department of Labor - Office of Research ~ Labor Market Information

Connecticut - StatewideCharacteristics of Job Seekers registered w CT Work Career Center
SOC CodeOccupation
Total Applicants
Total Male
Total Female
White Male
White Female
Black Male
Black Female
Hispanic Male
Hispanic Female
Other Male
Other Female
25Education, Training, & Library Occupations 925 249 676 136 360 49 137 34 125 30 5425.10Postsecondary Teachers 173 65 108 33 35 13 36 10 26 9 1125.20Primary, Secondary & Special Education Teachers 276 75 201 51 136 7 29 12 19 5 1725.30Other Teachers & Instructors 88 26 62 14 36 8 13 1 11 3 225.40Librarians, Curators, & Archivists 13 5 8 1 4 1 0 1 2 2 225.90Other Education, Training, & Library Occupations 375 78 297 37 149 20 59 10 67 11 22
27Arts, Design, Entertainment, Sports, & Media Occupations 813 428 385 285 287 52 40 48 22 43 3627.10Art & Design Workers 395 193 202 137 157 17 17 22 7 17 2127.20Entertainers & Performers, Sports & Related Workers 65 46 19 29 12 6 5 5 2 6 027.30Media & Communication Workers 231 115 116 80 91 16 12 5 2 14 1127.40Media & Communication Equipment Workers 62 43 19 24 10 7 1 9 6 3 227.90Other Arts, Design, Entertainment, Sports, & Media Workers 60 31 29 15 17 6 5 7 5 3 2
29Healthcare Practitioners & Technical Occupations 1,298 295 1,003 165 586 66 235 21 103 43 7929.10Health Diagnosing & Treating Practitioners 417 72 345 44 245 8 51 3 23 17 2629.20Health Technologists & Technicians 685 171 514 100 289 37 133 15 56 19 3629.90Other Healthcare Practitioners & Technical Occupations 196 52 144 21 52 21 51 3 24 7 17
31Healthcare Support Occupations 3,493 411 3,082 152 1,127 162 1,127 60 570 37 25831.10Nursing, Psychiatric, & Home Health Aides 2,318 241 2,077 74 670 110 851 37 373 20 18331.20Occupational & Physical Therapist Assistants & Aides 14 5 9 2 3 3 2 0 3 0 131.90Other Healthcare Support Occupations 1,161 165 996 76 454 49 274 23 194 17 74
33Protective Service Occupations 729 577 152 277 47 167 58 95 32 38 1533.10First-Line Supervisors/Mgrs. of Protective Service Workers 5 4 1 2 0 1 0 0 0 1 133.20Fire Fighting & Prevention Workers 12 12 0 8 0 3 0 1 0 0 033.30Law Enforcement Workers 85 64 21 34 7 14 10 12 4 4 033.90Other Protective Service Workers 627 497 130 233 40 149 48 82 28 33 14
35Food Preparation & Serving Related Occupations 4,123 2,251 1,872 967 1,093 582 317 483 293 219 16935.10Supervisors of Food Preparation & Serving Workers 407 328 79 200 51 52 9 44 12 32 735.20Cooks & Food Preparation Workers 1,629 1,107 522 404 228 331 126 275 125 97 4335.30Food & Beverage Serving Workers 1,612 534 1,078 266 724 114 132 94 123 60 9935.90Other Food Preparation & Serving Related Workers 475 282 193 97 90 85 50 70 33 30 20
37Building & Grounds Cleaning & Maintenance Occupations 3,741 3,024 717 1,387 260 355 124 1,063 267 219 6637.10Supervisors of Bldg./Grounds Cleaning & Maintenance Workers 91 66 25 30 11 18 6 17 6 1 237.20Building Cleaning & Pest Control Workers 1,228 670 558 218 179 176 111 221 217 55 5137.30Grounds Maintenance Workers 2,206 2,099 107 1,066 65 110 3 772 28 151 1137.90Other Building/Grounds Cleaning & Maintenance Occupations 216 189 27 73 5 51 4 53 16 12 2
5Connecticut Data for Affirmative Action Plans ~ 1st Quarter 2010

Connecticut - StatewideCharacteristics of Job Seekers registered w CT Work Career Center
SOC CodeOccupation
Total Applicants
Total Male
Total Female
White Male
White Female
Black Male
Black Female
Hispanic Male
Hispanic Female
Other Male
Other Female
39Personal Care & Service Occupations 975 237 738 107 352 59 186 30 127 41 7339.10Supervisors of Personal Care & Service Workers 14 9 5 7 4 1 0 0 0 1 139.20Animal Care & Service Workers 29 10 19 3 12 2 1 1 2 4 439.30Entertainment Attendants & Related Workers 123 73 50 44 25 9 10 8 9 12 639.40Funeral Service Workers 30 18 12 8 6 2 0 3 1 5 539.50Personal Appearance Workers 189 27 162 14 105 3 12 8 27 2 1839.60Transportation, Tourism, & Lodging Attendants 12 4 8 3 3 1 2 0 2 0 139.90Other Personal Care & Service Workers 578 96 482 28 197 41 161 10 86 17 38
41Sales & Related Occupations 7,613 3,571 4,042 2,329 2,120 572 842 359 765 311 31541.10Supervisors of Sales Workers 704 400 304 284 223 48 36 32 28 36 1741.20Retail Sales Workers 4,613 1,824 2,789 1,024 1,285 379 671 230 626 191 20741.30Sales Representatives, Services 1,345 823 522 655 367 70 58 47 56 51 4141.40Sales Representatives, Wholesale & Manufacturing 156 123 33 93 24 14 5 9 3 7 141.90Other Sales & Related Workers 795 401 394 273 221 61 72 41 52 26 49
43Office & Administrative Support Occupations 13,339 3,816 9,523 2,033 5,730 755 1,760 519 1,115 509 91843.10Supervisors of Office & Administrative Support Workers 66 8 58 7 45 0 4 0 6 1 343.20Communications Equipment Operators 35 7 28 4 7 1 10 0 9 2 243.30Financial Clerks 1,182 158 1,024 98 683 27 164 11 98 22 7943.40Information & Record Clerks 5,104 1,724 3,380 940 1,769 308 738 186 467 290 40643.50Material Recording, Scheduling, Dispatch/Distribution Workers 1,396 971 425 432 227 246 83 212 85 81 3043.60Secretaries & Administrative Assistants 2,820 145 2,675 87 1,890 25 352 15 226 18 20743.90Other Office & Administrative Support Workers 2,736 803 1,933 465 1,109 148 409 95 224 95 191
45Farming, Fishing, & Forestry Occupations 554 397 157 103 63 11 4 209 54 74 3645.10Supervisors of Farming, Fishing, & Forestry Workers 8 4 4 4 2 0 0 0 0 0 245.20Agricultural Workers 393 291 102 65 46 7 3 204 51 15 245.30Fishing & Hunting Workers 6 6 0 4 0 1 0 0 0 1 045.40Forest, Conservation, & Logging Workers 7 5 2 5 2 0 0 0 0 0 045.90Other Farming, Fishing, & Forestry Workers 140 91 49 25 13 3 1 5 3 58 32
47Construction & Extraction Occupations 10,835 10,586 249 7,083 135 904 42 1,663 51 936 2147.10Supervisors of Construction & Extraction Workers 40 39 1 32 1 3 0 1 0 3 047.20Construction Trades Workers 7,635 7,485 150 5,028 81 613 23 1,149 32 695 1447.30Helpers, Construction Trades 2,305 2,261 44 1,532 26 187 9 372 6 170 347.40Other Construction & Related Workers 240 221 19 99 4 34 3 71 10 17 247.50Extraction Workers 83 81 2 43 0 11 0 5 1 22 147.90Other Construction & Extraction Occupations 532 499 33 349 23 56 7 65 2 29 1
6Connecticut Department of Labor - Office of Research ~ Labor Market Information

Connecticut - StatewideCharacteristics of Job Seekers registered w CT Work Career Center
SOC CodeOccupation
Total Applicants
Total Male
Total Female
White Male
White Female
Black Male
Black Female
Hispanic Male
Hispanic Female
Other Male
Other Female
49Installation, Maintenance, & Repair Occupations 3,117 3,000 117 1,903 43 377 26 482 33 238 1549.10Supervisors of Installation, Maintenance, & Repair Workers 29 26 3 20 2 3 1 1 0 2 049.20Electrical & Electronic Equipment Mechanics, Installers 348 330 18 217 7 53 4 37 3 23 449.30Vehicle & Mobile Equipment Mechanics, Installers, Repairers 777 769 8 507 3 64 2 126 2 72 149.90Other Installation, Maintenance & Repair Occupations 1,963 1,875 88 1,159 31 257 19 318 28 141 10
51Production Occupations 9,497 6,643 2,854 3,255 1,203 1,142 375 1,556 942 690 33451.10Supervisors of Production Workers 30 27 3 22 2 3 0 1 1 1 051.20Assemblers & Fabricators 228 142 86 66 38 33 13 32 27 11 851.30Food Processing Workers 183 96 87 47 54 20 12 11 17 18 451.40Metal Workers & Plastic Workers 3,363 2,667 696 1,392 286 348 74 635 249 292 8751.50Printing Workers 277 236 41 154 27 30 1 37 11 15 251.60Textile, Apparel, & Furnishings Workers 151 48 103 16 48 10 4 18 39 4 1251.70Woodworkers 46 44 2 30 1 1 0 10 1 3 051.80Plant & System Operators 36 32 4 23 3 2 0 2 1 5 051.90Other Production Occupations 5,183 3,351 1,832 1,505 744 695 271 810 596 341 221
53Transportation & Material Moving Occupations 4,812 4,025 787 1,994 252 895 151 812 316 324 6853.10Supervisors of Transportation & Material Moving Workers 30 24 6 19 4 2 1 2 1 1 053.20Air Transportation Workers 19 16 3 14 0 0 1 1 1 1 153.30Motor Vehicle Operators 2,772 2,462 310 1,329 126 528 84 401 69 204 3153.40Rail Transportation Workers 6 6 0 1 0 3 0 1 0 1 053.50Water Transportation Workers 18 14 4 10 4 1 0 3 0 0 053.60Other Transportation Workers 87 62 25 34 11 13 5 8 5 7 453.70Material Moving Workers 1,567 1,157 410 442 93 272 53 356 234 87 3053.90Other Transportation & Material Moving Occupations 313 284 29 145 14 76 7 40 6 23 2
55Military Specific Occupations 111 96 15 63 9 9 1 8 3 16 255.10Military Officer Special & Tactical Operations Leaders/Mgrs. 5 5 0 4 0 0 0 0 0 1 055.20First-Line Enlisted Military Supervisors/Managers 6 6 0 5 0 1 0 0 0 0 055.30Military Enlisted Tactical Operations & Air/Weapon 81 69 12 46 7 4 1 7 2 12 255.90Other Military Specific Occupations 19 16 3 8 2 4 0 1 1 3 0
99Unknown/Unclassifiable Occupations 7,666 4,590 3,076 2,594 1,541 558 490 467 416 971 62999.90Unknown/Unclassifiable Occupations 7,666 4,590 3,076 2,594 1,541 558 490 467 416 971 629
7Connecticut Data for Affirmative Action Plans ~ 1st Quarter 2010

Bridgeport-Stamford Labor Market AreaCharacteristics of Job Seekers registered w CT Work Career Center
SOC CodeOccupation
Total Applicants
Total Male
Total Female
White Male
White Female
Black Male
Black Female
Hispanic Male
Hispanic Female
Other Male
Other Female
00Total - All Occupations 13,902 7,944 5,958 3,456 2,427 1,736 1,668 1,813 1,165 939 698
11Management Occupations 949 515 434 364 285 51 60 44 50 56 3911.10Top Executives 348 206 142 148 94 22 17 11 15 25 1611.20Advertising, Marketing, Promotions, Public Rel. Occupations 184 102 82 75 60 13 8 8 9 6 511.30Operations Specialties Managers 184 61 123 46 77 4 21 5 13 6 1211.90Other Management Occupations 233 146 87 95 54 12 14 20 13 19 6
13Business & Financial Operations Occupations 521 266 255 174 123 35 64 23 32 34 3613.10Business Operations Specialists 103 54 49 36 28 10 13 3 5 5 313.20Financial Specialists 305 163 142 105 62 17 35 17 21 24 2413.90Other Business & Financial Operations Occupations 113 49 64 33 33 8 16 3 6 5 9
15Computer & Mathematical Occupations 258 202 56 105 29 34 12 23 7 40 815.10Computer Specialists 232 184 48 94 26 33 11 21 4 36 715.20Mathematical Scientists 2 1 1 0 0 0 0 1 1 0 015.90Other Computer & Mathematical Occupations 24 17 7 11 3 1 1 1 2 4 1
17Architecture & Engineering Occupations 171 138 33 86 16 13 6 21 7 18 417.10Architects, Surveyors, & Cartographers 17 11 6 7 3 1 0 2 2 1 117.20Engineers 102 83 19 58 11 6 3 6 3 13 217.30Drafters, Engineering, & Mapping Technicians 46 39 7 19 2 4 2 12 2 4 117.90Other Architecture & Engineering Occupations 6 5 1 2 0 2 1 1 0 0 0
19Life, Physical, & Social Science Occupations 93 37 56 23 35 4 6 3 5 7 1019.10Life Scientists 3 1 2 1 0 0 1 0 0 0 119.20Physical Scientists 2 0 2 0 1 0 0 0 0 0 119.30Social Scientists & Related Workers 78 31 47 21 33 3 2 1 5 6 719.40Life, Physical, & Social Science Technicians 7 4 3 0 0 1 2 2 0 1 119.90Other Life, Physical, & Social Science Occupations 3 1 2 1 1 0 1 0 0 0 0
21Community & Social Services Occupations 125 44 81 4 21 22 36 7 16 11 821.10Counselors, Social Workers, Other Cmmty./Soc. Svcs. Workers 92 29 63 4 13 14 32 2 13 9 521.90Other Community & Social Services Occupations 33 15 18 0 8 8 4 5 3 2 3
23Legal Occupations 83 15 68 10 45 0 14 2 4 3 523.10Lawyers, Judges, & Related Workers 23 10 13 7 7 0 4 0 0 3 223.20Legal Support Workers 47 4 43 3 31 0 8 1 1 0 323.90Other Legal Occupations 13 1 12 0 7 0 2 1 3 0 0
8Connecticut Department of Labor - Office of Research ~ Labor Market Information

Bridgeport-Stamford Labor Market AreaCharacteristics of Job Seekers registered w CT Work Career Center
SOC CodeOccupation
Total Applicants
Total Male
Total Female
White Male
White Female
Black Male
Black Female
Hispanic Male
Hispanic Female
Other Male
Other Female
25Education, Training, & Library Occupations 151 40 111 17 43 11 35 6 24 6 925.10Postsecondary Teachers 39 13 26 4 6 5 10 2 7 2 325.20Primary, Secondary & Special Education Teachers 35 8 27 7 16 0 6 1 3 0 225.30Other Teachers & Instructors 9 1 8 0 2 1 4 0 2 0 025.40Librarians, Curators, & Archivists 2 2 0 0 0 0 0 0 0 2 025.90Other Education, Training, & Library Occupations 66 16 50 6 19 5 15 3 12 2 4
27Arts, Design, Entertainment, Sports, & Media Occupations 175 80 95 51 64 11 9 9 8 9 1427.10Art & Design Workers 86 40 46 24 32 5 5 8 2 3 727.20Entertainers & Performers, Sports & Related Workers 10 5 5 4 4 0 0 0 1 1 027.30Media & Communication Workers 56 26 30 19 23 3 2 1 0 3 527.40Media & Communication Equipment Workers 12 7 5 4 1 1 0 0 3 2 127.90Other Arts, Design, Entertainment, Sports, & Media Workers 11 2 9 0 4 2 2 0 2 0 1
29Healthcare Practitioners & Technical Occupations 182 34 148 16 54 10 50 5 32 3 1229.10Health Diagnosing & Treating Practitioners 62 7 55 4 28 0 15 1 9 2 329.20Health Technologists & Technicians 87 20 67 10 23 7 24 3 16 0 429.90Other Healthcare Practitioners & Technical Occupations 33 7 26 2 3 3 11 1 7 1 5
31Healthcare Support Occupations 531 52 479 12 75 30 257 4 97 6 5031.10Nursing, Psychiatric, & Home Health Aides 372 36 336 8 41 22 199 3 62 3 3431.20Occupational & Physical Therapist Assistants & Aides 2 0 2 0 1 0 1 0 0 0 031.90Other Healthcare Support Occupations 157 16 141 4 33 8 57 1 35 3 16
33Protective Service Occupations 144 116 28 30 2 52 18 25 6 9 233.10First-Line Supervisors/Mgrs. of Protective Service Workers 1 1 0 0 0 0 0 0 0 1 033.20Fire Fighting & Prevention Workers 4 4 0 1 0 3 0 0 0 0 033.30Law Enforcement Workers 7 5 2 2 0 0 2 2 0 1 033.90Other Protective Service Workers 132 106 26 27 2 49 16 23 6 7 2
35Food Preparation & Serving Related Occupations 540 336 204 97 84 121 46 86 50 32 2435.10Supervisors of Food Preparation & Serving Workers 58 50 8 20 1 15 4 10 0 5 335.20Cooks & Food Preparation Workers 235 165 70 41 20 62 21 48 19 14 1035.30Food & Beverage Serving Workers 194 87 107 29 56 29 14 19 26 10 1135.90Other Food Preparation & Serving Related Workers 53 34 19 7 7 15 7 9 5 3 0
37Building & Grounds Cleaning & Maintenance Occupations 717 610 107 142 20 92 25 333 52 43 1037.10Supervisors of Bldg./Grounds Cleaning & Maintenance Workers 12 10 2 5 1 1 0 3 1 1 037.20Building Cleaning & Pest Control Workers 204 117 87 19 11 44 21 48 46 6 937.30Grounds Maintenance Workers 472 456 16 114 8 37 2 270 5 35 137.90Other Building/Grounds Cleaning & Maintenance Occupations 29 27 2 4 0 10 2 12 0 1 0
9Connecticut Data for Affirmative Action Plans ~ 1st Quarter 2010

Bridgeport-Stamford Labor Market AreaCharacteristics of Job Seekers registered w CT Work Career Center
SOC CodeOccupation
Total Applicants
Total Male
Total Female
White Male
White Female
Black Male
Black Female
Hispanic Male
Hispanic Female
Other Male
Other Female
39Personal Care & Service Occupations 143 15 128 3 37 9 51 3 29 0 1139.20Animal Care & Service Workers 1 0 1 0 1 0 0 0 0 0 039.30Entertainment Attendants & Related Workers 4 1 3 0 1 1 2 0 0 0 039.40Funeral Service Workers 2 1 1 0 0 1 0 0 0 0 139.50Personal Appearance Workers 30 3 27 2 15 1 5 0 5 0 239.60Transportation, Tourism, & Lodging Attendants 3 0 3 0 1 0 0 0 1 0 139.90Other Personal Care & Service Workers 103 10 93 1 19 6 44 3 23 0 7
41Sales & Related Occupations 1,400 665 735 362 297 167 220 86 164 50 5441.10Supervisors of Sales Workers 107 57 50 33 33 10 10 10 5 4 241.20Retail Sales Workers 865 339 526 147 176 110 178 51 140 31 3241.30Sales Representatives, Services 254 172 82 125 50 27 13 12 10 8 941.40Sales Representatives, Wholesale & Manufacturing 29 23 6 17 3 3 2 1 1 2 041.90Other Sales & Related Workers 145 74 71 40 35 17 17 12 8 5 11
43Office & Administrative Support Occupations 2,525 737 1,788 297 837 210 486 109 273 121 19243.10Supervisors of Office & Administrative Support Workers 10 1 9 1 4 0 3 0 2 0 043.20Communications Equipment Operators 7 0 7 0 0 0 2 0 5 0 043.30Financial Clerks 227 38 189 19 93 10 52 4 28 5 1643.40Information & Record Clerks 906 298 608 125 208 72 212 36 110 65 7843.50Material Recording, Scheduling, Dispatch/Distribution Workers 248 178 70 46 22 72 23 41 18 19 743.60Secretaries & Administrative Assistants 623 38 585 21 350 6 107 5 67 6 6143.90Other Office & Administrative Support Workers 504 184 320 85 160 50 87 23 43 26 30
45Farming, Fishing, & Forestry Occupations 38 26 12 4 4 2 0 16 4 4 445.10Supervisors of Farming, Fishing, & Forestry Workers 2 1 1 1 0 0 0 0 0 0 145.20Agricultural Workers 18 16 2 1 1 1 0 14 1 0 045.30Fishing & Hunting Workers 1 1 0 1 0 0 0 0 0 0 045.40Forest, Conservation, & Logging Workers 1 1 0 1 0 0 0 0 0 0 045.90Other Farming, Fishing, & Forestry Workers 16 7 9 0 3 1 0 2 3 4 3
47Construction & Extraction Occupations 1,333 1,306 27 653 8 166 8 359 7 128 447.10Supervisors of Construction & Extraction Workers 7 7 0 6 0 1 0 0 0 0 047.20Construction Trades Workers 968 952 16 490 4 109 4 246 5 107 347.30Helpers, Construction Trades 252 247 5 114 3 30 0 91 1 12 147.40Other Construction & Related Workers 23 22 1 4 0 7 1 7 0 4 047.50Extraction Workers 3 3 0 3 0 0 0 0 0 0 047.90Other Construction & Extraction Occupations 80 75 5 36 1 19 3 15 1 5 0
10Connecticut Department of Labor - Office of Research ~ Labor Market Information

Bridgeport-Stamford Labor Market AreaCharacteristics of Job Seekers registered w CT Work Career Center
SOC CodeOccupation
Total Applicants
Total Male
Total Female
White Male
White Female
Black Male
Black Female
Hispanic Male
Hispanic Female
Other Male
Other Female
49Installation, Maintenance, & Repair Occupations 492 465 27 207 5 97 9 122 11 39 249.10Supervisors of Installation, Maintenance, & Repair Workers 5 3 2 3 1 0 1 0 0 0 049.20Electrical & Electronic Equipment Mechanics, Installers 53 52 1 24 0 18 0 7 1 3 049.30Vehicle & Mobile Equipment Mechanics, Installers, Repairers 95 94 1 46 1 12 0 23 0 13 049.90Other Installation, Maintenance & Repair Occupations 339 316 23 134 3 67 8 92 10 23 2
51Production Occupations 1,139 745 394 227 90 192 89 240 156 86 5951.10Supervisors of Production Workers 4 3 1 3 0 0 0 0 1 0 051.20Assemblers & Fabricators 34 21 13 8 4 5 2 6 5 2 251.30Food Processing Workers 24 14 10 3 3 5 3 4 4 2 051.40Metal Workers & Plastic Workers 388 263 125 78 25 57 23 94 56 34 2151.50Printing Workers 40 32 8 17 4 3 1 10 2 2 151.60Textile, Apparel, & Furnishings Workers 21 9 12 2 6 3 1 3 5 1 051.70Woodworkers 8 8 0 4 0 1 0 2 0 1 051.80Plant & System Operators 3 3 0 1 0 2 0 0 0 0 051.90Other Production Occupations 617 392 225 111 48 116 59 121 83 44 35
53Transportation & Material Moving Occupations 808 671 137 189 20 240 48 192 59 50 1053.10Supervisors of Transportation & Material Moving Workers 3 2 1 2 0 0 1 0 0 0 053.20Air Transportation Workers 3 2 1 2 0 0 0 0 1 0 053.30Motor Vehicle Operators 498 444 54 128 10 167 26 110 11 39 753.40Rail Transportation Workers 2 2 0 0 0 2 0 0 0 0 053.50Water Transportation Workers 4 3 1 1 1 0 0 2 0 0 053.60Other Transportation Workers 17 11 6 6 1 2 4 2 1 1 053.70Material Moving Workers 246 176 70 36 7 56 14 76 46 8 353.90Other Transportation & Material Moving Occupations 35 31 4 14 1 13 3 2 0 2 0
55Military Specific Occupations 12 11 1 5 0 3 0 2 1 1 055.10Military Officer Special & Tactical Operations Leaders/Mgrs. 1 1 0 1 0 0 0 0 0 0 055.30Military Enlisted Tactical Operations & Air/Weapon 7 6 1 3 0 1 0 2 1 0 055.90Other Military Specific Occupations 4 4 0 1 0 2 0 0 0 1 0
99Unknown/Unclassifiable Occupations 1,372 818 554 378 233 164 119 93 71 183 13199.90Unknown/Unclassifiable Occupations 1,372 818 554 378 233 164 119 93 71 183 131
11Connecticut Data for Affirmative Action Plans ~ 1st Quarter 2010

Danbury Labor Market AreaCharacteristics of Job Seekers registered w CT Work Career Center
SOC CodeOccupation
Total Applicants
Total Male
Total Female
White Male
White Female
Black Male
Black Female
Hispanic Male
Hispanic Female
Other Male
Other Female
00Total - All Occupations 3,900 2,295 1,605 1,666 1,172 117 109 272 171 240 153
11Management Occupations 382 239 143 204 119 6 8 11 8 18 811.10Top Executives 141 92 49 77 41 4 2 2 2 9 411.20Advertising, Marketing, Promotions, Public Rel. Occupations 64 47 17 44 14 1 2 1 1 1 011.30Operations Specialties Managers 72 26 46 25 40 0 0 1 4 0 211.90Other Management Occupations 105 74 31 58 24 1 4 7 1 8 2
13Business & Financial Operations Occupations 171 69 102 61 78 1 7 2 5 5 1213.10Business Operations Specialists 56 22 34 20 27 1 3 0 0 1 413.20Financial Specialists 88 37 51 32 36 0 4 2 3 3 813.90Other Business & Financial Operations Occupations 27 10 17 9 15 0 0 0 2 1 0
15Computer & Mathematical Occupations 106 79 27 62 24 4 1 3 0 10 215.10Computer Specialists 97 72 25 56 23 4 1 3 0 9 115.20Mathematical Scientists 2 1 1 1 1 0 0 0 0 0 015.90Other Computer & Mathematical Occupations 7 6 1 5 0 0 0 0 0 1 1
17Architecture & Engineering Occupations 88 70 18 51 13 2 2 1 1 16 217.10Architects, Surveyors, & Cartographers 12 9 3 7 3 0 0 0 0 2 017.20Engineers 52 43 9 33 6 1 1 0 0 9 217.30Drafters, Engineering, & Mapping Technicians 20 16 4 10 3 1 1 1 0 4 017.90Other Architecture & Engineering Occupations 4 2 2 1 1 0 0 0 1 1 0
19Life, Physical, & Social Science Occupations 40 24 16 15 12 1 0 1 0 7 419.10Life Scientists 2 1 1 1 1 0 0 0 0 0 019.20Physical Scientists 8 6 2 5 2 0 0 0 0 1 019.30Social Scientists & Related Workers 19 12 7 9 6 0 0 0 0 3 119.40Life, Physical, & Social Science Technicians 4 3 1 0 1 0 0 1 0 2 019.90Other Life, Physical, & Social Science Occupations 7 2 5 0 2 1 0 0 0 1 3
21Community & Social Services Occupations 25 10 15 7 9 1 4 1 1 1 121.10Counselors, Social Workers, Other Cmmty./Soc. Svcs. Workers 22 9 13 7 7 0 4 1 1 1 121.90Other Community & Social Services Occupations 3 1 2 0 2 1 0 0 0 0 0
23Legal Occupations 21 4 17 4 15 0 1 0 1 0 023.10Lawyers, Judges, & Related Workers 8 2 6 2 6 0 0 0 0 0 023.20Legal Support Workers 11 1 10 1 8 0 1 0 1 0 023.90Other Legal Occupations 2 1 1 1 1 0 0 0 0 0 0
25Education, Training, & Library Occupations 44 9 35 7 30 1 0 0 2 1 325.10Postsecondary Teachers 7 3 4 3 3 0 0 0 0 0 125.20Primary, Secondary & Special Education Teachers 13 5 8 4 7 1 0 0 0 0 125.30Other Teachers & Instructors 5 0 5 0 5 0 0 0 0 0 025.90Other Education, Training, & Library Occupations 19 1 18 0 15 0 0 0 2 1 1
12Connecticut Department of Labor - Office of Research ~ Labor Market Information

Danbury Labor Market AreaCharacteristics of Job Seekers registered w CT Work Career Center
SOC CodeOccupation
Total Applicants
Total Male
Total Female
White Male
White Female
Black Male
Black Female
Hispanic Male
Hispanic Female
Other Male
Other Female
27Arts, Design, Entertainment, Sports, & Media Occupations 64 32 32 29 30 1 1 1 0 1 127.10Art & Design Workers 32 10 22 9 20 0 1 0 0 1 127.20Entertainers & Performers, Sports & Related Workers 2 2 0 2 0 0 0 0 0 0 027.30Media & Communication Workers 17 9 8 9 8 0 0 0 0 0 027.40Media & Communication Equipment Workers 7 7 0 6 0 1 0 0 0 0 027.90Other Arts, Design, Entertainment, Sports, & Media Workers 6 4 2 3 2 0 0 1 0 0 0
29Healthcare Practitioners & Technical Occupations 49 15 34 14 29 0 2 0 0 1 329.10Health Diagnosing & Treating Practitioners 20 7 13 7 11 0 0 0 0 0 229.20Health Technologists & Technicians 20 6 14 6 12 0 1 0 0 0 129.90Other Healthcare Practitioners & Technical Occupations 9 2 7 1 6 0 1 0 0 1 0
31Healthcare Support Occupations 132 17 115 5 68 4 20 6 24 2 331.10Nursing, Psychiatric, & Home Health Aides 88 10 78 2 38 4 20 3 18 1 231.90Other Healthcare Support Occupations 44 7 37 3 30 0 0 3 6 1 1
33Protective Service Occupations 18 14 4 11 2 1 1 1 1 1 033.10First-Line Supervisors/Mgrs. of Protective Service Workers 1 1 0 1 0 0 0 0 0 0 033.90Other Protective Service Workers 17 13 4 10 2 1 1 1 1 1 0
35Food Preparation & Serving Related Occupations 130 65 65 44 46 4 5 12 6 5 835.10Supervisors of Food Preparation & Serving Workers 15 11 4 10 4 1 0 0 0 0 035.20Cooks & Food Preparation Workers 47 29 18 19 8 0 4 7 5 3 135.30Food & Beverage Serving Workers 56 19 37 12 30 3 0 2 1 2 635.90Other Food Preparation & Serving Related Workers 12 6 6 3 4 0 1 3 0 0 1
37Building & Grounds Cleaning & Maintenance Occupations 173 148 25 86 9 9 1 44 12 9 337.10Supervisors of Bldg./Grounds Cleaning & Maintenance Workers 5 4 1 2 1 2 0 0 0 0 037.20Building Cleaning & Pest Control Workers 33 14 19 5 5 2 1 4 11 3 237.30Grounds Maintenance Workers 122 117 5 71 3 1 0 39 1 6 137.90Other Building/Grounds Cleaning & Maintenance Occupations 13 13 0 8 0 4 0 1 0 0 0
39Personal Care & Service Occupations 30 3 27 1 22 0 0 2 2 0 339.20Animal Care & Service Workers 3 0 3 0 2 0 0 0 0 0 139.50Personal Appearance Workers 11 1 10 0 9 0 0 1 1 0 039.90Other Personal Care & Service Workers 16 2 14 1 11 0 0 1 1 0 2
41Sales & Related Occupations 349 192 157 150 121 15 5 12 16 15 1541.10Supervisors of Sales Workers 38 23 15 20 14 1 1 0 0 2 041.20Retail Sales Workers 167 82 85 59 61 7 3 9 11 7 1041.30Sales Representatives, Services 76 45 31 36 23 3 0 3 4 3 441.40Sales Representatives, Wholesale & Manufacturing 9 8 1 8 1 0 0 0 0 0 041.90Other Sales & Related Workers 59 34 25 27 22 4 1 0 1 3 1
13Connecticut Data for Affirmative Action Plans ~ 1st Quarter 2010

Danbury Labor Market AreaCharacteristics of Job Seekers registered w CT Work Career Center
SOC CodeOccupation
Total Applicants
Total Male
Total Female
White Male
White Female
Black Male
Black Female
Hispanic Male
Hispanic Female
Other Male
Other Female
43Office & Administrative Support Occupations 718 183 535 118 402 23 42 18 42 24 4943.10Supervisors of Office & Administrative Support Workers 9 1 8 1 6 0 0 0 1 0 143.30Financial Clerks 61 7 54 5 42 0 3 0 2 2 743.40Information & Record Clerks 236 81 155 51 116 11 13 7 12 12 1443.50Material Recording, Scheduling, Dispatch/Distribution Workers 66 42 24 21 13 8 4 9 5 4 243.60Secretaries & Administrative Assistants 204 6 198 2 158 0 12 2 10 2 1843.90Other Office & Administrative Support Workers 142 46 96 38 67 4 10 0 12 4 7
45Farming, Fishing, & Forestry Occupations 9 6 3 4 2 0 0 2 1 0 045.20Agricultural Workers 8 5 3 3 2 0 0 2 1 0 045.90Other Farming, Fishing, & Forestry Workers 1 1 0 1 0 0 0 0 0 0 0
47Construction & Extraction Occupations 449 444 5 322 3 12 0 72 2 38 047.10Supervisors of Construction & Extraction Workers 1 1 0 1 0 0 0 0 0 0 047.20Construction Trades Workers 317 314 3 229 2 7 0 51 1 27 047.30Helpers, Construction Trades 90 88 2 58 1 2 0 19 1 9 047.40Other Construction & Related Workers 15 15 0 11 0 0 0 2 0 2 047.50Extraction Workers 2 2 0 2 0 0 0 0 0 0 047.90Other Construction & Extraction Occupations 24 24 0 21 0 3 0 0 0 0 0
49Installation, Maintenance, & Repair Occupations 134 132 2 105 1 6 0 12 1 9 049.10Supervisors of Installation, Maintenance, & Repair Workers 3 3 0 3 0 0 0 0 0 0 049.20Electrical & Electronic Equipment Mechanics, Installers 6 6 0 6 0 0 0 0 0 0 049.30Vehicle & Mobile Equipment Mechanics, Installers, Repairers 39 39 0 30 0 1 0 5 0 3 049.90Other Installation, Maintenance & Repair Occupations 86 84 2 66 1 5 0 7 1 6 0
51Production Occupations 282 201 81 117 37 12 4 38 31 34 951.10Supervisors of Production Workers 2 2 0 2 0 0 0 0 0 0 051.20Assemblers & Fabricators 7 4 3 2 3 1 0 0 0 1 051.30Food Processing Workers 6 3 3 3 3 0 0 0 0 0 051.40Metal Workers & Plastic Workers 94 79 15 40 7 3 1 16 5 20 251.50Printing Workers 8 6 2 4 2 1 0 0 0 1 051.60Textile, Apparel, & Furnishings Workers 6 2 4 2 2 0 0 0 2 0 051.70Woodworkers 1 1 0 1 0 0 0 0 0 0 051.90Other Production Occupations 158 104 54 63 20 7 3 22 24 12 7
53Transportation & Material Moving Occupations 171 155 16 104 8 10 1 25 6 16 153.20Air Transportation Workers 2 2 0 1 0 0 0 0 0 1 053.30Motor Vehicle Operators 113 108 5 79 5 5 0 16 0 8 053.60Other Transportation Workers 3 2 1 2 1 0 0 0 0 0 053.70Material Moving Workers 44 35 9 18 1 4 1 8 6 5 153.90Other Transportation & Material Moving Occupations 9 8 1 4 1 1 0 1 0 2 0
14Connecticut Department of Labor - Office of Research ~ Labor Market Information

Danbury Labor Market AreaCharacteristics of Job Seekers registered w CT Work Career Center
SOC CodeOccupation
Total Applicants
Total Male
Total Female
White Male
White Female
Black Male
Black Female
Hispanic Male
Hispanic Female
Other Male
Other Female
55Military Specific Occupations 1 1 0 1 0 0 0 0 0 0 055.90Other Military Specific Occupations 1 1 0 1 0 0 0 0 0 0 0
99Unknown/Unclassifiable Occupations 314 183 131 144 92 4 4 8 9 27 2699.90Unknown/Unclassifiable Occupations 314 183 131 144 92 4 4 8 9 27 26
15Connecticut Data for Affirmative Action Plans ~ 1st Quarter 2010

Enfield Labor Market AreaCharacteristics of Job Seekers registered w CT Work Career Center
SOC CodeOccupation
Total Applicants
Total Male
Total Female
White Male
White Female
Black Male
Black Female
Hispanic Male
Hispanic Female
Other Male
Other Female
00Total - All Occupations 4,191 2,630 1,561 1,857 1,149 141 113 348 138 284 161
11Management Occupations 306 165 141 137 116 6 9 5 5 17 1111.10Top Executives 129 77 52 60 43 2 4 3 3 12 211.20Advertising, Marketing, Promotions, Public Rel. Occupations 45 27 18 20 15 3 0 1 1 3 211.30Operations Specialties Managers 42 12 30 11 26 1 1 0 1 0 211.90Other Management Occupations 90 49 41 46 32 0 4 1 0 2 5
13Business & Financial Operations Occupations 114 44 70 39 58 1 6 1 3 3 313.10Business Operations Specialists 64 26 38 23 32 0 2 1 2 2 213.20Financial Specialists 38 13 25 11 20 1 3 0 1 1 113.90Other Business & Financial Operations Occupations 12 5 7 5 6 0 1 0 0 0 0
15Computer & Mathematical Occupations 109 74 35 55 26 1 2 3 0 15 715.10Computer Specialists 85 58 27 48 23 1 2 2 0 7 215.20Mathematical Scientists 1 0 1 0 0 0 0 0 0 0 115.90Other Computer & Mathematical Occupations 23 16 7 7 3 0 0 1 0 8 4
17Architecture & Engineering Occupations 87 81 6 71 6 1 0 5 0 4 017.10Architects, Surveyors, & Cartographers 2 1 1 1 1 0 0 0 0 0 017.20Engineers 59 57 2 49 2 1 0 4 0 3 017.30Drafters, Engineering, & Mapping Technicians 23 20 3 20 3 0 0 0 0 0 017.90Other Architecture & Engineering Occupations 3 3 0 1 0 0 0 1 0 1 0
19Life, Physical, & Social Science Occupations 15 9 6 8 5 0 0 0 0 1 119.10Life Scientists 2 1 1 1 1 0 0 0 0 0 019.20Physical Scientists 3 3 0 2 0 0 0 0 0 1 019.30Social Scientists & Related Workers 5 3 2 3 2 0 0 0 0 0 019.40Life, Physical, & Social Science Technicians 5 2 3 2 2 0 0 0 0 0 1
21Community & Social Services Occupations 32 15 17 6 11 5 2 3 2 1 221.10Counselors, Social Workers, Other Cmmty./Soc. Svcs. Workers 21 8 13 1 9 5 2 1 2 1 021.20Religious Workers 2 1 1 1 0 0 0 0 0 0 121.90Other Community & Social Services Occupations 9 6 3 4 2 0 0 2 0 0 1
23Legal Occupations 16 6 10 5 9 0 0 0 0 1 123.10Lawyers, Judges, & Related Workers 4 4 0 3 0 0 0 0 0 1 023.20Legal Support Workers 10 1 9 1 8 0 0 0 0 0 123.90Other Legal Occupations 2 1 1 1 1 0 0 0 0 0 0
25Education, Training, & Library Occupations 29 6 23 4 19 0 2 0 1 2 125.10Postsecondary Teachers 4 1 3 1 1 0 0 0 1 0 125.20Primary, Secondary & Special Education Teachers 10 2 8 1 8 0 0 0 0 1 025.30Other Teachers & Instructors 5 1 4 0 3 0 1 0 0 1 025.90Other Education, Training, & Library Occupations 10 2 8 2 7 0 1 0 0 0 0
16Connecticut Department of Labor - Office of Research ~ Labor Market Information

Enfield Labor Market AreaCharacteristics of Job Seekers registered w CT Work Career Center
SOC CodeOccupation
Total Applicants
Total Male
Total Female
White Male
White Female
Black Male
Black Female
Hispanic Male
Hispanic Female
Other Male
Other Female
27Arts, Design, Entertainment, Sports, & Media Occupations 25 13 12 12 12 0 0 0 0 1 027.10Art & Design Workers 15 6 9 5 9 0 0 0 0 1 027.30Media & Communication Workers 7 4 3 4 3 0 0 0 0 0 027.40Media & Communication Equipment Workers 3 3 0 3 0 0 0 0 0 0 0
29Healthcare Practitioners & Technical Occupations 49 10 39 1 32 2 2 1 2 6 329.10Health Diagnosing & Treating Practitioners 15 2 13 0 12 0 0 0 0 2 129.20Health Technologists & Technicians 29 6 23 1 19 2 1 0 2 3 129.90Other Healthcare Practitioners & Technical Occupations 5 2 3 0 1 0 1 1 0 1 1
31Healthcare Support Occupations 124 9 115 8 72 0 23 1 11 0 931.10Nursing, Psychiatric, & Home Health Aides 48 3 45 2 24 0 14 1 3 0 431.20Occupational & Physical Therapist Assistants & Aides 1 0 1 0 1 0 0 0 0 0 031.90Other Healthcare Support Occupations 75 6 69 6 47 0 9 0 8 0 5
33Protective Service Occupations 23 16 7 11 4 4 1 1 0 0 233.30Law Enforcement Workers 3 3 0 2 0 1 0 0 0 0 033.90Other Protective Service Workers 20 13 7 9 4 3 1 1 0 0 2
35Food Preparation & Serving Related Occupations 129 55 74 37 55 6 4 6 6 6 935.10Supervisors of Food Preparation & Serving Workers 14 9 5 7 5 0 0 1 0 1 035.20Cooks & Food Preparation Workers 50 35 15 25 7 6 1 3 2 1 535.30Food & Beverage Serving Workers 52 7 45 3 37 0 2 2 2 2 435.90Other Food Preparation & Serving Related Workers 13 4 9 2 6 0 1 0 2 2 0
37Building & Grounds Cleaning & Maintenance Occupations 181 160 21 102 12 3 1 41 6 14 237.10Supervisors of Bldg./Grounds Cleaning & Maintenance Workers 1 1 0 1 0 0 0 0 0 0 037.20Building Cleaning & Pest Control Workers 39 24 15 16 11 2 1 3 1 3 237.30Grounds Maintenance Workers 135 129 6 81 1 1 0 36 5 11 037.90Other Building/Grounds Cleaning & Maintenance Occupations 6 6 0 4 0 0 0 2 0 0 0
39Personal Care & Service Occupations 32 6 26 3 19 0 4 1 2 2 139.20Animal Care & Service Workers 1 1 0 0 0 0 0 0 0 1 039.30Entertainment Attendants & Related Workers 2 1 1 0 1 0 0 0 0 1 039.40Funeral Service Workers 3 2 1 2 1 0 0 0 0 0 039.50Personal Appearance Workers 6 1 5 1 5 0 0 0 0 0 039.90Other Personal Care & Service Workers 20 1 19 0 12 0 4 1 2 0 1
41Sales & Related Occupations 274 146 128 114 98 9 6 4 10 19 1441.10Supervisors of Sales Workers 30 15 15 11 13 0 1 0 1 4 041.20Retail Sales Workers 135 64 71 47 53 7 3 2 6 8 941.30Sales Representatives, Services 75 46 29 40 24 1 1 2 2 3 241.40Sales Representatives, Wholesale & Manufacturing 5 5 0 4 0 1 0 0 0 0 041.90Other Sales & Related Workers 29 16 13 12 8 0 1 0 1 4 3
17Connecticut Data for Affirmative Action Plans ~ 1st Quarter 2010

Enfield Labor Market AreaCharacteristics of Job Seekers registered w CT Work Career Center
SOC CodeOccupation
Total Applicants
Total Male
Total Female
White Male
White Female
Black Male
Black Female
Hispanic Male
Hispanic Female
Other Male
Other Female
43Office & Administrative Support Occupations 644 178 466 126 376 17 25 9 23 26 4243.10Supervisors of Office & Administrative Support Workers 4 0 4 0 4 0 0 0 0 0 043.30Financial Clerks 68 9 59 7 52 1 1 0 1 1 543.40Information & Record Clerks 244 84 160 64 120 7 12 2 11 11 1743.50Material Recording, Scheduling, Dispatch/Distribution Workers 79 48 31 30 30 6 1 5 0 7 043.60Secretaries & Administrative Assistants 121 5 116 5 102 0 4 0 6 0 443.90Other Office & Administrative Support Workers 128 32 96 20 68 3 7 2 5 7 16
45Farming, Fishing, & Forestry Occupations 159 119 40 12 5 1 2 99 30 7 345.20Agricultural Workers 148 110 38 11 5 1 2 97 30 1 145.90Other Farming, Fishing, & Forestry Workers 11 9 2 1 0 0 0 2 0 6 2
47Construction & Extraction Occupations 441 435 6 358 3 12 1 30 0 35 247.10Supervisors of Construction & Extraction Workers 2 2 0 2 0 0 0 0 0 0 047.20Construction Trades Workers 284 283 1 232 0 8 0 20 0 23 147.30Helpers, Construction Trades 122 120 2 103 1 3 1 5 0 9 047.40Other Construction & Related Workers 5 4 1 4 0 0 0 0 0 0 147.50Extraction Workers 7 7 0 4 0 1 0 0 0 2 047.90Other Construction & Extraction Occupations 21 19 2 13 2 0 0 5 0 1 0
49Installation, Maintenance, & Repair Occupations 175 167 8 136 5 5 1 13 0 13 249.10Supervisors of Installation, Maintenance, & Repair Workers 2 2 0 2 0 0 0 0 0 0 049.20Electrical & Electronic Equipment Mechanics, Installers 23 22 1 16 1 2 0 2 0 2 049.30Vehicle & Mobile Equipment Mechanics, Installers, Repairers 48 48 0 38 0 1 0 4 0 5 049.90Other Installation, Maintenance & Repair Occupations 102 95 7 80 4 2 1 7 0 6 2
51Production Occupations 580 432 148 281 112 33 8 72 15 46 1351.10Supervisors of Production Workers 2 1 1 1 1 0 0 0 0 0 051.20Assemblers & Fabricators 11 9 2 7 2 1 0 0 0 1 051.30Food Processing Workers 10 4 6 2 6 0 0 1 0 1 051.40Metal Workers & Plastic Workers 192 158 34 107 28 13 2 13 1 25 351.50Printing Workers 19 16 3 13 3 0 0 1 0 2 051.60Textile, Apparel, & Furnishings Workers 4 2 2 0 2 0 0 2 0 0 051.70Woodworkers 2 2 0 2 0 0 0 0 0 0 051.80Plant & System Operators 1 0 1 0 1 0 0 0 0 0 051.90Other Production Occupations 339 240 99 149 69 19 6 55 14 17 10
18Connecticut Department of Labor - Office of Research ~ Labor Market Information

Enfield Labor Market AreaCharacteristics of Job Seekers registered w CT Work Career Center
SOC CodeOccupation
Total Applicants
Total Male
Total Female
White Male
White Female
Black Male
Black Female
Hispanic Male
Hispanic Female
Other Male
Other Female
53Transportation & Material Moving Occupations 271 235 36 164 17 21 2 33 13 17 453.10Supervisors of Transportation & Material Moving Workers 2 2 0 2 0 0 0 0 0 0 053.20Air Transportation Workers 1 1 0 1 0 0 0 0 0 0 053.30Motor Vehicle Operators 152 143 9 113 5 10 1 11 0 9 353.60Other Transportation Workers 3 2 1 1 1 0 0 0 0 1 053.70Material Moving Workers 95 70 25 34 10 9 1 22 13 5 153.90Other Transportation & Material Moving Occupations 18 17 1 13 1 2 0 0 0 2 0
55Military Specific Occupations 6 6 0 2 0 2 0 0 0 2 055.30Military Enlisted Tactical Operations & Air/Weapon 5 5 0 2 0 1 0 0 0 2 055.90Other Military Specific Occupations 1 1 0 0 0 1 0 0 0 0 0
99Unknown/Unclassifiable Occupations 370 243 127 165 77 12 12 20 9 46 2999.90Unknown/Unclassifiable Occupations 370 243 127 165 77 12 12 20 9 46 29
19Connecticut Data for Affirmative Action Plans ~ 1st Quarter 2010

Hartford Labor Market AreaCharacteristics of Job Seekers registered w CT Work Career Center
SOC CodeOccupation
Total Applicants
Total Male
Total Female
White Male
White Female
Black Male
Black Female
Hispanic Male
Hispanic Female
Other Male
Other Female
00Total - All Occupations 23,718 14,057 9,661 7,300 4,468 2,512 2,225 2,639 1,873 1,606 1,095
11Management Occupations 1,394 741 653 561 458 62 66 71 75 47 5411.10Top Executives 582 335 247 261 168 20 27 29 28 25 2411.20Advertising, Marketing, Promotions, Public Rel. Occupations 176 108 68 84 54 12 2 7 5 5 711.30Operations Specialties Managers 237 71 166 52 114 8 17 4 18 7 1711.90Other Management Occupations 399 227 172 164 122 22 20 31 24 10 6
13Business & Financial Operations Occupations 726 344 382 231 232 62 82 20 30 31 3813.10Business Operations Specialists 323 161 162 112 97 23 40 9 9 17 1613.20Financial Specialists 295 146 149 92 89 31 31 9 12 14 1713.90Other Business & Financial Operations Occupations 108 37 71 27 46 8 11 2 9 0 5
15Computer & Mathematical Occupations 476 305 171 180 81 41 20 19 15 65 5515.10Computer Specialists 395 259 136 165 72 35 20 17 12 42 3215.20Mathematical Scientists 5 2 3 2 1 0 0 0 0 0 215.90Other Computer & Mathematical Occupations 76 44 32 13 8 6 0 2 3 23 21
17Architecture & Engineering Occupations 355 297 58 203 40 39 5 23 2 32 1117.10Architects, Surveyors, & Cartographers 32 27 5 19 4 7 0 1 0 0 117.20Engineers 228 192 36 130 22 20 3 13 2 29 917.30Drafters, Engineering, & Mapping Technicians 81 67 14 46 11 12 2 7 0 2 117.90Other Architecture & Engineering Occupations 14 11 3 8 3 0 0 2 0 1 0
19Life, Physical, & Social Science Occupations 71 33 38 25 20 3 5 0 11 5 219.10Life Scientists 5 1 4 0 0 0 1 0 3 1 019.20Physical Scientists 7 5 2 3 1 0 0 0 1 2 019.30Social Scientists & Related Workers 34 13 21 10 14 3 2 0 3 0 219.40Life, Physical, & Social Science Technicians 14 9 5 8 1 0 1 0 3 1 019.90Other Life, Physical, & Social Science Occupations 11 5 6 4 4 0 1 0 1 1 0
21Community & Social Services Occupations 320 123 197 37 62 42 71 28 44 16 2021.10Counselors, Social Workers, Other Cmmty./Soc. Svcs. Workers 222 76 146 22 43 29 62 16 30 9 1121.20Religious Workers 9 3 6 2 2 0 0 1 3 0 121.90Other Community & Social Services Occupations 89 44 45 13 17 13 9 11 11 7 8
23Legal Occupations 103 29 74 15 44 7 13 4 13 3 423.10Lawyers, Judges, & Related Workers 30 16 14 11 9 2 2 2 0 1 323.20Legal Support Workers 65 11 54 4 32 4 9 1 12 2 123.90Other Legal Occupations 8 2 6 0 3 1 2 1 1 0 0
20Connecticut Department of Labor - Office of Research ~ Labor Market Information

Hartford Labor Market AreaCharacteristics of Job Seekers registered w CT Work Career Center
SOC CodeOccupation
Total Applicants
Total Male
Total Female
White Male
White Female
Black Male
Black Female
Hispanic Male
Hispanic Female
Other Male
Other Female
25Education, Training, & Library Occupations 263 81 182 37 71 19 48 16 45 9 1825.10Postsecondary Teachers 47 23 24 10 5 4 10 6 6 3 325.20Primary, Secondary & Special Education Teachers 90 22 68 12 42 2 10 5 8 3 825.30Other Teachers & Instructors 27 10 17 4 7 4 4 1 5 1 125.40Librarians, Curators, & Archivists 5 1 4 1 1 0 0 0 2 0 125.90Other Education, Training, & Library Occupations 94 25 69 10 16 9 24 4 24 2 5
27Arts, Design, Entertainment, Sports, & Media Occupations 218 126 92 65 58 19 12 22 11 20 1127.10Art & Design Workers 87 49 38 29 28 4 3 8 2 8 527.20Entertainers & Performers, Sports & Related Workers 24 20 4 9 0 5 3 4 1 2 027.30Media & Communication Workers 67 34 33 19 22 6 4 2 2 7 527.40Media & Communication Equipment Workers 22 14 8 5 5 3 0 5 3 1 027.90Other Arts, Design, Entertainment, Sports, & Media Workers 18 9 9 3 3 1 2 3 3 2 1
29Healthcare Practitioners & Technical Occupations 376 81 295 45 161 21 84 6 27 9 2329.10Health Diagnosing & Treating Practitioners 111 18 93 12 66 3 15 0 6 3 629.20Health Technologists & Technicians 218 53 165 30 84 14 54 5 15 4 1229.90Other Healthcare Practitioners & Technical Occupations 47 10 37 3 11 4 15 1 6 2 5
31Healthcare Support Occupations 920 132 788 34 227 64 310 19 172 15 7931.10Nursing, Psychiatric, & Home Health Aides 581 84 497 19 123 46 217 11 100 8 5731.20Occupational & Physical Therapist Assistants & Aides 5 3 2 0 1 3 0 0 1 0 031.90Other Healthcare Support Occupations 334 45 289 15 103 15 93 8 71 7 22
33Protective Service Occupations 185 143 42 56 6 45 18 30 13 12 533.20Fire Fighting & Prevention Workers 3 3 0 2 0 0 0 1 0 0 033.30Law Enforcement Workers 17 11 6 5 1 3 3 1 2 2 033.90Other Protective Service Workers 165 129 36 49 5 42 15 28 11 10 5
35Food Preparation & Serving Related Occupations 1,183 682 501 232 231 198 119 185 111 67 4035.10Supervisors of Food Preparation & Serving Workers 122 101 21 55 13 16 4 19 4 11 035.20Cooks & Food Preparation Workers 515 347 168 88 53 125 51 104 54 30 1035.30Food & Beverage Serving Workers 393 146 247 65 134 29 44 34 46 18 2335.90Other Food Preparation & Serving Related Workers 153 88 65 24 31 28 20 28 7 8 7
37Building & Grounds Cleaning & Maintenance Occupations 1,035 812 223 350 66 104 40 302 98 56 1937.10Supervisors of Bldg./Grounds Cleaning & Maintenance Workers 33 20 13 7 5 5 3 8 4 0 137.20Building Cleaning & Pest Control Workers 378 207 171 51 42 53 37 88 77 15 1537.30Grounds Maintenance Workers 567 542 25 279 17 34 0 189 7 40 137.90Other Building/Grounds Cleaning & Maintenance Occupations 57 43 14 13 2 12 0 17 10 1 2
21Connecticut Data for Affirmative Action Plans ~ 1st Quarter 2010
Hartford Labor Market AreaCharacteristics of Job Seekers registered w CT Work Career Center
SOC CodeOccupation
Total Applicants
Total Male
Total Female
White Male
White Female
Black Male
Black Female
Hispanic Male
Hispanic Female
Other Male
Other Female
39Personal Care & Service Occupations 268 64 204 20 67 19 70 7 46 18 2139.10Supervisors of Personal Care & Service Workers 4 3 1 2 1 0 0 0 0 1 039.20Animal Care & Service Workers 14 6 8 2 3 1 1 0 2 3 239.30Entertainment Attendants & Related Workers 10 5 5 3 0 1 2 1 3 0 039.40Funeral Service Workers 11 6 5 0 2 1 0 2 1 3 239.50Personal Appearance Workers 47 10 37 7 19 1 3 1 9 1 639.60Transportation, Tourism, & Lodging Attendants 3 1 2 0 1 1 1 0 0 0 039.90Other Personal Care & Service Workers 179 33 146 6 41 14 63 3 31 10 11
41Sales & Related Occupations 1,988 886 1,102 560 480 146 266 96 256 84 10041.10Supervisors of Sales Workers 194 102 92 68 63 17 12 9 11 8 641.20Retail Sales Workers 1,200 448 752 241 261 98 214 58 210 51 6741.30Sales Representatives, Services 394 238 156 187 100 18 22 15 20 18 1441.40Sales Representatives, Wholesale & Manufacturing 30 23 7 14 5 5 2 3 0 1 041.90Other Sales & Related Workers 170 75 95 50 51 8 16 11 15 6 13
43Office & Administrative Support Occupations 3,620 975 2,645 463 1,361 222 650 164 380 126 25443.10Supervisors of Office & Administrative Support Workers 10 1 9 1 8 0 1 0 0 0 043.20Communications Equipment Operators 16 3 13 2 4 1 6 0 3 0 043.30Financial Clerks 320 49 271 25 151 11 65 6 35 7 2043.40Information & Record Clerks 1,413 441 972 223 458 95 255 53 154 70 10543.50Material Recording, Scheduling, Dispatch/Distribution Workers 402 269 133 101 60 72 28 68 34 28 1143.60Secretaries & Administrative Assistants 726 39 687 23 426 10 126 3 80 3 5543.90Other Office & Administrative Support Workers 733 173 560 88 254 33 169 34 74 18 63
45Farming, Fishing, & Forestry Occupations 122 85 37 17 15 5 0 38 8 25 1445.10Supervisors of Farming, Fishing, & Forestry Workers 2 1 1 1 1 0 0 0 0 0 045.20Agricultural Workers 70 51 19 7 10 4 0 37 8 3 145.40Forest, Conservation, & Logging Workers 3 2 1 2 1 0 0 0 0 0 045.90Other Farming, Fishing, & Forestry Workers 47 31 16 7 3 1 0 1 0 22 13
47Construction & Extraction Occupations 3,034 2,964 70 1,819 27 344 15 542 23 259 547.10Supervisors of Construction & Extraction Workers 12 12 0 9 0 1 0 1 0 1 047.20Construction Trades Workers 2,047 2,002 45 1,245 16 230 11 358 14 169 447.30Helpers, Construction Trades 746 735 11 465 7 82 3 118 1 70 047.40Other Construction & Related Workers 94 86 8 26 0 13 1 40 7 7 047.50Extraction Workers 31 29 2 16 0 5 0 2 1 6 147.90Other Construction & Extraction Occupations 104 100 4 58 4 13 0 23 0 6 0
22Connecticut Department of Labor - Office of Research ~ Labor Market Information

Hartford Labor Market AreaCharacteristics of Job Seekers registered w CT Work Career Center
SOC CodeOccupation
Total Applicants
Total Male
Total Female
White Male
White Female
Black Male
Black Female
Hispanic Male
Hispanic Female
Other Male
Other Female
49Installation, Maintenance, & Repair Occupations 806 772 34 432 9 109 7 154 13 77 549.10Supervisors of Installation, Maintenance, & Repair Workers 6 6 0 4 0 0 0 1 0 1 049.20Electrical & Electronic Equipment Mechanics, Installers 101 94 7 58 2 16 3 12 1 8 149.30Vehicle & Mobile Equipment Mechanics, Installers, Repairers 208 206 2 106 1 25 1 49 0 26 049.90Other Installation, Maintenance & Repair Occupations 491 466 25 264 6 68 3 92 12 42 4
51Production Occupations 2,997 2,154 843 941 331 463 141 512 270 238 10151.10Supervisors of Production Workers 5 4 1 3 1 0 0 0 0 1 051.20Assemblers & Fabricators 59 36 23 10 13 9 4 13 4 4 251.30Food Processing Workers 63 36 27 18 15 7 5 3 7 8 051.40Metal Workers & Plastic Workers 988 841 147 436 61 115 18 189 53 101 1551.50Printing Workers 78 71 7 41 5 14 0 13 2 3 051.60Textile, Apparel, & Furnishings Workers 41 13 28 3 16 2 0 7 6 1 651.70Woodworkers 8 7 1 4 0 0 0 3 1 0 051.80Plant & System Operators 6 5 1 4 1 0 0 1 0 0 051.90Other Production Occupations 1,749 1,141 608 422 219 316 114 283 197 120 78
53Transportation & Material Moving Occupations 1,197 1,022 175 405 54 299 33 227 69 91 1953.10Supervisors of Transportation & Material Moving Workers 4 4 0 3 0 1 0 0 0 0 053.20Air Transportation Workers 5 4 1 3 0 0 1 1 0 0 053.30Motor Vehicle Operators 703 612 91 275 32 169 19 122 33 46 753.50Water Transportation Workers 1 1 0 1 0 0 0 0 0 0 053.60Other Transportation Workers 25 20 5 9 0 7 1 3 3 1 153.70Material Moving Workers 352 287 65 81 18 87 9 83 29 36 953.90Other Transportation & Material Moving Occupations 107 94 13 33 4 35 3 18 4 8 2
55Military Specific Occupations 32 29 3 19 2 2 1 5 0 3 055.10Military Officer Special & Tactical Operations Leaders/Mgrs. 3 3 0 3 0 0 0 0 0 0 055.20First-Line Enlisted Military Supervisors/Managers 3 3 0 2 0 1 0 0 0 0 055.30Military Enlisted Tactical Operations & Air/Weapon 22 19 3 12 2 1 1 4 0 2 055.90Other Military Specific Occupations 4 4 0 2 0 0 0 1 0 1 0
99Unknown/Unclassifiable Occupations 2,029 1,177 852 553 365 177 149 149 141 298 19799.90Unknown/Unclassifiable Occupations 2,029 1,177 852 553 365 177 149 149 141 298 197
23Connecticut Data for Affirmative Action Plans ~ 1st Quarter 2010

New Haven Labor Market AreaCharacteristics of Job Seekers registered w CT Work Career Center
SOC CodeOccupation
Total Applicants
Total Male
Total Female
White Male
White Female
Black Male
Black Female
Hispanic Male
Hispanic Female
Other Male
Other Female
00Total - All Occupations 15,985 9,496 6,489 5,236 3,336 1,601 1,497 1,730 1,012 929 644
11Management Occupations 860 498 362 373 266 55 43 32 21 38 3211.10Top Executives 300 180 120 136 90 18 8 10 9 16 1311.20Advertising, Marketing, Promotions, Public Rel. Occupations 156 90 66 63 49 8 6 11 5 8 611.30Operations Specialties Managers 138 58 80 45 61 8 12 3 1 2 611.90Other Management Occupations 266 170 96 129 66 21 17 8 6 12 7
13Business & Financial Operations Occupations 398 174 224 125 142 25 40 10 17 14 2513.10Business Operations Specialists 126 49 77 42 50 4 11 2 7 1 913.20Financial Specialists 187 91 96 58 64 17 12 3 6 13 1413.90Other Business & Financial Operations Occupations 85 34 51 25 28 4 17 5 4 0 2
15Computer & Mathematical Occupations 267 180 87 126 49 23 16 11 5 20 1715.10Computer Specialists 236 161 75 112 46 22 15 10 4 17 1015.20Mathematical Scientists 4 3 1 2 1 1 0 0 0 0 015.90Other Computer & Mathematical Occupations 27 16 11 12 2 0 1 1 1 3 7
17Architecture & Engineering Occupations 219 178 41 130 27 6 4 13 5 29 517.10Architects, Surveyors, & Cartographers 17 12 5 11 3 0 0 0 1 1 117.20Engineers 142 114 28 80 22 5 3 9 2 20 117.30Drafters, Engineering, & Mapping Technicians 51 44 7 31 2 1 0 4 2 8 317.90Other Architecture & Engineering Occupations 9 8 1 8 0 0 1 0 0 0 0
19Life, Physical, & Social Science Occupations 77 37 40 26 25 4 4 3 5 4 619.10Life Scientists 8 6 2 5 1 0 0 1 0 0 119.20Physical Scientists 6 6 0 4 0 1 0 0 0 1 019.30Social Scientists & Related Workers 39 14 25 11 17 1 3 0 1 2 419.40Life, Physical, & Social Science Technicians 8 3 5 2 1 1 1 0 3 0 019.90Other Life, Physical, & Social Science Occupations 16 8 8 4 6 1 0 2 1 1 1
21Community & Social Services Occupations 195 70 125 16 48 35 47 13 20 6 1021.10Counselors, Social Workers, Other Cmmty./Soc. Svcs. Workers 141 49 92 11 34 28 39 5 10 5 921.20Religious Workers 5 1 4 0 1 1 2 0 1 0 021.90Other Community & Social Services Occupations 49 20 29 5 13 6 6 8 9 1 1
23Legal Occupations 62 13 49 11 27 0 11 1 4 1 723.10Lawyers, Judges, & Related Workers 19 5 14 4 10 0 2 1 0 0 223.20Legal Support Workers 32 3 29 3 15 0 7 0 3 0 423.90Other Legal Occupations 11 5 6 4 2 0 2 0 1 1 1
24Connecticut Department of Labor - Office of Research ~ Labor Market Information

New Haven Labor Market AreaCharacteristics of Job Seekers registered w CT Work Career Center
SOC CodeOccupation
Total Applicants
Total Male
Total Female
White Male
White Female
Black Male
Black Female
Hispanic Male
Hispanic Female
Other Male
Other Female
25Education, Training, & Library Occupations 168 40 128 23 62 6 31 5 23 6 1225.10Postsecondary Teachers 34 9 25 4 9 1 9 1 5 3 225.20Primary, Secondary & Special Education Teachers 54 14 40 8 22 3 9 3 6 0 325.30Other Teachers & Instructors 14 4 10 4 4 0 2 0 3 0 125.40Librarians, Curators, & Archivists 3 1 2 0 1 0 0 1 0 0 125.90Other Education, Training, & Library Occupations 63 12 51 7 26 2 11 0 9 3 5
27Arts, Design, Entertainment, Sports, & Media Occupations 130 73 57 52 44 12 11 4 0 5 227.10Art & Design Workers 61 36 25 28 18 4 6 3 0 1 127.20Entertainers & Performers, Sports & Related Workers 10 9 1 7 0 1 1 0 0 1 027.30Media & Communication Workers 46 21 25 13 21 5 3 0 0 3 127.40Media & Communication Equipment Workers 8 5 3 4 2 1 1 0 0 0 027.90Other Arts, Design, Entertainment, Sports, & Media Workers 5 2 3 0 3 1 0 1 0 0 0
29Healthcare Practitioners & Technical Occupations 258 56 202 25 114 17 54 5 16 9 1829.10Health Diagnosing & Treating Practitioners 70 14 56 6 34 2 12 2 4 4 629.20Health Technologists & Technicians 144 30 114 16 68 6 28 3 10 5 829.90Other Healthcare Practitioners & Technical Occupations 44 12 32 3 12 9 14 0 2 0 4
31Healthcare Support Occupations 667 72 595 30 178 27 283 9 91 6 4331.10Nursing, Psychiatric, & Home Health Aides 461 42 419 17 102 16 227 5 60 4 3031.20Occupational & Physical Therapist Assistants & Aides 1 1 0 1 0 0 0 0 0 0 031.90Other Healthcare Support Occupations 205 29 176 12 76 11 56 4 31 2 13
33Protective Service Occupations 120 96 24 43 6 36 10 13 4 4 433.20Fire Fighting & Prevention Workers 2 2 0 2 0 0 0 0 0 0 033.30Law Enforcement Workers 15 13 2 4 0 5 2 3 0 1 033.90Other Protective Service Workers 103 81 22 37 6 31 8 10 4 3 4
35Food Preparation & Serving Related Occupations 738 387 351 171 197 118 72 69 43 29 3935.10Supervisors of Food Preparation & Serving Workers 67 50 17 36 12 6 1 3 4 5 035.20Cooks & Food Preparation Workers 273 189 84 68 38 68 22 45 16 8 835.30Food & Beverage Serving Workers 322 98 224 54 139 24 40 10 17 10 2835.90Other Food Preparation & Serving Related Workers 76 50 26 13 8 20 9 11 6 6 3
37Building & Grounds Cleaning & Maintenance Occupations 580 472 108 187 29 78 30 179 40 28 937.10Supervisors of Bldg./Grounds Cleaning & Maintenance Workers 16 13 3 2 2 7 1 4 0 0 037.20Building Cleaning & Pest Control Workers 203 118 85 32 20 43 28 34 30 9 737.30Grounds Maintenance Workers 331 313 18 142 7 17 1 136 8 18 237.90Other Building/Grounds Cleaning & Maintenance Occupations 30 28 2 11 0 11 0 5 2 1 0
25Connecticut Data for Affirmative Action Plans ~ 1st Quarter 2010

New Haven Labor Market AreaCharacteristics of Job Seekers registered w CT Work Career Center
SOC CodeOccupation
Total Applicants
Total Male
Total Female
White Male
White Female
Black Male
Black Female
Hispanic Male
Hispanic Female
Other Male
Other Female
39Personal Care & Service Occupations 138 23 115 11 66 8 27 2 13 2 939.20Animal Care & Service Workers 3 1 2 0 2 1 0 0 0 0 039.30Entertainment Attendants & Related Workers 4 3 1 2 0 0 0 0 0 1 139.40Funeral Service Workers 6 4 2 3 1 0 0 0 0 1 139.50Personal Appearance Workers 35 4 31 1 24 1 1 2 4 0 239.60Transportation, Tourism, & Lodging Attendants 3 2 1 2 1 0 0 0 0 0 039.90Other Personal Care & Service Workers 87 9 78 3 38 6 26 0 9 0 5
41Sales & Related Occupations 1,445 701 744 445 376 126 194 71 123 59 5141.10Supervisors of Sales Workers 141 81 60 53 41 13 11 7 5 8 341.20Retail Sales Workers 859 369 490 193 205 85 153 50 98 41 3441.30Sales Representatives, Services 239 139 100 114 78 12 9 8 7 5 641.40Sales Representatives, Wholesale & Manufacturing 26 17 9 15 7 0 0 2 2 0 041.90Other Sales & Related Workers 180 95 85 70 45 16 21 4 11 5 8
43Office & Administrative Support Occupations 2,486 740 1,746 401 1,073 163 351 83 169 93 15343.10Supervisors of Office & Administrative Support Workers 13 1 12 1 11 0 0 0 1 0 043.20Communications Equipment Operators 4 2 2 2 1 0 0 0 1 0 043.30Financial Clerks 231 31 200 22 147 5 31 1 12 3 1043.40Information & Record Clerks 987 362 625 190 322 72 154 38 68 62 8143.50Material Recording, Scheduling, Dispatch/Distribution Workers 247 175 72 88 36 48 20 31 13 8 343.60Secretaries & Administrative Assistants 508 25 483 14 351 6 65 2 32 3 3543.90Other Office & Administrative Support Workers 496 144 352 84 205 32 81 11 42 17 24
45Farming, Fishing, & Forestry Occupations 96 69 27 16 12 0 1 40 11 13 345.10Supervisors of Farming, Fishing, & Forestry Workers 1 0 1 0 1 0 0 0 0 0 045.20Agricultural Workers 75 54 21 11 9 0 1 40 11 3 045.30Fishing & Hunting Workers 1 1 0 0 0 0 0 0 0 1 045.90Other Farming, Fishing, & Forestry Workers 19 14 5 5 2 0 0 0 0 9 3
47Construction & Extraction Occupations 2,087 2,022 65 1,230 33 205 13 440 15 147 447.10Supervisors of Construction & Extraction Workers 2 2 0 1 0 1 0 0 0 0 047.20Construction Trades Workers 1,493 1,453 40 884 23 145 6 309 9 115 247.30Helpers, Construction Trades 419 406 13 243 4 37 5 103 3 23 147.40Other Construction & Related Workers 42 37 5 13 1 7 1 15 2 2 147.50Extraction Workers 14 14 0 7 0 2 0 3 0 2 047.90Other Construction & Extraction Occupations 117 110 7 82 5 13 1 10 1 5 0
49Installation, Maintenance, & Repair Occupations 606 585 21 362 12 94 4 88 3 41 249.10Supervisors of Installation, Maintenance, & Repair Workers 3 2 1 0 1 1 0 0 0 1 049.20Electrical & Electronic Equipment Mechanics, Installers 63 60 3 41 2 7 0 6 1 6 049.30Vehicle & Mobile Equipment Mechanics, Installers, Repairers 137 134 3 89 0 11 1 26 1 8 149.90Other Installation, Maintenance & Repair Occupations 403 389 14 232 9 75 3 56 1 26 1
26Connecticut Department of Labor - Office of Research ~ Labor Market Information

New Haven Labor Market AreaCharacteristics of Job Seekers registered w CT Work Career Center
SOC CodeOccupation
Total Applicants
Total Male
Total Female
White Male
White Female
Black Male
Black Female
Hispanic Male
Hispanic Female
Other Male
Other Female
51Production Occupations 1,710 1,204 506 507 164 244 83 354 202 99 5751.10Supervisors of Production Workers 7 7 0 6 0 0 0 1 0 0 051.20Assemblers & Fabricators 33 23 10 10 1 8 4 5 5 0 051.30Food Processing Workers 31 15 16 6 10 4 3 2 2 3 151.40Metal Workers & Plastic Workers 588 471 117 192 32 76 19 161 54 42 1251.50Printing Workers 64 54 10 31 7 10 0 11 3 2 051.60Textile, Apparel, & Furnishings Workers 31 10 21 3 5 3 3 3 11 1 251.70Woodworkers 6 5 1 3 1 0 0 2 0 0 051.80Plant & System Operators 6 6 0 6 0 0 0 0 0 0 051.90Other Production Occupations 944 613 331 250 108 143 54 169 127 51 42
53Transportation & Material Moving Occupations 951 788 163 365 38 184 37 174 76 65 1253.10Supervisors of Transportation & Material Moving Workers 10 8 2 7 2 0 0 1 0 0 053.20Air Transportation Workers 1 1 0 1 0 0 0 0 0 0 053.30Motor Vehicle Operators 554 492 62 254 21 116 24 75 12 47 553.40Rail Transportation Workers 3 3 0 1 0 0 0 1 0 1 053.50Water Transportation Workers 3 2 1 2 1 0 0 0 0 0 053.60Other Transportation Workers 14 9 5 4 2 2 0 2 1 1 253.70Material Moving Workers 324 232 92 76 11 54 13 89 63 13 553.90Other Transportation & Material Moving Occupations 42 41 1 20 1 12 0 6 0 3 0
55Military Specific Occupations 17 12 5 8 2 1 0 0 1 3 255.30Military Enlisted Tactical Operations & Air/Weapon 15 10 5 6 2 1 0 0 1 3 255.90Other Military Specific Occupations 2 2 0 2 0 0 0 0 0 0 0
99Unknown/Unclassifiable Occupations 1,710 1,006 704 553 346 134 131 111 105 208 12299.90Unknown/Unclassifiable Occupations 1,710 1,006 704 553 346 134 131 111 105 208 122
27Connecticut Data for Affirmative Action Plans ~ 1st Quarter 2010

Norwich-New London Labor Market AreaCharacteristics of Job Seekers registered w CT Work Career Center
SOC CodeOccupation
Total Applicants
Total Male
Total Female
White Male
White Female
Black Male
Black Female
Hispanic Male
Hispanic Female
Other Male
Other Female
00Total - All Occupations 6,677 3,888 2,789 2,736 1,824 428 377 306 269 418 319
11Management Occupations 404 215 189 174 150 12 6 8 12 21 2111.10Top Executives 157 94 63 75 53 6 1 1 2 12 711.20Advertising, Marketing, Promotions, Public Rel. Occupations 55 28 27 27 20 0 1 0 2 1 411.30Operations Specialties Managers 50 17 33 13 27 2 2 0 3 2 111.90Other Management Occupations 142 76 66 59 50 4 2 7 5 6 9
13Business & Financial Operations Occupations 169 56 113 35 84 10 11 7 10 4 813.10Business Operations Specialists 56 22 34 16 23 1 6 4 3 1 213.20Financial Specialists 70 21 49 12 40 4 1 3 3 2 513.90Other Business & Financial Operations Occupations 43 13 30 7 21 5 4 0 4 1 1
15Computer & Mathematical Occupations 109 71 38 47 23 11 6 6 2 7 715.10Computer Specialists 96 62 34 41 20 8 6 6 2 7 615.20Mathematical Scientists 3 2 1 0 1 2 0 0 0 0 015.90Other Computer & Mathematical Occupations 10 7 3 6 2 1 0 0 0 0 1
17Architecture & Engineering Occupations 113 92 21 79 12 5 2 3 0 5 717.10Architects, Surveyors, & Cartographers 5 4 1 4 0 0 0 0 0 0 117.20Engineers 74 61 13 52 7 4 1 1 0 4 517.30Drafters, Engineering, & Mapping Technicians 29 25 4 21 4 1 0 2 0 1 017.90Other Architecture & Engineering Occupations 5 2 3 2 1 0 1 0 0 0 1
19Life, Physical, & Social Science Occupations 58 25 33 21 25 0 2 0 2 4 419.10Life Scientists 12 4 8 4 7 0 1 0 0 0 019.20Physical Scientists 14 8 6 6 4 0 0 0 0 2 219.30Social Scientists & Related Workers 15 6 9 5 6 0 1 0 2 1 019.40Life, Physical, & Social Science Technicians 9 5 4 5 3 0 0 0 0 0 119.90Other Life, Physical, & Social Science Occupations 8 2 6 1 5 0 0 0 0 1 1
21Community & Social Services Occupations 80 28 52 18 27 9 16 0 5 1 421.10Counselors, Social Workers, Other Cmmty./Soc. Svcs. Workers 65 24 41 15 19 8 14 0 4 1 421.20Religious Workers 3 0 3 0 3 0 0 0 0 0 021.90Other Community & Social Services Occupations 12 4 8 3 5 1 2 0 1 0 0
23Legal Occupations 26 9 17 5 12 2 2 0 2 2 123.10Lawyers, Judges, & Related Workers 4 3 1 2 1 0 0 0 0 1 023.20Legal Support Workers 14 3 11 2 8 1 2 0 0 0 123.90Other Legal Occupations 8 3 5 1 3 1 0 0 2 1 0
28Connecticut Department of Labor - Office of Research ~ Labor Market Information

Norwich-New London Labor Market AreaCharacteristics of Job Seekers registered w CT Work Career Center
SOC CodeOccupation
Total Applicants
Total Male
Total Female
White Male
White Female
Black Male
Black Female
Hispanic Male
Hispanic Female
Other Male
Other Female
25Education, Training, & Library Occupations 81 21 60 11 42 6 10 1 5 3 325.10Postsecondary Teachers 13 4 9 2 3 1 5 0 1 1 025.20Primary, Secondary & Special Education Teachers 22 5 17 3 13 1 3 1 0 0 125.30Other Teachers & Instructors 9 4 5 1 5 2 0 0 0 1 025.40Librarians, Curators, & Archivists 2 1 1 0 1 1 0 0 0 0 025.90Other Education, Training, & Library Occupations 35 7 28 5 20 1 2 0 4 1 2
27Arts, Design, Entertainment, Sports, & Media Occupations 74 30 44 24 34 1 6 4 1 1 327.10Art & Design Workers 36 9 27 8 22 0 2 0 1 1 227.20Entertainers & Performers, Sports & Related Workers 8 4 4 3 4 0 0 1 0 0 027.30Media & Communication Workers 19 9 10 8 7 0 3 1 0 0 027.40Media & Communication Equipment Workers 4 3 1 1 0 1 0 1 0 0 127.90Other Arts, Design, Entertainment, Sports, & Media Workers 7 5 2 4 1 0 1 1 0 0 0
29Healthcare Practitioners & Technical Occupations 130 37 93 22 57 9 18 1 10 5 829.10Health Diagnosing & Treating Practitioners 54 10 44 5 35 3 3 0 2 2 429.20Health Technologists & Technicians 56 19 37 13 17 3 11 1 6 2 329.90Other Healthcare Practitioners & Technical Occupations 20 8 12 4 5 3 4 0 2 1 1
31Healthcare Support Occupations 299 42 257 22 134 14 69 4 28 2 2631.10Nursing, Psychiatric, & Home Health Aides 181 19 162 9 84 9 44 1 15 0 1931.20Occupational & Physical Therapist Assistants & Aides 2 1 1 1 0 0 0 0 0 0 131.90Other Healthcare Support Occupations 116 22 94 12 50 5 25 3 13 2 6
33Protective Service Occupations 89 79 10 57 5 10 3 8 1 4 133.10First-Line Supervisors/Mgrs. of Protective Service Workers 1 1 0 1 0 0 0 0 0 0 033.20Fire Fighting & Prevention Workers 1 1 0 1 0 0 0 0 0 0 033.30Law Enforcement Workers 15 12 3 7 1 1 2 4 0 0 033.90Other Protective Service Workers 72 65 7 48 4 9 1 4 1 4 1
35Food Preparation & Serving Related Occupations 529 271 258 137 186 57 21 41 26 36 2535.10Supervisors of Food Preparation & Serving Workers 38 27 11 18 6 2 0 4 2 3 335.20Cooks & Food Preparation Workers 175 122 53 55 37 25 4 22 6 20 635.30Food & Beverage Serving Workers 253 86 167 49 130 20 10 9 14 8 1335.90Other Food Preparation & Serving Related Workers 63 36 27 15 13 10 7 6 4 5 3
37Building & Grounds Cleaning & Maintenance Occupations 300 209 91 129 45 25 16 37 20 18 1037.10Supervisors of Bldg./Grounds Cleaning & Maintenance Workers 5 4 1 1 0 3 1 0 0 0 037.20Building Cleaning & Pest Control Workers 144 67 77 30 36 15 14 15 18 7 937.30Grounds Maintenance Workers 125 115 10 86 8 1 0 19 1 9 137.90Other Building/Grounds Cleaning & Maintenance Occupations 26 23 3 12 1 6 1 3 1 2 0
29Connecticut Data for Affirmative Action Plans ~ 1st Quarter 2010

Norwich-New London Labor Market AreaCharacteristics of Job Seekers registered w CT Work Career Center
SOC CodeOccupation
Total Applicants
Total Male
Total Female
White Male
White Female
Black Male
Black Female
Hispanic Male
Hispanic Female
Other Male
Other Female
39Personal Care & Service Occupations 168 72 96 38 54 14 18 7 13 13 1139.10Supervisors of Personal Care & Service Workers 8 5 3 4 2 1 0 0 0 0 139.20Animal Care & Service Workers 3 1 2 1 2 0 0 0 0 0 039.30Entertainment Attendants & Related Workers 83 51 32 29 18 7 5 6 5 9 439.40Funeral Service Workers 1 1 0 0 0 0 0 0 0 1 039.50Personal Appearance Workers 18 0 18 0 11 0 2 0 2 0 339.60Transportation, Tourism, & Lodging Attendants 1 0 1 0 0 0 1 0 0 0 039.90Other Personal Care & Service Workers 54 14 40 4 21 6 10 1 6 3 3
41Sales & Related Occupations 632 279 353 180 234 44 58 13 37 42 2441.10Supervisors of Sales Workers 61 35 26 22 21 3 1 2 3 8 141.20Retail Sales Workers 426 166 260 104 170 32 47 5 27 25 1641.30Sales Representatives, Services 70 41 29 28 19 3 4 2 3 8 341.40Sales Representatives, Wholesale & Manufacturing 12 9 3 8 3 1 0 0 0 0 041.90Other Sales & Related Workers 63 28 35 18 21 5 6 4 4 1 4
43Office & Administrative Support Occupations 942 272 670 175 470 37 64 26 45 34 9143.10Supervisors of Office & Administrative Support Workers 4 1 3 1 2 0 0 0 0 0 143.20Communications Equipment Operators 3 0 3 0 1 0 2 0 0 0 043.30Financial Clerks 59 5 54 5 42 0 3 0 3 0 643.40Information & Record Clerks 408 144 264 89 163 21 29 13 24 21 4843.50Material Recording, Scheduling, Dispatch/Distribution Workers 71 50 21 30 18 8 3 7 0 5 043.60Secretaries & Administrative Assistants 190 11 179 7 144 1 13 0 7 3 1543.90Other Office & Administrative Support Workers 207 61 146 43 100 7 14 6 11 5 21
45Farming, Fishing, & Forestry Occupations 26 20 6 13 3 2 1 1 0 4 245.20Agricultural Workers 9 8 1 6 1 1 0 1 0 0 045.30Fishing & Hunting Workers 2 2 0 2 0 0 0 0 0 0 045.90Other Farming, Fishing, & Forestry Workers 15 10 5 5 2 1 1 0 0 4 2
47Construction & Extraction Occupations 872 846 26 670 21 53 2 41 0 82 347.10Supervisors of Construction & Extraction Workers 5 4 1 4 1 0 0 0 0 0 047.20Construction Trades Workers 644 628 16 495 13 36 1 31 0 66 247.30Helpers, Construction Trades 142 141 1 111 1 11 0 8 0 11 047.40Other Construction & Related Workers 14 13 1 10 1 1 0 1 0 1 047.50Extraction Workers 2 2 0 0 0 0 0 0 0 2 047.90Other Construction & Extraction Occupations 65 58 7 50 5 5 1 1 0 2 1
49Installation, Maintenance, & Repair Occupations 253 242 11 189 6 21 1 19 1 13 349.10Supervisors of Installation, Maintenance, & Repair Workers 4 4 0 3 0 1 0 0 0 0 049.20Electrical & Electronic Equipment Mechanics, Installers 36 34 2 30 0 2 0 1 0 1 249.30Vehicle & Mobile Equipment Mechanics, Installers, Repairers 61 60 1 52 1 1 0 3 0 4 049.90Other Installation, Maintenance & Repair Occupations 152 144 8 104 5 17 1 15 1 8 1
30Connecticut Department of Labor - Office of Research ~ Labor Market Information

Norwich-New London Labor Market AreaCharacteristics of Job Seekers registered w CT Work Career Center
SOC CodeOccupation
Total Applicants
Total Male
Total Female
White Male
White Female
Black Male
Black Female
Hispanic Male
Hispanic Female
Other Male
Other Female
51Production Occupations 416 338 78 231 44 38 8 35 18 34 851.10Supervisors of Production Workers 1 1 0 1 0 0 0 0 0 0 051.20Assemblers & Fabricators 21 18 3 10 3 4 0 1 0 3 051.30Food Processing Workers 10 8 2 5 1 1 0 1 0 1 151.40Metal Workers & Plastic Workers 137 124 13 88 9 15 1 13 2 8 151.50Printing Workers 21 20 1 18 1 0 0 0 0 2 051.60Textile, Apparel, & Furnishings Workers 6 4 2 3 1 0 0 1 1 0 051.70Woodworkers 4 4 0 4 0 0 0 0 0 0 051.80Plant & System Operators 8 7 1 6 1 0 0 0 0 1 051.90Other Production Occupations 208 152 56 96 28 18 7 19 15 19 6
53Transportation & Material Moving Occupations 296 252 44 176 21 29 10 24 12 23 153.10Supervisors of Transportation & Material Moving Workers 6 4 2 1 1 1 0 1 1 1 053.20Air Transportation Workers 3 3 0 3 0 0 0 0 0 0 053.30Motor Vehicle Operators 182 159 23 117 13 14 5 13 4 15 153.50Water Transportation Workers 2 2 0 2 0 0 0 0 0 0 053.60Other Transportation Workers 5 4 1 3 1 0 0 0 0 1 053.70Material Moving Workers 77 61 16 37 5 11 5 8 6 5 053.90Other Transportation & Material Moving Occupations 21 19 2 13 1 3 0 2 1 1 0
55Military Specific Occupations 18 13 5 11 4 0 0 1 1 1 055.20First-Line Enlisted Military Supervisors/Managers 2 2 0 2 0 0 0 0 0 0 055.30Military Enlisted Tactical Operations & Air/Weapon 13 11 2 9 2 0 0 1 0 1 055.90Other Military Specific Occupations 3 0 3 0 2 0 0 0 1 0 0
99Unknown/Unclassifiable Occupations 593 369 224 272 131 19 27 19 18 59 4899.90Unknown/Unclassifiable Occupations 593 369 224 272 131 19 27 19 18 59 48
31Connecticut Data for Affirmative Action Plans ~ 1st Quarter 2010

Torrington Labor Market AreaCharacteristics of Job Seekers registered w CT Work Career Center
SOC CodeOccupation
Total Applicants
Total Male
Total Female
White Male
White Female
Black Male
Black Female
Hispanic Male
Hispanic Female
Other Male
Other Female
00Total - All Occupations 2,705 1,742 963 1,436 761 54 25 78 74 174 103
11Management Occupations 156 90 66 81 57 1 1 2 3 6 511.10Top Executives 51 29 22 26 20 0 0 0 0 3 211.20Advertising, Marketing, Promotions, Public Rel. Occupations 13 9 4 9 4 0 0 0 0 0 011.30Operations Specialties Managers 41 21 20 19 18 1 0 1 1 0 111.90Other Management Occupations 51 31 20 27 15 0 1 1 2 3 2
13Business & Financial Operations Occupations 55 21 34 19 30 2 1 0 1 0 213.10Business Operations Specialists 24 9 15 9 13 0 0 0 1 0 113.20Financial Specialists 27 10 17 9 15 1 1 0 0 0 113.90Other Business & Financial Operations Occupations 4 2 2 1 2 1 0 0 0 0 0
15Computer & Mathematical Occupations 39 30 9 24 5 1 0 0 0 5 415.10Computer Specialists 30 25 5 22 4 1 0 0 0 2 115.90Other Computer & Mathematical Occupations 9 5 4 2 1 0 0 0 0 3 3
17Architecture & Engineering Occupations 54 48 6 42 4 0 0 0 1 6 117.10Architects, Surveyors, & Cartographers 4 4 0 3 0 0 0 0 0 1 017.20Engineers 30 26 4 22 2 0 0 0 1 4 117.30Drafters, Engineering, & Mapping Technicians 16 14 2 13 2 0 0 0 0 1 017.90Other Architecture & Engineering Occupations 4 4 0 4 0 0 0 0 0 0 0
19Life, Physical, & Social Science Occupations 13 7 6 6 3 0 0 0 0 1 319.10Life Scientists 2 1 1 1 0 0 0 0 0 0 119.20Physical Scientists 3 3 0 2 0 0 0 0 0 1 019.30Social Scientists & Related Workers 4 1 3 1 2 0 0 0 0 0 119.40Life, Physical, & Social Science Technicians 4 2 2 2 1 0 0 0 0 0 1
21Community & Social Services Occupations 23 9 14 6 10 2 0 0 1 1 321.10Counselors, Social Workers, Other Cmmty./Soc. Svcs. Workers 19 7 12 5 8 2 0 0 1 0 321.90Other Community & Social Services Occupations 4 2 2 1 2 0 0 0 0 1 0
23Legal Occupations 12 5 7 4 7 0 0 1 0 0 023.10Lawyers, Judges, & Related Workers 4 3 1 2 1 0 0 1 0 0 023.20Legal Support Workers 6 1 5 1 5 0 0 0 0 0 023.90Other Legal Occupations 2 1 1 1 1 0 0 0 0 0 0
25Education, Training, & Library Occupations 33 10 23 7 21 1 0 2 0 0 225.10Postsecondary Teachers 3 1 2 0 2 0 0 1 0 0 025.20Primary, Secondary & Special Education Teachers 16 6 10 5 9 0 0 1 0 0 125.30Other Teachers & Instructors 1 1 0 0 0 1 0 0 0 0 025.90Other Education, Training, & Library Occupations 13 2 11 2 10 0 0 0 0 0 1
32Connecticut Department of Labor - Office of Research ~ Labor Market Information

Torrington Labor Market AreaCharacteristics of Job Seekers registered w CT Work Career Center
SOC CodeOccupation
Total Applicants
Total Male
Total Female
White Male
White Female
Black Male
Black Female
Hispanic Male
Hispanic Female
Other Male
Other Female
27Arts, Design, Entertainment, Sports, & Media Occupations 28 16 12 13 12 1 0 0 0 2 027.10Art & Design Workers 17 9 8 8 8 0 0 0 0 1 027.20Entertainers & Performers, Sports & Related Workers 4 3 1 2 1 0 0 0 0 1 027.30Media & Communication Workers 4 3 1 2 1 1 0 0 0 0 027.90Other Arts, Design, Entertainment, Sports, & Media Workers 3 1 2 1 2 0 0 0 0 0 0
29Healthcare Practitioners & Technical Occupations 34 6 28 6 21 0 2 0 2 0 329.10Health Diagnosing & Treating Practitioners 11 2 9 2 8 0 1 0 0 0 029.20Health Technologists & Technicians 19 4 15 4 12 0 1 0 0 0 229.90Other Healthcare Practitioners & Technical Occupations 4 0 4 0 1 0 0 0 2 0 1
31Healthcare Support Occupations 126 11 115 7 94 1 4 2 10 1 731.10Nursing, Psychiatric, & Home Health Aides 97 7 90 4 74 1 3 1 8 1 531.90Other Healthcare Support Occupations 29 4 25 3 20 0 1 1 2 0 2
33Protective Service Occupations 16 10 6 8 5 0 0 1 1 1 033.30Law Enforcement Workers 4 2 2 1 2 0 0 1 0 0 033.90Other Protective Service Workers 12 8 4 7 3 0 0 0 1 1 0
35Food Preparation & Serving Related Occupations 121 62 59 41 46 7 2 6 5 8 635.10Supervisors of Food Preparation & Serving Workers 21 20 1 13 1 3 0 1 0 3 035.20Cooks & Food Preparation Workers 42 29 13 19 10 4 0 3 2 3 135.30Food & Beverage Serving Workers 45 6 39 5 32 0 2 0 3 1 235.90Other Food Preparation & Serving Related Workers 13 7 6 4 3 0 0 2 0 1 3
37Building & Grounds Cleaning & Maintenance Occupations 143 119 24 101 22 4 0 4 0 10 237.10Supervisors of Bldg./Grounds Cleaning & Maintenance Workers 6 4 2 4 2 0 0 0 0 0 037.20Building Cleaning & Pest Control Workers 27 13 14 12 14 1 0 0 0 0 037.30Grounds Maintenance Workers 107 99 8 84 6 3 0 4 0 8 237.90Other Building/Grounds Cleaning & Maintenance Occupations 3 3 0 1 0 0 0 0 0 2 0
39Personal Care & Service Occupations 25 6 19 4 15 0 3 2 1 0 039.30Entertainment Attendants & Related Workers 4 2 2 2 1 0 1 0 0 0 039.40Funeral Service Workers 1 1 0 0 0 0 0 1 0 0 039.50Personal Appearance Workers 5 1 4 1 3 0 0 0 1 0 039.90Other Personal Care & Service Workers 15 2 13 1 11 0 2 1 0 0 0
41Sales & Related Occupations 193 88 105 76 86 4 3 4 9 4 741.10Supervisors of Sales Workers 22 16 6 14 6 0 0 1 0 1 041.20Retail Sales Workers 119 41 78 35 59 3 3 2 9 1 741.30Sales Representatives, Services 32 17 15 14 15 1 0 1 0 1 041.40Sales Representatives, Wholesale & Manufacturing 9 8 1 8 1 0 0 0 0 0 041.90Other Sales & Related Workers 11 6 5 5 5 0 0 0 0 1 0
33Connecticut Data for Affirmative Action Plans ~ 1st Quarter 2010

Torrington Labor Market AreaCharacteristics of Job Seekers registered w CT Work Career Center
SOC CodeOccupation
Total Applicants
Total Male
Total Female
White Male
White Female
Black Male
Black Female
Hispanic Male
Hispanic Female
Other Male
Other Female
43Office & Administrative Support Occupations 299 70 229 55 190 2 6 6 8 7 2543.10Supervisors of Office & Administrative Support Workers 3 0 3 0 2 0 0 0 0 0 143.20Communications Equipment Operators 2 0 2 0 0 0 0 0 0 0 243.30Financial Clerks 39 4 35 3 31 0 1 0 0 1 343.40Information & Record Clerks 96 27 69 22 59 0 1 1 2 4 743.50Material Recording, Scheduling, Dispatch/Distribution Workers 30 24 6 20 5 1 0 2 0 1 143.60Secretaries & Administrative Assistants 71 2 69 0 59 0 2 2 3 0 543.90Other Office & Administrative Support Workers 58 13 45 10 34 1 2 1 3 1 6
45Farming, Fishing, & Forestry Occupations 25 18 7 12 2 0 0 0 0 6 545.10Supervisors of Farming, Fishing, & Forestry Workers 2 2 0 2 0 0 0 0 0 0 045.20Agricultural Workers 9 8 1 7 1 0 0 0 0 1 045.90Other Farming, Fishing, & Forestry Workers 14 8 6 3 1 0 0 0 0 5 5
47Construction & Extraction Occupations 543 534 9 472 8 4 0 14 0 44 147.10Supervisors of Construction & Extraction Workers 4 4 0 4 0 0 0 0 0 0 047.20Construction Trades Workers 373 369 4 330 3 3 0 7 0 29 147.30Helpers, Construction Trades 134 131 3 118 3 1 0 5 0 7 047.40Other Construction & Related Workers 10 9 1 7 1 0 0 1 0 1 047.50Extraction Workers 7 7 0 2 0 0 0 0 0 5 047.90Other Construction & Extraction Occupations 15 14 1 11 1 0 0 1 0 2 0
49Installation, Maintenance, & Repair Occupations 107 107 0 89 0 3 0 7 0 8 049.10Supervisors of Installation, Maintenance, & Repair Workers 1 1 0 1 0 0 0 0 0 0 049.20Electrical & Electronic Equipment Mechanics, Installers 8 8 0 7 0 0 0 0 0 1 049.30Vehicle & Mobile Equipment Mechanics, Installers, Repairers 35 35 0 31 0 1 0 1 0 2 049.90Other Installation, Maintenance & Repair Occupations 63 63 0 50 0 2 0 6 0 5 0
51Production Occupations 338 233 105 179 65 9 1 21 27 24 1251.20Assemblers & Fabricators 16 7 9 4 4 2 0 1 3 0 251.30Food Processing Workers 1 1 0 1 0 0 0 0 0 0 051.40Metal Workers & Plastic Workers 137 103 34 80 18 2 1 15 11 6 451.50Printing Workers 13 10 3 9 1 0 0 0 2 1 051.60Textile, Apparel, & Furnishings Workers 7 0 7 0 5 0 0 0 1 0 151.70Woodworkers 6 6 0 5 0 0 0 0 0 1 051.80Plant & System Operators 3 3 0 1 0 0 0 0 0 2 051.90Other Production Occupations 155 103 52 79 37 5 0 5 10 14 5
34Connecticut Department of Labor - Office of Research ~ Labor Market Information

Torrington Labor Market AreaCharacteristics of Job Seekers registered w CT Work Career Center
SOC CodeOccupation
Total Applicants
Total Male
Total Female
White Male
White Female
Black Male
Black Female
Hispanic Male
Hispanic Female
Other Male
Other Female
53Transportation & Material Moving Occupations 160 134 26 107 17 8 2 5 3 14 453.10Supervisors of Transportation & Material Moving Workers 2 1 1 1 1 0 0 0 0 0 053.30Motor Vehicle Operators 95 89 6 76 4 3 0 2 0 8 253.60Other Transportation Workers 3 3 0 2 0 0 0 0 0 1 053.70Material Moving Workers 53 35 18 24 11 5 2 3 3 3 253.90Other Transportation & Material Moving Occupations 7 6 1 4 1 0 0 0 0 2 0
55Military Specific Occupations 2 2 0 1 0 0 0 0 0 1 055.30Military Enlisted Tactical Operations & Air/Weapon 2 2 0 1 0 0 0 0 0 1 0
99Unknown/Unclassifiable Occupations 160 106 54 76 41 4 0 1 2 25 1199.90Unknown/Unclassifiable Occupations 160 106 54 76 41 4 0 1 2 25 11
35Connecticut Data for Affirmative Action Plans ~ 1st Quarter 2010

Waterbury Labor Market AreaCharacteristics of Job Seekers registered w CT Work Career Center
SOC CodeOccupation
Total Applicants
Total Male
Total Female
White Male
White Female
Black Male
Black Female
Hispanic Male
Hispanic Female
Other Male
Other Female
00Total - All Occupations 8,985 5,375 3,610 3,151 1,863 746 621 930 804 548 322
11Management Occupations 480 287 193 223 150 18 13 19 20 27 1011.10Top Executives 175 112 63 88 50 4 4 9 7 11 211.20Advertising, Marketing, Promotions, Public Rel. Occupations 81 58 23 44 18 4 3 3 2 7 011.30Operations Specialties Managers 81 37 44 25 34 5 3 3 2 4 511.90Other Management Occupations 143 80 63 66 48 5 3 4 9 5 3
13Business & Financial Operations Occupations 225 102 123 78 83 11 23 6 12 7 513.10Business Operations Specialists 73 30 43 23 33 4 4 2 4 1 213.20Financial Specialists 110 54 56 45 35 3 13 1 5 5 313.90Other Business & Financial Operations Occupations 42 18 24 10 15 4 6 3 3 1 0
15Computer & Mathematical Occupations 124 90 34 68 17 11 4 5 8 6 515.10Computer Specialists 117 87 30 67 15 10 3 5 8 5 415.90Other Computer & Mathematical Occupations 7 3 4 1 2 1 1 0 0 1 1
17Architecture & Engineering Occupations 126 100 26 75 15 11 2 7 4 7 517.10Architects, Surveyors, & Cartographers 11 8 3 7 2 0 0 1 0 0 117.20Engineers 71 59 12 41 7 8 1 3 1 7 317.30Drafters, Engineering, & Mapping Technicians 40 31 9 26 4 2 1 3 3 0 117.90Other Architecture & Engineering Occupations 4 2 2 1 2 1 0 0 0 0 0
19Life, Physical, & Social Science Occupations 41 12 29 7 24 1 2 3 1 1 219.10Life Scientists 3 2 1 1 1 0 0 0 0 1 019.20Physical Scientists 9 2 7 2 5 0 1 0 0 0 119.30Social Scientists & Related Workers 19 3 16 2 13 0 1 1 1 0 119.40Life, Physical, & Social Science Technicians 6 4 2 2 2 0 0 2 0 0 019.90Other Life, Physical, & Social Science Occupations 4 1 3 0 3 1 0 0 0 0 0
21Community & Social Services Occupations 103 30 73 10 30 15 26 5 11 0 621.10Counselors, Social Workers, Other Cmmty./Soc. Svcs. Workers 82 24 58 8 25 13 24 3 5 0 421.90Other Community & Social Services Occupations 21 6 15 2 5 2 2 2 6 0 2
23Legal Occupations 36 10 26 5 19 2 3 1 2 2 223.10Lawyers, Judges, & Related Workers 6 5 1 3 0 1 1 0 0 1 023.20Legal Support Workers 26 3 23 1 18 0 2 1 1 1 223.90Other Legal Occupations 4 2 2 1 1 1 0 0 1 0 0
25Education, Training, & Library Occupations 84 25 59 16 30 3 11 4 15 2 325.10Postsecondary Teachers 14 4 10 3 3 1 2 0 5 0 025.20Primary, Secondary & Special Education Teachers 20 8 12 7 8 0 1 1 2 0 125.30Other Teachers & Instructors 12 4 8 4 6 0 2 0 0 0 025.40Librarians, Curators, & Archivists 1 0 1 0 1 0 0 0 0 0 025.90Other Education, Training, & Library Occupations 37 9 28 2 12 2 6 3 8 2 2
36Connecticut Department of Labor - Office of Research ~ Labor Market Information

Waterbury Labor Market AreaCharacteristics of Job Seekers registered w CT Work Career Center
SOC CodeOccupation
Total Applicants
Total Male
Total Female
White Male
White Female
Black Male
Black Female
Hispanic Male
Hispanic Female
Other Male
Other Female
27Arts, Design, Entertainment, Sports, & Media Occupations 49 29 20 18 15 4 1 6 2 1 227.10Art & Design Workers 31 19 12 12 8 4 0 3 2 0 227.20Entertainers & Performers, Sports & Related Workers 1 0 1 0 0 0 1 0 0 0 027.30Media & Communication Workers 8 4 4 3 4 0 0 1 0 0 027.40Media & Communication Equipment Workers 3 2 1 1 1 0 0 1 0 0 027.90Other Arts, Design, Entertainment, Sports, & Media Workers 6 4 2 2 2 0 0 1 0 1 0
29Healthcare Practitioners & Technical Occupations 141 37 104 22 68 7 17 2 14 6 529.10Health Diagnosing & Treating Practitioners 43 7 36 5 29 0 3 0 2 2 229.20Health Technologists & Technicians 72 22 50 12 30 5 10 2 7 3 329.90Other Healthcare Practitioners & Technical Occupations 26 8 18 5 9 2 4 0 5 1 0
31Healthcare Support Occupations 456 53 403 19 122 20 146 11 107 3 2831.10Nursing, Psychiatric, & Home Health Aides 338 27 311 6 85 11 116 9 87 1 2331.20Occupational & Physical Therapist Assistants & Aides 2 0 2 0 0 0 0 0 2 0 031.90Other Healthcare Support Occupations 116 26 90 13 37 9 30 2 18 2 5
33Protective Service Occupations 81 62 19 31 7 14 5 11 6 6 133.10First-Line Supervisors/Mgrs. of Protective Service Workers 2 1 1 0 0 1 0 0 0 0 133.20Fire Fighting & Prevention Workers 2 2 0 2 0 0 0 0 0 0 033.30Law Enforcement Workers 15 10 5 5 2 4 1 1 2 0 033.90Other Protective Service Workers 62 49 13 24 5 9 4 10 4 6 0
35Food Preparation & Serving Related Occupations 415 230 185 96 112 56 39 53 27 25 735.10Supervisors of Food Preparation & Serving Workers 38 32 6 21 4 7 0 3 2 1 035.20Cooks & Food Preparation Workers 166 118 48 39 21 33 19 32 7 14 135.30Food & Beverage Serving Workers 154 40 114 19 79 6 17 8 12 7 635.90Other Food Preparation & Serving Related Workers 57 40 17 17 8 10 3 10 6 3 0
37Building & Grounds Cleaning & Maintenance Occupations 359 305 54 147 20 40 10 91 16 27 837.10Supervisors of Bldg./Grounds Cleaning & Maintenance Workers 8 6 2 6 0 0 1 0 0 0 137.20Building Cleaning & Pest Control Workers 112 69 43 28 14 16 9 16 15 9 537.30Grounds Maintenance Workers 210 202 8 103 5 16 0 68 1 15 237.90Other Building/Grounds Cleaning & Maintenance Occupations 29 28 1 10 1 8 0 7 0 3 0
39Personal Care & Service Occupations 91 26 65 12 33 5 11 5 12 4 939.20Animal Care & Service Workers 4 1 3 0 2 0 0 1 0 0 139.30Entertainment Attendants & Related Workers 3 1 2 1 0 0 0 0 1 0 139.40Funeral Service Workers 3 3 0 3 0 0 0 0 0 0 039.50Personal Appearance Workers 25 7 18 2 12 0 0 4 4 1 239.60Transportation, Tourism, & Lodging Attendants 2 1 1 1 0 0 0 0 1 0 039.90Other Personal Care & Service Workers 54 13 41 5 19 5 11 0 6 3 5
37Connecticut Data for Affirmative Action Plans ~ 1st Quarter 2010

Waterbury Labor Market AreaCharacteristics of Job Seekers registered w CT Work Career Center
SOC CodeOccupation
Total Applicants
Total Male
Total Female
White Male
White Female
Black Male
Black Female
Hispanic Male
Hispanic Female
Other Male
Other Female
41Sales & Related Occupations 777 363 414 235 201 57 80 48 99 23 3441.10Supervisors of Sales Workers 53 35 18 29 11 4 0 2 2 0 541.20Retail Sales Workers 498 194 304 106 140 34 61 35 83 19 2041.30Sales Representatives, Services 106 64 42 56 26 4 9 3 6 1 141.40Sales Representatives, Wholesale & Manufacturing 23 19 4 10 2 4 1 3 0 2 141.90Other Sales & Related Workers 97 51 46 34 22 11 9 5 8 1 7
43Office & Administrative Support Occupations 1,324 463 861 251 531 74 126 82 131 56 7343.10Supervisors of Office & Administrative Support Workers 7 1 6 1 4 0 0 0 2 0 043.20Communications Equipment Operators 1 1 0 0 0 0 0 0 0 1 043.30Financial Clerks 98 9 89 7 62 0 5 0 13 2 943.40Information & Record Clerks 544 209 335 120 168 26 60 28 66 35 4143.50Material Recording, Scheduling, Dispatch/Distribution Workers 171 129 42 55 24 30 4 38 12 6 243.60Secretaries & Administrative Assistants 216 13 203 10 159 2 21 0 15 1 843.90Other Office & Administrative Support Workers 287 101 186 58 114 16 36 16 23 11 13
45Farming, Fishing, & Forestry Occupations 24 16 8 5 6 0 0 6 0 5 245.10Supervisors of Farming, Fishing, & Forestry Workers 1 0 1 0 0 0 0 0 0 0 145.20Agricultural Workers 18 13 5 4 5 0 0 6 0 3 045.30Fishing & Hunting Workers 1 1 0 1 0 0 0 0 0 0 045.90Other Farming, Fishing, & Forestry Workers 4 2 2 0 1 0 0 0 0 2 1
47Construction & Extraction Occupations 1,093 1,075 18 739 11 91 3 125 3 120 147.10Supervisors of Construction & Extraction Workers 7 7 0 5 0 0 0 0 0 2 047.20Construction Trades Workers 797 786 11 533 6 61 1 94 3 98 147.30Helpers, Construction Trades 196 195 1 139 1 19 0 20 0 17 047.40Other Construction & Related Workers 24 23 1 13 1 6 0 4 0 0 047.50Extraction Workers 4 4 0 1 0 3 0 0 0 0 047.90Other Construction & Extraction Occupations 65 60 5 48 3 2 2 7 0 3 0
49Installation, Maintenance, & Repair Occupations 294 288 6 176 1 38 2 54 3 20 049.10Supervisors of Installation, Maintenance, & Repair Workers 3 3 0 2 0 1 0 0 0 0 049.20Electrical & Electronic Equipment Mechanics, Installers 36 36 0 20 0 7 0 8 0 1 049.30Vehicle & Mobile Equipment Mechanics, Installers, Repairers 76 75 1 47 0 11 0 10 1 7 049.90Other Installation, Maintenance & Repair Occupations 179 174 5 107 1 19 2 36 2 12 0
38Connecticut Department of Labor - Office of Research ~ Labor Market Information

Waterbury Labor Market AreaCharacteristics of Job Seekers registered w CT Work Career Center
SOC CodeOccupation
Total Applicants
Total Male
Total Female
White Male
White Female
Black Male
Black Female
Hispanic Male
Hispanic Female
Other Male
Other Female
51Production Occupations 1,302 840 462 388 177 130 37 239 193 83 5551.10Supervisors of Production Workers 8 8 0 5 0 3 0 0 0 0 051.20Assemblers & Fabricators 36 17 19 9 6 3 3 5 8 0 251.30Food Processing Workers 18 7 11 5 6 2 1 0 3 0 151.40Metal Workers & Plastic Workers 633 456 177 233 78 62 9 123 64 38 2651.50Printing Workers 14 10 4 8 2 1 0 1 2 0 051.60Textile, Apparel, & Furnishings Workers 24 5 19 1 9 1 0 2 7 1 351.70Woodworkers 4 4 0 3 0 0 0 1 0 0 051.80Plant & System Operators 4 3 1 1 0 0 0 1 1 1 051.90Other Production Occupations 561 330 231 123 76 58 24 106 108 43 23
53Transportation & Material Moving Occupations 574 452 122 232 29 96 17 92 66 32 1053.10Supervisors of Transportation & Material Moving Workers 1 1 0 1 0 0 0 0 0 0 053.20Air Transportation Workers 3 2 1 2 0 0 0 0 0 0 153.30Motor Vehicle Operators 276 241 35 140 17 42 8 37 7 22 353.40Rail Transportation Workers 1 1 0 0 0 1 0 0 0 0 053.50Water Transportation Workers 2 2 0 1 0 1 0 0 0 0 053.60Other Transportation Workers 10 7 3 5 3 2 0 0 0 0 053.70Material Moving Workers 240 160 80 64 7 42 8 46 59 8 653.90Other Transportation & Material Moving Occupations 41 38 3 19 2 8 1 9 0 2 0
55Military Specific Occupations 10 10 0 5 0 1 0 0 0 4 055.10Military Officer Special & Tactical Operations Leaders/Mgrs. 1 1 0 0 0 0 0 0 0 1 055.30Military Enlisted Tactical Operations & Air/Weapon 7 7 0 5 0 0 0 0 0 2 055.90Other Military Specific Occupations 2 2 0 0 0 1 0 0 0 1 0
99Unknown/Unclassifiable Occupations 776 470 306 293 162 41 43 55 52 81 4999.90Unknown/Unclassifiable Occupations 776 470 306 293 162 41 43 55 52 81 49
39Connecticut Data for Affirmative Action Plans ~ 1st Quarter 2010

Willimantic-Danielson Labor Market AreaCharacteristics of Job Seekers registered w CT Work Career Center
SOC CodeOccupation
Total Applicants
Total Male
Total Female
White Male
White Female
Black Male
Black Female
Hispanic Male
Hispanic Female
Other Male
Other Female
00Total - All Occupations 6,108 3,740 2,368 3,001 1,847 118 77 292 262 329 182
11Management Occupations 391 237 154 213 131 6 0 5 7 13 1611.10Top Executives 139 92 47 84 40 0 0 1 3 7 411.20Advertising, Marketing, Promotions, Public Rel. Occupations 51 29 22 26 18 0 0 2 1 1 311.30Operations Specialties Managers 69 32 37 31 33 1 0 0 0 0 411.90Other Management Occupations 132 84 48 72 40 5 0 2 3 5 5
13Business & Financial Operations Occupations 129 60 69 50 55 3 2 3 3 4 913.10Business Operations Specialists 40 22 18 21 13 0 0 0 1 1 413.20Financial Specialists 65 27 38 22 30 1 2 1 2 3 413.90Other Business & Financial Operations Occupations 24 11 13 7 12 2 0 2 0 0 1
15Computer & Mathematical Occupations 98 67 31 53 22 3 2 4 3 7 415.10Computer Specialists 85 58 27 51 22 2 1 4 2 1 215.20Mathematical Scientists 3 2 1 1 0 1 0 0 1 0 015.90Other Computer & Mathematical Occupations 10 7 3 1 0 0 1 0 0 6 2
17Architecture & Engineering Occupations 102 86 16 73 14 3 0 3 2 7 017.10Architects, Surveyors, & Cartographers 12 10 2 9 2 0 0 1 0 0 017.20Engineers 57 48 9 42 8 1 0 2 1 3 017.30Drafters, Engineering, & Mapping Technicians 26 23 3 19 2 1 0 0 1 3 017.90Other Architecture & Engineering Occupations 7 5 2 3 2 1 0 0 0 1 0
19Life, Physical, & Social Science Occupations 18 15 3 13 3 0 0 0 0 2 019.10Life Scientists 2 2 0 1 0 0 0 0 0 1 019.20Physical Scientists 2 2 0 2 0 0 0 0 0 0 019.30Social Scientists & Related Workers 7 5 2 4 2 0 0 0 0 1 019.40Life, Physical, & Social Science Technicians 3 2 1 2 1 0 0 0 0 0 019.90Other Life, Physical, & Social Science Occupations 4 4 0 4 0 0 0 0 0 0 0
21Community & Social Services Occupations 76 32 44 22 29 7 5 2 7 1 321.10Counselors, Social Workers, Other Cmmty./Soc. Svcs. Workers 54 22 32 14 20 6 5 1 5 1 221.20Religious Workers 1 1 0 1 0 0 0 0 0 0 021.90Other Community & Social Services Occupations 21 9 12 7 9 1 0 1 2 0 1
23Legal Occupations 35 9 26 5 22 0 1 2 1 2 223.10Lawyers, Judges, & Related Workers 8 5 3 3 3 0 0 1 0 1 023.20Legal Support Workers 22 3 19 1 16 0 1 1 1 1 123.90Other Legal Occupations 5 1 4 1 3 0 0 0 0 0 1
40Connecticut Department of Labor - Office of Research ~ Labor Market Information

Willimantic-Danielson Labor Market AreaCharacteristics of Job Seekers registered w CT Work Career Center
SOC CodeOccupation
Total Applicants
Total Male
Total Female
White Male
White Female
Black Male
Black Female
Hispanic Male
Hispanic Female
Other Male
Other Female
25Education, Training, & Library Occupations 72 17 55 14 42 2 0 0 10 1 325.10Postsecondary Teachers 12 7 5 6 3 1 0 0 1 0 125.20Primary, Secondary & Special Education Teachers 16 5 11 4 11 0 0 0 0 1 025.30Other Teachers & Instructors 6 1 5 1 4 0 0 0 1 0 025.90Other Education, Training, & Library Occupations 38 4 34 3 24 1 0 0 8 0 2
27Arts, Design, Entertainment, Sports, & Media Occupations 50 29 21 21 18 3 0 2 0 3 327.10Art & Design Workers 30 15 15 14 12 0 0 0 0 1 327.20Entertainers & Performers, Sports & Related Workers 6 3 3 2 3 0 0 0 0 1 027.30Media & Communication Workers 7 5 2 3 2 1 0 0 0 1 027.40Media & Communication Equipment Workers 3 2 1 0 1 0 0 2 0 0 027.90Other Arts, Design, Entertainment, Sports, & Media Workers 4 4 0 2 0 2 0 0 0 0 0
29Healthcare Practitioners & Technical Occupations 79 19 60 14 50 0 6 1 0 4 429.10Health Diagnosing & Treating Practitioners 31 5 26 3 22 0 2 0 0 2 229.20Health Technologists & Technicians 40 11 29 8 24 0 3 1 0 2 229.90Other Healthcare Practitioners & Technical Occupations 8 3 5 3 4 0 1 0 0 0 0
31Healthcare Support Occupations 238 23 215 15 157 2 15 4 30 2 1331.10Nursing, Psychiatric, & Home Health Aides 152 13 139 7 99 1 11 3 20 2 931.20Occupational & Physical Therapist Assistants & Aides 1 0 1 0 0 0 1 0 0 0 031.90Other Healthcare Support Occupations 85 10 75 8 58 1 3 1 10 0 4
33Protective Service Occupations 53 41 12 30 10 5 2 5 0 1 033.30Law Enforcement Workers 9 8 1 8 1 0 0 0 0 0 033.90Other Protective Service Workers 44 33 11 22 9 5 2 5 0 1 0
35Food Preparation & Serving Related Occupations 338 163 175 112 136 15 9 25 19 11 1135.10Supervisors of Food Preparation & Serving Workers 34 28 6 20 5 2 0 3 0 3 135.20Cooks & Food Preparation Workers 126 73 53 50 34 8 4 11 14 4 135.30Food & Beverage Serving Workers 143 45 98 30 87 3 3 10 2 2 635.90Other Food Preparation & Serving Related Workers 35 17 18 12 10 2 2 1 3 2 3
37Building & Grounds Cleaning & Maintenance Occupations 253 189 64 143 37 0 1 32 23 14 337.10Supervisors of Bldg./Grounds Cleaning & Maintenance Workers 5 4 1 2 0 0 0 2 1 0 037.20Building Cleaning & Pest Control Workers 88 41 47 25 26 0 0 13 19 3 237.30Grounds Maintenance Workers 137 126 11 106 10 0 0 11 0 9 137.90Other Building/Grounds Cleaning & Maintenance Occupations 23 18 5 10 1 0 1 6 3 2 0
41Connecticut Data for Affirmative Action Plans ~ 1st Quarter 2010

Willimantic-Danielson Labor Market AreaCharacteristics of Job Seekers registered w CT Work Career Center
SOC CodeOccupation
Total Applicants
Total Male
Total Female
White Male
White Female
Black Male
Black Female
Hispanic Male
Hispanic Female
Other Male
Other Female
39Personal Care & Service Occupations 80 22 58 15 39 4 2 1 9 2 839.10Supervisors of Personal Care & Service Workers 2 1 1 1 1 0 0 0 0 0 039.30Entertainment Attendants & Related Workers 13 9 4 7 4 0 0 1 0 1 039.40Funeral Service Workers 3 0 3 0 2 0 0 0 0 0 139.50Personal Appearance Workers 12 0 12 0 7 0 1 0 1 0 339.90Other Personal Care & Service Workers 50 12 38 7 25 4 1 0 8 1 4
41Sales & Related Occupations 555 251 304 207 227 4 10 25 51 15 1641.10Supervisors of Sales Workers 58 36 22 34 21 0 0 1 1 1 041.20Retail Sales Workers 344 121 223 92 160 3 9 18 42 8 1241.30Sales Representatives, Services 99 61 38 55 32 1 0 1 4 4 241.40Sales Representatives, Wholesale & Manufacturing 13 11 2 9 2 0 0 0 0 2 041.90Other Sales & Related Workers 41 22 19 17 12 0 1 5 4 0 2
43Office & Administrative Support Occupations 781 198 583 147 490 7 10 22 44 22 3943.10Supervisors of Office & Administrative Support Workers 6 2 4 1 4 0 0 0 0 1 043.20Communications Equipment Operators 2 1 1 0 1 0 0 0 0 1 043.30Financial Clerks 79 6 73 5 63 0 3 0 4 1 343.40Information & Record Clerks 270 78 192 56 155 4 2 8 20 10 1543.50Material Recording, Scheduling, Dispatch/Distribution Workers 82 56 26 41 19 1 0 11 3 3 443.60Secretaries & Administrative Assistants 161 6 155 5 141 0 2 1 6 0 643.90Other Office & Administrative Support Workers 181 49 132 39 107 2 3 2 11 6 11
45Farming, Fishing, & Forestry Occupations 55 38 17 20 14 1 0 7 0 10 345.20Agricultural Workers 38 26 12 15 12 0 0 7 0 4 045.30Fishing & Hunting Workers 1 1 0 0 0 1 0 0 0 0 045.40Forest, Conservation, & Logging Workers 3 2 1 2 1 0 0 0 0 0 045.90Other Farming, Fishing, & Forestry Workers 13 9 4 3 1 0 0 0 0 6 3
47Construction & Extraction Occupations 983 960 23 820 21 17 0 40 1 83 147.20Construction Trades Workers 712 698 14 590 14 14 0 33 0 61 047.30Helpers, Construction Trades 204 198 6 181 5 2 0 3 0 12 147.40Other Construction & Related Workers 13 12 1 11 0 0 0 1 1 0 047.50Extraction Workers 13 13 0 8 0 0 0 0 0 5 047.90Other Construction & Extraction Occupations 41 39 2 30 2 1 0 3 0 5 0
49Installation, Maintenance, & Repair Occupations 250 242 8 207 4 4 2 13 1 18 149.10Supervisors of Installation, Maintenance, & Repair Workers 2 2 0 2 0 0 0 0 0 0 049.20Electrical & Electronic Equipment Mechanics, Installers 22 18 4 15 2 1 1 1 0 1 149.30Vehicle & Mobile Equipment Mechanics, Installers, Repairers 78 78 0 68 0 1 0 5 0 4 049.90Other Installation, Maintenance & Repair Occupations 148 144 4 122 2 2 1 7 1 13 0
42Connecticut Department of Labor - Office of Research ~ Labor Market Information

Willimantic-Danielson Labor Market AreaCharacteristics of Job Seekers registered w CT Work Career Center
SOC CodeOccupation
Total Applicants
Total Male
Total Female
White Male
White Female
Black Male
Black Female
Hispanic Male
Hispanic Female
Other Male
Other Female
51Production Occupations 733 496 237 384 183 21 4 45 30 46 2051.10Supervisors of Production Workers 1 1 0 1 0 0 0 0 0 0 051.20Assemblers & Fabricators 11 7 4 6 2 0 0 1 2 0 051.30Food Processing Workers 20 8 12 4 10 1 0 0 1 3 151.40Metal Workers & Plastic Workers 206 172 34 138 28 5 0 11 3 18 351.50Printing Workers 20 17 3 13 2 1 0 1 0 2 151.60Textile, Apparel, & Furnishings Workers 11 3 8 2 2 1 0 0 6 0 051.70Woodworkers 7 7 0 4 0 0 0 2 0 1 051.80Plant & System Operators 5 5 0 4 0 0 0 0 0 1 051.90Other Production Occupations 452 276 176 212 139 13 4 30 18 21 15
53Transportation & Material Moving Occupations 384 316 68 252 48 8 1 40 12 16 753.10Supervisors of Transportation & Material Moving Workers 2 2 0 2 0 0 0 0 0 0 053.20Air Transportation Workers 1 1 0 1 0 0 0 0 0 0 053.30Motor Vehicle Operators 199 174 25 147 19 2 1 15 2 10 353.50Water Transportation Workers 6 4 2 3 2 0 0 1 0 0 053.60Other Transportation Workers 7 4 3 2 2 0 0 1 0 1 153.70Material Moving Workers 136 101 35 72 23 4 0 21 9 4 353.90Other Transportation & Material Moving Occupations 33 30 3 25 2 2 0 2 1 1 0
55Military Specific Occupations 13 12 1 11 1 0 0 0 0 1 055.20First-Line Enlisted Military Supervisors/Managers 1 1 0 1 0 0 0 0 0 0 055.30Military Enlisted Tactical Operations & Air/Weapon 10 9 1 8 1 0 0 0 0 1 055.90Other Military Specific Occupations 2 2 0 2 0 0 0 0 0 0 0
99Unknown/Unclassifiable Occupations 342 218 124 160 94 3 5 11 9 44 1699.90Unknown/Unclassifiable Occupations 342 218 124 160 94 3 5 11 9 44 16
43Connecticut Data for Affirmative Action Plans ~ 1st Quarter 2010