connecticut school integration - ed
TRANSCRIPT
Connecticut School Integration
Moving Forward
as the Northeast Retreats
April 2015
10th in a Series
by Gary Orfield with Jongyeon Ee
Tables of Contents
Tables of Contents ................................................................................................................................................................... 2 List of Figures ............................................................................................................................................................................ 3 List of Tables .............................................................................................................................................................................. 3 Acknowledgements ................................................................................................................................................................ 4 Foreword .................................................................................................................................................................................... 5 Executive Summary ................................................................................................................................................................ 7
Statewide ................................................................................................................................................................................ 7 Connecticut’s Metropolitan Areas ................................................................................................................................ 8
Background and Context .................................................................................................................................................... 10 Racial and Ethnic Change in Connecticut .................................................................................................................... 20 Changes in Segregation ....................................................................................................................................................... 24
Segregation by Poverty .................................................................................................................................................. 29 Multiracial and Minority Segregated Schools in Connecticut ......................................................................... 31 Intergroup Contact in Connecticut’s Public Schools .......................................................................................... 32 Why Segregation Matters .............................................................................................................................................. 37 Educational Outcomes in Segregated and Integrated Connecticut Schools Now................................... 40 Racial Composition in Magnet Schools .................................................................................................................... 41
Metropolitan Trends ............................................................................................................................................................ 44
Overall Trends in Metropolitan Areas...................................................................................................................... 44 Multiracial and Minority Segregated Schools in Connecticut’s Large Districts ...................................... 47 Intergroup Contact in Connecticut’s Large Districts .......................................................................................... 51 Poverty Concentration in Connecticut’s Large Districts ................................................................................... 59 Major Accomplishments of the Sheff Remedies ................................................................................................... 60
Conclusion and Recommendations ................................................................................................................................ 62
State Level ............................................................................................................................................................................ 62 Local Level ........................................................................................................................................................................... 64 Educational Organizations and Universities ......................................................................................................... 65 The Courts ............................................................................................................................................................................ 66 Federal Level ...................................................................................................................................................................... 66
Concluding Thoughts ........................................................................................................................................................... 67 Appendix: Segregation Statistics ..................................................................................................................................... 68
Connecticut School Integration: Moving Forward as the Northeast Retreats, April 2015
Civil Rights Project/Proyecto Derechos Civiles
3
List of Figures Figure 1: Black Students in Minority Segregated Schools in Connecticut, 1987-2013 ______________________________ 25 Figure 2: Latino Students in Minority Segregated Schools in Connecticut, 1987-2013 _____________________________ 26 Figure 3: White Students in School Attended by the Typical Student of Each Race in Connecticut, 1987-2013 ___ 27 Figure 4: Percentage of Racial Group in Multiracial Schools by Race in Connecticut, 1987-2013 _________________ 28 Figure 5: Racial Composition of School Attended by Typical Student of Each Race in Connecticut, 2012-2013 __ 29 Figure 6: Exposure to Low-Income Students for Typical Racial Typical Student in Connecticut, 1997-2013 _____ 30 Figure 7: Schools Classified by Percent of Nonwhite Students, 1987-2013 __________________________________________ 31 Figure 8: White and Asian Students in School Attended by the Typical Student of Each Race in Connecticut, 1997-2013 ____________________________________________________________________________________________________________________ 35 Figure 9: Black, Latino, and American Indian Students in School Attended by the Typical Student of Each Race in Connecticut, 1997-2013 ________________________________________________________________________________________________ 36 Figure 10: Metropolitan Statistical Areas in Connecticut ____________________________________________________________ 44
List of Tables Table 1: Public School Enrollment by Race, 1987-2013 ______________________________________________________________ 22 Table 2: Schools Classified by Percent of Nonwhite Students in Connecticut, 1987-2013 __________________________ 31 Table 3: Black and Latino Students in Minority Segregated Schools in Connecticut, 1987-2013 __________________ 32 Table 4: White Students in School Attended by the Typical Student of Each Race in Connecticut, the Northeast, and the U.S. _____________________________________________________________________________________________________________ 32 Table 5: Black Students in School Attended by the Typical Student of Each Race in Connecticut, the Northeast, and the U.S. _____________________________________________________________________________________________________________ 33 Table 6: Asian Students in School Attended by the Typical Student of Each Race in Connecticut, the Northeast, and the U.S. _____________________________________________________________________________________________________________ 34 Table 7: Latino Students in School Attended by the Typical Student of Each Race in Connecticut, the Northeast, and the U.S. _____________________________________________________________________________________________________________ 34 Table 8: Exposure to Low-Income Students by Race, 1997-2013 ____________________________________________________ 36 Table 9: Evenness Measure of Racial Groups across All Public Schools and Within/Between School Districts ____ 37 Table 10: Pairwise Correlation between Graduation Rates and the Share of Each Racial Group __________________ 41 Table 11: Pairwise Correlation between Academic Performance and the Share of Each Racial Group ____________ 41 Table 12: Magnet and Non-Magnet Schools in Connecticut, 2007-2013 ____________________________________________ 42 Table 13: Exposure to Each Racial Group and Low-Income Students in Magnet Schools and non-Magnet Schools, 2012-2013 ______________________________________________________________________________________________________________ 43 Table 14: Public School Enrollment by Race in Metropolitan and Surburban Areas, 2007-2013 __________________ 45 Table 15: Public School Enrollment by Race in Major Districts in Connecticut, 2012-2013 ________________________ 46 Table 16: Multiracial and Minority Segregated Schools in 2012-2013 ______________________________________________ 48 Table 17: Low-Income Students in Multiracial and Minority Segregated Schools in Connecticut’s Metropolitan Areas ____________________________________________________________________________________________________________________ 50 Table 18: Black and Latino Students in Minority Segregated Schools in Major Districts, 2012-2013 _____________ 51 Table 19: White Students Attended by the Typical Student of Each Race in Major Districts, 2012-2013 __________ 53 Table 20: Black Students Attended by the Typical Student of Each Race in Major Districts, 2012-2013 __________ 54 Table 21: Latino Students Attended by the Typical Student of Each Race in Major Districts, 2012-2013 _________ 55 Table 22: Asian Students Attended by the Typical Student of Each Race in Major Districts, 2012-2013 __________ 56 Table 23: White/Asian Students Attended by the Typical Student of Each Race in Major Districts, 2012-2013 __ 58 Table 24: Black/Latino/AI Students Attended by the Typical Student of Each Race in Major Districts, 2012-2013 __________________________________________________________________________________________________________________________ 59 Table 25: Low-Income Students Students Attended by the Typical Student of Each Race in Major Districts, 2012-2013 ____________________________________________________________________________________________________________________ 61

Connecticut School Integration: Moving Forward as the Northeast Retreats, April 2015
Civil Rights Project/Proyecto Derechos Civiles
4
Acknowledgements
We would like to thank all the reviewers for sharing their expertise and providing helpful
guidance, invaluable feedback, and continued support throughout our work on this report. In
addition, we want to express our appreciation to staff of the Civil Rights Project/ Proyecto
Derechos Civiles for their support and assistance.
This report is the tenth in a series of 12 reports from the Civil Rights Project analyzing school
segregation in the Northeast and Mid-Atlantic states.

Connecticut School Integration: Moving Forward as the Northeast Retreats, April 2015
Civil Rights Project/Proyecto Derechos Civiles
5
Foreword
The Civil Rights Project has been documenting changes in the segregation of American
schools throughout its 18 year history. The basic story has been one of increasing segregation of
Blacks and Latinos by race and poverty and a strong relationship between the segregation and
educational inequality. Since the early l990s the U.S. Supreme Court has been retreating on
desegregation, court orders have been dissolved, and segregation has been steadily increasing
after several decades of increasing desegregation for African American students, beginning with
the civil rights changes of the l960s. Several years ago we decided to add to our national and
regional reports and our special focus on California the first detailed examination of this issue in
the states of the Eastern seaboard for many years. This report is the tenth in the series. It is the
first to report any significant recent action to foster diverse schools. The unique story initiated by
Connecticut’s Supreme Court is of great regional and national importance, not as a grand
solution to a very deeply embedded problem but as an important example of what can be done
through the wise use of choice programs with clear civil rights objectives and major educational
innovations. This report does not, by any means, conclude that the task is complete in
Connecticut but does find that it is well begun and that there are logical next steps that could
deepen the gains.
America is a metropolitan society where four out of every five residents live in metro
areas and much of life and economic activity is organized on a metropolitan basis, but the great
majority of our metros are divided into separate and unequal school districts sorted out by race
and income of the residents. The worst educational opportunities are offered to the poor
nonwhite residents of the most disadvantaged school districts and the best to the most affluent
white areas. The Supreme Court was confronted with this dilemma forty years ago in Milliken v.
Bradley, and decided that the rights to desegregated education ended at district boundaries. Since
many central cities even then had overwhelmingly poor nonwhite school districts, this often
meant that nothing could be done or that a court would have to implement a remedy bound to
fail. In his dissent Justice Thurgood Marshall predicted that this would bake segregation deeply
into the society and that it would eliminate the promise of Brown v. Board of Education for
millions of students. Statistics for the last 40 years show that he was right. Since that fateful
decision the only successful effort to produce a new legal framework to deal with the reality of
metropolitan segregation took place in Connecticut.
After the Supreme Court’s 5-4 decision made it virtually useless1 to fight for
metropolitan desegregation in the federal courts, lawyers began to look at state courts as a
possible avenue in spite of the fact that state courts had rarely produced civil rights
breakthroughs. The problems of metro fragmentation were particularly acute in Connecticut.
Connecticut is basically a suburban state without a very large city but its metros tend to have a
very old city at their core and a very fragmented suburban ring. The differences are extraordinary
between some of the country’s poorest central cities and richest suburban rings. And the
relatively small size of the metros means that the entire metro areas are smaller than some of the
country’s leading individual districts, so scale was not a major barrier. It was not hard to imagine
workable solutions if the courts could take the initiative. There was evidence from the few states
1 Except in extremely limited circumstances where it was possible to prove intentional suburban or state action
causing the segregation.

Connecticut School Integration: Moving Forward as the Northeast Retreats, April 2015
Civil Rights Project/Proyecto Derechos Civiles
6
were city and suburban schools all operated together in a single district, that it could work to
create a high degree of lasting integration and to gain community acceptance. And Connecticut
had a progressive tradition of civil rights law. So it became the target in a large struggle to attack
segregation by race and poverty.
The Sheff case was a long struggle by a group of outstanding civil rights lawyers,
plaintiffs and local residents who supported the change and those who worked with them. (I was
a witness in the initial trial and learned a great deal about Hartford and the state’s schools and
school policy and about the communities with the metro at the time). After a long wait, the
Connecticut Supreme Court reviewed the massive record in the case and made some very
important findings. The Court held that the state had an obligation to pursue integrated schools
and that those rights extended beyond municipal boundaries. In fact, the state court found that a
system of district boundaries that segregated students and made integration almost impossible
were themselves in violation of the state constitution. But, it charged the legislature with coming
up with a solution. What followed were modest initial steps and years of back and forth efforts to
develop solutions that worked through choice process and to gain the resources to implement.
The efforts have not eliminated segregation or ended racial achievement gaps but it is the only
state in the Northeast that is going in a positive direction and it has created voluntary processes
that have clearly reduced severe segregation in a time devoid of national leadership. This is a
solid accomplishment that the state should be proud of and other states should look at as an
example.
But there is still much to do in completing this work, in dealing with major racial change
outside the central cities, in making sure that all the choice systems in the state facilitate rather
than undermine the process, especially a highly segregated and rapidly growing charter system,
and in addressing the large issues of social and economic inequality and housing segregation
outside the schools. I believe that this long and often frustrating process has produced creative
and positive models of integrated schools with exceptional programs, a win-win solution that has
added important educational options and crossed barriers of race and class in a mutually
beneficial way. Now it is time to build on success and complete the job.
Looking at the grim picture of central city Hartford and Bridgeport when this process
began and considering the odds against the creation of new models in a time when civil rights
were shrinking, what has been accomplished is a victory over great odds. It is also an example of
the way there can be change that expands the possibilities for all and enriches the communities.
This report, unlike the others we have recently published is one of significant but still partial
accomplishment. There is something strong and important to be built upon and worthy of
consideration by other states.

Connecticut School Integration: Moving Forward as the Northeast Retreats, April 2015
Civil Rights Project/Proyecto Derechos Civiles
7
Executive Summary
This report analyzes the data on changes in patterns of racial segregation and their
education consequences over a quarter century, from l987 to 2012. It examines a major transition
in the racial and ethnic composition of Connecticut and the changes in integration and
segregation in the schools of the state and its urban communities and it examines the relationship
between the racial composition of the schools and the educational consequences. It shows that, in
contrast to its neighbors, Massachusetts and New York, Connecticut has made significant
progress in reducing segregation as a result of the implementation of the Connecticut Supreme
Court’s decisions in the Sheff case and the programs that have been devised and implemented by
the state’s educators. Basic findings include:
Statewide
The white share of the total public school enrollment dropped in the state from 76.8% to
59.9% between 1987 and 2012 while the Latino and Asian share increased substantially
as was happening across the U.S. The proportion of Latino students more than doubled,
rising from 8.8 to 20.1% over the last twenty-five years. The basic story is that fewer
white children were born and the population change reflected the large immigrations to
the U.S. from Latin America and Asia. The change did not reflect a surge of black
enrollment.
The overall share of African American and Latino students who attended intensely
segregated schools (90-100% minority schools) and apartheid schools (99-100% minority
schools) decreased. There was a significant drop in extreme segregation.
The share of students living in poverty nearly doubled over the last fifteen years from
19.5% to 36.2%, also reflecting national trends. In 2012, the typical African American
student attended a school with 63.1% poor students, but the typical white student had
22.3% classmates from low-income families. Segregation was double segregation for
students of color.
Educational outcomes were clearly related to segregation. The overall graduation rate
was positively correlated with the proportion of white and Asian students but was
negatively linked with the black and Latino share in a school. Academic performance
showed the same pattern. This was related to many historic and contemporary
inequalities associated with race and ethnicity in U.S. society. The report summarizes a
half century of research on the benefits of integration.
Connecticut’s magnet schools showed great potential of promoting racially integrated
schools. In 2012-2013, magnet schools in Connecticut enrolled a more balanced number
of students from each racial group (e.g., 30.2% whites, 31.4% blacks, 30.5% Latinos, and
4.4% Asians) as compared to non-magnet schools, which enrolled 61.7% whites, 11.6%
blacks, 19.5% Latinos, and 4.8% Asians. Additionally, the typical student of each racial
group in Connecticut’s magnet schools attended a similar percentage of low-income
students, ranging from 49% to 59%; however, there were noticeable racial disparities in
contact with poor students in non-magnet schools from 21% to 62%.

Connecticut School Integration: Moving Forward as the Northeast Retreats, April 2015
Civil Rights Project/Proyecto Derechos Civiles
8
Connecticut charter schools are far more segregated than traditional public or magnet
schools.
Connecticut’s Metropolitan Areas
Metropolitan areas included 49.2% of the total enrollment of the state’s public schools
and their white share of public school enrollment was falling, while the proportion of
Latino students increased.
There were substantial differences in racial composition across major districts in CT.
Connecticut’s large school districts had many multiracial schools, which enrolled at least
three different racial groups (over 10% for each group). For example, all schools in the
Stamford, Norwalk, Stratford, Manchester, and West Haven school districts were
multiracial schools in 2012-2013.
All schools in the Bridgeport, Stamford, Hartford, New Britain, East Hartford, and
Meriden school districts had more than half minority students. Over half of schools in the
Bridgeport, Hartford, and New Haven school districts were intensely segregated (90-
100% minority), and nearly one-eighth schools in the Hartford school district were
apartheid schools (99-100% minority schools).
A large proportion of African American and Latino students were still segregated in some
districts. In the Hartford school district, 73.6% of Latinos and 65.4% of blacks were
enrolled in intensely segregated schools in 2012-2013. The Bridgeport school district,
too, had 64.7% of Latinos and 61.0% of blacks in 90-100% minority schools. In Hartford
8% of Latino students and 17% of black students attended apartheid schools (99-100%
minority schools).
Virtually all students in minority segregated schools in the Bridgeport, Hartford, and
Enfield school districts were poor in 2012-2013.
The levels of exposure to white and Asian students varied substantially across the large
school districts examined. For example, the typical white student in the Westport school
district attended a school with 92.8% white and Asian students, while the typical Latino
student in the Bridgeport school district had 10.8% white and Asian classmates. In
contrast, the typical white student in the Westport school district had merely 5.6% black,
Latino, and American Indian (AI) classmates, whereas the typical Latino student in the
Bridgeport school district attended a school with nearly 90% blacks, Latinos, and AIs.
Differences in intergroup contact between white/Asian students and black/Latino/AI
students stemmed mainly from between-district segregation, not from within-district
segregation. The different levels of exposure to each group were related to the overall
share of racial groups in individual districts, which differed widely from district to
district.
In its conclusions the report finds that Connecticut has made real progress since the Sheff
decision and developed effectively methods to foster significant integration across school
district lines in marked contrast to its major neighboring states. The report concludes with

Connecticut School Integration: Moving Forward as the Northeast Retreats, April 2015
Civil Rights Project/Proyecto Derechos Civiles
9
recommendations on how to build upon and extend these efforts and other methods to
take the next steps in attacking the serious remaining problems.

Connecticut School Integration: Moving Forward as the Northeast Retreats, April 2015
Civil Rights Project/Proyecto Derechos Civiles
10
Background and Context
Connecticut is a rich, overwhelmingly white, largely suburban, state. The state, with the
second highest average household income in the nation and one of the very highest education
levels, is characterized by extreme inequality; it contains some of the nation’s most depressed
and troubled central cities near some of the most prosperous and highly educated suburbs. It is a
state where all of the growth in enrollment is nonwhite, as it is in the U.S. totals. Like New
England as a whole, it has been experiencing dramatic growth in its proportion of Latino and
Asian students for decades and a significant decline in the share of whites. The African
American community is long-standing and very important in some sectors of the state. The
patterns of racial change are most clear in the central cities and in a growing list of diverse and
racially changing suburbs. Connecticut, like the rest of New England is whiter than the U.S.
average but changing significantly. Some suburban sectors, like those across the U.S., are now
experiencing substantial changes in as they become more diverse or less affluent, or both,
deepening inequality among suburbs as well as the long-standing polarization between suburbs
and the cities.
Segregation was not a very visible problem in most of Connecticut for many years.
Although the state was warned about the potential problems by a 1965 Harvard study, Schools
for Hartford2, and the state itself adopted some policy objectives, nothing much was done in the
increasingly impoverished and deteriorated central cities until there was a major court battle.
There was no Federal legal mandate for school desegregation outside the South until
1973 and when it came it was complex and expensive to get a remedy and the Supreme Court
quickly limited desegregation plans by drawing a harsh legal boundary between city and
suburban school districts making it nearly impossible to desegregate central cities that were
already largely nonwhite and poor and changing rapidly. The l973 Keyes v. Denver School
District No. 13, decision held that if civil rights lawyers could prove intentional segregation in a
significant part of a city they could win a city wide desegregation order, but it came too late for
many Northern cities where there were few white middle class students left in the big cities by
then. The 1974 Milliken v. Bradley4 decision on metropolitan Detroit held that the suburbs could
not be included in a plan unless there was proof that each suburb had intentionally discriminated.
Since many suburbs were still almost all-white and the Court ignored the history of housing
discrimination, both public and private, that kept them that way, the net result was to tell urban
black and Latino communities that they had a right to a remedy for a history of desegregation but
to forbid the only workable remedy, a remedy which worked well in Southern areas were the city
and the suburban ring were in one county-wide school system.
The CT state government did have a modest desegregation policy under the Racial
Imbalance Act but it was not enforced in the state’s big cities. Unusual among state educational
leaders Commissioner Gerald Tirozzi, spoke out strongly on the need for state action, and the
2 Harvard Univ. Graduate School of Education, Center for Field Studies, Schools for Hartford, 1965, 3 Keyes v. Denver School District No. 1,413 U.S. 189 (1973). 4Milliken v. Bradley, 418 U.S 717 (1974).

Connecticut School Integration: Moving Forward as the Northeast Retreats, April 2015
Civil Rights Project/Proyecto Derechos Civiles
11
state department generated an important report but it did not lead to substantial changes.5 The
federal government investigated segregation in the small Waterbury district and the state
legislature debated a policy for Connecticut in 1969 a year after the assassination of Martin
Luther King and the wave of urban upheavals that followed it. There were proposals for regional
magnets and “educational parks” bringing together the students from several neighborhoods but
they went nowhere. Eventually a modest Racial Imbalance Act was passed, far less demanding
than the law of the same name enacted in Massachusetts. The state delayed eleven years until
l980 to issue any regulations implementing it. The eventual regulation were limited to individual
districts and set a very broad requirement that the minority-white ratio in a school not be more
than 25% above or below the regional total.6 In a district with 80% black students or white
students that meant nothing since 0% of the other race would be within the ratio, as would a 99%
black school. It only mattered to smaller districts that had some real racial diversity. Connecticut
elected officials never confronted the basic issue in the state, which was - segregation among
districts in metro areas, not within the overwhelmingly nonwhite and poor central city systems.
The serious segregation within Connecticut is among districts within metropolitan areas not
inside individual districts, which often are overwhelmingly white or nonwhite.
The Hartford area had one of the nation’s pioneering voluntary metropolitan
desegregation plans, Project Concern, a small voluntary plan begun in the Hartford area in 1966
and involving a few hundred students from the city attending suburban schools. It continued into
the mid-1990s and was later revived as part of the remedy in Sheff. It had only a very modest
impact on the region’s severe segregation but it was the site of important early sophisticated
research documenting significant positive impacts from access to suburban schools. The studies
showed major benefits for the students receiving the opportunities compared to a random sample
of similar students who did not.
Integration in Connecticut was particularly hurt by the U.S. Supreme Court’s l974
Milliken v. Bradley decision which limited the desegregation in Detroit to the city itself, even
though there was ample evidence of discrimination in Detroit, which had a small and rapidly
declining white minority of students, and ignored the rest of the metro which had one of the
nation’s most hyper-segregated housing markets.7 After this decision older central cities with
majorities of poor minority students and a rapidly declining white minority could not achieve
beneficial and lasting desegregation plan through federal litigation. Although it would have been
very viable to include the entire metro region in a plan in middle sized metros like those in
Connecticut (as was done in a number of similarly sized Southern metros with county school
systems) it was impossible to accomplish through a federal court after the Milliken decision. In
fact, a pending lawsuit for regional desegregation in Connecticut, Lumpkin v. Meskill, was
dropped after the Milliken decision.
Faced with this roadblock in federal court, some of the nation’s leading civil rights
organizations decided to pursue a solution under state law and chose Connecticut as a location to
5 Connecticut. State Dept. of Education. Committee on Racial Equity. A Report on racial/ethnic equity and
desegregation in Connecticut's public schools.1988. 6 Christine Dempsey, “What to Do with Racial Imbalance,” Hartford Courant, Jan. 8, 1969. 7 Joyce A. Baukgh, The Detroit School Busing Case: Milliken v. Bradley and the Controversy over Desegregation,
Lawrence: Univ. of Kansas Press, 2011: Paul R. Dimond, Beyond Busing: Inside the Challenge to Urban
Segregation, Ann Arbor: Univ. of Michigan Press, l985.

Connecticut School Integration: Moving Forward as the Northeast Retreats, April 2015
Civil Rights Project/Proyecto Derechos Civiles
12
work with parents and community groups opposing segregation and inequality in the case that
became Sheff v. O’Neill, first filed in l989.8 (Though a state constitution cannot override federal
law state constitutions can provide rights that go beyond those provided by federal law.) The fact
that there were feasible remedies in a relatively progressive state with relatively small metro
areas encouraged the effort. The massive case attacked the intense segregation and inequality
both by race and by poverty in the state, claiming that these forms of double segregation were a
fundamental denial of the educational and civil rights provisions of the state constitution and that
the state had failed to equalize resources or provide a minimally adequate education to all.
After a lengthy trial and an appeal to the state supreme court the lawyers representing the
segregated Latino and African American students in Hartford won a significant victory in the
State Supreme Court in l996 which established a sweeping principle. The Court held that “racial
and ethnic segregation has a pervasive and invidious impact on schools” and that it was a
violation of rights created in the Connecticut constitution. The court’s majority held that the
separation of students caused by school district boundary lines was a violation of rights in the
state constitution.
But, rather than prescribing a remedy the Court ordered the governor and the legislature
to come up with a solution. This was similar to the strategy of the Supreme Court for the first
decade following the Brown decision, a decade in which the principle of desegregation was
established but little desegregation was achieved. The political leaders of Connecticut did not
propose to merge and desegregate the school districts or offer any other major remedy. In fact,
the first substantial response of the Connecticut legislature was an increase of funding for
preschool education, a good thing in itself but hardly related to desegregation. Eventually a
modest desegregation plan was developed and applied to the state’s largest metropolitan areas
and it grew over time. It was very small until the state agreed to a settlement in 2003 which
created some goals and timetables and workable mechanisms to operate the plans, a process that
led to continuous expansion. It relied on voluntary inter-district transfers and on the creation of
regional magnet schools drawing students across district lines to enroll in special educational
programs. Many students remained segregated but, with time, the plans did have a significant
impact. Experience under the plans demonstrated that it was possible to create regional schools
so great many residents of all races would be eager to cross district lines to enroll in them. In
fact, the demand surpassed the willingness of the state to pay for them so a moratorium was
placed on this successful effort except in the Hartford area. The voluntary demand for these
good, integrated educational choices is a very important fact. There continue to be discussions
between the Sheff plaintiffs and the state about further expansions.
The Educational Policy Discussion. Connecticut has a strong overall level of educational
achievement but the state has the largest gap in achievement by race in the U.S. Connecticut, like
the rest of Southern New England, faces s future being formed by immigrants and the children of
immigrants. These are immigrants who do not come from Ireland or Italy as they did a century
ago, but from Latin America and Asia. This demographic change is being superimposed on a
polarized economy and society, historically overwhelmingly white but with an old and very
unequal black community. It is a state where the sophisticated industrial jobs in the first part of
8 For a powerful introduction to the realities of schooling in Hartford and the struggle in the Sheff case see: Susan
Eaton, The Children in Room E-4, Chapel Hill: Algonquin Books, 2006.

Connecticut School Integration: Moving Forward as the Northeast Retreats, April 2015
Civil Rights Project/Proyecto Derechos Civiles
13
the country in heavy industry have been replaced by jobs requiring advanced education as well
as many dead-end entry level and part-time jobs for those with little education. It is a state with
very dramatic differences between once-rich but now deeply decayed central cities, some
flourishing affluent suburbs, and others facing change and an uncertain future. During its many
years with a small African American minority, Connecticut let its small racial problems grow
and become institutionalized. They were not solved. Now there is a more complex multiracial
puzzle to resolve.
Connecticut is a state of huge racial differences in academic success but whose leaders
tend to ignore race in their analysis of the problems. The Connecticut Commission on
Educational Achievement, a group of business and foundation leaders, concluded in its 2010
report that the state had the nation’s largest achievement gap between low income and higher
income students. Although the state as a whole was a national leader on educational
achievement, poor children performed even worse than poor children in much of the rest of the
country, though the vast majority of other states were poorer and spent far less on their schools.
There was also a huge gap in high school graduation rates between poor and non-poor children.
The gap was not the product of a handful of low achieving districts but existed across the state.
Connecticut has had challenging standards and substantial funding but gaps among groups in
reaching the state’s standards were gigantic. Although poverty is strongly related to race and
children of color are very much more likely to be concentrated in high poverty low-performing
schools, this important report totally ignored the issues of race and school segregation. It set a
goal of totally eliminating the achievement gap in ten years, much like the failed goals of the
Clinton-Bush Goals 2000 policy in the l990s and the No Child Left Behind goals set in 2001, but
there was no analysis of why those goals had failed decisively in the past. The solutions the
report suggested were very similar to the means adopted in state reforms and in the NCLB and
the Obama Administration’s Race to the Top reforms that failed to produce significant progress
toward this objective.9
Extreme differences in communities by race, class, and segregation, obvious to anyone
who attentively drove across any metro area in the state or examined its statistics, were simply
ignored in most of these reports. If education is posed as the answer to inequality, how is a gap to
be closed when the children whose families and neighborhoods have the fewest resources, who
are largely black and Latino, attend the schools with the least prepared classmates, the least
experienced faculty and administrators, and the least prepared fellow students. The prevailing
theory of the last thirty years is that it can be done by enacting higher standards in the states and
in Washington and threatening schools with sets of sanctions, threats, and more competition
from charter schools. Unfortunately these remedies leave the students most in need of strong
schools in weak schools with the least experienced teachers and the worst educated peer group
and the most privileged students in communities with successful schools with the strongest
schools and the most academically prepared classmates and teachers, the same communities
which often have many strong out-of-school educational experiences which supplement
educational opportunities.
9 Connecticut Commission on Educational Achievement, Every Child Should have a Chance to be Exceptional,
Without Exception, CCeA, 2010.

Connecticut School Integration: Moving Forward as the Northeast Retreats, April 2015
Civil Rights Project/Proyecto Derechos Civiles
14
The Connecticut Council on Educational Reform was created in 2011, with strong
backing of corporate leaders. They took hard looks at the strengths and weaknesses of
Connecticut’s school systems and strongly advocated various accountability reforms, preschool
education, teacher accountability and other issues. In its 2012 report, the Council notes that its
mission was to “represent the business and civic voice in facilitating the implementation of
comprehensive reforms to significantly narrow Connecticut’s achievement gap while raising
academic outcomes for all students.”10 The Council’s website asks “Why Connecticut has the
largest achievement gap in the U.S?” noting that “In Connecticut we have some of the wealthiest
towns in the country as well as some of the poorest. This disparity in income contributes to the
achievement gap. But it is not all a result of income differences.” The report observes that the
2011 National Assessment of Educational Progress11 shows that in spite of Connecticut’s
position as a national leader in overall student achievement “when compared to low-income
students from other states, Connecticut’s low-income students score in the bottom third on some
key assessments.”12 The report, however, says nothing at all about race and its relationship to
poverty and unequal segregated schools. The document ignores the successful efforts in
Connecticut to alleviate the very low scores in poor schools segregated by race and poverty
through voluntary transfers and regional magnet schools. This has been a large blind spot in the
corporate and foundation funded reform movements across the U.S. Although these reports
strongly urge using all possible means to correct what they acknowledge to be deeply damaging
gaps, they ignore the underlying sources of unequal opportunity as well as the successes
achieved in schools integrated by race and class. In its January 2015 agenda for the legislature,
the Connecticut Council on Educational Reform noted continuing needs and put strong emphasis
of funding, preschool, of accountability and moving toward measurement of teachers and teacher
accountability and state takeovers of failing schools. No mention of Sheff and successes that had
been widely recognized.13 Another education reform group, the Connecticut Coalition for
Achievement Now, pointed out in November 2014 that almost 40,000 students were still locked
into failing schools, about nine-tenths of them African American and Hispanic and nine-tenths
poor. It pointed to the huge demand for the regional magnet schools and a substantial waiting list
for charter schools and called for an expansion of choice programs.14
Looking at the findings of the National Assessment of Educational Progress (NAEP) the
independent national test administered by the Educational Testing Service that compares all the
states, the racial differences are very stark. In the 2011 assessments, Connecticut produced the
highest black-white gap in reading proficiency at the fourth grade level. The Hispanic-white gap
was also the nation’s largest (tied with Massachusetts for this distinction.).15 After the 2009
national comparison of 12th graders, the state’s overall ranking was high but Commissioner Mark
McQuillan noted that inequalities continued throughout the grades and that there were
10 2012 Education Policy and Progress Report, p. 5. 11 The NAEP, the only national comparative assessment of achievement is often known as the The Nation’s Report
Card. 12 http://ctedreform.org/whats-the-achievement-gap/cts-gap/ 13 Nicki Perkins, Connecticut Council on Educational Reform, “Our Legislative and Administrative Priorities,” Jan.
21, 2015 14 Connecticut Coalition for Achievement Now (ConnCAN), “Connecticut Education in Crisis; 40,000 Children
Trapped in Failing Schools,” Nov. 18, 2014. 15 Terrylynn M. Tyrell and Allyson Fierro, “The Nation’s Report Card on 4th Grade Reading 2011,” Voices for
America’s Children, 2012, p. 2.
Connecticut School Integration: Moving Forward as the Northeast Retreats, April 2015
Civil Rights Project/Proyecto Derechos Civiles
15
“unacceptable disparities in achievement among racial and ethnic groups in our state.” The
black-white racial gap in math was very large but relatively close to the national average but the
white-Latino gap was substantially worse than the rest of the U.S. In reading tests, the black-
white gap was very large and significant worse than the national average.16 Yet most of the talk
by many education reformers and elected officials was about another round of new tests and
higher standards.
The omission of serious official attention to race in the education reform discussion is
particularly odd because Connecticut’s Supreme Court sweepingly ruled 18 years ago that this
segregation violates the state constitution and that district boundary lines were largely
responsible for segregation.
The Sheff Decision. Though the Sheff lawsuit was framed against segregation by poverty
as well as race, the Court held that only racial segregation was contrary to the state’s basic law.
When the Sheff case was before the State Supreme Court in 1995 the Justices struggled with the
obvious segregation and inequality of education in the metropolitan Hartford area, the reasons it
existed, and the possibility of addressing the problem under state law.17 In its 1996 decision the
Court ruled that “extreme racial and ethnic isolation … deprives school children of a
substantially equal educational opportunity.” Segregation, the court said, had a “pervasive and
invidious impact on schools.”18 The remedy which grew out of the state Supreme Court’s ruling
in Sheff v. O’Neill that the children of Hartford were unconstitutionally denied equal opportunity
by district lines that kept them out of the region’s stronger schools in a very racially segregated
metropolitan area. The Court found that the state’s districting system produced intense
segregation but it left the remedy up to the governor and the legislature, subject to court
approval. It would be up to the elected officials to come up with some answer and, ultimately, to
the courts to rule whether the remedy was adequate to protect the constitutional rights of
Connecticut students. These issues are still very much in dispute 20 years later. The state has,
however, been implementing significant experiments in voluntary desegregation with some real
successes since the l990s. These successes deserve serious attention.
A number of the initial state government responses to the decision were not actually
about desegregation but were about educational initiatives the state believed to be beneficial such
as more early childhood education. The two desegregation responses involved a small voluntary
transfer to the suburbs program and the creation of a set of regional magnet schools to spur
voluntary integration across district boundaries. Both were modest in comparison to the scale of
the segregation in the state and were broadened somewhat in later agreements between the state
and the plaintiffs. The remedy neither merged the districts nor mandated that students or teachers
transfer across district lines to achieve integration, but relied almost completely on choice
programs which enabled some city students to transfer to suburban schools and created a series
of regional magnet schools in the state’s metropolitan areas which were designed to offer strong
16 Connecticut State Department of Education, “Connecticut’s 12th Graders Score above the Nation in Reading and
Math: Connecticut Seniors Show Solid Overall Performance in First State-Level High School NAEP but
Mathematics and Gaps Still a Concern,” News Release, Nov. l8, 2010. 17 Susan Eaton, The Children in Room E4: American Education on Trial, Chapel Hill: Algonquin Books, 2006, pp.
167-175. 18 Sheff v. O’Neill, 678 A.2d 1267, 238 Conn. 1, 678 A.2d 1267, 111 Ed. Law Rep. 360
Connecticut School Integration: Moving Forward as the Northeast Retreats, April 2015
Civil Rights Project/Proyecto Derechos Civiles
16
and unique educational programs that could attract students of all races to voluntarily enroll
across district lines in integrated magnet schools.
In the Hartford area where a poor central city, once a great center of American culture, is
surrounded by suburbs, most of which offer much stronger schools, the Capitol Region
Education Council working with member districts and receiving funds from the court settlement
has expanded from 3,600 students to 6,300 from 2008 to 2012 in schools that are close, in overall
enrollment, to one-third white, one-third black and one-third Latino. (The Hartford district runs
about half of the magnets and three suburban districts also operate magnets.) The magnet schools
have created a strong demand, with far more students desiring to enroll that can be
accommodated so far.
The CT Mirror reported in November 2013 that “Nearly Half the Students from Hartford
Now Attend Integrated Schools,”19 The report showed that 8,374 Hartford students (actually
about 43%) were in schools defined as integrated because they had at least 25% whites. Of those
who attended more segregated schools, about 6,000 made applications to leave their current
school but were not offered such a chance because of the shortage of spaces.
The changes had been notable under the remedies. Back in 2007 only 11% of Hartford
students were in schools integrated by that definition compared to 42% in 2013. State officials
praised the progress and opposed the idea of raising the goal while civil rights groups were
demanding additional steps. State and local officials wanted to change the definition of diversity
in the plan. The Hartford Courant reported that in the current school year, 47.5% of Hartford
students were in integrated schools, including some small part-time programs, touching 9,558 of
the city’s 21,458 minority students.20 In addition about 2000 Hartford students were participating
in the Open Choice program in which students in the city (and in Bridgeport and New Haven)
can attend suburban schools willing to receive them with free transportation. This program is not
limited to students of color but since few whites live in the central cities, the choice are basically
for those students and families. Since there are no racial standards in the program, some choices
are for transfers to heavily minority schools, producing little integration impact.
Civil rights lawyers wanted further steps and a more regional approach. Phil Tegeler, one
of the team of lawyers who fought the initial case, said, “There’s a lot more work to be done.” 21
Attorney Martha Stone referred back to the Supreme Court’s initial decision which saw the
separation of school districts in the metro region as “the single most important” cause of
segregation, and argued that “the ultimate answer in Sheff is regionalization,” merging separate
districts to create a large district that could have a comprehensive plan.22
The magnet schools show very highly levels of achievement and virtually no
achievement gap by race between Latino and white students at several subjects and grade levels.
Within each racial group the students from poor families perform very substantially better than
the statewide average for low income students. Those who have been in magnet schools for
19 “Nearly Half the Students from Hartford Now Attend Integrated Schools,” CT Mirror, Nov. 27, 2013. 20 Kathleen Megan, “Almost Half of Hartford Students Now Attend Integrated Schools,” Hartford Courant, Nov.
20, 2014. 21 Tegeler is now working with the Sheff Movement, a parent and community coalition that supports the expansion
and improvement of the Sheff v. O’Neill regional integration system. 22 Ibid.

Connecticut School Integration: Moving Forward as the Northeast Retreats, April 2015
Civil Rights Project/Proyecto Derechos Civiles
17
several years show particularly marked gains.23 The magnet schools set up for integration
purposes in the Hartford, New Haven and Bridgeport metropolitan regions were so popular and
the demand was so intense that it impacted the state budget. In response the legislature imposed a
moratorium on new magnets in 2009 except in the Hartford area, which was protected by the
Sheff decision. About one student in fourteen in the state now attends a magnet and the total
enrollment is nearly 40,000 in the 84 schools.24
The Open Choice plan was the current version of the small inter-district transfer plan,
Project Concern, that had begun in the Hartford region in the l960s. Project Concern, a program
for voluntary transfer of a relatively small minority students to suburban schools was similar to
the METCO program in Boston but it showed a pattern of significant growth and then steady
decline in effort and enrollment in spite of major research efforts that documented clear benefits
from the program. Robert Crain, one of the nation’s leading researchers on desegregation
questions, and his colleagues, took advantage of Project Concern’s unusual process of selecting
students which produced an approximately random distribution between selected and non-
selected applicants that made possible much stronger conclusions about the program than in the
vast bulk of desegregation research in which participation is not randomized. The findings were
compelling—significant educational gains for the transferred students, compared to a similar
group not given transfers, and major gains in high school graduation, among other important
findings. 25 In spite of these findings the project and the state’s support for it declined by more
than half between l980 and the late l990s.
Overall, Connecticut has five significant programs of educational choice. Both the inter-
district magnet schools and the Open Choice transfer program are part of the desegregation
remedies approved the state courts. The other three-charter schools, technical high schools, and
agricultural educational centers operate outside the desegregation context and have no effective
integration rules in spite of the mandate in the Sheff decisions that the state foster desegregated
educational settings.26
By the 2011-12 school year there were more than 49,000 students attending some kind of
choice school in the state, nearly 9% of the state’s total enrollment. 55% of the choice students
were in the interdistrict magnets which had more than doubled in a decade. There were 63
interdistrict magnets enrolling 27,170 students. The Open Choice program was far smaller at just
2,086 students, only 4% of the choice students. Charter schools had also more than doubled in
23 Sarah S. Ellsworth, “CREC Student Achievement Overview 2013,” Capital Region Education Council Office of
Data Analysis, Research and Technology, 2013. [Even students who have equally low incomes may, of course,
differ from other students with similar income on some unmeasured dimension, meaning that some of the difference
in outcomes may well be related to those factors, not simply the impact of the schools chosen]. 24 Jacqueline Rabe Thomas, School Choice: Future of New Magnet Schools Uncertain,” CT Mirror, Jan. 6, 2015. 25 Robert Crain, et. al, “Finding Niches: Desegregated Students Sixteen Years Later—Final Report on the
Educational Outcomes of Project Concern, Hartford, Connecticut,” New York: Inst. for Urban Education, Teachers
College, Columbia Univ., 1992; R. Crain and J. Strauss, “School Desegregation and Black Educational Attainment:
Results from a Long Term Experiment,” Baltimore: Center for the Social Organization of Schools, Johns Hopkins
Univ., 1985. 26 Robert Cotto, Jr. and Kenneth Federa, Choice Watch: Diversity and Access in Connecticut’s School Choice
Programs, New Haven: Connecticut Voices for Children, April 2014. Pp. 2, 10-11.

Connecticut School Integration: Moving Forward as the Northeast Retreats, April 2015
Civil Rights Project/Proyecto Derechos Civiles
18
the decade and accounted for 6,097 students, or an eighth of the choice students. The regional
technical schools were not growing and made up about a fifth of the choice students.27
Given the distinctive policies that controlled these distinctive choice programs, it was
reasonable to expect different results. A 2014 report by Connecticut Voices for Children
concluded that “a majority of the magnet schools and technical schools were ‘integrated’ [by the
standards set in the Sheff agreement] but only 18% of charter schools.” In fact, “the majority of
charter schools were instead ‘hypersegregated’ with a student body composed of more than 90%
minority students.” The report also found that the technical schools located in the big cities
tended to be segregated while the magnet schools were not.28
Since 2012 the State Board of Education has approved six more charter schools and there
is an effort to approve two more for the coming year. The state education commissioner has the
authority to require changes in charter schools if they do not “achieve measurable progress in
reducing racial, ethnic and economic isolation” and the Board could make this a prerequisite for
a charter but has not done so.29
Under the Sheff remedy, the voluntary transfer program was gradually revived as the
Open Choice program. It did not provide a right of students to transfer from segregated schools
or a requirement that participating districts agree to accept enough students to create a substantial
level of integration with a critical mass of nonwhite students. Unlike the earlier program,
however, it was smaller, in a substantially larger metro area, and it was not race targeted,
meaning that some of the spaces could and were taken up by some of the small number of whites
in the central city using the plan to transfer to outlying white areas, undermining the already
limited possibilities of integration within city schools. Or a black or Latino student in the suburbs
could use the program to transfer into a more segregated school, but the district would not
receive state incentive funds for the transfer. Under Project Concern all of the moves were
required to increase integration. Though this specificity is lacking in Open Choice, the net effect
clearly increases integration options.
Open Choice statewide requires the voluntary participation of suburban school districts
and provides some funding but does not fully cover the costs of high spending districts so there
could be a financial penalty for participating. In Hartford, Open Choice currently involves 28
suburban districts. Each district gets half of its normal state aid, per student, and a fixed sum
which often does not normally cover the other half of state aid and the local per student
expenditure. Since the cost of adding a few students per school is often significantly less than the
average cost per student (the marginal vs. the average cost) enrolling a small number of students
may or may not create a financial problem. The state formula provides small added funding for
districts with few transfers and more adequate levels for higher numbers of transfers. An
27 Ibid., pp. 6-7. 28 Ibid., p. 9 29 Jacqueline Rabe Thomas, “Report: Many Connecticut Charter Schools ‘Hyper-Segregated,” CT Mirror, April 9,
2014.

Connecticut School Integration: Moving Forward as the Northeast Retreats, April 2015
Civil Rights Project/Proyecto Derechos Civiles
19
estimated 1850 Hartford students participated in Open Choice in fall 201330 and about 2000 this
year.
The New York Times Magazine noted the remarkable success of low income students
who were able to enroll in the Greenwich Schools where there is no significant area of
concentrated poverty: “Around 13% of the school’s students receive free or discounted lunches,
a commonly used measure of low income status. And more than three-quarters of those students
scored at or above proficiency on the most recent statewide 10th-grade performance tests. At
nearby Stamford High School, where nearly 47% of students are on the lunch program, almost
half the students failed to meet proficiency levels.”31 Of course, in the intensely segregated
centers of the state’s major cities the problems are much deeper.
Connecticut reached new agreement to increase integration in the Hartford area in April
2013. Commissioner of Education Stefan Pryor announced that “the new agreement provided the
opportunity to extend the agreement for an additional near which was needed to reach the goals
including the placement of 41% of Hartford’s minority students in reduced racially isolated
settings.” The stipulation called for “the expansion of opportunities at existing magnet schools,
the addition of new magnet schools, and an increase of available seats at Open Choice Schools
with more state support.” The release noted the previous plan had produced “placement of 37%
of Hartford resident minority students in reduced isolation educational settings.”32 Martha Stone,
Executive Director of the Center for Children's Advocacy, one of the civil rights attorneys in the
case, said, "We have signed an agreement today that creates new schools that will allow
thousands more of Hartford's school children to take advantage of equal educational
opportunities.”33 By the time of this agreement about a third (34%) of Hartford’s students were
attending regional magnets or going to another district on the choice program. Negotiations
continued in 2013 and a new stipulation provided additional means to reach the goals including
new magnet schools as well as a commitment to negotiate a long term agreement. 34 In February
2013 the court approved a new agreement between the state and the Sheff plaintiffs. It raised to
47.5% the goal percentage for minority students living in Hartford in an integrated setting by fall
2015, affecting about 1300 more city students. The plan also called for expanding suburban
Open Choice enrollment by 325 and for negotiating a new long term agreement by August,
2015. The Sheff Movement community coalition35 continue to press for further efforts.
By and large, Connecticut has successful schools which are well supported and many of
the state’s students experience outstanding academic success. The regional magnets expand
educational choice options by offering both city and suburban children unique curricula rarely
possible within individual districts. The state also, however, still has impoverished segregated
nonwhite schools where the outcomes are usually profoundly disappointing even though
considerable money is invested and a succession of reforms have been implemented.
30 Connecticut Department of Education, “Summary of all Hartford-Resident Minority PK-12 Students Enrolled in
Reduced Isolation Settings,” Oct. 1, 2013 Enrollment Data. 31 Adam Davidson, “The Other Greenwich,” New York Times Magazine April 14, 2013, pp. 16-17. 32 Connecticut State Department of Education News Release “State Department of Education Reaches Agreement
with Plaintiffs in Sheff v. O’Neill Litigation on 1 Year Extension “, April 30, 2013. 33 Press Release, “Significant New Agreement Signed in Sheff vs. O'Neill,” April 30, 2013. 34 “Nearly Half the Students from Hartford Now Attend Integrated Schools,” CT Mirror, Nov. 27, 2013. 35 See www.sheffmovement.org
Connecticut School Integration: Moving Forward as the Northeast Retreats, April 2015
Civil Rights Project/Proyecto Derechos Civiles
20
Racial and Ethnic Change in Connecticut
Connecticut is one of parts of the country first settled by European immigrants and some
of communities most affected by racial change are among the nation’s most historic. Off the
paths of the largest migrations of African Americans from the South and Latinos from Mexico
and the Caribbean, much of the state remained overwhelmingly white much longer than many
other states. Its recent history, however, shows that important demographic changes and major
challenges are now under way.
New England was 97% white in l960 and just 2% black. The Hispanic population was
even smaller but it is impossible to say how small because the Census Bureau did not even count
it until the l980 Census.36 For the first two centuries of the U.S. Census beginning in 1790 the
share of nonwhite population in the region had been miniscule. Even the very small shares in
l960 were more than twice as large as those in l940. The region went into the civil rights era with
a tiny nonwhite minority, though minorities were already making up a substantial share of the
public school population in central cities, in part because of the region’s housing segregation and
the fragmentation of metropolitan areas with small pre-automobile central cities separated from a
myriad of small communities and school districts, some of which had been independent villages
for generations before the American revolution and were now part of burgeoning suburban rings.
These were areas with rapidly declining ties to central cities as jobs and commerce moved out to
suburban locations.
The postwar Baby Boom gave way to a steep and continuing decline in the family size of
U.S. white families. The postwar move to the suburbs in ring after ring of communities
developed for and marketed to white families continued as racial change developed, draining
cities of essential human and financial resources and leaving behind those who were poor and
those who were discriminated against in the real estate and mortgage markets. The development
of the great freeways with federal funds lead to the creation of massive regional shopping and
office centers, taking jobs and tax revenue from the cities. Public policy provided a variety of
incentives and subsidies for suburbanization but it was largely for whites only as the suburbia
took shape.37 Not until 1968 was the federal fair housing enacted and it was given significant
enforcement power only two decades later.38 A half century ago, some of the consequences of
these changes were already painfully evident in the state’s central cities.
Major racial changes continued. The size of black families fell sharply after the l960s but
not as fast as white families. By the mid-1970s the South was booming and New England was
stagnating as a job market though there were prosperous regions, there was a net black migration
to the South and a net white migration to the Sunbelt. Into this vacuum came a greatly expanded
36 U.S. Bureau of the Census, “New England Division—Race and Hispanic Origin: 1790- 1990,” Sept 12, 2002. The
school population began to be counted by race and ethnicity in the l960s. The city was substantially affected by the
large post-war Puerto Rican immigration which centered on New York City and significantly impacted cities from
Boston to Philadelphia. 37 Kenneth T. Jackson, The Crabgrass Frontier: The Suburbanization of the United States, New York: Oxford Univ.
Press, 1985); Tom Martinson, American Dreamscape: The Pursuit of Happiness in Postwar Suburbia, New York:
Carol and Graf Publishers, 2000; 38 John M. Goering, ed., Housing Desegregation and Federal Policy, Chapel Hill: Univ. of North Carolina Press,
1986.

Connecticut School Integration: Moving Forward as the Northeast Retreats, April 2015
Civil Rights Project/Proyecto Derechos Civiles
21
and different international migration. After World War II there was a large migration of Puerto
Ricans to the Northeast. With the l965 repeal of the immigration law that had overwhelmingly
favored Europeans and created impossible barriers for immigrants from Africa and Asia, the U.S.
began to experience a huge migration of young families from Latin America and Asia, the largest
migration in more than a half century and the first predominantly nonwhite immigration in U.S.
history.39 What had been modest Latino numbers, concentrated in the Southwest, New York
City, South Florida and Chicago, became the nation’s largest minority community by 2000.
Asians, who had been a virtually invisible population outside of a few cities, became a
significant and visible population with their remarkable immigration of highly educated
immigrants as well as a much smaller stream of poor refugees from the Vietnam War. We
became a four race country with the majority population not having enough children to
reproduce itself and aging.40 Latinos and Asians began to move out of their traditional areas into
all parts of the U.S. and New England began to change.
Connecticut reflected this pattern. In l960, as the civil rights movement began to burst on
the country, it was 96% white with only 107,000 African Americans. The state had always had a
small black population but there were deep roots. Slavery had existed in the state before the
American Revolution but was then outlawed and virtually disappeared by l820. The state’s tiny
proportion of blacks did not change significantly until the World War II economic boom in the
state’s then powerful manufacturing industries. But there were still only 4% blacks in 1960. Then
the change accelerated.
Connecticut young people today live in a society dramatically different and more diverse
than its retirement age population experienced when growing up, meaning that all of the
institutions and practices created for a different society are challenged by transformations which
are difficult for many in the older generations to understand. In 2010, 22% of the babies born in
Connecticut were Hispanic and another 13% were African American—together more than a third
of the total. Only 7% of the state’s deaths, however, were African American and just 4% were
Hispanic, showing the dramatic differences in racial composition by age groups.41 Elderly New
Englanders grew up in a world with few nonwhites. Their grandchildren are growing up in a
truly diverse world with large groups that were simply not present in the communities that
shaped the views and understandings of older generations. Suburbanization after World War II
made many think that they could leave racial diversity behind in the city, but now the change,
which reached its peak long ago in the cities, is focused squarely on large sectors of suburbia.42
The changes that have happened so far are but a foretaste of the change that is coming.
New England is one of the last regions of the country to feel to force of these
transformations but Connecticut is not far from New York City, a great magnet for both the
Latino and Asian migration and is clearly in the path of future changes, particularly as the
economy revives. New England’s population would be visibly shrinking now were it not for
39 Immigration and Nationality Act of 1965 (Hart-Celler Act, INA, Act of 1965, Pub.L. 89–236 40 Laura B. Shrestha and Elayne J. Heisler The Changing Demographic Profile of the
United States , Washington: Congressional Research Service, March 31, 2011 41 Connecticut Department of Public Health, http://www.ct.gov/dph/cwp/view.asp?a=3132&q=394598, accessed
April 20, 2013 42 Erica Frankenberg and Gary Orfield, eds., The Resegregation of Suburban Schools: A Hidden Crisis in American
Education, Cambridge: Harvard Education Press, 2012.

Connecticut School Integration: Moving Forward as the Northeast Retreats, April 2015
Civil Rights Project/Proyecto Derechos Civiles
22
nonwhite families and Latino and Asian immigration. The conditions of Connecticut’s cities,
harsh as they are, would certainly be considerably worse if there were not substantial
communities of migrants making use of infrastructure and housing abandoned by whites and,
increasingly, by middle class families of all races.
Table 1: Public School Enrollment by Race, 1987-2013
Total
Enrollment
Percentage
White Black Asian Latino AI Mixed
Connecticut
1987-1988 445,958 76.8% 12.0% 1.9% 8.8% 0.2%
1997-1998 517,220 72.2% 13.2% 2.5% 11.8% 0.2%
2007-2008 551,421 65.7% 13.6% 4.0% 16.3% 0.4%
2012-2013 534,513 59.9% 12.8% 4.8% 20.1% 0.3% 2.1%
Northeast
1987-1988 7,038,318 79.3% 12.7% 2.3% 5.9% 0.1%
1997-1998 7,878,138 69.5% 15.0% 4.0% 11.2% 0.3%
2007-2008 7,865,746 64.0% 15.0% 5.6% 15.1% 0.3%
2012-2013 7,738,688 59.1% 14.3% 6.6% 17.9% 0.3% 1.7%
Nation
1987-1988 40,160,284 70.6% 13.9% 3.3% 11.3% 0.9%
1997-1998 46,514,592 62.5% 16.9% 3.9% 15.6% 1.1%
2007-2008 48,063,084 55.5% 16.7% 4.8% 21.8% 1.2%
2012-2013 48,978,700 50.8% 15.4% 5.1% 24.8% 1.1% 2.8%
Source: U.S. Department of Education, National Center for Education Statistics, Common Core of Data (CCD),
Public Elementary/Secondary School Universe Survey Data
Note: AI = American Indian
The state’s schools were only about an eleventh Latino in 1987 but a fifth in 2012, a huge
change. Only a fiftieth of the students were Asian in 1987 but by 2012 it was nearly one in
twenty students. While these two groups doubled their share of the state’s students, the
proportion of white students fell from 77% to 60%. The total enrollment in the state was
stagnant, up only 3.3% in the 15 years from 1997-2012 (see Table1). Given the collapse of birth
rates in the Great Recession, this is likely to turn into a loss as those smaller cohorts of children
begin school.43
For citizens of Connecticut the trends raise an important challenge. It may well be that
the number of white students being graduated by the public schools is now in a period of
continuous decline and that within a decade or so, whites entering college and the labor force
will be a declining minority. This means that the people of the state need to worry seriously
about the education of the coming nonwhite majority and about how best to raise all young
people for a profoundly multiracial society where it will be essential for people of divided racial
and ethnic groups to live and work and govern together. For those youths who eventually will
43 “Connecticut Had Nation’s 4th Lowest Birth Rate, New Federal Data Shows,” Connecticut by the Numbers, Oct.
7, 2012. http://ctbythenumbers.info/2012/10/07/connecticut-had-nations-4th-lowest-birth-rate-new-federal-data-
shows/

Connecticut School Integration: Moving Forward as the Northeast Retreats, April 2015
Civil Rights Project/Proyecto Derechos Civiles
23
look for jobs in the larger national market, which will be even more diverse, this will be still
more important. Connecticut since it is richer and whiter and less affected so far by migrant
streams than many other states, has the luxury of some time to come up with a better answer than
the “lets pretend-this-is-not-happening” policy model that has been the norm in this generation
and has failed in so many communities around the U.S.
Contemporary school policy debates tend to ignore issues of race and segregation by race
and poverty, though these factors are so powerfully linked to school opportunities and outcomes.
For three decades the country has been focused on testing, accountability, teacher quality and
policies to create more competition from semi-private charter schools. Educational policy has
been dominated by assumptions that date back to the l983 Reagan Administration’s report, A
Nation at Risk which dismissed social issues and research on the dire effects of conditions
outside the schools on children’s’ preparation and assumed that problems of unequal education
could be solved inside schools by developing and enforcing appropriate test-based
accountability. Since then, this framework has been adopted by Presidents of both parties and
underlies the reforms in almost all states in the l980s. President Clinton’s “Goals 2000” and the
bipartisan “No Child Left Behind Act” of the Bush Administration as well as Obama’s “Race to
the Top” have been part of a remarkably enduring definition of educational problems and
solutions. Public debate has ignored the fact that this approach has consistently failed to meet its
goals and the gaps, which closed dramatically following the civil rights and poverty reforms of
the l960s and early l970s, have been little changed for a generation. There was a strong focus in
the l960s to the mid-1970s in the impact of race and poverty on unequal schooling and on
desegregating public schools, mainly in the Southern states with histories of state laws
mandating segregation.
Connecticut School Integration: Moving Forward as the Northeast Retreats, April 2015
Civil Rights Project/Proyecto Derechos Civiles
24
Changes in Segregation
Historically Connecticut was home to several relative small central cities with strong
industrial, commercial and educational bases. Some of these cities are truly old. Hartford was
founded in l635, Bridgeport in 1665, New Haven in 1638. As the cities developed they played an
important role in American industry, education, and the intellectual life of the nation. Cultural
influence reached a peak in the l9th century when Hartford was home to a cluster of writers
including two the most famous in American literature, Mark Twain and Harrier Beecher Stowe.
Connecticut was a pioneer in advanced manufacturing and played an important role in World
War II industrial production. It was also the national center of the insurance industry, particularly
in Hartford. New Haven, with Yale University, and Hartford, with the State capital, and a strong
literary tradition, were centers of culture. After the civil war Hartford had been the wealthiest
city in the nation for some time.
But they were small central cities with nowhere to grow surrounded by many
independent suburbs. Hartford has just l8 square miles. All of the big three cities had less than
150,000 population in 2010. Bridgeport, the largest has 19 square miles. New Haven has 20
square miles. All three were settled in the l630s. All three could be fit into a small corner of Los
Angeles or many other automobile-age cities. In terms of land area this each like a city four
miles long by four miles wide. These are pre-railroad, pre-streetcar cities built for walking and
horses. They were cut off by independent suburbs before the automobile was invented and, of
course, today occupy only a small part of the sprawling metropolitan areas engulfing them that
came in post-baby boom America. .
The localism of CT is reflected in the fact that the state abolished its system of counties
in l960. This leaves localities even more on their own. It reflects the New England tradition of
village level, highly decentralized, government. The fragmentation and localism, backed by
centuries of tradition, means that it is hard to address metropolitan problems, especially sensitive
social issues. So, normally, nothing is done. The serious and deeply rooted fragmentation of the
relatively small metros meant that racial problems were particularly hard to address. The
Connecticut Supreme Court recognized that the requirement that school districts are linked to
municipalities was a cause of segregation.
If a metropolitan area has 12% nonwhite population, the central city has only an eighth of
the metropolitan population, and there is a pattern of strong housing segregation, it is easy for a
city to have a substantial nonwhite majority in an overwhelmingly white area. This tends to be
even more extreme for school age populations since the minority families are, on average
younger and have more children and are more likely to use public schools than whites,
particularly in central cities which have historically had a stronger parochial and private school
tradition. White middle and upper class families with school-age children rarely consider living
in older central cities. This is the Connecticut pattern.
The data presented in this study focuses primarily on the period from 1987 to 2012. On a
national level, the late l980s brought the highest level of desegregation for black students since
the l954 Brown decision. Civil rights law had been unchanged since the l970s and residential
segregation of blacks was gradually declining. Net migration from the south had ended in most
areas and there was a reverse migration of blacks going back to the South, even as black family

Connecticut School Integration: Moving Forward as the Northeast Retreats, April 2015
Civil Rights Project/Proyecto Derechos Civiles
25
sizes fell substantially. Fair housing laws and changing attitudes were producing some gains in
residential desegregation and a significant number of black families were moving to the suburbs.
After this period, however, segregation began to rise again for black students nationally and in
most regions and states as the Supreme Court authorized ending desegregation orders.
Segregation for the rapidly growing Latino population was a different story. Largely
ignored during the desegregation struggles of the 1960s and l970s, the soaring Latino
immigration and population growth transformed the country but came after the period of serious
civil rights enforcement and the Supreme Court did not define the right of Latinos to
desegregated schools until nearly two decades after Brown. Ever since national data was first
collected Latino segregation have steadily increased, reaching and surpassing the black level on
some measures by the late l980s. The trends in Connecticut have to be measured against those
national patterns.
Figure 1: Black Students in Minority Segregated Schools in Connecticut, 1987-2013
Source: U.S. Department of Education, National Center for Education Statistics, Common Core of Data (CCD),
Public Elementary/Secondary School Universe Survey Data
The recent trends of segregation for black students in Connecticut differed significantly
from the national trends. Although there was a significant increase in Connecticut black student
concentration in schools with less than half white students (only 21% of black students were in
majority white schools by 2010 in spite of the state’s substantial white majority), there was a
significant and continuing decline in the share of black students that were attending schools that
were intensely segregated or virtually all black and Latino. 36% of Connecticut black students
were attending intensely segregated schools which had zero to ten percent whites in 1987 but
that declined to 29% by 2012 even though the state proportion of white students fell
significantly. The decline was sharper for the “apartheid” schools with one percent or fewer
white students. One sixth of the state’s black students were in such schools in 1987 but only one
twenty-fifth in 2012 (see Figure1).
61.3
35.7
16.4
69.0
32.6
14.1
74.3
30.1
5.3
81.0
28.8
4.2
0
10
20
30
40
50
60
70
80
90
50-100% Minority School 90-100% Minority School 99-100% Minority School
1987-1988
1997-1998
2007-2008
2012-2013

Connecticut School Integration: Moving Forward as the Northeast Retreats, April 2015
Civil Rights Project/Proyecto Derechos Civiles
26
Figure 2: Latino Students in Minority Segregated Schools in Connecticut, 1987-2013
Source: U.S. Department of Education, National Center for Education Statistics, Common Core of Data (CCD),
Public Elementary/Secondary School Universe Survey Data
The data for Latino students also shows the same general trends. The proportion of
Latino students in intensely segregated schools fell from 34 to 21% over this 25 year period
while the percent in apartheid schools fell sharply from one tenth to one hundredth (see Figure
2). These were substantial improvements. At the same time, however, the share of Latino
students in majority white schools also fell, but not as sharply as for African Americans, in spite
of the faster growth of Hispanic enrollment. African American segregation was more entrenched.
For both African American and Hispanic students fewer were accessing the typical white middle
class Connecticut schools but, at the same time, substantially fewer faced extreme isolation. As
the white share of the population drops there would be fewer majority white schooling
opportunities even if no policies changed. All, in all, these numbers in Figures 1 and 2 clearly
suggest a significant impact of the of the magnet and transfer plans implemented under the Sheff
case and the outward movement of Latino and African American families to suburban
communities, whose diversity may prove to be either transitional or lasting, depending on how it
is managed. There had been significant progress in reducing the extreme forms of segregation.
When the Connecticut data is compared with trends in neighboring Massachusetts it is
clear that the Connecticut record on the trend of extreme segregation is more positive. In
Massachusetts the growth in intense segregation was significant while these numbers were
shrinking in Connecticut probably in response to the Sheff plans.44
There has been a notable increase in the percentage of students from all groups who
attend multiracial schools in Connecticut. Such schools have more than 10% of students enrolled
from three or more different groups. This trend has been most clear for blacks and Latinos who
are most likely to be enrolled in schools with each other and at least one other group—most
commonly whites. This is not because these students are experiencing increasing contact with
44 The Civil Rights Project at UCLA. (2000). Losing Ground: School Segregation in Massachusetts. Los Angeles,
CA: Jennifer B. Ayscue and Alyssa Greenberg. Retrieved from http://civilrightsproject.ucla.edu/research/k-12-
education/integration-and-diversity/losing-ground-school-segregation-in-massachusetts/ayscue-greenberg-losing-
ground-segregation-mass.pdf
67.4
33.7
9.9
69.8
30.6
6.5
71.7
24.1
2.9
74.1
21.0
1.0
0
10
20
30
40
50
60
70
80
50-100% Minority School 90-100% Minority School 99-100% Minority School
1987-1988
1997-1998
2007-2008
2012-2013

Connecticut School Integration: Moving Forward as the Northeast Retreats, April 2015
Civil Rights Project/Proyecto Derechos Civiles
27
whites—in fact, it is because they are experiencing increasing contact with each other and with
Asians. Whites are least likely to be interracial schools. Since these schools cover a wide range
of combinations, it is hard to describe them as a group and more research is needed on the
implications and stability of these changes. But it is clear that significantly more students of all
races are experiencing something of the multiracial society of the state’s future.
Figure 3: White Students in School Attended by the Typical Student of Each Race in
Connecticut, 1987-2013
Source: U.S. Department of Education, National Center for Education Statistics, Common Core of Data (CCD),
Public Elementary/Secondary School Universe Survey Data
In terms of any theory about the educational and social value of integration there has to
be significant real contact with significant numbers of students of other races or ethnicities under
positive conditions to expect substantial benefits. Educational benefits for disadvantaged groups
of students depend largely on getting access to the more challenging classes and peer groups and
the different networks and support systems that exist in stronger schools, most of which have
substantial white middle class enrollment. This cannot happen, of course, if there is little actual
exposure. What we have seen in the Connecticut data is a significant decline in the average
portions of white students and middle class students in the schools attended by black and Latino
students. We calculate the exposure index by looking at the racial composition of the school each
student of any race attends and then adding them all together and computing a statewide average
exposure level between groups. In 1987, the average Latino student in the state attended a 34%
white school, and this figure remained unchanged in 2012 (35%). For African American students
who were much less integrated with whites than Latinos were in l987 there was also a substantial
decline from 37 to 29% (see Figure 3). This means that there was less and less opportunity for
intergroup contact and fewer connections to the white community for the average students of
color.
76.8
72.2
65.7
59.9
88.485.2
80.2
75.0
36.834.1
31.628.9
74.471.6
67.8
61.7
33.8 35.3 35.2 34.7
0
10
20
30
40
50
60
70
80
90
100
1987-1988 1997-1998 2007-2007 2012-2013
% White White Black Asian Latino

Connecticut School Integration: Moving Forward as the Northeast Retreats, April 2015
Civil Rights Project/Proyecto Derechos Civiles
28
Figure 4: Percentage of Racial Group in Multiracial Schools by Race in Connecticut, 1987-2013
Source: U.S. Department of Education, National Center for Education Statistics, Common Core of Data (CCD),
Public Elementary/Secondary School Universe Survey Data
White students in Connecticut are far more concentrated in white schools than whites
across the U.S. As Figure 5 shows, the state’s typical white student is in a 75% white school with
an average of nearly 5% Asian students. The state’s Asian students attend schools that are almost
two-thirds white on average and 8% Asian since there is no significant pattern of Asian
residential segregation. 17% of school mates of Asian students are Latino and only 11% are
African American. Less than a ninth of the classmates of white students, on average, are Latino
and less than a sixteenth are black. African American and Latino students attend schools with
fundamentally different student bodies than whites and Asians. Only about or less than a third of
their classmates are white, only about 4% are Asian, and both go to schools with about a third
classmates from their own group and substantial numbers of students from another
disadvantaged group. Latinos attend schools with an average of 20% black enrollment and blacks
attend schools with an average of 32% Latino enrollment (see Figure 5). Typically, black and
brown students are in schools with each other and with a declining minority of whites in this
heavily white state. They attend schools with a small minority of middle class students in this
well-to-do state. Such schools of double segregation create, on average. Fundamentally more
limited educational possibilities.
7.3
11.5
16.7 17.2
28.9
41.4
52.6
56.2
20.4
28.9
34.2
34.4
41.2
45.7
53.7
51.1
9.5
19.4
30.7
35.0
0
10
20
30
40
50
60
1987-1988 1997-1998 2007-2008 2012-2013
White
Black
Asian
Latino
American Indian

Connecticut School Integration: Moving Forward as the Northeast Retreats, April 2015
Civil Rights Project/Proyecto Derechos Civiles
29
Figure 5: Racial Composition of School Attended by Typical Student of Each Race in
Connecticut, 2012-2013
Source: U.S. Department of Education, National Center for Education Statistics, Common Core of Data (CCD),
Public Elementary/Secondary School Universe Survey Data
Note: Composition figures exclude American Indian and mixed race students and therefore, do not exactly equal
100%.
Segregation by Poverty
In contrast to many states where a majority of all children come from families poor
enough to qualify for federally subsidized or free school lunches, particularly after the Great
Recession, this is true for only a third of students in Connecticut, one of the richest states. But
the comparative inequality in racial exposure to poor students is more extreme in Connecticut
than in the nation as a whole. Across the U.S., black and Latino students are in schools with
about twice as high a proportion of poor children than white students. In Connecticut the ratio is
3 to 1 — black and Latino students have three times as many poor classmates as whites and
whites attend schools that are overwhelmingly middle class, with significantly less exposure to
low income classmates Schools and communities where most of the families are poor have fewer
out-of-school, academically stimulating opportunities, lower outside financial and volunteer
contributions to the school, a more unstable population because poor families must move more
often, more untreated chronic medical problems, more exposure to violence, and many other
differences. Since there is a very strong relationship between the poverty of students in a school,
the level of competition in the school, the graduation rate, the curriculum offered, and the skills
and experience of teachers, and the connections with colleges among many critically important
differences.
The fact that black and Latino students face both segregation from whites and Asians and
from middle class fellow students is strongly linked to educational inequality. Connecticut’s
black and Latino students face double segregation and double harm since they are
simultaneously isolated on both dimensions. By 2013, in the intensely segregated schools with
75.0
28.9
61.7
34.7
6.2
33.3
10.6
20.0
4.9
4.0
7.8
4.1
11.7
31.5
17.4
38.7
0%
10%
20%
30%
40%
50%
60%
70%
80%
90%
100%
White Black Asian Latino
Latino
Asian
Black
White

Connecticut School Integration: Moving Forward as the Northeast Retreats, April 2015
Civil Rights Project/Proyecto Derechos Civiles
30
less than a tenth whites, 90% of the students were poor enough to need free or reduced price
lunches. These children have very few links either to whites or to middle class students.
Fortunately, the share of the state’s black and Latino students in these intensely segregated
schools has declined significantly in the Sheff era.
Figure 6: Exposure to Low-Income Students for Typical Racial Typical Student in Connecticut,
1997-2013
Source: U.S. Department of Education, National Center for Education Statistics, Common Core of Data (CCD),
Public Elementary/Secondary School Universe Survey Data
Although high concentrations of poverty would negatively affect opportunities for
whites, as well, whites in Connecticut have little contract with poor classmates. As Figure 6
shows, whites were least likely to be exposed to students from low-income families, nearly two-
thirds of classmates of black and Latino students were poor students in 2012. This pattern clearly
raises the stakes on Connecticut’s segregation. The extremely different school compositions for
white and Asian children create far superior opportunities and connections for those children in
schools which have more powerful parents and communities with better resources backing their
schools. When hard choices have to be made about programs and staffing communities that are
organized and have parents with resources and skills as well as money to contribute have an
enormous advantage and that advantage also accrues to the children who attend the local schools.
19.5
29.4
36.2
10.5
17.0
22.3
42.6
57.1
63.1
17.2
23.6
29.8
48.8
57.8
61.6
0 10 20 30 40 50 60 70
1997-1998
2007-2008
2012-2013
Latino
Asian
Black
White
% of Low-Income

Connecticut School Integration: Moving Forward as the Northeast Retreats, April 2015
Civil Rights Project/Proyecto Derechos Civiles
31
Multiracial and Minority Segregated Schools in Connecticut
Table 2: Schools Classified by Percent of Nonwhite Students in Connecticut, 1987-2013
Total
Schools Multiracial
Schools 50-100%
Minority Schools 90-100%
Minority Schools 99-100%
Minority Schools
1987-1988 918 11.3% 14.3% 5.8% 2.0% 1997-1998 991 18.5% 21.8% 7.8% 2.6% 2007-2008 1,019 27.6% 30.0% 8.9% 1.4% 2012-2013 1,035 27.7% 35.1% 9.4% 1.2%
Source: U.S. Department of Education, National Center for Education Statistics, Common Core of Data (CCD),
Public Elementary/Secondary School Universe Survey Data
Note: Nonwhite students represent Black, Latino, American Indian, and Asian students.
The severe segregation by race is concentrated in a small minority of schools. Although
the proportion of intensely segregated schools—where less than 10% white students are
enrolled— decreased from 2% to 1.2% between 1987-2012, the share of schools with
predominantly nonwhite students increased from 5.8% to 9.4% for the same period. In addition,
a third of the state’s 1,035 schools had a majority of nonwhite students (see Table 2). Depending
on whether or not there are appropriate school and housing desegregation policies in place to
support lasting integration a substantial fraction of those schools may be on a path to severe
segregation.
Figure 7: Schools Classified by Percent of Nonwhite Students, 1987-2013
Source: U.S. Department of Education, National Center for Education Statistics, Common Core of Data (CCD),
Public Elementary/Secondary School Universe Survey Data
The really interesting fact about the trends shown in Table 3 is that we do not see in
Connecticut the increased concentration in intensely segregated schools that we find at a national
level. In fact, in spite of the fact that the state’s African American and Latino proportions have
increased both groups are significantly less likely to be in apartheid schools where a tenth of
11.3%
18.5%
27.6%
27.7%
14.3%
21.8%
30.0%
35.1%
5.8%
7.8%
8.9%
9.4%
2.0%
2.6%
1.4%
1.2%
0% 10% 20% 30% 40% 50% 60% 70% 80%
1987-1988
1997-1998
2007-2008
2012-2013
% of Multiracial Schools % of 50-100% Nonwhite Schools
% of 90-100% Nonwhite Schools % of 99-100% Nonwhite Schools
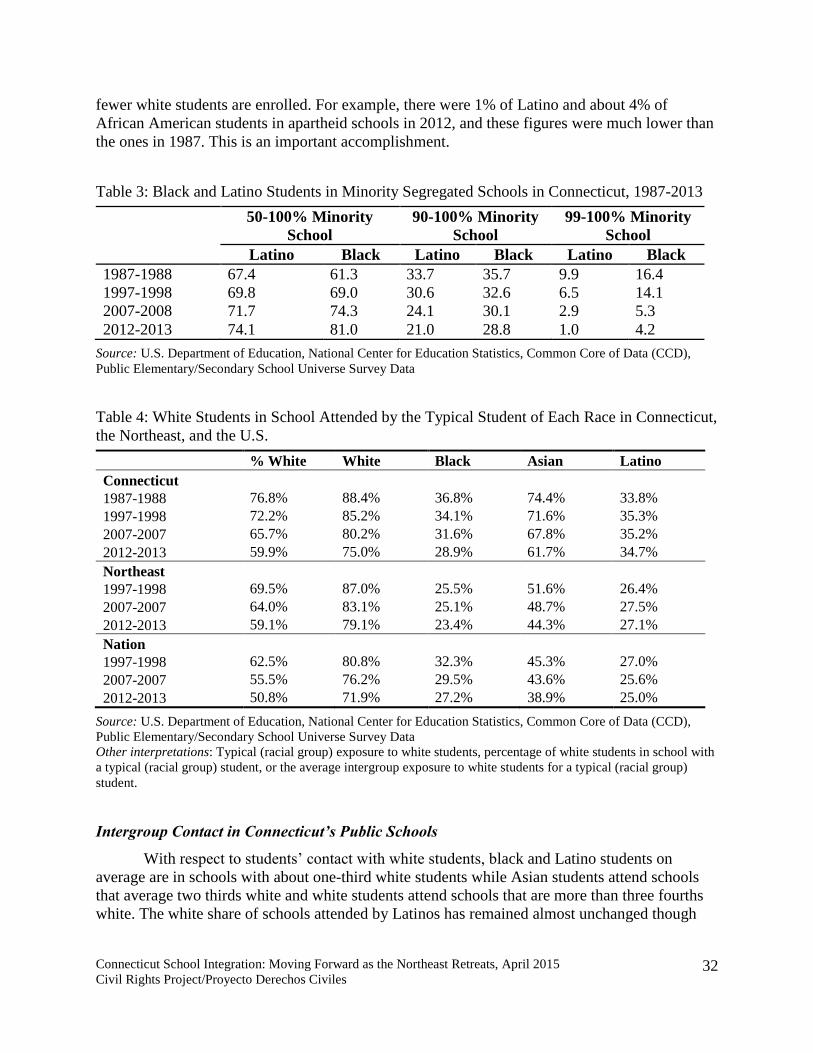
Connecticut School Integration: Moving Forward as the Northeast Retreats, April 2015
Civil Rights Project/Proyecto Derechos Civiles
32
fewer white students are enrolled. For example, there were 1% of Latino and about 4% of
African American students in apartheid schools in 2012, and these figures were much lower than
the ones in 1987. This is an important accomplishment.
Table 3: Black and Latino Students in Minority Segregated Schools in Connecticut, 1987-2013
50-100% Minority
School
90-100% Minority
School
99-100% Minority
School
Latino Black Latino Black Latino Black
1987-1988 67.4 61.3 33.7 35.7 9.9 16.4
1997-1998 69.8 69.0 30.6 32.6 6.5 14.1
2007-2008 71.7 74.3 24.1 30.1 2.9 5.3
2012-2013 74.1 81.0 21.0 28.8 1.0 4.2
Source: U.S. Department of Education, National Center for Education Statistics, Common Core of Data (CCD),
Public Elementary/Secondary School Universe Survey Data
Table 4: White Students in School Attended by the Typical Student of Each Race in Connecticut,
the Northeast, and the U.S.
% White White Black Asian Latino
Connecticut
1987-1988 76.8% 88.4% 36.8% 74.4% 33.8%
1997-1998 72.2% 85.2% 34.1% 71.6% 35.3%
2007-2007 65.7% 80.2% 31.6% 67.8% 35.2%
2012-2013 59.9% 75.0% 28.9% 61.7% 34.7%
Northeast
1997-1998 69.5% 87.0% 25.5% 51.6% 26.4%
2007-2007 64.0% 83.1% 25.1% 48.7% 27.5%
2012-2013 59.1% 79.1% 23.4% 44.3% 27.1%
Nation
1997-1998 62.5% 80.8% 32.3% 45.3% 27.0%
2007-2007 55.5% 76.2% 29.5% 43.6% 25.6%
2012-2013 50.8% 71.9% 27.2% 38.9% 25.0%
Source: U.S. Department of Education, National Center for Education Statistics, Common Core of Data (CCD),
Public Elementary/Secondary School Universe Survey Data
Other interpretations: Typical (racial group) exposure to white students, percentage of white students in school with
a typical (racial group) student, or the average intergroup exposure to white students for a typical (racial group)
student.
Intergroup Contact in Connecticut’s Public Schools
With respect to students’ contact with white students, black and Latino students on
average are in schools with about one-third white students while Asian students attend schools
that average two thirds white and white students attend schools that are more than three fourths
white. The white share of schools attended by Latinos has remained almost unchanged though

Connecticut School Integration: Moving Forward as the Northeast Retreats, April 2015
Civil Rights Project/Proyecto Derechos Civiles
33
Latino numbers have grown rapidly while black students are in contact with fewer whites.
Possibly this reflects less severe residential segregation (see Table 4).
In addition, Table 5 shows that the percentage of blacks in the school of the typical white
student is small and has changed little and not at all since l997. On average, a white student
would have one to two black students in his or her classroom if students are distributed fairly
within schools. Asian exposure to black students has declined slightly and so has the exposure of
black students to fellow blacks. Blacks are increasingly isolated from whites and from other
blacks. They are in contact with more Latinos, combining two disadvantaged minority groups.
Table 5: Black Students in School Attended by the Typical Student of Each Race in Connecticut,
the Northeast, and the U.S.
% Black White Black Asian Latino
Connecticut
1987-1988 12.0% 5.8% 43.0% 11.1% 25.1% 1997-1998 13.2% 6.2% 41.4% 12.3% 24.4% 2007-2007 13.6% 6.5% 37.1% 11.4% 23.1% 2012-2013 12.8% 6.2% 33.3% 10.6% 20.0%
Northeast 1997-1998 15.0% 5.5% 53.2% 13.8% 23.1% 2007-2007 15.0% 5.9% 49.0% 12.3% 21.0% 2012-2013 14.3% 5.7% 46.0% 11.4% 18.5%
Nation 1997-1998 16.9% 8.7% 54.3% 11.9% 11.0% 2007-2007 16.7% 8.9% 51.4% 11.6% 11.5% 2012-2013 15.4% 8.2% 48.5% 10.7% 10.9%
Source: U.S. Department of Education, National Center for Education Statistics, Common Core of Data (CCD),
Public Elementary/Secondary School Universe Survey Data
The slow growth in diversity for whites has come from growing contact with Asians and
Latinos, not African Americans. The proportions of both of these immigration-driven groups
have doubled since l987. For example, Table 6 shows that the average percent of Asians in the
school of the typical white student more than doubled, from 2% to almost 5% while the average
white contact with Latinos soared from 3.9% to 11.7% more than half again the share of black
fellow students (see Table 7). In 1987 the average white exposure to blacks (5.8%) was equal to
the total of white exposure to Latinos (3.9%) and Asians (1.8%). By 2012, whites, on average
had far more Latino classmates (11.7%), and this figure is a total of the average white exposure
to Asians (4.9%) and blacks (6.2%) (see Tables 5, 6, and 7). To the extent that whites were in
contact with nonwhites, it was a much more multiracial, predominantly non-black experience.
There could be a substantial increase in the share of blacks in white schools with relatively small
numbers. In contrast to an earlier era when there were fears of conversion of schools from white
to black in cities with rapidly increasing black populations, apart from localized situations on the
boundaries of black communities experiencing residential change, there was no longer any basis
for such fears. Integration could be significantly increased for blacks with little impact on whites.
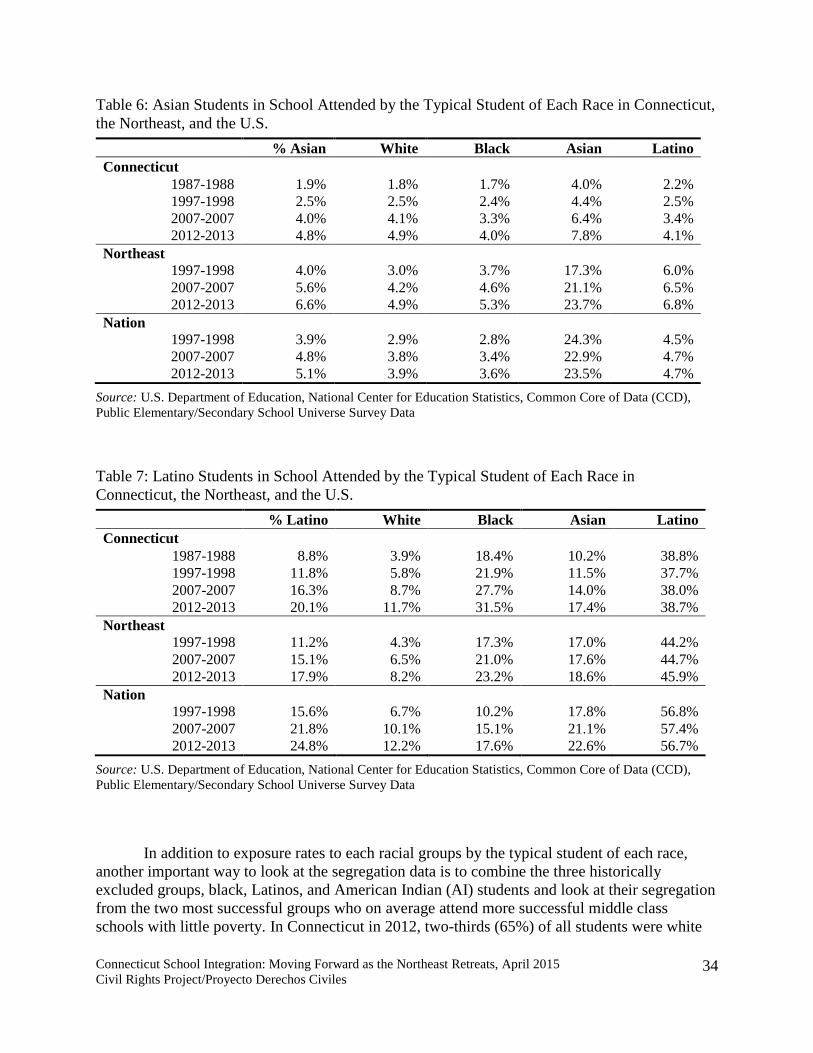
Connecticut School Integration: Moving Forward as the Northeast Retreats, April 2015
Civil Rights Project/Proyecto Derechos Civiles
34
Table 6: Asian Students in School Attended by the Typical Student of Each Race in Connecticut,
the Northeast, and the U.S.
% Asian White Black Asian Latino
Connecticut
1987-1988 1.9% 1.8% 1.7% 4.0% 2.2% 1997-1998 2.5% 2.5% 2.4% 4.4% 2.5% 2007-2007 4.0% 4.1% 3.3% 6.4% 3.4% 2012-2013 4.8% 4.9% 4.0% 7.8% 4.1%
Northeast 1997-1998 4.0% 3.0% 3.7% 17.3% 6.0% 2007-2007 5.6% 4.2% 4.6% 21.1% 6.5% 2012-2013 6.6% 4.9% 5.3% 23.7% 6.8%
Nation 1997-1998 3.9% 2.9% 2.8% 24.3% 4.5% 2007-2007 4.8% 3.8% 3.4% 22.9% 4.7% 2012-2013 5.1% 3.9% 3.6% 23.5% 4.7%
Source: U.S. Department of Education, National Center for Education Statistics, Common Core of Data (CCD),
Public Elementary/Secondary School Universe Survey Data
Table 7: Latino Students in School Attended by the Typical Student of Each Race in
Connecticut, the Northeast, and the U.S.
% Latino White Black Asian Latino
Connecticut
1987-1988 8.8% 3.9% 18.4% 10.2% 38.8% 1997-1998 11.8% 5.8% 21.9% 11.5% 37.7% 2007-2007 16.3% 8.7% 27.7% 14.0% 38.0% 2012-2013 20.1% 11.7% 31.5% 17.4% 38.7%
Northeast 1997-1998 11.2% 4.3% 17.3% 17.0% 44.2% 2007-2007 15.1% 6.5% 21.0% 17.6% 44.7% 2012-2013 17.9% 8.2% 23.2% 18.6% 45.9%
Nation 1997-1998 15.6% 6.7% 10.2% 17.8% 56.8% 2007-2007 21.8% 10.1% 15.1% 21.1% 57.4% 2012-2013 24.8% 12.2% 17.6% 22.6% 56.7%
Source: U.S. Department of Education, National Center for Education Statistics, Common Core of Data (CCD),
Public Elementary/Secondary School Universe Survey Data
In addition to exposure rates to each racial groups by the typical student of each race,
another important way to look at the segregation data is to combine the three historically
excluded groups, black, Latinos, and American Indian (AI) students and look at their segregation
from the two most successful groups who on average attend more successful middle class
schools with little poverty. In Connecticut in 2012, two-thirds (65%) of all students were white
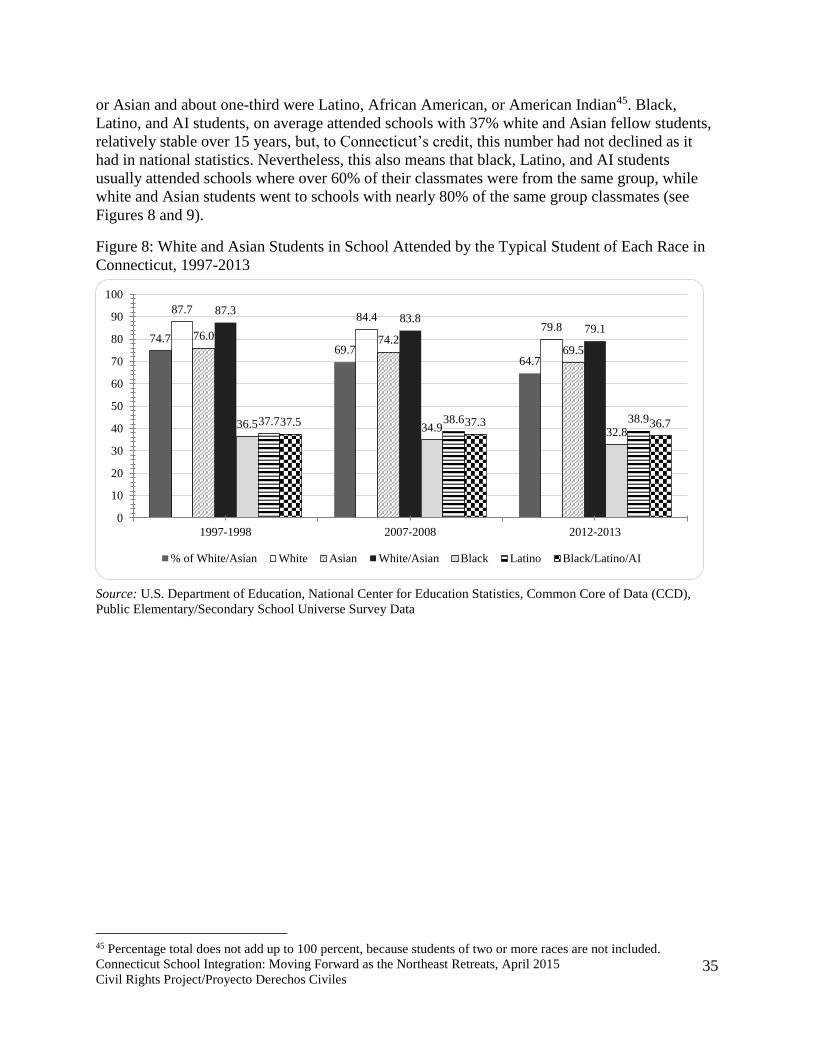
Connecticut School Integration: Moving Forward as the Northeast Retreats, April 2015
Civil Rights Project/Proyecto Derechos Civiles
35
or Asian and about one-third were Latino, African American, or American Indian45. Black,
Latino, and AI students, on average attended schools with 37% white and Asian fellow students,
relatively stable over 15 years, but, to Connecticut’s credit, this number had not declined as it
had in national statistics. Nevertheless, this also means that black, Latino, and AI students
usually attended schools where over 60% of their classmates were from the same group, while
white and Asian students went to schools with nearly 80% of the same group classmates (see
Figures 8 and 9).
Figure 8: White and Asian Students in School Attended by the Typical Student of Each Race in
Connecticut, 1997-2013
Source: U.S. Department of Education, National Center for Education Statistics, Common Core of Data (CCD),
Public Elementary/Secondary School Universe Survey Data
45 Percentage total does not add up to 100 percent, because students of two or more races are not included.
74.769.7
64.7
87.784.4
79.876.0 74.2
69.5
87.383.8
79.1
36.5 34.9 32.837.7 38.6 38.937.5 37.3 36.7
0
10
20
30
40
50
60
70
80
90
100
1997-1998 2007-2008 2012-2013
% of White/Asian White Asian White/Asian Black Latino Black/Latino/AI
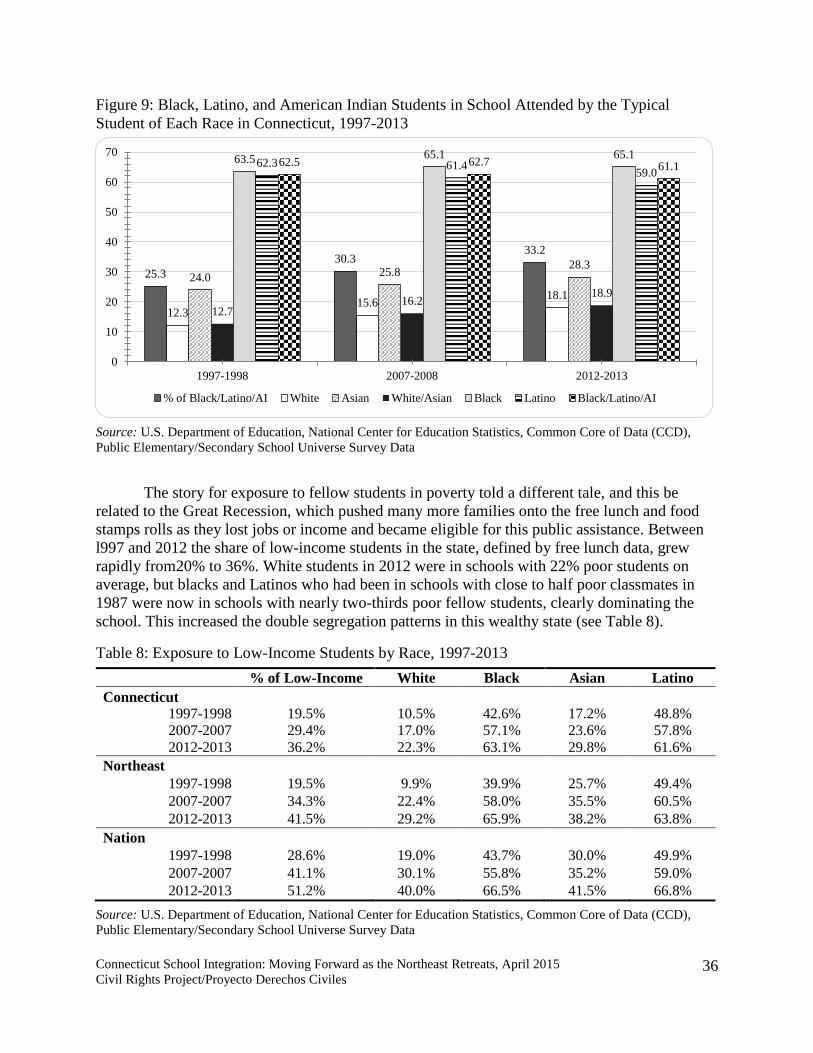
Connecticut School Integration: Moving Forward as the Northeast Retreats, April 2015
Civil Rights Project/Proyecto Derechos Civiles
36
Figure 9: Black, Latino, and American Indian Students in School Attended by the Typical
Student of Each Race in Connecticut, 1997-2013
Source: U.S. Department of Education, National Center for Education Statistics, Common Core of Data (CCD),
Public Elementary/Secondary School Universe Survey Data
The story for exposure to fellow students in poverty told a different tale, and this be
related to the Great Recession, which pushed many more families onto the free lunch and food
stamps rolls as they lost jobs or income and became eligible for this public assistance. Between
l997 and 2012 the share of low-income students in the state, defined by free lunch data, grew
rapidly from20% to 36%. White students in 2012 were in schools with 22% poor students on
average, but blacks and Latinos who had been in schools with close to half poor classmates in
1987 were now in schools with nearly two-thirds poor fellow students, clearly dominating the
school. This increased the double segregation patterns in this wealthy state (see Table 8).
Table 8: Exposure to Low-Income Students by Race, 1997-2013
% of Low-Income White Black Asian Latino
Connecticut
1997-1998 19.5% 10.5% 42.6% 17.2% 48.8% 2007-2007 29.4% 17.0% 57.1% 23.6% 57.8% 2012-2013 36.2% 22.3% 63.1% 29.8% 61.6%
Northeast
1997-1998 19.5% 9.9% 39.9% 25.7% 49.4% 2007-2007 34.3% 22.4% 58.0% 35.5% 60.5% 2012-2013 41.5% 29.2% 65.9% 38.2% 63.8%
Nation
1997-1998 28.6% 19.0% 43.7% 30.0% 49.9% 2007-2007 41.1% 30.1% 55.8% 35.2% 59.0% 2012-2013 51.2% 40.0% 66.5% 41.5% 66.8%
Source: U.S. Department of Education, National Center for Education Statistics, Common Core of Data (CCD),
Public Elementary/Secondary School Universe Survey Data
25.3
30.333.2
12.315.6
18.1
24.0 25.828.3
12.716.2
18.9
63.5 65.1 65.162.3 61.4
59.062.5 62.7 61.1
0
10
20
30
40
50
60
70
1997-1998 2007-2008 2012-2013
% of Black/Latino/AI White Asian White/Asian Black Latino Black/Latino/AI
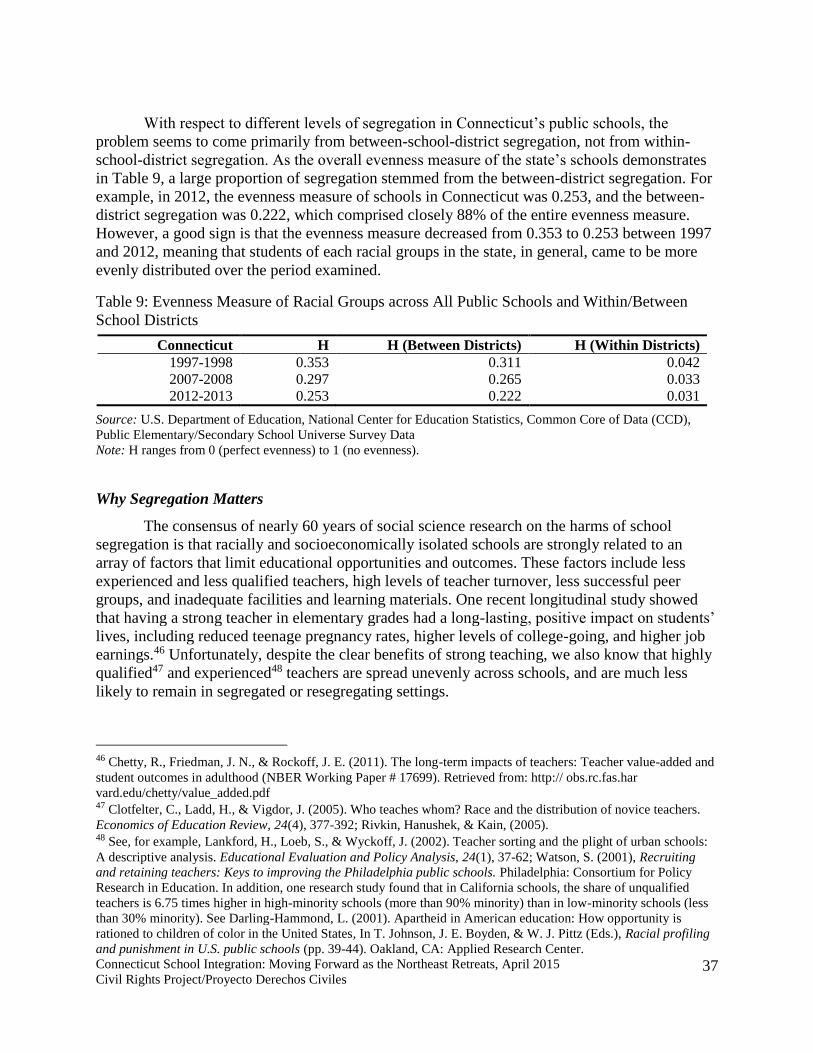
Connecticut School Integration: Moving Forward as the Northeast Retreats, April 2015
Civil Rights Project/Proyecto Derechos Civiles
37
With respect to different levels of segregation in Connecticut’s public schools, the
problem seems to come primarily from between-school-district segregation, not from within-
school-district segregation. As the overall evenness measure of the state’s schools demonstrates
in Table 9, a large proportion of segregation stemmed from the between-district segregation. For
example, in 2012, the evenness measure of schools in Connecticut was 0.253, and the between-
district segregation was 0.222, which comprised closely 88% of the entire evenness measure.
However, a good sign is that the evenness measure decreased from 0.353 to 0.253 between 1997
and 2012, meaning that students of each racial groups in the state, in general, came to be more
evenly distributed over the period examined.
Table 9: Evenness Measure of Racial Groups across All Public Schools and Within/Between
School Districts
Connecticut H H (Between Districts) H (Within Districts) 1997-1998 0.353 0.311 0.042 2007-2008 0.297 0.265 0.033 2012-2013 0.253 0.222 0.031
Source: U.S. Department of Education, National Center for Education Statistics, Common Core of Data (CCD),
Public Elementary/Secondary School Universe Survey Data
Note: H ranges from 0 (perfect evenness) to 1 (no evenness).
Why Segregation Matters
The consensus of nearly 60 years of social science research on the harms of school
segregation is that racially and socioeconomically isolated schools are strongly related to an
array of factors that limit educational opportunities and outcomes. These factors include less
experienced and less qualified teachers, high levels of teacher turnover, less successful peer
groups, and inadequate facilities and learning materials. One recent longitudinal study showed
that having a strong teacher in elementary grades had a long-lasting, positive impact on students’
lives, including reduced teenage pregnancy rates, higher levels of college-going, and higher job
earnings.46 Unfortunately, despite the clear benefits of strong teaching, we also know that highly
qualified47 and experienced48 teachers are spread unevenly across schools, and are much less
likely to remain in segregated or resegregating settings.
46 Chetty, R., Friedman, J. N., & Rockoff, J. E. (2011). The long-term impacts of teachers: Teacher value-added and
student outcomes in adulthood (NBER Working Paper # 17699). Retrieved from: http:// obs.rc.fas.har
vard.edu/chetty/value_added.pdf 47 Clotfelter, C., Ladd, H., & Vigdor, J. (2005). Who teaches whom? Race and the distribution of novice teachers.
Economics of Education Review, 24(4), 377-392; Rivkin, Hanushek, & Kain, (2005). 48 See, for example, Lankford, H., Loeb, S., & Wyckoff, J. (2002). Teacher sorting and the plight of urban schools:
A descriptive analysis. Educational Evaluation and Policy Analysis, 24(1), 37-62; Watson, S. (2001), Recruiting
and retaining teachers: Keys to improving the Philadelphia public schools. Philadelphia: Consortium for Policy
Research in Education. In addition, one research study found that in California schools, the share of unqualified
teachers is 6.75 times higher in high-minority schools (more than 90% minority) than in low-minority schools (less
than 30% minority). See Darling-Hammond, L. (2001). Apartheid in American education: How opportunity is
rationed to children of color in the United States, In T. Johnson, J. E. Boyden, & W. J. Pittz (Eds.), Racial profiling
and punishment in U.S. public schools (pp. 39-44). Oakland, CA: Applied Research Center.

Connecticut School Integration: Moving Forward as the Northeast Retreats, April 2015
Civil Rights Project/Proyecto Derechos Civiles
38
Findings show that the academic performance of classmates is strongly linked to
educational outcomes for poor students date back to the famous 1966 Coleman Report
commissioned by the U.S. Congress. The central conclusion of that report (as well as numerous
follow-up analyses) was that the concentration of poverty in a school influenced student
achievement more than the poverty status of an individual student which was also important. 49
This finding is related to whether or not high academic achievement, homework completion,
regular attendance, and college-going are normalized by peers.50 Schools serving low-income
and segregated neighborhoods have been shown to provide less challenging curricula than
schools in more affluent communities that largely serve populations of white and Asian students.
51 High stakes testing has hurt minority-segregated schools producing a focus on rote skills and
test taking strategies, in many instances, takes the place of creative, engaging teaching.52 By
contrast, students in middle-class schools normally have little trouble with high-stakes exams, so
the schools and teachers are free to broaden the curriculum. Segregated school settings are also
significantly less likely than more affluent settings to offer AP- or honors-level courses.53
Additional findings on expulsion rates, dropout rates, success in college, test scores, and
graduation rates underscore the negative impact of segregation. Student discipline is harsher and
the rate of expulsion is much higher in minority-segregated schools than in wealthier, whiter
ones.54 Dropout rates are significantly higher in segregated and impoverished schools (nearly all
of the 2,000 “dropout factories” are doubly segregated by race and poverty),55 and if students do
graduate, research indicates that they are less likely to be successful in college, even after
49 Borman, G., & Dowling, M. (2010). Schools and inequality: A multilevel analysis of Coleman’s equality of
educational opportunity data. Teachers College Record, 112(5), 1201-1246. 50 Kahlenberg, R. (2001). All together now: Creating middle class schools through public school choice.
Washington, DC: Brookings Institution Press. 51 Rumberger, R. W., & Palardy, G. J. (2005). Does segregation still matter? The impact of student composition on
academic achievement in high school. Teachers College Record, 107(9), 1999-2045; Hoxby, C. M. (2000). Peer
effects in the classroom: Learning from gender and race variation (NBER Working Paper No. 7867). Cambridge:
National Bureau of Economic Research; Schofield, J. W. (2006). Ability grouping, composition effects, and the
achievement gap. In J. W. Schofield (Ed.), Migration background, minority-group membership and academic
achievement research evidence from social, educational, and development psychology (pp. 67-95). Berlin: Social
Science Research Center. 52 Knaus, C. (2007). Still segregated, still unequal: Analyzing the impact of No Child Left Behind on African-
American students. In The National Urban League (Ed.), The state of Black America: Portrait of the Black male (pp.
105-121). Silver Spring, MD: Beckham Publications Group. 53 Orfield, G., & Eaton, S. E. (1996). Dismantling desegregation: The quiet reversal of Brown v. Board of
Education. New York: The New Press; Orfield, G., & Lee, C. (2005). Why segregation matters: Poverty and
educational inequality. Cambridge, MA: Civil Rights Project. 54 Exposure to draconian, “zero tolerance” discipline measures is linked to dropping out of school and subsequent
entanglement with the criminal justice system, a very different trajectory than attending college and developing a
career. Advancement Project & The Civil Rights Project (2000). Opportunities suspended: The devastating
consequences of zero tolerance and school discipline policies. Cambridge, MA: Civil Rights Project. Retrieved from
http://civilrightsproject.ucla.edu/research/k-12-education/school-discipline/opportunities-suspended-the-devastating-
consequences-of-zero-tolerance-and-school-discipline-policies/. 55 Balfanz, R., & Legters, N. E. (2004). Locating the dropout crisis: Which high schools produce the nation’s
dropouts? In G. Orfield (Ed.), Dropouts in America: Confronting the graduation rate crisis (pp. 57-84). Cambridge:
Harvard Education Press, 2004; Swanson, C. (2004). Sketching a portrait of public high school graduation: Who
graduates? Who doesn’t? In G. Orfield, (Ed.), Dropouts in America: Confronting the graduation rate crisis (pp. 13-
40). Cambridge, MA: Harvard Education Press.

Connecticut School Integration: Moving Forward as the Northeast Retreats, April 2015
Civil Rights Project/Proyecto Derechos Civiles
39
controlling for test scores.56 Segregation, in short, has strong and lasting impacts.57 Desegregated
schools are linked to providing students of all races with the opportunity to learn and work with
children from a range of backgrounds. These settings foster critical thinking skills that are
increasingly important in our multiracial society—skills that help students understand a variety
of different perspectives.58 Relatedly, integrated schools are linked to reduction in stereotypes.59
Students attending integrated schools also report a heightened ability to communicate and make
friends across racial lines.60 Desegregated settings are associated with heightened academic
achievement for minority students,61 with no corresponding detrimental impact for white
students.62 Black students who attended desegregated schools are substantially more likely to
graduate from high school and college, in part because they are more connected to challenging
curriculum and social networks that support such goals.63 Earnings and physical well-being are
also positively impacted: a recent study by a Berkeley economist found that black students who
attended desegregated schools for at least five years earned 25% more than their counterparts in
segregated settings. By middle age, the same group was also in far better health.64 Perhaps most
important of all, evidence indicates that school desegregation can have perpetuating effects
across generations. Students of all races who attended integrated schools are more likely to seek
56 Camburn, E. (1990). College completion among students from high schools located in large metropolitan areas.
American Journal of Education, 98(4), 551-569.
57 Wells, A. S., & Crain, R. L. (1994). Perpetuation theory and the long-term effects of school desegregation.
Review of Educational Research, 64, 531-555; Braddock, J. H., & McPartland, J. (1989). Social-psychological
processes that perpetuate racial segregation: The relationship between school and employment segregation. Journal
of Black Studies, 19(3), 267-289.
58 Schofield, J. (1995). Review of research on school desegregation's impact on elementary and secondary school
students. In J. A. Banks & C. A. M. Banks (Eds.), Handbook of multicultural education (pp. 597–616). New York:
Macmillan Publishing.
59 Mickelson, R., & Bottia, M. (2010). Integrated education and mathematics outcomes: A synthesis of social
science research. North Carolina Law Review, 88, 993; Pettigrew, T., & Tropp, L. (2006). A meta-analytic test of
intergroup contact theory. Journal of Personality and Social Psychology, 90(5), 751-783; Ready, D., & Silander, M.
(2011). School racial and ethnic composition and young children’s cognitive development: Isolating family,
neighborhood and school influences. In E. Frankenberg & E. DeBray (Eds.), Integrating schools in a changing
society: New policies and legal options for a multiracial generation (pp. 91-113). Chapel Hill, NC: The University of
North Carolina Press.
60 Killen, M., Crystal, D., & Ruck, M (2007). The social developmental benefits of intergroup contact among
children and adolescents. In E. Frankenberg & G. Orfield (Eds.), Lessons in integration: Realizing the promise of
racial diversity in American schools (pp. 31-56). Charlottesville, VA: University of Virginia Press.
61 Braddock, J. (2009). Looking back: The effects of court-ordered desegregation. In C. Smrekar & E. Goldring
(Eds.), From the courtroom to the classroom: The shifting landscape of school desegregation (pp. 3-18). Cambridge,
MA: Harvard Education Press; Crain, R., & Mahard, R. (1983). The effect of research methodology on
desegregation-achievement studies: A meta-analysis. American Journal of Sociology, 88(5), 839-854; Schofield, J.
(1995). Review of research on school desegregation's impact on elementary and secondary school students. In J. A.
Banks & C. A. M. Banks (Eds.), Handbook of multicultural education (pp. 597–616). New York: Macmillan
Publishing.
62 Hochschild, J., & Scrovronick, N. (2004). The American dream and the public schools. New York: Oxford
University Press.
63 Guryan, J. (2004). Desegregation and Black dropout rates. The American Economic Review 94(4), 919-943;
Kaufman, J. E., & Rosenbaum, J. (1992). The education and employment of low-income black youth in white
suburbs. Education Evaluation and Policy Analysis,vol.14, 229-240. 64 Johnson, R. C., & Schoeni, R. (2011). The influence of early-life events on human capital, health status, and labor
market outcomes over the life course. The B.E. Journal of Economic Analysis & Policy Advances, 11(3), 1-55.
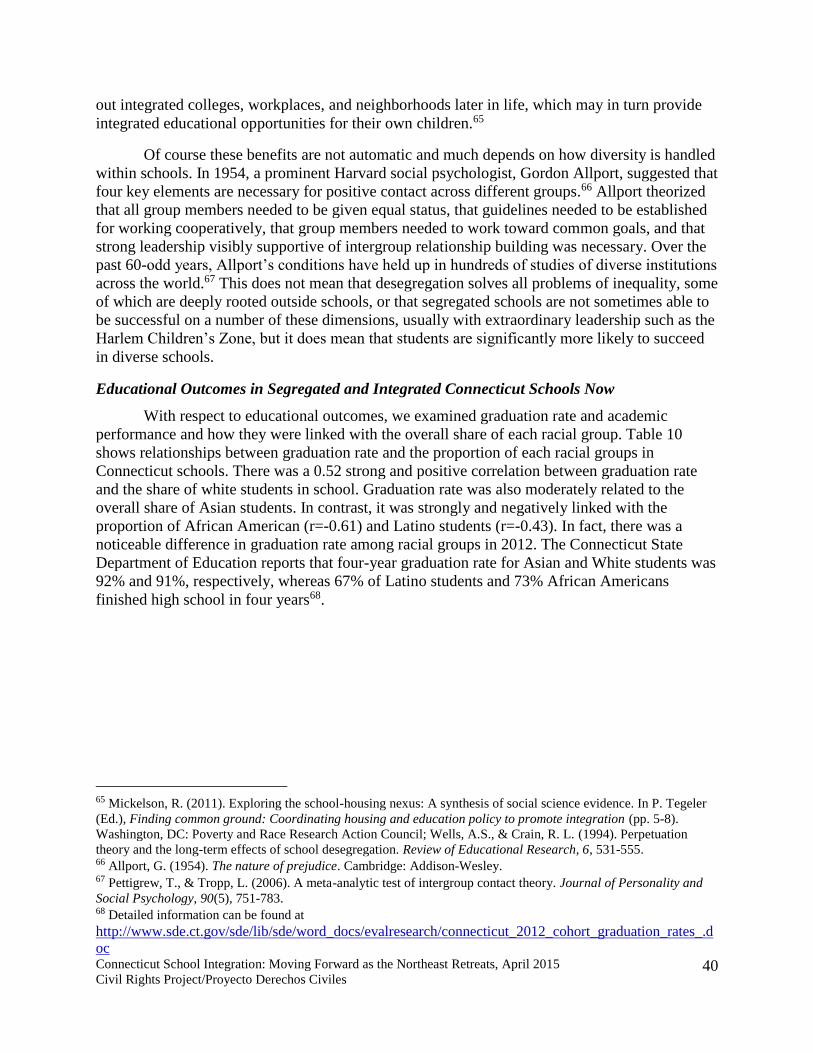
Connecticut School Integration: Moving Forward as the Northeast Retreats, April 2015
Civil Rights Project/Proyecto Derechos Civiles
40
out integrated colleges, workplaces, and neighborhoods later in life, which may in turn provide
integrated educational opportunities for their own children.65
Of course these benefits are not automatic and much depends on how diversity is handled
within schools. In 1954, a prominent Harvard social psychologist, Gordon Allport, suggested that
four key elements are necessary for positive contact across different groups.66 Allport theorized
that all group members needed to be given equal status, that guidelines needed to be established
for working cooperatively, that group members needed to work toward common goals, and that
strong leadership visibly supportive of intergroup relationship building was necessary. Over the
past 60-odd years, Allport’s conditions have held up in hundreds of studies of diverse institutions
across the world.67 This does not mean that desegregation solves all problems of inequality, some
of which are deeply rooted outside schools, or that segregated schools are not sometimes able to
be successful on a number of these dimensions, usually with extraordinary leadership such as the
Harlem Children’s Zone, but it does mean that students are significantly more likely to succeed
in diverse schools.
Educational Outcomes in Segregated and Integrated Connecticut Schools Now
With respect to educational outcomes, we examined graduation rate and academic
performance and how they were linked with the overall share of each racial group. Table 10
shows relationships between graduation rate and the proportion of each racial groups in
Connecticut schools. There was a 0.52 strong and positive correlation between graduation rate
and the share of white students in school. Graduation rate was also moderately related to the
overall share of Asian students. In contrast, it was strongly and negatively linked with the
proportion of African American (r=-0.61) and Latino students (r=-0.43). In fact, there was a
noticeable difference in graduation rate among racial groups in 2012. The Connecticut State
Department of Education reports that four-year graduation rate for Asian and White students was
92% and 91%, respectively, whereas 67% of Latino students and 73% African Americans
finished high school in four years68.
65 Mickelson, R. (2011). Exploring the school-housing nexus: A synthesis of social science evidence. In P. Tegeler
(Ed.), Finding common ground: Coordinating housing and education policy to promote integration (pp. 5-8).
Washington, DC: Poverty and Race Research Action Council; Wells, A.S., & Crain, R. L. (1994). Perpetuation
theory and the long-term effects of school desegregation. Review of Educational Research, 6, 531-555. 66 Allport, G. (1954). The nature of prejudice. Cambridge: Addison-Wesley. 67 Pettigrew, T., & Tropp, L. (2006). A meta-analytic test of intergroup contact theory. Journal of Personality and
Social Psychology, 90(5), 751-783. 68 Detailed information can be found at
http://www.sde.ct.gov/sde/lib/sde/word_docs/evalresearch/connecticut_2012_cohort_graduation_rates_.d
oc

Connecticut School Integration: Moving Forward as the Northeast Retreats, April 2015
Civil Rights Project/Proyecto Derechos Civiles
41
Table 10: Pairwise Correlation between Graduation Rates and the Share of Each Racial Group
Graduation Rate % White % Asian % Black % Latino % AI
Graduation Rate 1.00
% White 0.52 1.00
% Asian 0.28 -0.01 1.00
% Black -0.61 -0.80 -0.24 1.00
% Latino -0.43 -0.87 -0.17 0.36 1.00 % AI 0.12 -0.02 0.02 -0.08 -0.01 1.00
Source: Connecticut State Department of Education 2012-2013 Enrollment and Graduation Rates Data
Notes: All pairwise correlation results were significant at the p=0.05 level. AI=American Indian
In addition, students’ academic performance was investigated by employing Connecticut
Academic Performance Test (CAPT) and Connecticut Mastery Test (CMT) results. The overall
academic performance was highly and strongly associated with the white share and was
moderately linked with the proportion of Asian students. However, it was related to the share of
African American (r=-0.38), Latino (r=-0.61), and American Indian (r=-0.34) students, and this
shows the achievement gap between the white and Asian group and the black, Latino, and
American Indian group, which we investigated in the previous section.
Table 11: Pairwise Correlation between Academic Performance and the Share of Each Racial
Group
Academic
Performance % White % Asian % Black % Latino % AI
Academic
Performance 1.00
% White 0.63 1.00
% Asian 0.28 -0.08 1.00
% Black -0.38 -0.89 -0.23 1.00
% Latino -0.61 -0.88 -0.05 0.50 1.00
% AI -0.34 -0.02 0.12 -0.08 -0.06 1.00
Sources: Connecticut State Department of Education 2012-2013 Connecticut Academic Performance Test (CAPT)
and Connecticut Mastery Test (CMT) Data for students in grades 3, 4, 5, 6, 7, 8, and 10 and Enrollment Data.
Notes: All pairwise correlation results were significant at the p=0.05 level. Composite scores were used to examine
academic performance. AI=American Indian
Racial Composition in Magnet Schools
The state’s effort to integrate can be also found in magnet schools. In less than 10 years,
the number of magnet schools in Connecticut increased by 50%, and the number of students
enrolled in magnet schools also increased by over 70%. In comparison to non-magnet schools,
magnet schools have a fairly distributed number of students from white, African American, and
Latino students, and this shows great potential of fostering integration in the state (see Table 12).

Connecticut School Integration: Moving Forward as the Northeast Retreats, April 2015
Civil Rights Project/Proyecto Derechos Civiles
42
Table 12: Magnet and Non-Magnet Schools in Connecticut, 2007-2013
School
Year Magnet
Number
of Schools Enrollment White Black Asian Latino AI Mixed
2007-08 Magnet 44 18,014 29.0% 41.4% 2.6% 26.5% 0.5% 2012-13 Magnet 66 30,858 30.2% 31.4% 4.4% 30.5% 0.4% 3.0% 2007-08 Non-Magnet 975 533,407 67.0% 12.6% 4.1% 16.0% 0.4% 2012-13 Non-Magnet 969 503,655 61.7% 11.6% 4.8% 19.5% 0.3% 2.1%
Source: U.S. Department of Education, National Center for Education Statistics, Common Core of Data (CCD),
Public Elementary/Secondary School Universe Survey Data
In addition to racial composition in magnet schools, we also examined students’ overall
contact with other groups by looking at exposure rates to a certain group of students by racial
groups. As Table 13 shows, students in magnet schools were very likely to have more diverse
experiences compared to their counterparts in non-magnet schools. For example, the overall
white share in magnet schools was 30%, and the typical student of each racial group had a
similar proportion of white classmates, which was between 27% and 34%. In contrast, there
were, on average, 62% white students in non-magnet schools, and the typical student of each
racial group attended schools where the white share was between 29% and 76%. There was a
similar pattern for blacks in magnet and non-magnet schools. Magnet schools, on average, had
nearly 31% blacks, and this figure was by far higher than the overall black share in non-magnet
schools (12%). Exposure rates to African American students by the typical student in magnet
schools ranged from 28% to 38%; each racial group had one-third of their classmates who were
black. In non-magnet schools, however, black and Latino students tended to have more African
American classmates, whereas whites and Asians were likely to attend schools where there were
less black students.
With regard to exposure to students living in poverty, magnet schools had a higher
percentage of low-income students (56%) in comparison to non-magnet schools (35%).
However, the typical student of each racial group in magnet schools had a similar proportion of
poor classmates; roughly over half of their classmates were from low-income families. In
contrast, the exposure rates to poor students by the typical student in non-magnet schools varied
from 21% to 62%. Black and Latino students were more likely to attend schools that had more
poor students, while white and Asian students tended to have less classmates living in poverty
(see Table 13). In brief, although magnet schools comprised a small proportion of Connecticut’s
public schools, they showed great potential of integration and possibilities of diverse experiences
of each racial group.
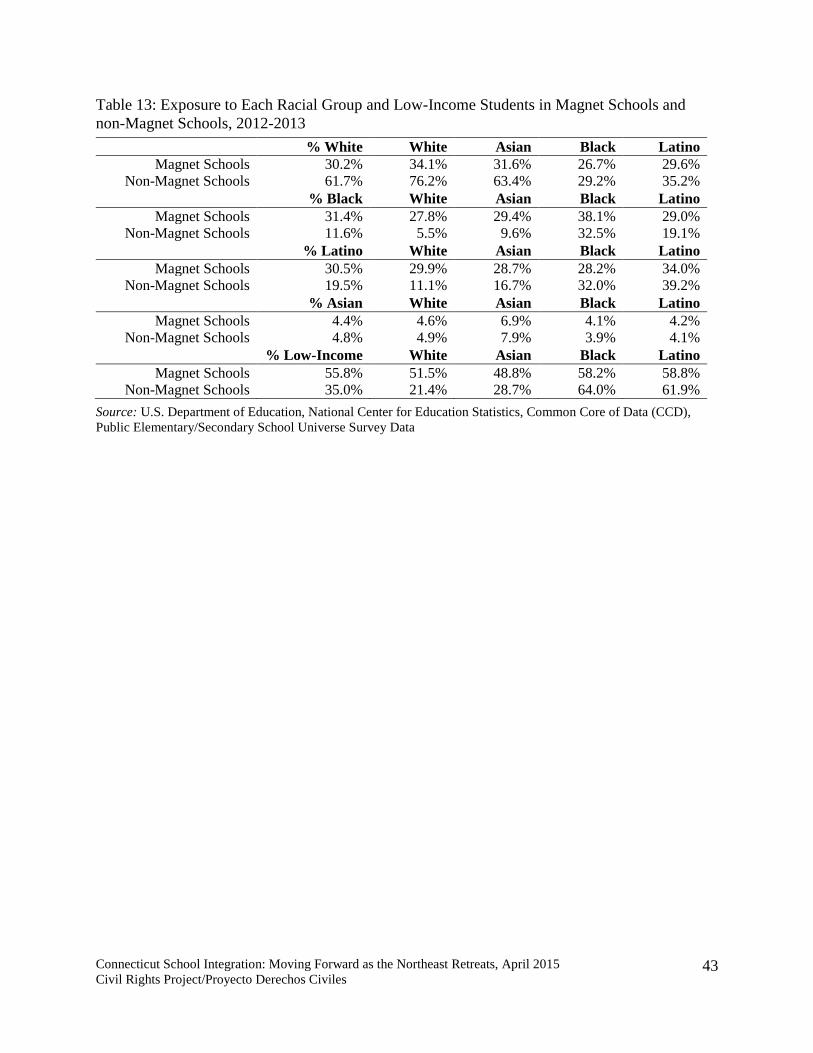
Connecticut School Integration: Moving Forward as the Northeast Retreats, April 2015
Civil Rights Project/Proyecto Derechos Civiles
43
Table 13: Exposure to Each Racial Group and Low-Income Students in Magnet Schools and
non-Magnet Schools, 2012-2013
% White White Asian Black Latino Magnet Schools 30.2% 34.1% 31.6% 26.7% 29.6%
Non-Magnet Schools 61.7% 76.2% 63.4% 29.2% 35.2% % Black White Asian Black Latino
Magnet Schools 31.4% 27.8% 29.4% 38.1% 29.0% Non-Magnet Schools 11.6% 5.5% 9.6% 32.5% 19.1%
% Latino White Asian Black Latino Magnet Schools 30.5% 29.9% 28.7% 28.2% 34.0%
Non-Magnet Schools 19.5% 11.1% 16.7% 32.0% 39.2% % Asian White Asian Black Latino
Magnet Schools 4.4% 4.6% 6.9% 4.1% 4.2% Non-Magnet Schools 4.8% 4.9% 7.9% 3.9% 4.1%
% Low-Income White Asian Black Latino Magnet Schools 55.8% 51.5% 48.8% 58.2% 58.8%
Non-Magnet Schools 35.0% 21.4% 28.7% 64.0% 61.9%
Source: U.S. Department of Education, National Center for Education Statistics, Common Core of Data (CCD),
Public Elementary/Secondary School Universe Survey Data
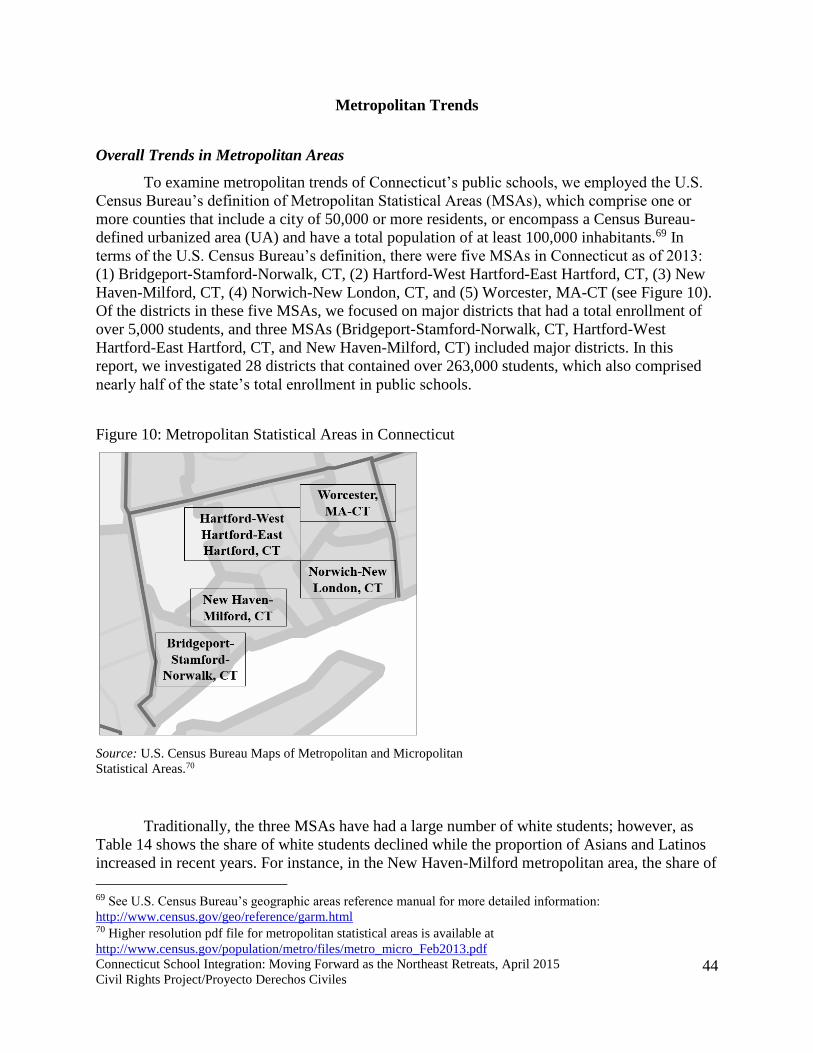
Connecticut School Integration: Moving Forward as the Northeast Retreats, April 2015
Civil Rights Project/Proyecto Derechos Civiles
44
Metropolitan Trends
Overall Trends in Metropolitan Areas
To examine metropolitan trends of Connecticut’s public schools, we employed the U.S.
Census Bureau’s definition of Metropolitan Statistical Areas (MSAs), which comprise one or
more counties that include a city of 50,000 or more residents, or encompass a Census Bureau-
defined urbanized area (UA) and have a total population of at least 100,000 inhabitants.69 In
terms of the U.S. Census Bureau’s definition, there were five MSAs in Connecticut as of 2013:
(1) Bridgeport-Stamford-Norwalk, CT, (2) Hartford-West Hartford-East Hartford, CT, (3) New
Haven-Milford, CT, (4) Norwich-New London, CT, and (5) Worcester, MA-CT (see Figure 10).
Of the districts in these five MSAs, we focused on major districts that had a total enrollment of
over 5,000 students, and three MSAs (Bridgeport-Stamford-Norwalk, CT, Hartford-West
Hartford-East Hartford, CT, and New Haven-Milford, CT) included major districts. In this
report, we investigated 28 districts that contained over 263,000 students, which also comprised
nearly half of the state’s total enrollment in public schools.
Figure 10: Metropolitan Statistical Areas in Connecticut
Source: U.S. Census Bureau Maps of Metropolitan and Micropolitan
Statistical Areas.70
Traditionally, the three MSAs have had a large number of white students; however, as
Table 14 shows the share of white students declined while the proportion of Asians and Latinos
increased in recent years. For instance, in the New Haven-Milford metropolitan area, the share of
69 See U.S. Census Bureau’s geographic areas reference manual for more detailed information:
http://www.census.gov/geo/reference/garm.html 70 Higher resolution pdf file for metropolitan statistical areas is available at
http://www.census.gov/population/metro/files/metro_micro_Feb2013.pdf

Connecticut School Integration: Moving Forward as the Northeast Retreats, April 2015
Civil Rights Project/Proyecto Derechos Civiles
45
whites dropped by 6%, but the Latino share increased by 5% during the same period examined.
In terms of changes in racial composition, the suburbs of these MSAs have become diverse as
well, although suburban schools still had more white students in comparison to the overall
metropolitan schools. For example, Bridgeport-Stamford-Norwalk’s suburban schools had 83%
whites and 8% Latinos in 2012, but in 2007 there were closely 90% whites and 5% Latinos in the
area’s public schools. However, schools in the overall Bridgeport-Stamford-Norwalk area had
more diverse racial composition, including about 60% whites, 13% African Americans, 22%
Latinos, and 5% Asians in 2012 (see Table 14).
Table 14: Public School Enrollment by Race in Metropolitan and Surburban Areas, 2007-2013
Metropolitan Statistical Area, 2007-2008 Enrollment White Black Asian Latino AI
Bridgeport-Stamford-Norwalk, CT 145,582 63.8% 13.4% 4.6% 18.0% 0.2%
Hartford-West Hartford-East Hartford, CT 189,731 64.9% 14.5% 4.1% 16.2% 0.3%
New Haven-Milford, CT 128,691 58.9% 17.8% 3.7% 19.4% 0.2%
Suburban Area, 2007-2008 Enrollment White Black Asian Latino AI
Bridgeport-Stamford-Norwalk, CT 69,906 87.8% 2.0% 4.7% 5.4% 0.1%
Hartford-West Hartford-East Hartford, CT 112,603 73.3% 10.2% 4.5% 11.8% 0.2%
New Haven-Milford, CT 94,171 63.8% 13.3% 3.8% 18.9% 0.3%
Metropolitan Statistical Area, 2012-2013 Enrollment White Black Asian Latino AI Mixed
Bridgeport-Stamford-Norwalk, CT 145,619 58.0% 12.7% 5.4% 22.4% 0.2% 1.4%
Hartford-West Hartford-East Hartford, CT 183,469 59.8% 13.3% 5.2% 18.9% 0.2% 2.6%
New Haven-Milford, CT 124,433 52.6% 17.2% 4.2% 24.2% 0.2% 1.6%
Suburban Area, 2012-2013 Enrollment White Black Asian Latino AI Mixed
Bridgeport-Stamford-Norwalk, CT 72,161 82.6% 2.3% 5.5% 7.9% 0.2% 1.5%
Hartford-West Hartford-East Hartford, CT 108,554 66.3% 10.0% 5.7% 15.3% 0.2% 2.5%
New Haven-Milford, CT 91,867 58.1% 12.3% 4.3% 23.0% 0.3% 2.0%
Source: U.S. Census Bureau Metropolitan and Micropolitan Data and U.S. Department of Education, National
Center for Education Statistics, Common Core of Data (CCD), Public Elementary/Secondary School Universe
Survey Data
Note: AI=American Indian.
When we look at individual major districts in metropolitan areas, however, there was a
considerable difference across the districts. As Table 15 illustrates, the share of white and Asian
enrollment was over 90% in some districts (e.g., Westport, Ridgefield, Newtown, and
Southington) whereas the proportion of African American and Latino enrollment exceeded 80%
in some districts, including Bridgeport, Hartford, East Hartford, and New Haven. In 2012, only a
small number of districts had a fairly balanced group of students from each racial groups (e.g.,
Stamford, Norwalk, Manchester, Meriden, and West Haven), which may relate to the districts’
efforts to integrate and the overall changes of racial composition in the districts.
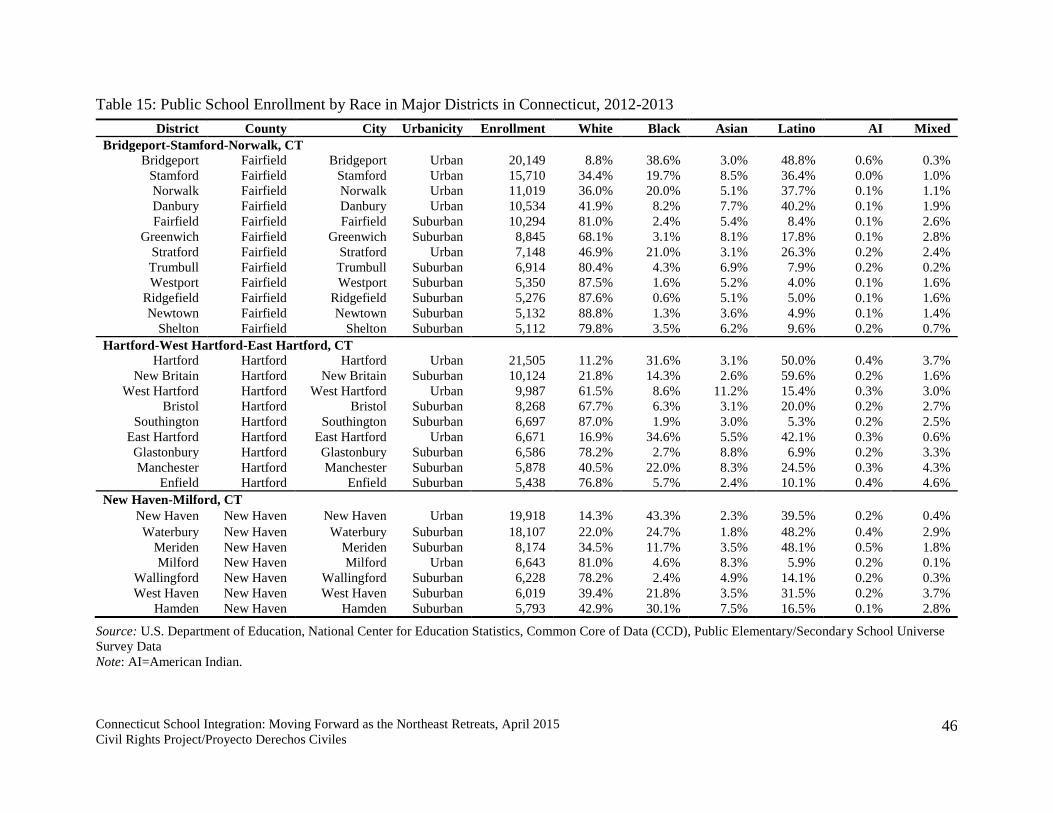
Connecticut School Integration: Moving Forward as the Northeast Retreats, April 2015
Civil Rights Project/Proyecto Derechos Civiles
46
Table 15: Public School Enrollment by Race in Major Districts in Connecticut, 2012-2013
District County City Urbanicity Enrollment White Black Asian Latino AI Mixed
Bridgeport-Stamford-Norwalk, CT
Bridgeport Fairfield Bridgeport Urban 20,149 8.8% 38.6% 3.0% 48.8% 0.6% 0.3%
Stamford Fairfield Stamford Urban 15,710 34.4% 19.7% 8.5% 36.4% 0.0% 1.0%
Norwalk Fairfield Norwalk Urban 11,019 36.0% 20.0% 5.1% 37.7% 0.1% 1.1%
Danbury Fairfield Danbury Urban 10,534 41.9% 8.2% 7.7% 40.2% 0.1% 1.9%
Fairfield Fairfield Fairfield Suburban 10,294 81.0% 2.4% 5.4% 8.4% 0.1% 2.6%
Greenwich Fairfield Greenwich Suburban 8,845 68.1% 3.1% 8.1% 17.8% 0.1% 2.8%
Stratford Fairfield Stratford Urban 7,148 46.9% 21.0% 3.1% 26.3% 0.2% 2.4%
Trumbull Fairfield Trumbull Suburban 6,914 80.4% 4.3% 6.9% 7.9% 0.2% 0.2%
Westport Fairfield Westport Suburban 5,350 87.5% 1.6% 5.2% 4.0% 0.1% 1.6%
Ridgefield Fairfield Ridgefield Suburban 5,276 87.6% 0.6% 5.1% 5.0% 0.1% 1.6%
Newtown Fairfield Newtown Suburban 5,132 88.8% 1.3% 3.6% 4.9% 0.1% 1.4%
Shelton Fairfield Shelton Suburban 5,112 79.8% 3.5% 6.2% 9.6% 0.2% 0.7%
Hartford-West Hartford-East Hartford, CT
Hartford Hartford Hartford Urban 21,505 11.2% 31.6% 3.1% 50.0% 0.4% 3.7%
New Britain Hartford New Britain Suburban 10,124 21.8% 14.3% 2.6% 59.6% 0.2% 1.6%
West Hartford Hartford West Hartford Urban 9,987 61.5% 8.6% 11.2% 15.4% 0.3% 3.0%
Bristol Hartford Bristol Suburban 8,268 67.7% 6.3% 3.1% 20.0% 0.2% 2.7%
Southington Hartford Southington Suburban 6,697 87.0% 1.9% 3.0% 5.3% 0.2% 2.5%
East Hartford Hartford East Hartford Urban 6,671 16.9% 34.6% 5.5% 42.1% 0.3% 0.6%
Glastonbury Hartford Glastonbury Suburban 6,586 78.2% 2.7% 8.8% 6.9% 0.2% 3.3%
Manchester Hartford Manchester Suburban 5,878 40.5% 22.0% 8.3% 24.5% 0.3% 4.3%
Enfield Hartford Enfield Suburban 5,438 76.8% 5.7% 2.4% 10.1% 0.4% 4.6%
New Haven-Milford, CT
New Haven New Haven New Haven Urban 19,918 14.3% 43.3% 2.3% 39.5% 0.2% 0.4%
Waterbury New Haven Waterbury Suburban 18,107 22.0% 24.7% 1.8% 48.2% 0.4% 2.9%
Meriden New Haven Meriden Suburban 8,174 34.5% 11.7% 3.5% 48.1% 0.5% 1.8%
Milford New Haven Milford Urban 6,643 81.0% 4.6% 8.3% 5.9% 0.2% 0.1%
Wallingford New Haven Wallingford Suburban 6,228 78.2% 2.4% 4.9% 14.1% 0.2% 0.3%
West Haven New Haven West Haven Suburban 6,019 39.4% 21.8% 3.5% 31.5% 0.2% 3.7%
Hamden New Haven Hamden Suburban 5,793 42.9% 30.1% 7.5% 16.5% 0.1% 2.8%
Source: U.S. Department of Education, National Center for Education Statistics, Common Core of Data (CCD), Public Elementary/Secondary School Universe
Survey Data
Note: AI=American Indian.

Connecticut School Integration: Moving Forward as the Northeast Retreats, April 2015
Civil Rights Project/Proyecto Derechos Civiles
47
Multiracial and Minority Segregated Schools in Connecticut’s Large Districts
The difference across Connecticut’s major districts in terms of concentration of
minorities can be confirmed in the following table as well. As Table 16 shows, among the state’s
largest school districts there were considerable numbers of multiracial schools, which enroll at
least three different racial groups that comprise over 10% of the total enrollment, respectively.
To illustrate, all schools in the Stamford, Norwalk, Stratford, Manchester and West Haven
districts were multiracial schools, and a substantial number of schools in the New Britain, East
Hartford, Waterbury, and Hamden districts were multiracial schools as well. However, a large
percentage of multiracial schools does not imply that there are no problems of segregation or that
individual schools’ racial composition are well managed or stable, but it clearly shows some
possibilities in an increasingly multiracial society.
At the same time, there was evidence of extreme segregation as well in some districts.
For example, the share of major minority schools where less than 10% whites are enrolled was
two-thirds in the Hartford district, and half of schools in the New Haven district and nearly 60%
of Bridgeport district's schools were 90-100% minority segregated schools. Nevertheless, there
was a positive sign. Regarding apartheid schools in which less than 1% whites are enrolled,
Hartford district was the only district in Connecticut, which had apartheid schools, and the other
large districts did not have any 99-100% minority schools in 2012.

Connecticut School Integration: Moving Forward as the Northeast Retreats, April 2015
Civil Rights Project/Proyecto Derechos Civiles
48
Table 16: Multiracial and Minority Segregated Schools in 2012-2013
District Total
Schools Multiracial
Schools
50-100%
Minority
Schools
90-100%
Minority
Schools
99-100%
Minority
Schools Bridgeport-Stamford-Norwalk, CT
Bridgeport 32 40.6% 100.0% 59.4% Stamford 20 100.0% 100.0%
Norwalk 18 100.0% 88.9%
Danbury 17 23.5% 82.4%
Fairfield 17 11.8%
Greenwich 15 40.0% 13.3%
Stratford 13 100.0% 69.2%
Trumbull 10 10.0%
Westport 8
Ridgefield 9
Newtown 8
Shelton 8 12.5% Hartford-West Hartford-East Hartford, CT
Hartford 47 36.2% 100.0% 66.0% 12.8% New Britain 15 80.0% 100.0% 6.7%
West Hartford 16 50.0% 12.5%
Bristol 12
Southington 11
East Hartford 14 78.6% 100.0% 21.4% Glastonbury 9 11.1%
Manchester 12 100.0% 83.3%
Enfield 11 9.1% New Haven-Milford, CT
New Haven 40 50.0% 95.0% 50.0% Waterbury 29 89.7% 96.6% 10.3%
Meriden 12 58.3% 100.0%
Milford 13
Wallingford 12
West Haven 9 100.0% 66.7%
Hamden 11 81.8% 72.7%
Source: U.S. Department of Education, National Center for Education Statistics, Common Core of Data (CCD),
Public Elementary/Secondary School Universe Survey Data
Note: Blank cells represent no schools or other. Minority school represents black, Latino, American Indian, and
Asian students. Multiracial schools are those with any three races representing 10% or more of the total student
enrollment respectively.
The intersection of poverty level and minority segregated schools shows that the poverty
concentrations were very high in the predominantly minority schools in most Connecticut’s
largest districts that had multiracial schools and minority segregated schools. As Table 17
illustrates, nearly all multiracial schools and minority segregated schools in the Connecticut’s
major districts had similar or higher levels of poor students in comparison to each district’s

Connecticut School Integration: Moving Forward as the Northeast Retreats, April 2015
Civil Rights Project/Proyecto Derechos Civiles
49
overall share of low-income students in 2012. For example, the average share of low-income
students in the Hartford district was 85%, but the district’s apartheid schools where over 99%
minority students attend had 99.1% poor students. However, the most extreme segregation of
minority schools by poverty came in Bridgeport. Virtually all students in the Bridgeport district
came from low-income families, and an extremely high percentage of students in the district’s
multiracial schools and minority segregated schools were poor students as well.
In Connecticut’s large districts, virtually all the black and Latino students are in majority
nonwhite schools (e.g., Bridgeport, Stamford, Norwalk, Hartford, New Britain, East Hartford,
New Haven, etc.). Furthermore, when we look at intensely segregated schools where zero to ten
percent of the students are white, about two-thirds of Latino and black students attended such
schools in Bridgeport, and half of Latinos and blacks in New Haven went to the intensely
segregated schools. In the Hartford district, in particular, nearly three-fourth of Latino students
and two-thirds of black students attended such schools; furthermore, closely 8% of Latinos and
17% of blacks went to extremely segregated schools where zero to one percent of the students
are white (see Table 18).
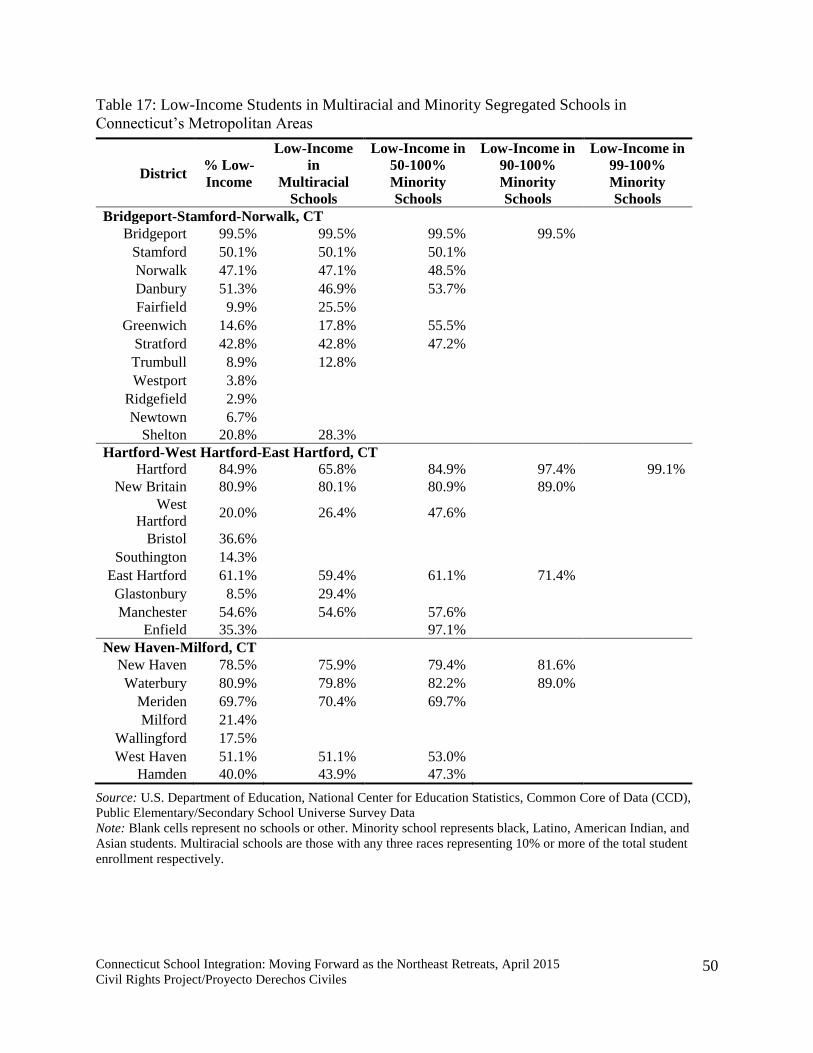
Connecticut School Integration: Moving Forward as the Northeast Retreats, April 2015
Civil Rights Project/Proyecto Derechos Civiles
50
Table 17: Low-Income Students in Multiracial and Minority Segregated Schools in
Connecticut’s Metropolitan Areas
District % Low-
Income
Low-Income
in
Multiracial
Schools
Low-Income in
50-100%
Minority
Schools
Low-Income in
90-100%
Minority
Schools
Low-Income in
99-100%
Minority
Schools Bridgeport-Stamford-Norwalk, CT
Bridgeport 99.5% 99.5% 99.5% 99.5% Stamford 50.1% 50.1% 50.1%
Norwalk 47.1% 47.1% 48.5%
Danbury 51.3% 46.9% 53.7%
Fairfield 9.9% 25.5%
Greenwich 14.6% 17.8% 55.5%
Stratford 42.8% 42.8% 47.2%
Trumbull 8.9% 12.8%
Westport 3.8%
Ridgefield 2.9%
Newtown 6.7%
Shelton 20.8% 28.3% Hartford-West Hartford-East Hartford, CT
Hartford 84.9% 65.8% 84.9% 97.4% 99.1% New Britain 80.9% 80.1% 80.9% 89.0%
West
Hartford 20.0% 26.4% 47.6%
Bristol 36.6%
Southington 14.3%
East Hartford 61.1% 59.4% 61.1% 71.4% Glastonbury 8.5% 29.4%
Manchester 54.6% 54.6% 57.6%
Enfield 35.3% 97.1% New Haven-Milford, CT
New Haven 78.5% 75.9% 79.4% 81.6% Waterbury 80.9% 79.8% 82.2% 89.0%
Meriden 69.7% 70.4% 69.7%
Milford 21.4%
Wallingford 17.5%
West Haven 51.1% 51.1% 53.0%
Hamden 40.0% 43.9% 47.3%
Source: U.S. Department of Education, National Center for Education Statistics, Common Core of Data (CCD),
Public Elementary/Secondary School Universe Survey Data
Note: Blank cells represent no schools or other. Minority school represents black, Latino, American Indian, and
Asian students. Multiracial schools are those with any three races representing 10% or more of the total student
enrollment respectively.
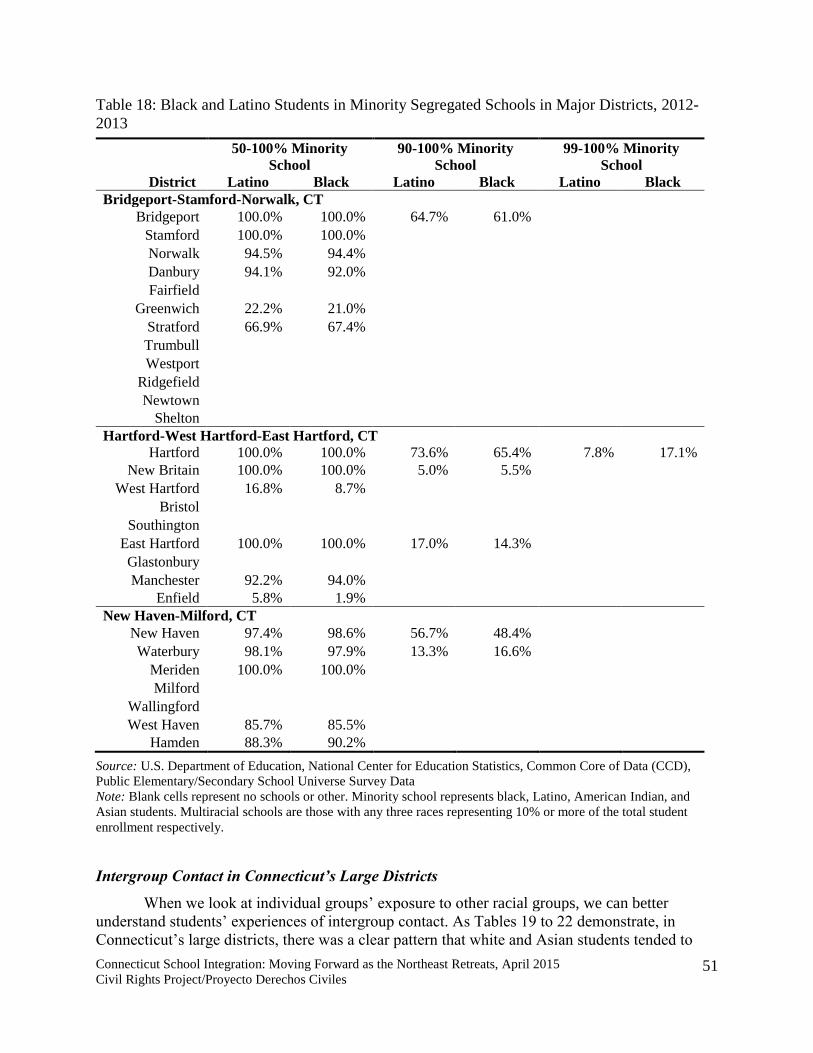
Connecticut School Integration: Moving Forward as the Northeast Retreats, April 2015
Civil Rights Project/Proyecto Derechos Civiles
51
Table 18: Black and Latino Students in Minority Segregated Schools in Major Districts, 2012-
2013
50-100% Minority
School 90-100% Minority
School 99-100% Minority
School District Latino Black Latino Black Latino Black
Bridgeport-Stamford-Norwalk, CT Bridgeport 100.0% 100.0% 64.7% 61.0%
Stamford 100.0% 100.0%
Norwalk 94.5% 94.4%
Danbury 94.1% 92.0%
Fairfield
Greenwich 22.2% 21.0%
Stratford 66.9% 67.4%
Trumbull
Westport
Ridgefield
Newtown
Shelton Hartford-West Hartford-East Hartford, CT
Hartford 100.0% 100.0% 73.6% 65.4% 7.8% 17.1% New Britain 100.0% 100.0% 5.0% 5.5%
West Hartford 16.8% 8.7%
Bristol
Southington
East Hartford 100.0% 100.0% 17.0% 14.3%
Glastonbury
Manchester 92.2% 94.0%
Enfield 5.8% 1.9% New Haven-Milford, CT
New Haven 97.4% 98.6% 56.7% 48.4%
Waterbury 98.1% 97.9% 13.3% 16.6%
Meriden 100.0% 100.0%
Milford
Wallingford
West Haven 85.7% 85.5%
Hamden 88.3% 90.2%
Source: U.S. Department of Education, National Center for Education Statistics, Common Core of Data (CCD),
Public Elementary/Secondary School Universe Survey Data
Note: Blank cells represent no schools or other. Minority school represents black, Latino, American Indian, and
Asian students. Multiracial schools are those with any three races representing 10% or more of the total student
enrollment respectively.
Intergroup Contact in Connecticut’s Large Districts
When we look at individual groups’ exposure to other racial groups, we can better
understand students’ experiences of intergroup contact. As Tables 19 to 22 demonstrate, in
Connecticut’s large districts, there was a clear pattern that white and Asian students tended to

Connecticut School Integration: Moving Forward as the Northeast Retreats, April 2015
Civil Rights Project/Proyecto Derechos Civiles
52
have more white and Asian classmates and that African American, Latino, and American Indian
students tended to attend schools where students from the same groups were enrolled. However,
in none of the large districts, did whites attend schools that enrolled over 90% white students,
and most whites attended schools with a significant nonwhite majority in 2012. Nonetheless, the
exposure pattern shows that many white students in the state’s major districts were in settings
where they needed to acquire skills and understandings to function effectively in a society that
becomes more multiracial. In addition, the pattern, much more common in the cities of the South
and the West, is coming to more parts of Connecticut.
Additionally, there was a noticeable difference across the districts examined in terms of
racial exposure to each group. Latino students in some districts, in particular, attended school
where more than half of their classmates were from the same group (e.g., Bridgeport, Hartford,
New Haven, and Waterbury). For example, Latinos in the Hartford district’ schools had nearly
60% Latino classmates, which limited their intergroup experiences (see Table 21). African
American students in some districts were in the same situation where blacks had over 40% of
classmates from the same group. For instance, African American students in the New Haven
district attended schools where more than half of their classmates were blacks, which was much
higher than the overall black share of the district (43%), and a similar pattern was found in other
districts, including Bridgeport and Hartford (see Table 20).
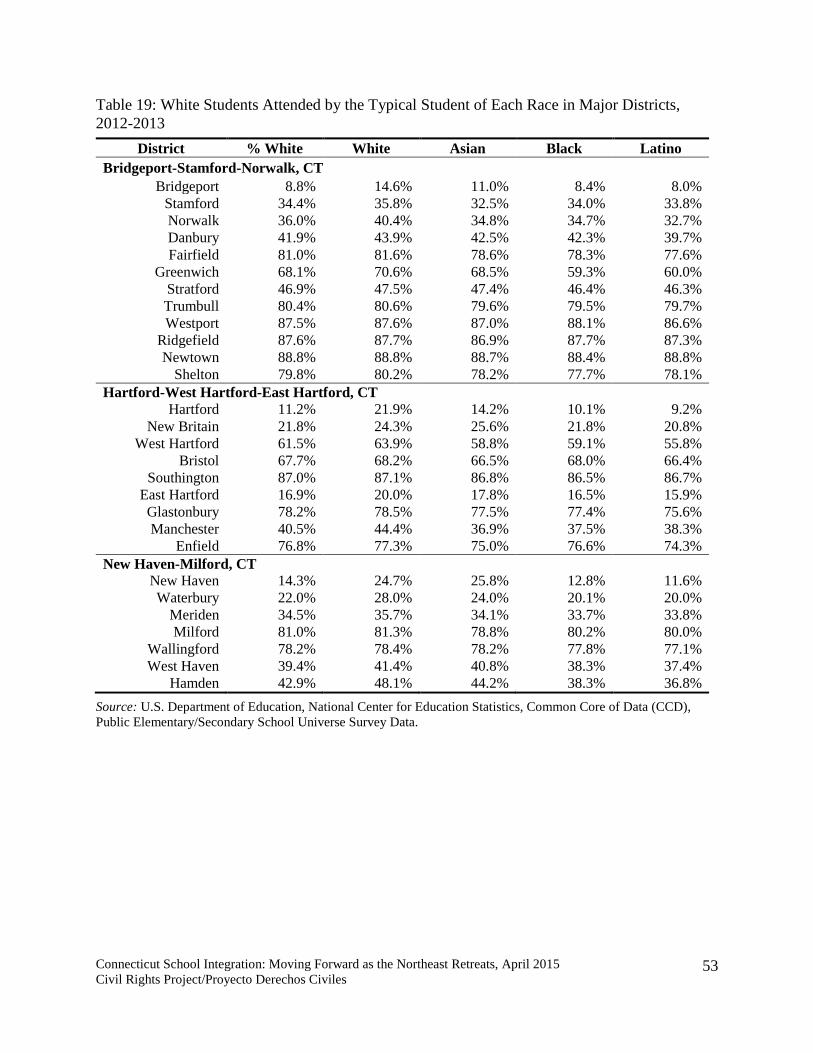
Connecticut School Integration: Moving Forward as the Northeast Retreats, April 2015
Civil Rights Project/Proyecto Derechos Civiles
53
Table 19: White Students Attended by the Typical Student of Each Race in Major Districts,
2012-2013
District % White White Asian Black Latino
Bridgeport-Stamford-Norwalk, CT
Bridgeport 8.8% 14.6% 11.0% 8.4% 8.0% Stamford 34.4% 35.8% 32.5% 34.0% 33.8% Norwalk 36.0% 40.4% 34.8% 34.7% 32.7% Danbury 41.9% 43.9% 42.5% 42.3% 39.7% Fairfield 81.0% 81.6% 78.6% 78.3% 77.6%
Greenwich 68.1% 70.6% 68.5% 59.3% 60.0% Stratford 46.9% 47.5% 47.4% 46.4% 46.3% Trumbull 80.4% 80.6% 79.6% 79.5% 79.7% Westport 87.5% 87.6% 87.0% 88.1% 86.6%
Ridgefield 87.6% 87.7% 86.9% 87.7% 87.3% Newtown 88.8% 88.8% 88.7% 88.4% 88.8%
Shelton 79.8% 80.2% 78.2% 77.7% 78.1% Hartford-West Hartford-East Hartford, CT
Hartford 11.2% 21.9% 14.2% 10.1% 9.2% New Britain 21.8% 24.3% 25.6% 21.8% 20.8%
West Hartford 61.5% 63.9% 58.8% 59.1% 55.8% Bristol 67.7% 68.2% 66.5% 68.0% 66.4%
Southington 87.0% 87.1% 86.8% 86.5% 86.7% East Hartford 16.9% 20.0% 17.8% 16.5% 15.9% Glastonbury 78.2% 78.5% 77.5% 77.4% 75.6% Manchester 40.5% 44.4% 36.9% 37.5% 38.3%
Enfield 76.8% 77.3% 75.0% 76.6% 74.3% New Haven-Milford, CT
New Haven 14.3% 24.7% 25.8% 12.8% 11.6% Waterbury 22.0% 28.0% 24.0% 20.1% 20.0%
Meriden 34.5% 35.7% 34.1% 33.7% 33.8% Milford 81.0% 81.3% 78.8% 80.2% 80.0%
Wallingford 78.2% 78.4% 78.2% 77.8% 77.1% West Haven 39.4% 41.4% 40.8% 38.3% 37.4%
Hamden 42.9% 48.1% 44.2% 38.3% 36.8%
Source: U.S. Department of Education, National Center for Education Statistics, Common Core of Data (CCD),
Public Elementary/Secondary School Universe Survey Data.
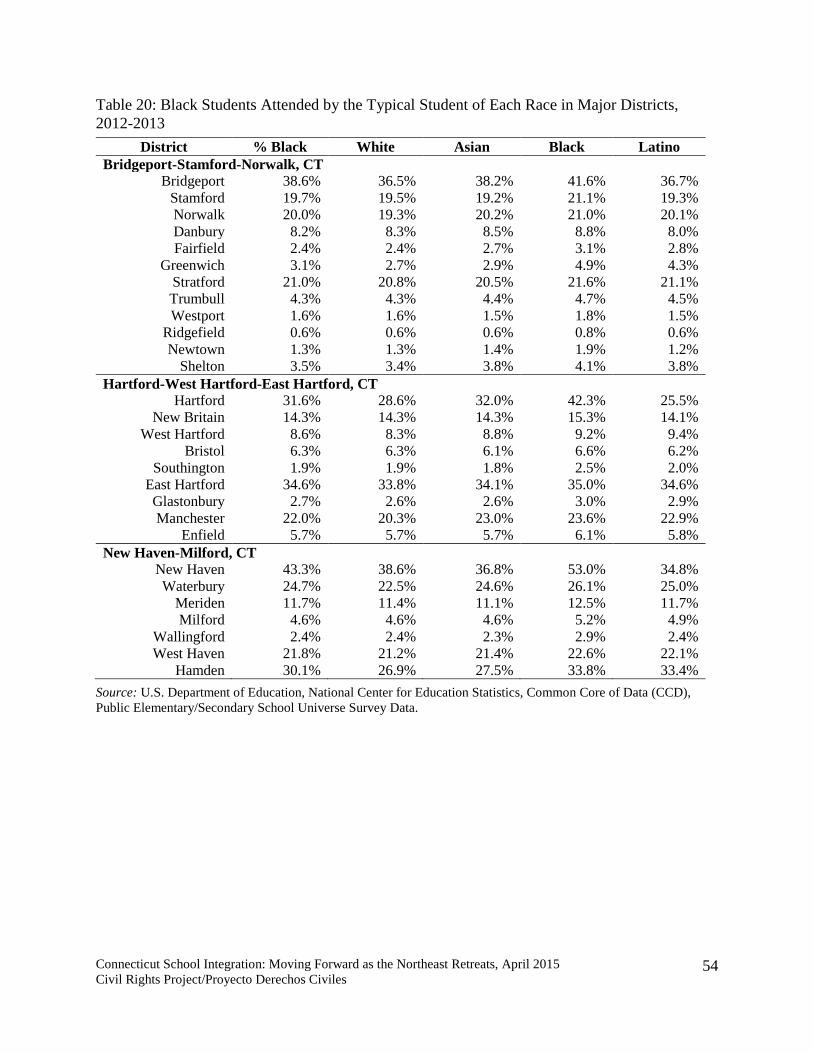
Connecticut School Integration: Moving Forward as the Northeast Retreats, April 2015
Civil Rights Project/Proyecto Derechos Civiles
54
Table 20: Black Students Attended by the Typical Student of Each Race in Major Districts,
2012-2013
District % Black White Asian Black Latino Bridgeport-Stamford-Norwalk, CT
Bridgeport 38.6% 36.5% 38.2% 41.6% 36.7% Stamford 19.7% 19.5% 19.2% 21.1% 19.3% Norwalk 20.0% 19.3% 20.2% 21.0% 20.1% Danbury 8.2% 8.3% 8.5% 8.8% 8.0% Fairfield 2.4% 2.4% 2.7% 3.1% 2.8%
Greenwich 3.1% 2.7% 2.9% 4.9% 4.3% Stratford 21.0% 20.8% 20.5% 21.6% 21.1% Trumbull 4.3% 4.3% 4.4% 4.7% 4.5% Westport 1.6% 1.6% 1.5% 1.8% 1.5%
Ridgefield 0.6% 0.6% 0.6% 0.8% 0.6% Newtown 1.3% 1.3% 1.4% 1.9% 1.2%
Shelton 3.5% 3.4% 3.8% 4.1% 3.8% Hartford-West Hartford-East Hartford, CT
Hartford 31.6% 28.6% 32.0% 42.3% 25.5% New Britain 14.3% 14.3% 14.3% 15.3% 14.1%
West Hartford 8.6% 8.3% 8.8% 9.2% 9.4% Bristol 6.3% 6.3% 6.1% 6.6% 6.2%
Southington 1.9% 1.9% 1.8% 2.5% 2.0% East Hartford 34.6% 33.8% 34.1% 35.0% 34.6% Glastonbury 2.7% 2.6% 2.6% 3.0% 2.9% Manchester 22.0% 20.3% 23.0% 23.6% 22.9%
Enfield 5.7% 5.7% 5.7% 6.1% 5.8% New Haven-Milford, CT
New Haven 43.3% 38.6% 36.8% 53.0% 34.8% Waterbury 24.7% 22.5% 24.6% 26.1% 25.0%
Meriden 11.7% 11.4% 11.1% 12.5% 11.7% Milford 4.6% 4.6% 4.6% 5.2% 4.9%
Wallingford 2.4% 2.4% 2.3% 2.9% 2.4% West Haven 21.8% 21.2% 21.4% 22.6% 22.1%
Hamden 30.1% 26.9% 27.5% 33.8% 33.4%
Source: U.S. Department of Education, National Center for Education Statistics, Common Core of Data (CCD),
Public Elementary/Secondary School Universe Survey Data.
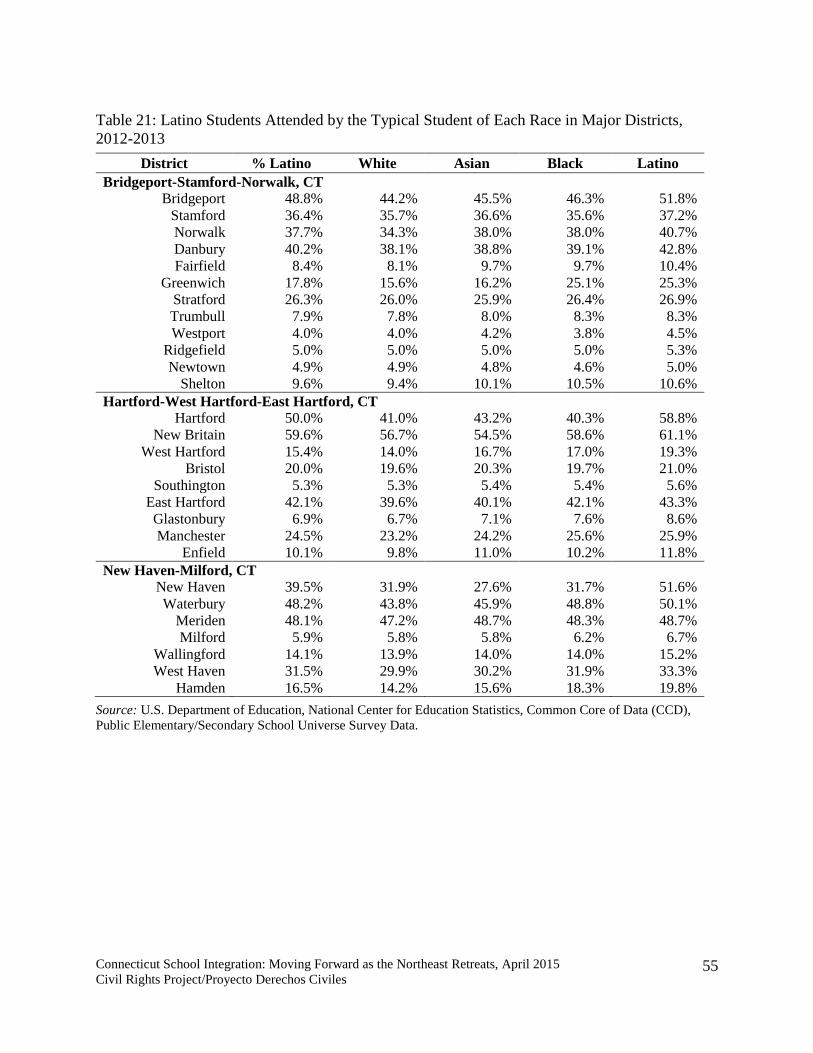
Connecticut School Integration: Moving Forward as the Northeast Retreats, April 2015
Civil Rights Project/Proyecto Derechos Civiles
55
Table 21: Latino Students Attended by the Typical Student of Each Race in Major Districts,
2012-2013
District % Latino White Asian Black Latino
Bridgeport-Stamford-Norwalk, CT Bridgeport 48.8% 44.2% 45.5% 46.3% 51.8%
Stamford 36.4% 35.7% 36.6% 35.6% 37.2% Norwalk 37.7% 34.3% 38.0% 38.0% 40.7% Danbury 40.2% 38.1% 38.8% 39.1% 42.8% Fairfield 8.4% 8.1% 9.7% 9.7% 10.4%
Greenwich 17.8% 15.6% 16.2% 25.1% 25.3% Stratford 26.3% 26.0% 25.9% 26.4% 26.9% Trumbull 7.9% 7.8% 8.0% 8.3% 8.3% Westport 4.0% 4.0% 4.2% 3.8% 4.5%
Ridgefield 5.0% 5.0% 5.0% 5.0% 5.3% Newtown 4.9% 4.9% 4.8% 4.6% 5.0%
Shelton 9.6% 9.4% 10.1% 10.5% 10.6% Hartford-West Hartford-East Hartford, CT
Hartford 50.0% 41.0% 43.2% 40.3% 58.8% New Britain 59.6% 56.7% 54.5% 58.6% 61.1%
West Hartford 15.4% 14.0% 16.7% 17.0% 19.3% Bristol 20.0% 19.6% 20.3% 19.7% 21.0%
Southington 5.3% 5.3% 5.4% 5.4% 5.6% East Hartford 42.1% 39.6% 40.1% 42.1% 43.3% Glastonbury 6.9% 6.7% 7.1% 7.6% 8.6% Manchester 24.5% 23.2% 24.2% 25.6% 25.9%
Enfield 10.1% 9.8% 11.0% 10.2% 11.8% New Haven-Milford, CT
New Haven 39.5% 31.9% 27.6% 31.7% 51.6% Waterbury 48.2% 43.8% 45.9% 48.8% 50.1%
Meriden 48.1% 47.2% 48.7% 48.3% 48.7% Milford 5.9% 5.8% 5.8% 6.2% 6.7%
Wallingford 14.1% 13.9% 14.0% 14.0% 15.2% West Haven 31.5% 29.9% 30.2% 31.9% 33.3%
Hamden 16.5% 14.2% 15.6% 18.3% 19.8%
Source: U.S. Department of Education, National Center for Education Statistics, Common Core of Data (CCD),
Public Elementary/Secondary School Universe Survey Data.
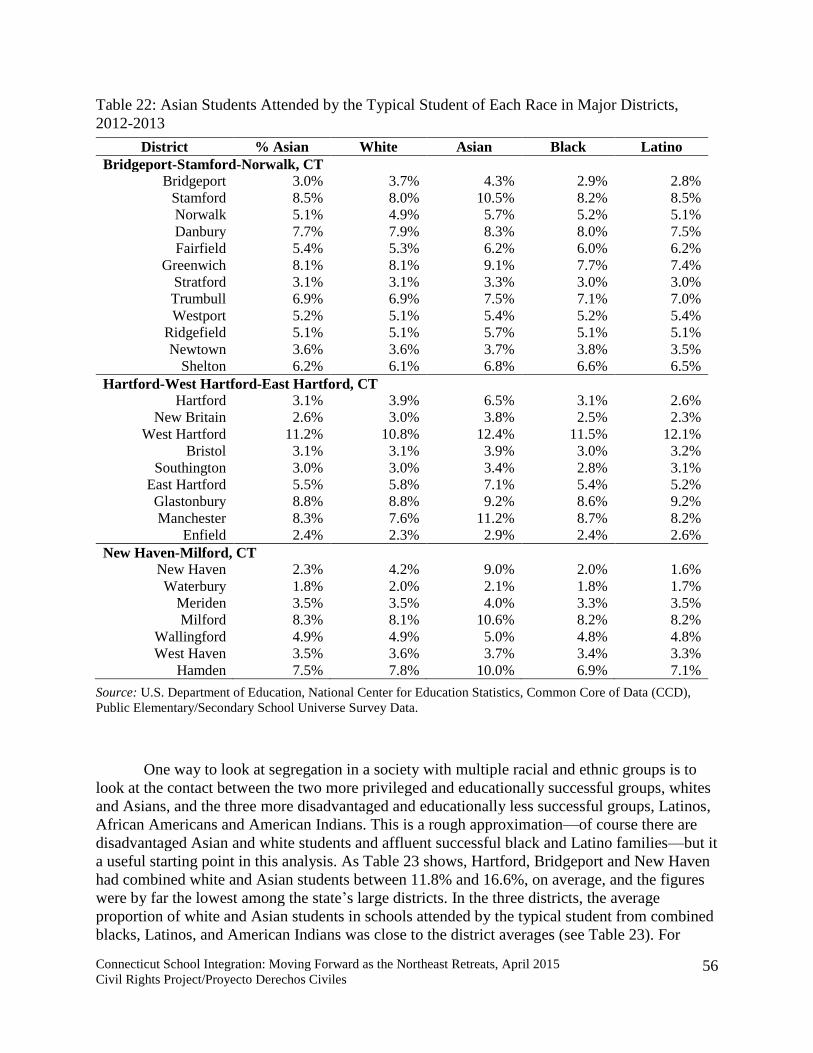
Connecticut School Integration: Moving Forward as the Northeast Retreats, April 2015
Civil Rights Project/Proyecto Derechos Civiles
56
Table 22: Asian Students Attended by the Typical Student of Each Race in Major Districts,
2012-2013
District % Asian White Asian Black Latino Bridgeport-Stamford-Norwalk, CT
Bridgeport 3.0% 3.7% 4.3% 2.9% 2.8% Stamford 8.5% 8.0% 10.5% 8.2% 8.5% Norwalk 5.1% 4.9% 5.7% 5.2% 5.1% Danbury 7.7% 7.9% 8.3% 8.0% 7.5% Fairfield 5.4% 5.3% 6.2% 6.0% 6.2%
Greenwich 8.1% 8.1% 9.1% 7.7% 7.4% Stratford 3.1% 3.1% 3.3% 3.0% 3.0% Trumbull 6.9% 6.9% 7.5% 7.1% 7.0% Westport 5.2% 5.1% 5.4% 5.2% 5.4%
Ridgefield 5.1% 5.1% 5.7% 5.1% 5.1% Newtown 3.6% 3.6% 3.7% 3.8% 3.5%
Shelton 6.2% 6.1% 6.8% 6.6% 6.5% Hartford-West Hartford-East Hartford, CT
Hartford 3.1% 3.9% 6.5% 3.1% 2.6% New Britain 2.6% 3.0% 3.8% 2.5% 2.3%
West Hartford 11.2% 10.8% 12.4% 11.5% 12.1% Bristol 3.1% 3.1% 3.9% 3.0% 3.2%
Southington 3.0% 3.0% 3.4% 2.8% 3.1% East Hartford 5.5% 5.8% 7.1% 5.4% 5.2% Glastonbury 8.8% 8.8% 9.2% 8.6% 9.2% Manchester 8.3% 7.6% 11.2% 8.7% 8.2%
Enfield 2.4% 2.3% 2.9% 2.4% 2.6% New Haven-Milford, CT
New Haven 2.3% 4.2% 9.0% 2.0% 1.6% Waterbury 1.8% 2.0% 2.1% 1.8% 1.7%
Meriden 3.5% 3.5% 4.0% 3.3% 3.5% Milford 8.3% 8.1% 10.6% 8.2% 8.2%
Wallingford 4.9% 4.9% 5.0% 4.8% 4.8% West Haven 3.5% 3.6% 3.7% 3.4% 3.3%
Hamden 7.5% 7.8% 10.0% 6.9% 7.1%
Source: U.S. Department of Education, National Center for Education Statistics, Common Core of Data (CCD),
Public Elementary/Secondary School Universe Survey Data.
One way to look at segregation in a society with multiple racial and ethnic groups is to
look at the contact between the two more privileged and educationally successful groups, whites
and Asians, and the three more disadvantaged and educationally less successful groups, Latinos,
African Americans and American Indians. This is a rough approximation—of course there are
disadvantaged Asian and white students and affluent successful black and Latino families—but it
a useful starting point in this analysis. As Table 23 shows, Hartford, Bridgeport and New Haven
had combined white and Asian students between 11.8% and 16.6%, on average, and the figures
were by far the lowest among the state’s large districts. In the three districts, the average
proportion of white and Asian students in schools attended by the typical student from combined
blacks, Latinos, and American Indians was close to the district averages (see Table 23). For

Connecticut School Integration: Moving Forward as the Northeast Retreats, April 2015
Civil Rights Project/Proyecto Derechos Civiles
57
example, the Bridgeport district had 11.8% white and Asian students, and the typical students
from combined black, Latino, and American Indian group attended a school where 11%
combined white and Asian students were enrolled. This may indicate that the districts were not
concentrating white and Asian students in special privileged schools but, to the contrary, the
schools of the black, Latino, and American Indian students had white and Asian enrollment quite
close to the district average in the great majority of districts.
Furthermore, when we look at the proportion of black, Latino, and American Indian
students in schools attended by the typical student from combined whites and Asians, there was a
similar pattern. The average share of white and Asian students in schools attended by the typical
black, Latino, and American Indian student was very similar to the district’s overall percentage
of white and Asian enrollment. Nevertheless, there were a couple of districts (e.g., Hartford and
New Haven), in which the overall black, Latino, and American Indian proportion in schools
attended by the typical white and Asian student was considerably lower than the overall black,
Latino, and American Indian share of the districts. For instance, the New Haven district had 83%
combined black, Latino, and American Indian students, but the typical white and Asian student
attended schools where 70% of their classmates were from the black, Latino, and American
Indian group (see Table 24).
Considering exposure rates of Connecticut’s large districts, there were extremely
different levels of racial contact within different school districts in the state. However, the
problem did not seem to be caused by segregation within school districts, but it seemed to be the
result of the varying racial composition of individual districts. In other words, segregation in the
state tends to be caused by segregation among districts, not within districts, and this is exactly
what the Connecticut Supreme Court recognized in its initial decision in Sheff v. O’Neill, finding
that the district boundaries were a fundamental cause of the school segregation and a primary
barrier to a remedy without state policies making it possible for students to cross those lines.

Connecticut School Integration: Moving Forward as the Northeast Retreats, April 2015
Civil Rights Project/Proyecto Derechos Civiles
58
Table 23: White/Asian Students Attended by the Typical Student of Each Race in Major
Districts, 2012-2013
District %
White/Asian White Asian
White/ Asian
Black Latino Black/
Latino/AI Bridgeport-Stamford-Norwalk, CT
Bridgeport 11.8% 18.3% 15.3% 17.5% 11.3% 10.8% 11.0% Stamford 42.9% 43.8% 42.9% 43.6% 42.3% 42.3% 42.3% Norwalk 41.1% 45.3% 40.6% 44.7% 39.8% 37.9% 38.5% Danbury 49.6% 51.8% 50.8% 51.6% 50.2% 47.1% 47.7% Fairfield 86.4% 86.9% 84.8% 86.8% 84.2% 83.9% 84.0%
Greenwich 76.2% 78.8% 77.6% 78.6% 67.0% 67.4% 67.4% Stratford 50.0% 50.6% 50.8% 50.6% 49.4% 49.3% 49.4% Trumbull 87.3% 87.4% 87.1% 87.4% 86.6% 86.7% 86.7% Westport 92.7% 92.8% 92.4% 92.8% 93.3% 92.0% 92.4%
Ridgefield 92.7% 92.7% 92.6% 92.7% 92.8% 92.4% 92.4% Newtown 92.4% 92.4% 92.4% 92.4% 92.3% 92.3% 92.3%
Shelton 86.0% 86.3% 85.0% 86.2% 84.4% 84.6% 84.6%
Hartford-West Hartford-East Hartford, CT Hartford 14.3% 25.8% 20.7% 24.7% 13.2% 11.8% 12.4%
New Britain 24.4% 27.3% 29.4% 27.5% 24.3% 23.1% 23.4% West Hartford 72.8% 74.6% 71.2% 74.1% 70.6% 68.0% 68.9%
Bristol 70.8% 71.3% 70.4% 71.3% 71.0% 69.6% 69.9% Southington 90.1% 90.1% 90.2% 90.1% 89.3% 89.8% 89.6%
East Hartford 22.4% 25.8% 24.8% 25.6% 21.9% 21.1% 21.4% Glastonbury 87.0% 87.3% 86.7% 87.2% 86.1% 84.7% 85.2% Manchester 48.8% 52.0% 48.1% 51.3% 46.2% 46.5% 46.4%
Enfield 79.2% 79.7% 77.9% 79.6% 78.9% 77.0% 77.7%
New Haven-Milford, CT New Haven 16.6% 28.8% 34.9% 29.7% 14.7% 13.2% 14.0% Waterbury 23.8% 30.0% 26.1% 29.7% 21.9% 21.7% 21.8%
Meriden 38.0% 39.2% 38.1% 39.1% 37.0% 37.3% 37.3% Milford 89.3% 89.4% 89.4% 89.4% 88.4% 88.2% 88.3%
Wallingford 83.0% 83.3% 83.2% 83.2% 82.6% 81.9% 82.0% West Haven 42.8% 45.0% 44.5% 44.9% 41.7% 40.7% 41.1%
Hamden 50.4% 55.9% 54.2% 55.6% 45.1% 43.9% 44.7%
Source: U.S. Department of Education, National Center for Education Statistics, Common Core of Data (CCD),
Public Elementary/Secondary School Universe Survey Data.
Note: AI=American Indian

Connecticut School Integration: Moving Forward as the Northeast Retreats, April 2015
Civil Rights Project/Proyecto Derechos Civiles
59
Table 24: Black/Latino/AI Students Attended by the Typical Student of Each Race in Major
Districts, 2012-2013
District % Black/ Latino/AI
White Asian White/ Asian
Black Latino Black/
Latino/AI Bridgeport-Stamford-Norwalk, CT
Bridgeport 87.9% 81.4% 84.4% 82.2% 88.4% 89.0% 88.7% Stamford 56.1% 55.3% 55.9% 55.4% 56.8% 56.6% 56.7% Norwalk 57.8% 53.7% 58.3% 54.3% 59.1% 60.9% 60.3% Danbury 48.5% 46.5% 47.3% 46.6% 48.0% 50.8% 50.4% Fairfield 11.0% 10.6% 12.5% 10.7% 13.0% 13.3% 13.2%
Greenwich 21.0% 18.5% 19.3% 18.5% 30.1% 29.8% 29.8% Stratford 47.6% 47.0% 46.6% 46.9% 48.2% 48.2% 48.2% Trumbull 12.4% 12.3% 12.6% 12.3% 13.1% 13.0% 13.1% Westport 5.7% 5.6% 5.9% 5.6% 5.7% 6.0% 5.9%
Ridgefield 5.7% 5.7% 5.6% 5.7% 5.8% 5.9% 5.9% Newtown 6.3% 6.2% 6.3% 6.2% 6.5% 6.3% 6.3%
Shelton 13.3% 13.0% 14.1% 13.1% 14.8% 14.6% 14.6% Hartford-West Hartford-East Hartford, CT
Hartford 82.0% 70.1% 75.6% 71.2% 82.9% 84.7% 84.0% New Britain 74.0% 71.1% 68.9% 70.9% 74.1% 75.4% 75.1%
West Hartford 24.3% 22.5% 25.7% 23.0% 26.4% 29.0% 28.1% Bristol 26.5% 26.1% 26.6% 26.1% 26.5% 27.5% 27.2%
Southington 7.4% 7.4% 7.4% 7.4% 8.1% 7.7% 7.8% East Hartford 77.0% 73.7% 74.6% 73.9% 77.5% 78.3% 77.9% Glastonbury 9.7% 9.5% 9.9% 9.5% 10.7% 11.6% 11.3% Manchester 46.9% 43.9% 47.6% 44.5% 49.6% 49.1% 49.3%
Enfield 16.2% 15.9% 17.2% 15.9% 16.7% 17.9% 17.5% New Haven-Milford, CT
New Haven 83.0% 70.7% 64.6% 69.9% 84.8% 86.5% 85.6% Waterbury 73.3% 66.8% 70.9% 67.1% 75.3% 75.5% 75.5%
Meriden 60.3% 59.1% 60.3% 59.2% 61.2% 60.9% 60.9% Milford 10.6% 10.5% 10.5% 10.5% 11.5% 11.7% 11.6%
Wallingford 16.7% 16.4% 16.5% 16.4% 17.1% 17.8% 17.7% West Haven 53.5% 51.4% 51.8% 51.4% 54.7% 55.6% 55.2%
Hamden 46.8% 41.2% 43.2% 41.5% 52.2% 53.3% 52.6%
Source: U.S. Department of Education, National Center for Education Statistics, Common Core of Data (CCD),
Public Elementary/Secondary School Universe Survey Data.
Note: AI=American Indian
Poverty Concentration in Connecticut’s Large Districts
With respect to poverty concentration in Connecticut’s large districts, the degree to which
students attended schools of concentrated poverty was determined far more by the poverty level
of the school district than the race of the student. As Table 25 indicates, the level of absolute
poverty was the most astonishing in the Bridgeport district where virtually all students were poor
and were blacks and Latinos. In the district, almost all classmates in schools attended by every
racial group were from low-income families, and the district’s students were very unlikely to
have contact with any students from middle-class families. The next poorest district was Hartford
where 85% of the students were from low-income families. In the same district, however, there

Connecticut School Integration: Moving Forward as the Northeast Retreats, April 2015
Civil Rights Project/Proyecto Derechos Civiles
60
was an overwhelming difference. For instance, the typical white student attended a school where
less than 70% of their classmate were poor, while the typical Latino student had, on average,
91% classmates living in poverty. New Britain, Waterbury, New Haven, and Meriden districts
had extremely high levels of poverty, between 70% and 81%. In contrast, we see the other
extreme, such as Ridgefield, Westport, and Newtown in which poverty levels were between
2.9% and 6.7% (see Table 25). In these districts, students from any racial group were likely to be
in a school with an overwhelming majority of classmates from middle- and upper-class families
and neighborhoods. The difference in terms of poverty levels across racial groups and among
districts matters because students have different experiences, opportunities, and resources of any
kind that related to education in their homes and neighborhoods.
Major Accomplishments of the Sheff Remedies
Twenty-three years after the Connecticut Supreme Court ordered the development of a
remedy for the harmful segregation that violated the rights of the black and Latino students of
Hartford, Connecticut has demonstrated the value of some approaches which not only cross over
the boundaries that separate children by race and poverty but also provide very attractive
educational alternatives for all children that never existed before in the state. Integration,
Connecticut has clearly shown, is not a zero-sum game, it can be a positive-sum game in which
all groups of children and communities can gain opportunities and experiences that would not
otherwise exist. In all likelihood the fact that there have been significant declines in the level of
intense segregation under the remedy is related to the new efforts, since this pattern has not been
observed in other bordering New England states.

Connecticut School Integration: Moving Forward as the Northeast Retreats, April 2015
Civil Rights Project/Proyecto Derechos Civiles
61
Table 25: Low-Income Students Students Attended by the Typical Student of Each Race in
Major Districts, 2012-2013
District %
Low-Income White Asian
White/
Asian Black Latino
Black/
Latino/AI
Bridgeport-Stamford-Norwalk, CT
Bridgeport 99.5% 99.5% 99.6% 99.5% 99.5% 99.5% 99.5%
Stamford 50.1% 49.2% 50.0% 49.3% 50.4% 50.7% 50.6%
Norwalk 47.1% 43.4% 47.7% 43.9% 47.8% 50.1% 49.3%
Danbury 51.3% 48.4% 50.0% 48.7% 50.5% 54.5% 53.8%
Fairfield 9.9% 9.4% 11.7% 9.5% 12.5% 12.5% 12.5%
Greenwich 14.6% 12.0% 12.8% 12.1% 24.9% 24.0% 24.1%
Stratford 42.8% 42.1% 42.1% 42.1% 43.3% 44.0% 43.7%
Trumbull 8.9% 8.8% 8.9% 8.9% 9.4% 8.9% 9.1%
Westport 3.8% 3.8% 3.8% 3.8% 4.0% 3.8% 3.9%
Ridgefield 2.9% 2.9% 2.7% 2.9% 2.9% 2.9% 2.9%
Newtown 6.7% 6.7% 6.7% 6.7% 7.0% 6.6% 6.7%
Shelton 20.8% 20.5% 21.4% 20.5% 23.0% 22.4% 22.5%
Hartford-West Hartford-East Hartford, CT
Hartford 84.9% 68.8% 74.6% 70.0% 82.2% 90.9% 87.5%
New Britain 80.9% 79.1% 78.9% 79.1% 80.8% 81.7% 81.5%
West Hartford 20.0% 18.1% 21.8% 18.7% 22.3% 25.2% 24.1%
Bristol 36.6% 36.3% 36.7% 36.3% 36.9% 37.5% 37.4%
Southington 14.3% 14.3% 13.9% 14.2% 14.8% 14.5% 14.5%
East Hartford 61.1% 57.0% 58.2% 57.2% 61.6% 62.7% 62.2%
Glastonbury 8.5% 8.1% 8.9% 8.2% 9.9% 11.4% 10.9%
Manchester 54.6% 51.3% 54.0% 51.7% 57.6% 57.5% 57.5%
Enfield 35.3% 34.5% 37.0% 34.6% 35.7% 39.5% 38.1%
New Haven-Milford, CT
New Haven 78.5% 74.5% 69.9% 73.8% 78.5% 80.6% 79.5%
Waterbury 80.9% 74.5% 78.3% 74.8% 82.4% 83.4% 83.1%
Meriden 69.7% 68.3% 70.3% 68.5% 70.4% 70.4% 70.4%
Milford 21.4% 21.3% 20.4% 21.2% 22.8% 23.2% 23.1%
Wallingford 17.5% 17.3% 17.0% 17.2% 18.7% 18.5% 18.5%
West Haven 51.1% 49.1% 50.0% 49.1% 51.3% 53.6% 52.6%
Hamden 40.0% 33.9% 37.5% 34.5% 45.4% 47.0% 45.9%
Source: U.S. Department of Education, National Center for Education Statistics, Common Core of Data (CCD),
Public Elementary/Secondary School Universe Survey Data.
Note: AI=American Indian

Connecticut School Integration: Moving Forward as the Northeast Retreats, April 2015
Civil Rights Project/Proyecto Derechos Civiles
62
Conclusion and Recommendations71
This report shows that there is serious segregation of both black and Latino students in
Connecticut schools which has been addressed partially by the plans created in response to the
state supreme court’s l996 ruling and subsequent efforts to strengthen and expand remedies.
Those changes have significantly reduced extreme segregation and opened opportunities for
thousands of students of all races to have positive experiences in diverse schools.
In spite of these gains, however, serious segregation remains and will affect more
students as the enrollment of students of color grows. The central needs are to scale up the
existing plans, create a much more robust and well supported plan for voluntary interdistrict
transfers, and prevent transfers that actually increase racial and ethnic separation. Since
segregation is spreading at a substantial level in some of the state’s suburban communities, it is
very important that communities and school districts work together with the support of the state
government and private institutions develop plans to foster stable lasting diversity and to avoid
discriminatory housing marketing and other forces that produce resegregation. Regional school
and housing diversity policies can be vital parts of these solutions.
The extreme divergence in Connecticut’s test scores by race and poverty, which
education reformers have repeatedly noted, requires more attention both to the evidence of
educational success in diverse schools and to the severe problems of remaining segregated
education
State Level
Most states have provided very little leadership to combat spreading segregation in recent
decades. Thanks to the Sheff decision of the Connecticut Supreme Court, and earlier litigation on
school finance, Connecticut has produced some important experiments and produced alternatives
that could be considerably expanded. Connecticut should considerably expand the magnet school
effort, expand the interdistrict choice program, and develop civil rights standards for all school
choices options, especially including charter schools. Those standards should include 1) a goal
and a plan for diversity, 2) a priority for transfer from neighborhoods with high nonwhite
populations, 3) provision of excellent parent information counseling for choice options and
recruitment for those that fail to open integrated, 4) a goal of using desirable choice options to
help stabilize racially diverse communities threatened by resegregation 5) a prohibition on
screening for entrance into schools of choice; 6)free transportation to schools of choice
The state should lift the cap on magnet schools. Charters should come under the state’s
diversity policies and requirements and should have goals, recruitment strategies, public
information and transportation policies to foster diversity including diversity of language
background. The open enrollment program should be strongly focused on fostering diversity,
should not pay for transfers from one segregated school to another, and should include
resegregated suburbs as sending areas. The focus should be on opening opportunities for more
students segregated by race and poverty to go to stronger schools with more white and Asian
students---schools with higher achievement levels, and better ratings from the state department
71 This section is adapted from Orfield, G., Kuscera, J., & Siegel-Hawley, G. (2012). E pluribus … separation?
Deepening double segregation for more students. Los Angeles, CA: The Civil Rights Project.

Connecticut School Integration: Moving Forward as the Northeast Retreats, April 2015
Civil Rights Project/Proyecto Derechos Civiles
63
of education. Since the choice programs tend to seriously underserve EL and Special education
students, the state should clarify the requirement of federal civil rights law that all public schools
serve both groups of students and ask for plans from receiving schools to accomplish this goal.
Ohio devised a policy that could be used in Connecticut. It applies to both regular public
schools and charter schools and provides guidance to school districts concerning the
development of student assignment plans that foster diverse schools and reduce concentrated
poverty. Ohio's policy encourages inter-district transfer programs and regional magnet schools,
promotes the recruitment of a diverse group of teachers and also requires districts to report to the
Ohio State Superintendent of Public Instruction on diversity-related matters. Connecticut is
doing some of these things under court order but it would be more powerful if there was serious
multidimensional leadership from the state department of education and support from top elected
officials and members of the legislature.
Given the growing levels of within-district segregation in the state/s metros, state housing
agencies and state and local officials need to work together to coordinate new school
construction and affordable housing development. Housing tax credits should not be awarded for
family housing that places more impoverished students in low achieving high poverty schools.
Fair housing and state and local officials need to regularly audit discrimination in housing
markets, particularly in and around areas with diverse school districts and bring significant
prosecutions for violations. Housing officials need to strengthen and enforce site selection
policies for projects receiving federal direct funding or tax credit subsidies so that they support
integrated schools rather than foster segregation. There should be particular sanctions against
steering families away from schools that are integrated or predominantly minority. Because state
test scores and ratings of schools by state authorities become a basic way of channeling housing
demand from parents with resources, the state and local districts should supplement the existing
data with data showing how much students learn in a year on average to give a rough indicator of
academic growth, which is the fundamental question for parents.
The substantial size and continuing growth of the state’s share of students from non-
English speaking homes provides an opportunity for mutually beneficial educational options that
foster true fluency in two languages as well as a positive experience of integration, an experience
that honors the skill of both groups of students in a voluntary dual immersion program in which
both English-speakers and Spanish speakers learn in both languages in classes with fluent native
speakers of the other language. While there are limits on assignments to schools based on race of
individual students there are no limits on using language very directly in integrating schools.
Since growth in school population is driven by Latinos and Asians the state has a growing supply
of children fluent in a second language who could contribute to such schools.
Though charter schools remain limited, state and local officials should work to promote
diversity in charter school enrollments, in part by encouraging extensive outreach to diverse
communities, inter-district enrollment, and the provision of free transportation. Officials should
also consider pursuing litigation against charter schools that are receiving public funds but are
intentionally segregated, serving only one racial or ethnic group, or refusing service to English
language learners. They should investigate charter schools that are virtually all white in diverse
areas or schools that provide no free lunch program, making it impossible to serve students who
need these subsidies in order to eat and therefore excluding a large share of nonwhite students.
To make charter operators increasingly cognizant of their civil rights responsibilities under state

Connecticut School Integration: Moving Forward as the Northeast Retreats, April 2015
Civil Rights Project/Proyecto Derechos Civiles
64
and federal law, the state officials need to examine statistics, investigate patterns of apparent
segregation or exclusion, and take enforcement actions when there is not a serious remedy.
There is considerable discussion in Connecticut of the possibility of focusing diversity
policy on class rather than race, though the Supreme Court decision rejected the plaintiff’s effort
to obtain relief on both dimensions and focused squarely on race. There are, of course, important
reasons to think about the relationship between family poverty and the concentrated persistent
poverty of some neighborhoods and educational inequality. But it is also important to remember
that race and class are different things, both of which are important. Poverty is a condition that is
usually temporary, especially for whites and which may or may not be intensified by living in a
concentrated poverty neighborhood, which is much more likely for poor blacks and Latinos than
for poor whites. Race, on the other hand, is something that is permanent, attaches directly to
appearance for many, and which carries strong negative meanings and engenders strong
prejudices in American society. As the statistics in the report make clear, black and Latino
students on average attend schools with much higher shares of poor children than do whites and
Asians, but there are very significant numbers of blacks and Latinos who are not poor in
Connecticut and would not receive any options for integration under a class only policy. An
important fact for the future of racial diversity is that there is powerful evidence, dating back a
half century, that whites in diverse communities are likely to leave, increasing racial segregation,
under a unrestrictive choice policy that does not have integration goals and mechanisms. This
would, of course, make interracial communities and schools less stable and more likely to
resegregate. It would be very unfortunate to adopt a civil rights remedy that intensified the
segregation the remedy was required to address. There have been major changes in enrollments
since the present plans were designed and the state authorities need additional authority to foster
suburban participation and identify good transfer opportunities in strong school districts with
declining enrollments, a precious resource. Because the state is in a major demographic
transformation and part way through a desegregation process the possibility of reducing
segregation by race and poverty needs to be an important part of general educational policy
decisions.
Local Level
At the local level, raising awareness is an essential step in preventing further
resegregation and encouraging integrated schooling. Civil rights organizations and community
organizations in nonwhite communities should study the existing trends and observe and
participate in political and community processes and action related to boundary changes, school
siting decisions, and other key policies that make schools more segregated or more integrated.
Local communities and fair housing organizations must monitor their real estate market to ensure
that potential home buyers are not being steered away from areas with diverse schools.
Community institutions and churches need to facilitate conversations about the values of diverse
education and help raise community awareness about its benefits. Local journalists should cover
the relationships between segregation and unequal educational outcomes and realities, in addition
to providing coverage of high quality, diverse schools.
Although the Connecticut Racial Imbalance Act has little relevance to the large central
cities it is still directly relevant to suburbs with moderate levels of diversity and should be
observed by local school districts.

Connecticut School Integration: Moving Forward as the Northeast Retreats, April 2015
Civil Rights Project/Proyecto Derechos Civiles
65
Local educational organizations and neighborhood associations should vigorously
promote diverse communities and schools as highly desirable places to live and learn.
Communities need to provide consistent and vocal support for promoting school diversity and
recognize the power of local school boards to either advocate for integration or work against it.
Efforts should be made to foster the development of suburban coalitions to influence state-level
policy-making around issues of school diversity and equity.
Business leaders and the educational reform groups they support should directly confront
the obvious racial dimensions of the state’s massive educational gaps and propose and support
effective voluntary effort5s to ameliorate them.
School district policy-makers also have control over student assignment policies and thus
can directly influence the levels of diversity within each school. Districts should develop policies
that consider race among other factors in creating diverse schools. Magnet schools and transfer
programs within district borders can also be used to promote more racially integrated schools.
The enforcement of laws guiding school segregation is essential. Many suburban districts
never had a desegregation order because they were virtually all white during the civil rights era.
However, many of them are now diverse and may be engaged in classic abuses of racial
gerrymandering of attendance boundaries, school site selection that intensifies segregation and
choice plans, or operating choice plans with methods and policies that undermine integration and
foster segregation. Where such violations exist, local organizations and parents should ask the
school board to address and correct them. If there is no positive response they should register
complaints with the U.S. Department of Justice or the Office for Civil Rights of the Department
of Education.
Educational Organizations and Universities
Professional associations, teachers’ organizations, and colleges of education need to
make educators and communities fully aware of the nature and costs of existing segregation.
Foundations should fund research dedicated to exploring the continued harms of segregation and
the benefits of integration. Researchers and advocates need to analyze and publicize the racial
patterns and practices of public charter schools. Nonprofits and foundations funding charter
schools should not incentivize the development of racially and economically isolated programs
but instead they should support civil rights and academic institutions working on these issues.
Institutions of higher education can also influence the development of more diverse K-12
schools by informing students and families that their institutions are diverse and that students
who have not been in diverse K-12 educational settings might be unprepared for the experiences
they will encounter at such institutions of higher education. Admission staffs of colleges and
universities should also consider the skills and experiences that students from diverse high
schools will bring to their campuses when reviewing college applications and making admissions
decisions.
Private and public civil rights organizations should also contribute to enforcing laws.
They need to create a serious strategy to enforce the rights of Latino students in districts where
they have never been recognized and serious inequalities exist.

Connecticut School Integration: Moving Forward as the Northeast Retreats, April 2015
Civil Rights Project/Proyecto Derechos Civiles
66
The Courts
The Connecticut Supreme Court clearly and forcefully recognized that segregation and
inequality is built into the system of school districts in the state but it has not yet insisted on a
remedy that is in any way proportional to the problem. The Supreme Court and the lower courts
that continue to supervise existing court orders and consent decrees should monitor them for full
compliance before dissolving the plan or order and consider what additional remedies are
needed.
Federal Level
At the federal level, our country needs leadership that expresses the value of
diverse learning environments and encourages local action to achieve school desegregation. The
federal government should establish a joint planning process between the Department of
Education, the Department of Justice, and the Department of Housing and Urban Development
to review programs and regulations that will result in successful, lasting community and school
integration. Federal equity centers should provide effective desegregation planning, which was
their original goal when they were created under the Civil Rights Act of 1964.
Federal choice policies should include civil rights standards. Without such requirements,
choice policies, particularly those guiding charter schools, often foster increased racial
segregation. Federal policy should also recognize and support the need for school districts to
diversify their teaching staff. The federal government should provide assistance to districts in
preparing their own paraprofessionals, who tend to represent a more diverse group, to become
teachers. In Connecticut planning of the use of federal aid should be linked to helping the state
comply with the demands of the state constitution.
Building on the Obama administration’s grant program for Technical Assistance for
Student Assignment Plans, a renewed program of voluntary assistance for integration should be
enacted. This program should add a focus on diversifying suburbs and gentrifying urban
neighborhoods and provide funding for preparing effective student assignment plans, reviewing
magnet plans, implementing summer catch-up programs for students transferring from weaker to
stronger schools, supporting partnerships with universities, and reaching out to diverse groups of
parents.
As an important funding source for educational research, the federal government should
support a research agenda that focuses on trends of racial change and resegregation, causes and
effects of resegregation, the value of alternative approaches to achieving integration and closing
gaps in student achievement, and creating housing and school conditions that support stable
neighborhood integration.
The Justice Department and the Office for Civil Rights need to take enforcement actions
in some substantial school districts to revive a credible sanction in federal policy for actions that
foster segregation or ignore responsibilities under desegregation plans.

Connecticut School Integration: Moving Forward as the Northeast Retreats, April 2015
Civil Rights Project/Proyecto Derechos Civiles
67
Concluding Thoughts
Like the rest of New England, Connecticut is experiencing serious racial change much
later than many parts of the country, but it is clearly now well under way. Connecticut does,
however, have serious problems of segregation by race and poverty, particularly in its central
cities. Although the state had early positive policies and experiments, particularly in the Hartford
area, it had largely abandoned the effort to do anything serious about this growing problem until
the state supreme court ordered the development of a plan in l996. There is now enough
experience under that plan to know that there are potential positive solutions that could
contribute significantly to a different future for the state. There is significant evidence that these
plans contribute to both lowering segregation and improving education and that they can produce
schooling opportunities that were not previously available and are in demand from families of all
races. Connecticut should give a very high priority to expanding these excellent educational
options.
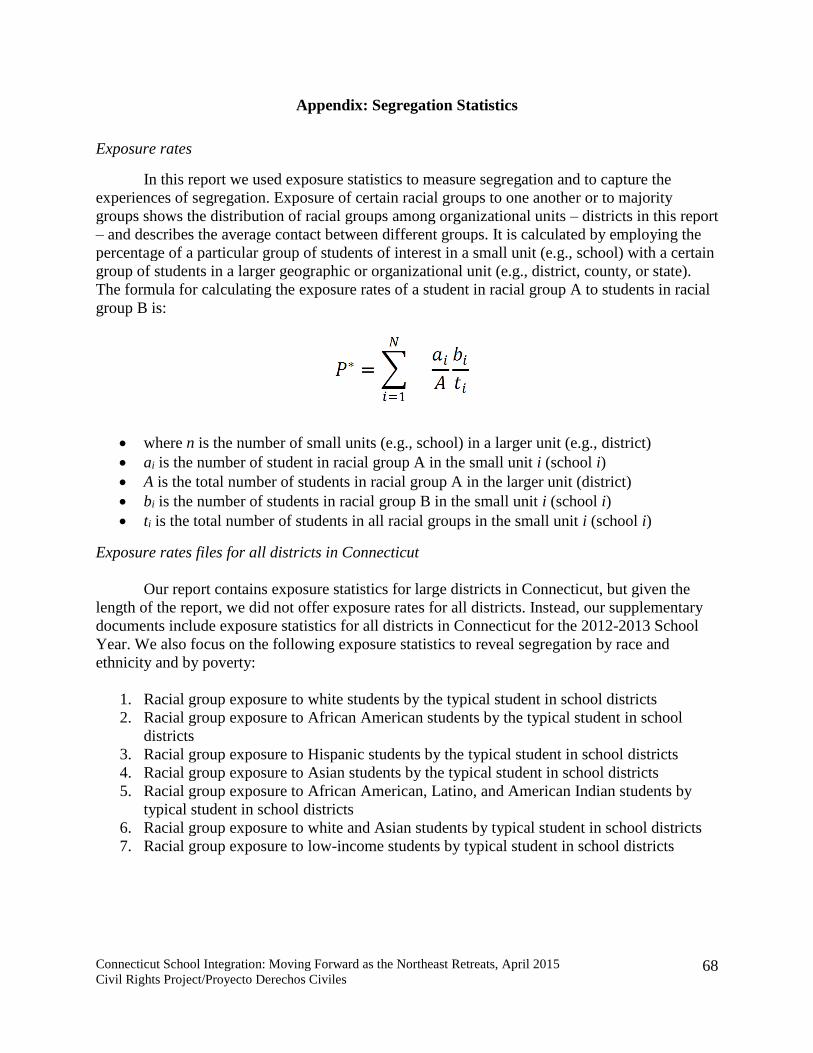
Connecticut School Integration: Moving Forward as the Northeast Retreats, April 2015
Civil Rights Project/Proyecto Derechos Civiles
68
Appendix: Segregation Statistics
Exposure rates
In this report we used exposure statistics to measure segregation and to capture the
experiences of segregation. Exposure of certain racial groups to one another or to majority
groups shows the distribution of racial groups among organizational units – districts in this report
– and describes the average contact between different groups. It is calculated by employing the
percentage of a particular group of students of interest in a small unit (e.g., school) with a certain
group of students in a larger geographic or organizational unit (e.g., district, county, or state).
The formula for calculating the exposure rates of a student in racial group A to students in racial
group B is:
where n is the number of small units (e.g., school) in a larger unit (e.g., district)
ai is the number of student in racial group A in the small unit i (school i)
A is the total number of students in racial group A in the larger unit (district)
bi is the number of students in racial group B in the small unit i (school i)
ti is the total number of students in all racial groups in the small unit i (school i)
Exposure rates files for all districts in Connecticut
Our report contains exposure statistics for large districts in Connecticut, but given the
length of the report, we did not offer exposure rates for all districts. Instead, our supplementary
documents include exposure statistics for all districts in Connecticut for the 2012-2013 School
Year. We also focus on the following exposure statistics to reveal segregation by race and
ethnicity and by poverty:
1. Racial group exposure to white students by the typical student in school districts
2. Racial group exposure to African American students by the typical student in school
districts
3. Racial group exposure to Hispanic students by the typical student in school districts
4. Racial group exposure to Asian students by the typical student in school districts
5. Racial group exposure to African American, Latino, and American Indian students by
typical student in school districts
6. Racial group exposure to white and Asian students by typical student in school districts
7. Racial group exposure to low-income students by typical student in school districts

Connecticut School Integration: Moving Forward as the Northeast Retreats, April 2015
Civil Rights Project/Proyecto Derechos Civiles
69
How to read tables?
To illustrate, let’s look at the table of racial group exposure to low-income students by
the typical student of each racial group. The table below indicates that the typical white student
attends a school with 47.7% low-income students in the ABC School District, whereas the
typical Latino student is in contact with 65.8% low-income students in school in the same
district.
Example: Racial Group Exposure to Low-Income Students by Typical Student in School
Districts District Total Enrollment White Asian White/Asian Black Latino Black/Latino/AI
ABC SD 20,845 47.7% 36.5% 38.3% 53.5% 65.8% 63.6%