connecting east asia: a new framework for...
TRANSCRIPT

Connecting East Asia:A New Framework for Infrastructure
ASIAN DEVELOPMENT BANK
JAPAN BANK FOR INTERNATIONAL COOPERATION
WORLD BANK
TOKYO LAUNCH
MARCH 16, 2005

© 2005 Asian Development Bank, The International Bank for Reconstruction and Development / The World Bank,and Japan Bank for International Cooperation
Asian Development Bank6 ADB AvenueMandaluyong City, 1550 Metro ManilaPhilippinesTelephone: +63 2 632 4444Internet: www.adb.orgE-mail: [email protected]
The International Bank for Reconstruction and Development / The World Bank1818 H Street, NWWashington DC 20433USATelephone: 202-473-1000Internet: www.worldbank.orgE-mail: [email protected]
Japan Bank for International Cooperation4-1, Ohtemachi 1-Chome, Chiyoda-ku, Tokyo 100-8144JapanTelephone: (81-03) 5218-9725Internet: www.jbic.go.jpE-mail: [email protected]
All rights reserved
This Launch Edition of Connecting East Asia: A New Framework for Infrastructure was printed in March 2005 andis a draft version of a work to be published later this year by the Asian Development Bank, Japan Bank forInternational Cooperation and The World Bank.
The findings, interpretations, and conclusions expressed herein are those of the author(s) and do not necessarilyreflect the views of the Asian Development Bank or its Board of Governors or the governments they represent, theExecutive Directors of the International Bank for Reconstruction and Development / The World Bank or thegovernments they represent, or Japan Bank for International Cooperation.
The Asian Development Bank, Japan Bank for International Cooperation and The World Bank do not guarantee theaccuracy of the data included in this work. The boundaries, colors, denominations, and other information shown onany map in this work do not imply any judgment on the part of the Asian Development Bank, Japan Bank forInternational Cooperation, or The World Bank concerning the legal status of any territory or the endorsement oracceptance of such boundaries.
Rights and Permissions
The material in this publication is copyrighted. Copying and/or transmitting portions or all of this work withoutpermission may be a violation of applicable law. The Asian Development Bank, The International Bank forReconstruction and Development / The World Bank and Japan Bank for International Cooperation encouragedissemination of its work and will normally grant permission to reproduce portions of the work promptly.
For permission to photocopy or reprint any part of this work, please send a request with complete information tothe Copyright Clearance Center Inc., 222 Rosewood Drive, Danvers, MA 01923, USA; telephone: 978-750-8400;fax: 978-750-4470; Internet: www.copyright.com.
All other queries on rights and licenses, including subsidiary rights, should be addressed to the Office of thePublisher, The World Bank, 1818 H Street NW, Washington, DC 20433, USA; fax: 202-522-2422; e-mail:[email protected].

i
Contents
Countries Covered By This Study..............................................................................ii
Foreword ................................................................................................................. iii
Acknowledgments .....................................................................................................v
Abbreviations ...........................................................................................................vi
Executive Summary...................................................................................................1
1 The Infrastructure Challenge .............................................................................31
2 Inclusive Development ......................................................................................73
3 Coordination .....................................................................................................95
4 Accountability and Risk Management .............................................................127
5 The Way Forward ...........................................................................................167
Statistical Annex: Infrastructure Indicators ............................................................A-1
References .............................................................................................................B-1

ii
Countries Covered By This Study
This study focuses on the developing countries of the East Asia and Pacific Region which aremembers of both the Asian Development Bank and the World Bank. These are Cambodia,China, Fiji, Indonesia, Kiribati, Lao PDR, Malaysia, Marshall Islands, Federated States ofMicronesia, Mongolia, Myanmar, Palau, Papua New Guinea, Philippines, Samoa, SolomonIslands, Thailand, Timor Leste, Tonga, Vanuatu and Vietnam.
Developing countries are low and middle-income countries as defined in the World Bank, WorldDevelopment Indicators, 2004. The findings of this study are also relevant to other developingcountries within the region and elsewhere in the world.

iii
Foreword
Infrastructure has always played a central role in the East Asian development model: to promoteeconomic growth, to share the benefits of growth with poorer groups and communities, and toconnect countries within the region and with the rest of the world. There is little doubt thatinfrastructure development – by both the public and private sectors -- has contributed to theregion’s enviable record on growth and poverty reduction.
At the same time, questions and concerns have often been raised about the impact ofinfrastructure development on the environment and local communities, about waste throughcorruption in public spending and private contracts, and about the appropriate roles of the publicand private sectors in infrastructure financing, ownership and management. While infrastructurecan be a force for good, we also have to make sure it is done well.
These questions are the motivation for this joint study by the Asian Development Bank, theJapan Bank for International Cooperation and the World Bank. The report is organized aroundfour main themes: inclusive development, coordination, accountability and risk management. Itis aimed at senior policymakers and development practitioners who have to look at infrastructurein the context of country-wide policies and programs. It does not provide detailedrecommendations by country and sector. But it does provide a new way of thinking aboutinfrastructure issues – which is relevant to all countries in the region.
Our three agencies support infrastructure development through project financing and guarantees,as well as by assisting governments to put in place policies to improve public sector performanceand to attract private investment. Therefore this study is also very relevant to our ownoperations. We will look closely at the implications for our technical assistance, capacitybuilding, financing and guarantee activities. Each agency will follow its own operationalstrategy in each country. But we hope this new framework will enable us to take a morecoherent and consistent approach. We will also look for opportunities to work closely together –as evidenced recently in Indonesia.
The recent Indian Ocean tsunami took many lives and devastated communities in its path. InIndonesia alone, the damages and losses are estimated at US$4.5 billion, of which about 20percent would be to rebuild infrastructure. This report is not about the tsunami. But many of thepolicy lessons – about coordination, community involvement and accountability, for example –are also relevant to infrastructure reconstruction. Similarly, in the design of new infrastructureprojects, we must take account of their vulnerability to natural disasters, to reduce the risk ofdamage in the future.
We offer this report as a contribution to the ongoing debates about the role of infrastructure inpromoting growth and reducing poverty. We realize from our own consultations thatpolicymakers in the region do not have to be convinced about the importance of infrastructure.But they are keen to learn from the experiences of other countries on how to do it better. Wehope you will find that this report provides a refreshing and sometimes provocative look atfamiliar issues – and sheds new light on the way forward.
iv
Mr. Geert van der LindenVice President, Knowledge Management and Sustainable DevelopmentAsian Development Bank
Mr Seiichi NakamuraDirector General, JBIC InstituteJapan Bank for International Cooperation
Mr. Jemal-ud-din KassumVice President, East Asia and Pacific RegionWorld Bank

v
Acknowledgments
This report has been prepared by a core study team led by Mark Baird and comprising RitaNangia (ADB), Yasuo Fujita (JBIC) and Jonathan Walters (World Bank). Jonathan Walters isthe principal author of the report. Additional contributions were provided by AdamSchwartzman, Marc Shotten, Elisa Muzzini, Philip Lam, Atsushi Iimi, Takuro Takeuchi andShigeki Furukawa. The core team was ably assisted by Evangeline Sucgang, Aggie de Sagon,Marivic de la Cruz, Motoko Kanamaru and Melissa Morris. The study was prepared under thegeneral guidance of Khalid Rahman (ADB), Toru Tokuhisa and Seiichi Nakamura (JBIC), andChristian Delvoie (World Bank).
Background papers for the study were prepared by: Stephen Jones (Oxford Policy Management),Hiroo Yamagata (Nomura Research Institute), Sharon Felzer (World Bank), John Ure(University of Hong Kong), David Ehrhardt (Castalia), John Besant-Jones, Roger Allport(Halcrow), Shinji Asanuma (Hitotsubashi University), Felipe Medalla (University of thePhilippines), Douglas Webster, Zhi Liu (World Bank), Jeremy Warford, Lee Schipper and We-shiuen Ng (World Resources Institute), Alex Sundakov (Castalia), Shigeru Morichi (Institute forTransport Policy Studies), Shizuo Iwata (ALMEC Corporation), Yasuo Fujita and Shoichi Hisa(JBIC), Michael Bennett, Tito Yepes (World Bank), Timothy Irwin and Hana Brixi (WorldBank), Mahesh Kotecha (Structured Credit International Corporation), Yutaka Takamine(University of the Ryukyus), Liz Urquhart (Castalia) and Steven Burgess (World Bank).
Valuable comments on a draft of this report were provided by managers and staff of the ADB,JBIC and the World Bank, as well as by an external advisory group comprising: JosephAnderson (Morrison and Forester), Dai Dongchang (Ministry of Communications, China), DavidHawes (AUSAID), Haresh Jaisinghani (AES Corporation), Takashi Kudo (Nippon Keidanren),Gilbert Llanto (Philippine Institute for Development Studies), Shigeru Otsubo (NagoyaUniversity), Roel Ravanera (Asia-Japan Partnership Network for Poverty Reduction), VijaySethu (ANZ Investment Bank), Frances Seymour (World Resources Institute), BambangSusantono (Coordinating Ministry of Economic Affairs, Indonesia), Hidekazu Tanaka(Engineering and Consulting Firms Association, Japan) and Douglas Webb(Telecommunications Commissioner, New Zealand).
The study was supported by generous funding from the Government of Japan (PHRD and JapanSocial Fund), the Public-Private Infrastructure Advisory Facility (PPIAF), the AsianDevelopment Bank, the Japan Bank for International Cooperation and the World Bank. Thisfunding enabled the study team inter alia to organize consultations with government officials,private investors, civil society, academics and development agencies through three regionalworkshops in Manila (January 2004), Tokyo (January 2004) and Bali (June 2004) and a series ofcountry visits. Some preliminary findings from the study were presented at the Asia PacificInfrastructure Forum (Melbourne, December 2004) and the Indonesia Infrastructure Summit(Jakarta, January 2005).

vi
Abbreviations
ADB Asian Development BankASEAN Association of South-east Asian NationsBOI Board of InvestmentBOT build-operate-transferBRT Bus rapid transitCDD Community driven developmentCoC Cost of CapitalCPC Communist Party of ChinaCPRGS Comprehensive Poverty Reduction and Growth StrategyDfID Department for International DevelopmentEAP East Asia and PacificECA Europe and Central Asia (developing and transition countries only)ECTEL Eastern Caribbean Telecommunications AuthorityEKUIN Coordinating Ministry for the Economy and IndustryERR Economic rate of returnESB Eastern seaboardFDI Foreign direct investmentGDP Gross Domestic ProductGMS Greater Mekong sub-regionGNI Gross National IncomeICD Inland container terminalICT Information and communications technologyIPP Independent power producerJBIC Japan Bank for International CooperationJICA Japan International Cooperation AgencyJETRO Japan External Trade OrganizationKDP Kecamatan Development ProjectLAC Latin America and the Caribbean (developing countries only)MDGs Millennium Development GoalsMOF Ministry of FinanceMOT Ministry of TransportMPI Ministry of Planning and InvestmentMRT Mass rapid transitMWSS Metropolitan Water Supply and Sewerage SystemMWCI Manila Water CompanyMWSI Manual Sewer ServicesNEDA National Economic and Development AuthorityNESDB National Economic and Social Development BoardNGO Non-governmental organizationNPC National Power CorporationNRW Non-revenue waterNT2 Nam Theun 2OBA Output-based aidPASO Pacific Aviation Safety Office
vii
PDAM Perusahaan Daerah Air Minum (Local Water Supply Enterprise)PPI Private participation in infrastructurePPP Public-private partnershipsPSC Public sector comparatorRoE Returns on EquitySAR South Asia regionSEA Strategic Environmental AssessmentSEZ Special Economic ZonesSOE State-owned enterpriseSPUG Small Power Utilities GroupTEU Twenty foot equivalent unitsTRT Thai Rak ThaiUMT Urban Mass TransitUSAID United States Agency for International DevelopmentWB World BankWUA Water Users Association

viii

1
Executive Summary
This study is about East Asia, and it’s about infrastructure. It’s about poverty and growth, andit’s about transport, water, sanitation, power, and telecommunications – both the infrastructure,and the infrastructure services1.
Infrastructure is only one part of the development challenge, but its impacts are among the mostimportant. In this study we show how. We look at the role that infrastructure has played insupporting East Asia’s growth and poverty outcomes. We look ahead at what the challenges arefor the future, and how to think of approaching them.
We will spend some time discussing these challenges – here, and in the body of the study – butin sum they amount to this: responding to, and shaping change.
Much of East Asia continues to grow rapidly, driven to a considerable extent by China.Urbanization is proceeding at pace. Demand for infrastructure services is increasing massively,particularly in cities. Much of the demand comes from the newly urbanized poor. Infrastructurehas to meet their needs, but has also to continue to provide the underpinnings for the region’sgrowth.
The complexity of responding to these demands is greater than ever, and the cost of gettingthings wrong very high. Poorly conceived infrastructure investments today would have a hugeenvironmental, economic, and social impact – and be very costly to fix later. Neglecting theinfrastructure needs of people remaining in poor parts of East Asia – particularly in rural areas,and in isolated countries of the region; and failing to include them in growth, would also becostly, in human and political terms.
The “new framework”
In this study we set out a framework around which to structure a response to these challenges.The framework is organized around four chapters, each of which takes up a different part of theinfrastructure story.
Chapter 1 sets the scene. It’s about infrastructure in East Asia today, and how we got here. It tellsfive infrastructure “stories”, each of which provides a different part of the context for the
1 More precisely, the study’s infrastructure coverage focuses on water supply and sanitation, information andcommunications technology, electricity and gas, and all forms of transport. The study addresses upstream oil and gasor water resources management only peripherally. It also does not specifically cover housing, education, health orother social infrastructure
2
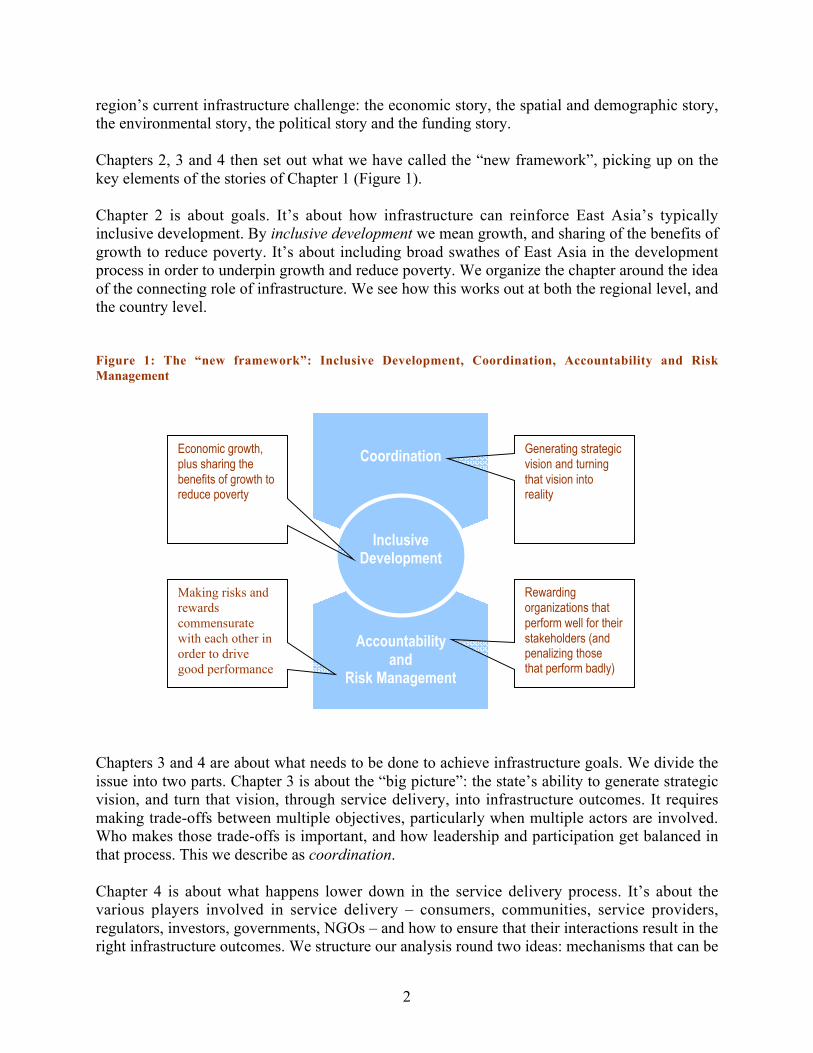
region’s current infrastructure challenge: the economic story, the spatial and demographic story,the environmental story, the political story and the funding story.
Chapters 2, 3 and 4 then set out what we have called the “new framework”, picking up on thekey elements of the stories of Chapter 1 (Figure 1).
Chapter 2 is about goals. It’s about how infrastructure can reinforce East Asia’s typicallyinclusive development. By inclusive development we mean growth, and sharing of the benefits ofgrowth to reduce poverty. It’s about including broad swathes of East Asia in the developmentprocess in order to underpin growth and reduce poverty. We organize the chapter around the ideaof the connecting role of infrastructure. We see how this works out at both the regional level, andthe country level.
Figure 1: The “new framework”: Inclusive Development, Coordination, Accountability and RiskManagement
Chapters 3 and 4 are about what needs to be done to achieve infrastructure goals. We divide theissue into two parts. Chapter 3 is about the “big picture”: the state’s ability to generate strategicvision, and turn that vision, through service delivery, into infrastructure outcomes. It requiresmaking trade-offs between multiple objectives, particularly when multiple actors are involved.Who makes those trade-offs is important, and how leadership and participation get balanced inthat process. This we describe as coordination.
Chapter 4 is about what happens lower down in the service delivery process. It’s about thevarious players involved in service delivery – consumers, communities, service providers,regulators, investors, governments, NGOs – and how to ensure that their interactions result in theright infrastructure outcomes. We structure our analysis round two ideas: mechanisms that can be
Accountabilityand
Risk Management
Coordination
InclusiveDevelopment
Generating strategicvision and turningthat vision intoreality
Rewardingorganizations thatperform well for theirstakeholders (andpenalizing thosethat perform badly)
Economic growth,plus sharing thebenefits of growth toreduce poverty
Making risks andrewardscommensuratewith each other inorder to drivegood performance
Executive Summary
3
used to bring about accountability, by rewarding good performance (and punishing bad); and therisk-management required to ensure that potential costs and benefits are equitably, andsustainably allocated.
Chapter 5 charts the way forward. It sets out twelve policy messages, answering to some of thekey preoccupations of the region’s policy makers, policy implementers, infrastructure serviceproviders, civil society organizations and other stakeholders, consulted in the process of puttingtogether this report. And it outlines the role that the development agencies can play in supportingcountries to meet their infrastructure challenge.
Chapter 1: The infrastructure challenge
We can take stock of East Asia’s infrastructure challenges in the context of five broader “stories”which have defined, and will continue to define, the region’s development:
The “economic story” is about the role that infrastructure has played in underpinning povertyreduction, investment and growth in the region – it’s about levels of expenditure, stocks ofinfrastructure assets, access to infrastructure services, and infrastructure competitiveness, andwhat this implies for the future.
The “spatial and demographic story” is about the demands on infrastructure of rapid urbangrowth, and the contribution of infrastructure to that growth, and to meeting the needs of urbanareas. But it’s also about the challenge of linking the poor in rural areas, both to services and togrowth poles. And it’s about the challenge of infrastructure on a regional dimension – supportingtrade, and spreading the benefits of growth across borders.
The “environmental story” is about dealing with the impacts of infrastructure on a range ofenvironmental concerns – air quality, emissions, the availability of clean water and sanitation,and the function of ecosystems that provide livelihoods and other benefits. The environmentalchallenge is how to mainstream environmental issues, addressing environment not only at theproject level, but in policy more broadly.
The “political story” is about who captures the benefits of infrastructure – who provides it, towhom, at what price, at whose cost.
And the “funding story” is about the scale of East Asia’s infrastructure needs, and how toresource them. There are ultimately only two groups who pay for infrastructure – consumers andtax-payers; and a further set that can finance it – the private sector, and donors. What needs to betaken into account in structuring the roles of each? What can be expected of them?
The economic story
As a region, East Asia has seen strong growth, and strong poverty reduction outcomes. Outputhas increased by an annual average of over 7 percent over the last 15 years, lifting $250 millionpeople out of poverty in the last five years. Investment levels are generally high, averaging over30 percent of GDP since the 1990s.

Executive Summary
4
Much of this investment has been in providing infrastructure services. A number of countriesinvest over 7 percent of GDP in infrastructure (Table 1.2). Infrastructure stocks are increasing atsignificant pace in a number of sectors. Energy generation capacity grew by over 80 percent (andas high as 180 percent) in five countries over the 1990s, and road networks expanded at similarlyimpressive rates – between 30 and 100 percent in three countries over the same period (Table1.3).
But there is great divergence behind these aggregate outcomes, and East Asia still has a long wayto go. Half the countries in the region grew by under 3.4 percent a year between 1994 and 2003.And there are still significant levels of poverty in many of the large, fast growers – close to 400million in China; 40 million in Vietnam; 100 million in Indonesia (Table 1.1).
Access to infrastructure services is similarly uneven. In 40 percent of East Asian countries forwhich we have data, access to water supply is lower than the average for all low and middleincome countries. The equivalent figures for sanitation, electricity, telephone and internet accessranges between 52 and 79 percent.
There is similar unevenness between countries in East Asia: above 90 percent of the populationhave water supply access in four countries; in three countries it’s less than 50 percent. Access tosanitation is 93 percent in Thailand, and 30 percent in Mongolia; Access to electricity is 97percent in Malaysia, and 15 percent in the Solomon Islands (Table 1.4).
What of the story behind these numbers? East Asian growth is largely driven by fast-growingurban agglomerations in coastal China, Indonesia, Thailand, Malaysia and Vietnam. Connectionsbetween countries within the region have been important, with significant regional trade, muchof it geared towards China’s expanding markets (a theme we pick up in Chapter 2).
A number of the countries in the region have seen simultaneously high levels of growth andinvestment, a focus on infrastructure, and improved infrastructure performance outcomes.Malaysia and Thailand have achieved internationally competitive infrastructure networks (Figure1.3). Other countries in the region are further behind, but in general, East Asia has provided theinfrastructure underpinnings for economic growth better than other developing countries.
High levels of investment have not necessarily meant efficient investment. China and Vietnam inparticular (with investments rates of over 30 percent of GDP, and investment in infrastructure atover 7 percent of GDP) face the challenge of addressing efficiency, avoiding overheating andmanaging a soft landing. A number of countries emerging from the Asian crisis of 1997 –Thailand, Malaysia, Indonesia and the Philippines – have restrained investment in general, andinfrastructure investment in particular. Thailand and Indonesia are both placing renewedemphasis on infrastructure, and face the challenge of enhancing the investment climate, andincreasing investment to underpin sustained growth.
In other East Asian countries – Lao PDR and Cambodia for instance – the mutually supportiverelationship between growth, poverty reduction, infrastructure and investment is less in evidence.Yet other countries and regions are land-locked, or isolated, and relatively unconnected to themajor growth poles of East Asia – most rural areas, the outlying islands of Indonesia and the

Executive Summary
5
Philippines, Mongolia and most Pacific island states. Infrastructure has an important role to playin all of these regions, forging connections to growth poles, and providing services to the poor.
The spatial and demographic story
East Asia’s spatial and demographic story is dominated by urbanization. Levels of urbanizationin East Asia are not high by international standards (at 36 percent of the population in 2000) butthey’re set to rise dramatically, to over 50 percent by 2025 (Figure 1.5). By then, half a billionmore people will live in urban areas.
Again, there are variations – Indonesia and the Philippines have both high urbanization levels,and high growth in urban populations; the opposite pertains in Thailand, with low levels ofurbanization, and low growth rates. Other countries span the range between these extremes(Table 1.6)
Cities drive East Asia’s growth. Cities account for up to 70 percent of East Asian GDP growth.In general, urbanization has been associated with increasing incomes (Figure 1.6). The growth ofcities has been associated with unprecedented prosperity (and growing inequality) – for examplethe per capita GDP of Shanghai alone is about 11 times that of China’s overall per capita GDP.
Densely populated urban areas have provided markets for outputs, inputs, labor and otherservices and have allowed firms to profit from economies of scale and scope, specialization andthe rapid diffusion of knowledge and innovation. Agglomeration economies have been verystrong.
But urban growth brings with it a host of infrastructure challenges: increasing population impliesincreasing demand for infrastructure services. Gaps are emerging across urban infrastructuresectors, and these gaps tend to affect the poor (who are frequently to be found in peri-urban,informal settlements) more than the rest of the population (Table 1.7).
At the same time, infrastructure has an enormous role to play in maintaining the competitivenessof East Asian cities. Among the most challenging aspects of this role is making infrastructurechoices before land use patterns are established, thus avoiding the prohibitive costs ofinfrastructure retrofitting. Long-term planning and strategic vision are essential, as aremechanisms to deal with the cross-jurisdiction and cross-agency coordination challenges raisedby decentralization. These issues are taken up in detail in Chapter 3, on coordination.
As important as are the demands of urban growth, two-thirds of the region’s population (roughly1.2 billion people) continue to live outside of cities. Poverty tends to be concentrated in ruralareas, with a number of generally fast-growing countries including significant pockets of ruralpoverty.
Rural economies depend on urban economies, but urban economies also depend on ruraleconomies for human capital and agricultural products. While improving the livelihoods of ruralpeople, the contribution of infrastructure to rural incomes, to health and to education outcomes

Executive Summary
6
also has implications for urban areas – in the supply, for instance, of perishable foods, or theproductivity of future migrants.
But the unit costs of delivering rural infrastructure in sparsely populated areas are often higherthan urban infrastructure, and striking the balance between urban and rural is difficult, especiallywhen budgets are constrained. Providing rural infrastructure as cost-effectively as possible is oneof the key challenges. As in urban areas, delivery of rural infrastructure raises a number ofcoordination problems. Decentralization, if not carefully managed, may sometimes enhance ruralisolation, rather than connectivity with the wider world.
Finally, the regional challenge for East Asia is to strengthen the links between countries tospread the benefits of growth. In part it’s about the infrastructure required to connect isolatedcountries and areas of the region – the Pacific islands, land-locked Mongolia, China’s westernprovinces. And in part it’s about the logistics services required to facilitate trade (and lower coststhrough economies of scale where possible). These issues are picked up in greater detail inChapter 2, on inclusive development.
The environmental story
Infrastructure choices have important environmental impacts. Sometimes they are positive2, butfrequently they are not. The environmental challenge is to take these on board, and mainstreamefforts to mitigate and limit negative environmental outcomes.
Project level interventions have an important role to play. They can include environmentalsafeguards, measures to mitigate (or compensate for) environmental risk and cost, alternativeprojects design, or even alternative projects. But the underlying causes of environmentalproblems cannot be addressed at this level. Environmental considerations need to be embeddedwithin national policymaking agendas.
There are a number of ways of doing this – environmental legislation; capacity building inenvironmental agencies; improved information and transparency; training both at the communitylevel and within infrastructure agencies; and the systematic use of strategic environmentalassessments (SEAs) at the national and sectoral level.
But mainstreaming environmental issues in this way is primarily a governance challenge, and adifficult one at that. Asymmetry in access to information, capture of the processes of informationdissemination, and ease in manipulating environmental assessments all benefit powerful politicalgroups. Mainstreaming depends on the development of broader accountability, participation andtransparency mechanisms exist.
Environmental mainstreaming also poses significant policy and agency coordination challenges.Shifting from individual to mass transit may improve urban air quality, but this involves a host ofinterventions, from investment in urban rail to taxation on fuel and private vehicles to trafficmanagement. And this is all the more difficult with the fragmentation of policies with
2 For instance, when infrastructure encourages sustainable agricultural resources, or creates alternatives to exploitingforest resources, or provides water and sanitation.
Executive Summary
7
environmental impacts across state agencies, and where the private sector and civil society areintimately involved. Coordinating across all these dimensions challenges government capabilitiesin any country.
The political story
The political economy of infrastructure is essentially a struggle over who captures theconsiderable benefits of infrastructure services, and who bears the costs. Governments,consumers and service providers (whether public or private) all have an interest. Tariff levels arethe issue around which much of this struggle takes place.
The high economic benefits of infrastructure make a strong case for government intervention. Sodoes the monopoly power that frequently accompanies the economies of scale required to delivermany infrastructure services. This intervention usually takes the form of tariff controls.
There are a number of reasons why this happens. Governments may want to protect a certainlevel of service, but be unwilling to allow tariffs to rise to levels required for cost recovery.Fiscal constraints may prevent them from providing subsidies to make up the difference. And theinterests of those groups who benefit from lower prices – infrequently the poor, who are oftenexcluded from formal services, and thus remain voiceless – may provide a similarly bindingconstraint.
While public sector provision was the only service provision model in East Asia, the costs of lowtariffs were absorbed by government budgets, quasi-fiscal loans from state-controlled financialinstitutions, capital consumption (i.e. lack of maintenance and capital replacement) or byreducing operations. This began to change in the late 1980s, when the private sector became anincreasingly important force in East Asian infrastructure, but in the process, took on considerablepolitical risk – much of which was realized after the Asian crisis of the late 1990s.
But addressing the political challenge has little to do with whether the public or private sectorsdeliver infrastructure. An environment that’s lousy for the private sector is equally lousy for thepublic sector. Addressing the challenge depends rather on whether governments have long-termeconomic vision, can plan for the future, acknowledge the importance of efficiency incentivesfor infrastructure, and are intent on ensuring sustainable infrastructure financing mechanisms.
The funding story
East Asia’s funding challenge is to resource estimated infrastructure needs of approximately$200 billion annually over the next five years. It is estimated that 65 percent would take theform of new investment, with the remaining 35 percent channeled towards maintenance ofexisting assets – an equally, and sometimes more cost-effective way of meeting service goals(Figure 1.10, and Chapter 1, Annex 1).
Ultimately there are only two sources from which these needs can be funded: consumers (viauser changes) and tax-payers (via subsidies). Financiers – whether in the private sector or in thedevelopment community – can change the requisite time profile of taxes or user charges, but
Executive Summary
8
eventually their contributions have to be repaid or remunerated (and if they aren’t, theconsequences will generally rebound on consumers or tax payers at some later point) (Figure1.11).
When consumers pay for infrastructure: Charging consumers for use of infrastructure services iscommonplace. The challenge is deciding the degree to which their contributions cover costs. Theability of infrastructure providers to cover costs varies by sector. In the water sector, for instance,it is unclear that any East Asian water utilities have achieved full recovery of operational andcapital costs (Figure 1.12). Non cost-reflective tariffs may arise for a number of reasons: theymay reflect excessively high costs of inefficiently run services; or they may reflect costs that arehigh for good reason. Sometimes tariffs are low for political reasons (as we saw above), andsometimes they are kept low to protect the poor. There is general consensus now thatconsumption of services by the poor can and should be subsidized, although there areconsiderable challenges in targeting the benefits of below-cost consumption.
When tax-payers pay for infrastructure: Subsidizing infrastructure from taxes raises microissues, among which: ensuring that subsidies are channeled to expenditure with the highestreturns; ensuring transparency; designing exit strategies; and balancing the emphasis oninvestment and maintenance. These are picked up in more detail in Chapter 4 on riskmanagement and accountability. It also raises macro issues: whether too much subsidization ofinfrastructure threatens fiscal stability, or whether too little endangers economic growth andpoverty reduction. These are picked up in more detail in Chapter 3, on coordination.
When the private sector finances infrastructure: The private sector has invested approximately$190 billion in East Asian infrastructure since 1990 (Figure 1.8). This is a minor share of theregion’s needs, and a minor share of total infrastructure investment in the past. Since the Asiancrisis, private sector investment has diminished significantly (although signs of upturn are nowevident). A survey undertaken for this study, however, shows that private sector sentimenttowards East Asia is optimistic, but varies by country, and is contingent on policy improvements,and reduced risk (Figure 1.14). The key issue is not whether financing should be public orprivate, but how they share the risks and rewards in a way that works for both sides. Financingand ownership is secondary.
When official lenders and donors finance infrastructure: In purely monetary terms, the role ofofficial lenders and donors has never amounted to more than a few percent of total infrastructureneeds overall (although this varies considerably by country). Official financing fell temporarilyafter 1997, but is again on the rise, as the contribution of infrastructure to poverty reduction –indeed, of growth to poverty reduction – has been reappraised. In most infrastructure sectorsthere are activities in which private sector interest is likely to be limited, and others in whichprivate interest needs external support. Development agencies can have an important role to playin both cases. The challenge is how to focus those relatively small amounts of official financingso that their role is maximized: in stimulating experimentation and innovation, supportingefficiency gains, mainstreaming environmental and social considerations, attracting privateinvestors to share risks with the public sector, and building effective institutions to plan,coordinate and regulate infrastructure services. We will pick up this story again in Chapter 5,where we look more broadly at the role of development agencies.
Executive Summary
9
Chapter 2: Inclusive development
At the core of this study is the idea of the role of infrastructure in fostering inclusivedevelopment. We think of inclusive development as growth, plus sharing the benefits of growthto reduce poverty. As we shall see, infrastructure helps connect growth to the sharing of benefits,thereby making development more inclusive.
Infrastructure is highly intertwined in our lives. Knowing that infrastructure is important per se iseasy. Measuring the precise importance of a particular piece of infrastructure is very difficult.But choices need to be made about infrastructure, and so we need to know what the impacts are,how they are channeled, and what they depend on.
We can look at this in a number of ways. This study is primarily about how infrastructureconnects. Conceptually, we can think about the connecting role that infrastructure plays in aseries of mutually reinforcing relationships that link growth and poverty reduction – a subject onwhich the development world is coming to broad consensus.
In the first place, infrastructure provides people with the services they need and want. Theabsence of some of the most basic infrastructure services is an important dimension of what weoften mean when we talk about poverty. But infrastructure also has an important impact onpoverty through growth. Infrastructure both is an input into production, and raises theproductivity of factors of production. And through its impact on welfare, it provides people withthe capabilities to fill (and create) jobs. Infrastructure connects goods to markets, workers toindustry, people to services, the poor in rural areas to urban growth poles. Infrastructure lowerscosts, and it enlarges markets and facilitates trade.
In sum, infrastructure both impacts directly on poverty through services, and supports theprocesses of growth on which much poverty reduction depends. And at its best, infrastructuredraws poverty reduction, service provision and growth into a reinforcing cycle (Figure 2.1).
A large empirical literature documents both impacts of infrastructure on poverty reduction, andon growth. The specific impact of infrastructure on poverty in particular has been studied in anumber of ways, and departs from how one defines poverty. The narrowest poverty definitionfocuses on the incomes and livelihoods of people living below the poverty line, and so isconcerned with how infrastructure increases real incomes of the poor. But another literaturelooks at poverty more broadly, reflecting some of the key dimensions mentioned in theMillennium Development Goals (See box 1). And broader still, a third strand focuses onenhancing social inclusion, human capabilities and freedoms, focusing, for instance, on theimpact that transport and telecoms might have on people’s ability to engage in collectiveactivities, or to access wider sources of information.

Executive Summary
10
Box 1: Infrastructure and the MDGs
The Millennium Development goals(MDGs) – the international community’sagreement on the goals for reducing
poverty – comprise eight objectives to beachieved by 2015. They are:
1. To eradicate extreme poverty andhunger
Halve the proportion of peopleliving on less than one dollar a dayHalve the proportion of people whosuffer from hunger
2. To achieve universal primaryeducation
Ensure that boys and girls alikecomplete primary schooling
3. To promote gender equality andempower women
Eliminate gender disparity at alllevels of education
4. To reduce child mortality
Reduce by two-thirds the under-five mortality rate
5. To improve maternal health
Reduce by three-quarters the maternalmortality ratio
6. To combat HIV/AIDS, malariaand other diseases
Reverse the spread of HIV/AIDS
7. To ensure environmentalsustainability
Integrate sustainable developmentinto country policies and reverseloss of environmental resources
Halve the proportion of peoplewithout access to portable water
Significantly improve the lives of atleast 100 million slum dwellers
8. To develop a global partnershipfor development
Raise official developmentassistance
Expand market access
How does infrastructure relate to theMDGs, and how is this relationshipaddressed in this study?
Poverty and infrastructure are atthe core of the concept of inclusivedevelopment around which this reportis written. In chapter 2, where we setout what inclusive development mightmean, we look at poverty from threeangles, and consider howinfrastructure in each of the sectorsmakes an impact.
And some of the channels are notas obvious as might be expected. Itmay seem intuitive that the ability ofpeople to earn a living is increasedwhen transport, information, powerand water are readily available. Butinfrastructure has some less obviousimpacts – one study we refer to, forinstance, looks at the impact oftransport and electricity on education.
And the impact of health services maybe similarly affected by the ability ofthe poor to access facilities. A road, atelephone call, can make an enormousdifference.
Poor access to water andsanitation is an important part of whatwe mean when we talk about poverty,and is addressed in the EnvironmentMDG. But the role of infrastructure inthe environment is much wider thanthis. In Chapter 1 we focus on thechallenges of mainstreamingenvironmental issues, although theenvironmental theme cuts across thisstudy.
Finally, the role of infrastructurein creating livable cities, andproviding service to slum-dwellers, isa theme of chapter 1, and ourdiscussion of urban management inChapter 3.

Executive Summary
11
Impacts vary by each kind of infrastructure (Table 2.1). Overall, the literature suggests thattransport, telecommunications and electricity are very important overall for growth and povertyreduction, and that rural roads, water and sanitation are critical for reducing poverty of the verypoorest. Most importantly, however, it emphasizes that most infrastructure is effective only whencombined with other interventions.
This does not imply, however, that everyone benefits from investment in infrastructure, nor eventhat the benefit are shared equally. Infrastructure undertakings – like all projects and sectoralreforms – have winners and losers. At the same time, there may be genuine choices to be madebetween infrastructure investments that impact on growth, and those that impact on povertyreduction. Finally, institutions often face difficult trade-offs between the interests of differentgroups of poor and non-poor. Participation of affected groups in decision making can help ensurethat equity is achieved (a theme we pick up in Chapter 4 on accountability and riskmanagement).
We can see how infrastructure fosters inclusive development at various levels. In this study welook at this from the regional level, and from a detailed country perspective.
Getting the goods to market has been the key to East Asia’s prosperity. Trade has been crucial torapid growth, and trade expansion (particularly exports to China) will continue to be important.The ability of poorer countries to share in this process will depend in part on their ability todevelop infrastructure that supports regional trade opportunities. For the most isolated and land-locked, regional infrastructure cooperation will be crucial.
Superior logistics has played an important role in supporting this regional story. This isparticularly so in the region’s most advanced developed economies, but also in a number ofdeveloping countries – Malaysia, Thailand, China and the Philippines (Figure 2.2).
But right now, the efficiency of East Asia’s logistics is falling behind. Of course, performancevaries across countries (Box 2.5). In general, however, increased logistics costs stem frominadequate transport infrastructure, underdeveloped logistics and transport services, andbureaucratic (and sometimes corrupt) import and export procedures.
Issues of coordination – the subject of Chapter 3 – feature prominently in the broad measuresrequired to address East Asia’s logistics challenges. This requires, in particular, coordinationacross national boundaries (in harmonization and simplification of customs procedures, forinstance, or information sharing), and in urban management (most importantly, in theimplementation of land use policies for the location of logistics infrastructure).
From the regional to the country specific: Vietnam serves as an excellent example of howinfrastructure can foster a sharing of the benefits of growth. Over the last decade Vietnam hasgrown at an annual average rate of 7.6 percent, placing it among the fastest growing countries inthe world. Economic development has been remarkably pro-poor, lifting around 20 millionpeople out of poverty in less than a decade.
Executive Summary
12
Infrastructure and investment have been an important part of that process, complementing thecountry’s many targeted poverty reduction initiatives. Forty four percent of governmentinvestment has been targeted to infrastructure. Impacts on poverty have are well documented forinfrastructure undertakings of both large and small scale. Improvements to National HighwayNo. 5, linking Ha Noi and Hai Phong Port, for instance, is associated with significantly higherper capita incomes and poverty reduction in the Hanoi-Hai Phong corridor. Studies of small scaleinfrastructure have revealed similarly impressive impacts, again most prominently in roads. Onestudy finds, for instance, that the establishment of a new road in a village raised the per capitaincome of households by 30 percent between 1993 and 1998 (see Chapter 3 for details).
Chapter 3: Coordination
The East Asian experience demonstrates that the “big picture” is at least as important as thequality of a specific infrastructure ministry or service provider. The big picture is aboutgenerating strategic vision, and the state’s ability to turn that vision into reality. This is what wemean by “coordination” – the focus of Chapter 3.
The advanced economy coordination model
Strong coordination is a prominent feature of the infrastructure stories in the region’s now-developed economies – Hong Kong (China), Taiwan (China), Japan, Korea and Singapore – aswell as in the most advanced developing economy, Malaysia.
In these six advanced economies, political leaders and senior policymakers played a major rolein creating long-term development visions, and the sectoral strategies that flowed from thatvision. Each country had strong planning agencies to drive infrastructure development, and theseagencies enjoyed considerable political influence – Korea’s Economic Planning Bureau,Singapore’s Economic Development Board, Malaysia’s central planning agency andpolicymaking body in the Prime Minister’s Office, or Japan’s strong sector ministries andadvisory boards. Sustained periods of high growth helped create the policy consensus behindinfrastructure investment to support that growth, while the discipline of needing to remaincompetitive helped inject efficiency into project choice and service delivery.
Sometimes infrastructure investment anticipated demand. But when investment was reacting toconstraints – as was still largely the case – reactions were rapid and strategic. A number of boldinfrastructure projects were undertaken – the Kobe Nagoya Highway in Japan, or the SeoulPusan Highway in Korea – although inevitably there were some white elephants.
Sector strategies tended to adapt as production structures changed, as opposed to piecemealadaptations. Much of the workings of this model was hidden from view, with individualaccountability being largely internal to an elite, as long as the broader public were enjoying thebenefits of growth.
By the 1980s, however, the strains and contradictions of the model were beginning to show. Itdid not deal well with financial crisis or slowdown, revealing risks that had been hidden until

Executive Summary
13
then. Government-directed lending from the financial sector, lack of transparency and corporategovernance failures all began to prove problematic. In some cases, strategic investment provedsupply-driven, and cases of cronyism and corruption were not unknown.
As the state’s role became more complex, and its objectives more diverse, its ability to squeezeefficiency gains from the existing system of public sector monopolies. Greater complexity meantthat the state at the centre needed to focus more exclusively on the big picture, and delegate moreof the details: to companies, regulators, local governments, civil society and markets.
Key aspects of the developing country coordination challenge
A number of East Asia’s developing countries appear to be pursuing similar models in theirinfrastructure development strategies. In doing so, they face a number of challenges – some ofthem new, some of them similar to those faced by the more advanced economies. They includethe coordination challenges involved in getting levels of infrastructure expenditure right, ofcoordinating through decentralized government structures, and in particular, of coordinatingurban infrastructure.
Getting infrastructure levels right requires various kinds of coordination. One of the reasons thatgovernments sometimes spend too much, or with unacceptably high levels of inefficiency, ispoor coordination between planning and financing agencies. The separation of planning andfinancing functions is a common feature of planning frameworks in the region, and in a numberof cases – Vietnam and China provide good examples that we draw on in the chapter – gives riseto poorly and inefficiently resourced infrastructure undertakings. These often have implicationsfor fiscal and financial stability, as well as for related sectors – the construction sector inparticular, in the case of Vietnam.
Other kinds of coordination failures may be responsible for expenditure levels that are too low,particularly in times of fiscal retrenchment. When budget deficits need to be cut, infrastructureprojects are frequently a target – because they’re large and lumpy, and their benefits take years tomaterialize. But infrastructure investments typically have very high rates of return, and cuttingsuch projects may in fact jeopardize long-term fiscal solvency. Agencies responsible for fiscaladjustment therefore need to coordinate long-term fiscal policy with those responsible forinfrastructure development spending. But liquidity crises can also force infrastructure reform.And central agencies need to coordinate with agencies in the infrastructure sectors to ensure thatreform is promoted as much as possible, and to ensure that liquidity pressures don’t just shiftstate liabilities off-budget.
While the challenges of coordination in getting infrastructure levels right are not new, those ofcoordinating through decentralized government are. Twenty years ago East Asia was highlycentralized. But today, subnational expenditure as a percentage of total expenditure ranges from10 percent in Thailand, to 70 percent in China.
Decentralization can bring significant benefits, by tailoring service provision to the needs oflocal constituencies. But it raises a number of problems for coordination. The first of these ismanaging spillovers in service provision – i.e. cases when projects bring benefits, and incur

Executive Summary
14
costs, outside of any single jurisdiction. Voluntary cooperation between local governments isunfortunately rare. Local governments largely lack the necessary short-run political incentives tocooperate, and governments therefore have to develop adequate coordination tools: Thailand’sand Vietnam’s matching grants are one example; the creation of special districts and regions inthe United States and Canada present another model that might be adopted in the region.
Other inefficiencies that arise from poor coordination include excessive fragmentation (whenmunicipalities are too small to provide services at efficient scale), and “destructive competition”(when local governments compete to build or upgrade prestige investments like ports or airports,rather than relying on facilities in adjacent jurisdictions). Central governments have an importantrole to play in filling in the “missing middle” of coordination.
These coordination problems are essentially challenges of horizontal coordination – coordinationbetween jurisdictions. Similar problems present themselves in vertical coordination –coordination between central and local levels of government. Central governments have a keyrole to play here in ensuring that local government infrastructure is in line with policy andregulatory frameworks. When fiscal and regulatory policies are poorly coordinated, and centralgovernment providing financing, while local government service delivery, local governmentshave little incentive to achieve efficiency gains – and sometimes even respect private sectorcontracts. And this situation is exacerbated in the absence of effective reporting, or expendituretracking mechanisms.
The third key coordination challenge is the challenge of coordinating urban infrastructure –arguably the most complex coordination issue, given the pace of urbanization, and the number offunctions that need to be aligned.
Effective land-use management is the key to urban planning, but insufficient legal frameworks,deficient application of existing restrictions, and political intervention frequently hamper urbanmanagers. Weak outcomes can be exacerbated by poor timing. When urbanization precedes theinvestment necessary to make for living cities, the costs of improving infrastructure tend toescalate significantly, and retrofitted infrastructure solutions tend to be sub-optimal.Coordination between multiple agencies (at least 27 related to urban transport in the case ofurban transport in Bangkok, before recent reforms), and across urban boundaries present furtherchallenges.
The state of play in the Philippines, Indonesia, China and Thailand
How are the larger developing economies of the region addressing the challenge of coordinatinginfrastructure? The main theme of the Philippines’ experience is that long-term vision anddevelopment plans are often undermined by short-term pressures within a fluid and fragmentedpolitical system, which in turn diminishes accountability and nurtures corruption.
The role of the Filipino planning agency, the National Economic and Development Authority(NEDA), is subordinated in times of bust to the goal of fiscal retrenchment, and in periods ofboom to pressures to support highly-politicized infrastructure projects. Long term developmentplans and budgets frequently bear little relation to each other.
Executive Summary
15
And while the formulation of the national development plan is highly consultative, withsignificant mainstreaming of social and environmental issues, there is a large gap between whatplans say, and how resources are allocated and policies implemented. Civil society’s main wayof impacting on decisions is not primarily through participation in planning, but throughcampaigns and protest at the permitting or implementation stage of infrastructure undertaking.
The effects of weak coordination present themselves across the Philippines’ infrastructuresectors, with significant impacts on investment and competitiveness. The power sector inparticular imposes significant financial pressure on government, and cannot fund neededexpansion. Poor policy coordination has led to generally inadequate space for infrastructureexpenditure, and low levels of private investment: In 2002, total infrastructure investment wasonly 2.8 percent of GDP.
Indonesia’s coordination story is that of an incomplete progression from autocratic technocracyto greater participation and decentralization. In the process, the country’s planning apparatus hasbeen largely dismantled. Under the Suharto regime, policy planning and coordination wascentralized in two institutions that operated more or less in tandem, had substantial ability to planstrategically and oversee the implementation of planning: BAPPENAS, which prepared nationalfive year development plans, and the Coordinating Ministry for the Economy and Industry(EKUIN).
Under the post-Suharto reformasi regime, the power of the planning agencies has beensignificantly diffused. Power has been redistributed downward to local government, and fiscalcrisis shifted influence to the Ministry of Finance, and the central bank. BAPPENAS is now leftwith a planning advisory role, and EKUIN’s successor focuses mainly on short-termimplementation issues.
Fiscal space for infrastructure has been very limited in the last few years, and significantinfrastructure backlogs have emerged. The state’s ability to pursue growth and poverty reductionobjectives through infrastructure provision has become highly constrained since the crisis.
Over the last 10 to 15 years, infrastructure service provision has been increasingly delegated tocorporatized state enterprises or to the private sector, with modest efficiency gains. However,this has been accompanied by little restructuring to allow competition. Nor has the rule of lawyet replaced the rule of a strong leader. The ability of the judicial system or of capital markets tobring better corporate governance, or encourage further private investment, is limited.
The country’s radical decentralization program has laid the foundation for greater governmentresponsiveness to communities, but it has also created considerable uncertainty about inter-jurisdictional responsibilities, and has limited fiscal space for central initiatives.
Since the onset of reformasi, civil society has flourished, and with it a new awareness of localand environmental issues in infrastructure planning and implementation. It has also given rise toexperimentation with community-driven development where the state has failed to deliver – most
Executive Summary
16
prominently in the Kecamatan Development Project (KDP). But the State’s ability to mainstreamthese efforts into policies and programs is weak.
China’s experience differs significantly from that of Indonesia and the Philippines. In China,authority has been extensively decentralized to the provincial and municipal level, but the centreremains substantially in charge, and generates the strategic vision that binds the system together.Accountability is essentially upwards, and civil society’s role is limited. Planning has becomemore strategic and flexible, and market forces play an increasingly important role.
China’s principal planning agency, the National Development and Reform Commission(NDRC), remains powerful and – unlike BAPPENAS or NEDA – has not seen its strategicplanning role undermined.
But infrastructure decentralization in China brings with it a number of coordination challenges.Central government is decreasingly able to control the infrastructure investment choices ofdecentralized government. And the ability of provinces and cities to borrow from the state-owned financial sector for infrastructure investment, with limited credit assessment, haschallenged the Government’s ability to exercise macroeconomic control.
At the same time, China is advancing with measures to strengthen the coordination of inter-jurisdictional infrastructure, with local municipalities beginning to group together in cross-jurisdictional infrastructure initiatives. China is also drawing on the experience of moreadvanced neighboring economies (as well as that of Thailand) in its development of specialeconomic zones.
Like China, Thailand’s record of infrastructure coordination is quite similar to that of theadvanced economies of the region. Strategic long-term vision has played a major role,coordination among technocrats has been effective. At the same time, participation has played afairly limited role, although civil society is active.
However, the relationship between politicians and technocrats has been a changing one, witheach taking responsibility for generating the country’s development vision at different times.With coalition governments weakening the ability of the Cabinet to plan and coordinate for mostof the 1990s, the country’s principal planning agency – the National Economic and SocialDevelopment Board (NESDB) – played a pre-eminent role. But with the dominant control overgovernment of the Thai Rak Thai party since 2000, responsibility for setting strategic visionshifted towards the Prime Minister’s Office, with the role of the Ministry of Finance alsoincreasing in importance. The role of the NEDB was uncertain for a while, although it appears tohave regained some of its infrastructure planning role, and involvement in the country’s newinfrastructure mega-projects.
Decentralization in Thailand has been quite limited. After perceived failures withdecentralization to lower levels of government, decentralization has been focused on the 76provinces. However, the provincial governors are appointed, rather than elected, and their role ismore a deconcentration of central authority than a real decentralization. Stakeholder participationin infrastructure has made significant progress at the local government level. Nationally-initiated

Executive Summary
17
large-scale projects, however, have shown less progress. And although environmental impactassessments are prepared, they frequently take the form of formal attachments to projects treatedby their proponents as faits accomplis.
On the whole, Thailand’s planning and coordination system has been flexible and adaptive. It hasdealt well with crisis and long-term strategy. The system has evolved effectively as the politicalcontext has changed, and strategic vision has usually managed to play a central role.
Chapter 4: Accountability and Risk Management
Coordination is about the big picture. But we also have to think about what happens at the levelat which services are delivered and outcomes achieved. In this study we approach this in terms oftwo inter-linked concepts: Accountability and Risk Management – the focus of Chapter 4.
We can think of accountability as a set of institutional tools which rewards organizations inaccordance with their performance. Governments, communities, investors, service providers,NGOs are all engaged with each other in dynamic tension, with their own goals andexpectations, trying to hold the others accountable for delivery against those expectations. Indoing so they try to maximize their rewards and minimize their risks, subject to the constraintthat everyone else is doing the same thing. This is what we mean by risk management.
Effective accountability and risk management are often most recognizable when they are absent.Most often this takes the form of poor service delivery. In its most dramatic form, we see it infinancial collapse, as one or other stakeholder is shouldered with obligations they cannot bear. Italso frequently takes the form of corruption.
While corruption arises for a variety or reasons, infrastructure has a number of peculiarities thatmake it a frequent target: The monopoly structure of supply can provide significant opportunityfor rent-seeking. The political protection and intervention given to infrastructure often blursfinancial accountability, and provides cover for a range of corrupt activities: corruption inallocating scarce services; overstaffing, excessively high wages. And with difficulties inestablishing the relationship between level of capital investment and service outputs,infrastructure providers can inflate levels of capital spending, or hide under-investment. Finally,the large scale of infrastructure can often create opportunities for large kickbacks associated withprocurement. East Asian infrastructure is replete with examples of these kinds of practices.
Mechanisms to strengthen accountability
Active community participation, competition, and regulation all have important roles to play inavoiding these kinds of outcomes.
For some types of infrastructure services the best way to ensure accountability is to empowercommunities to plan and manage their own infrastructure, and be able to ensure that once built,service delivery remains relevant to their needs. Indonesia’s Kecamatan Development Project is
Executive Summary
18
among the largest and best-known East Asian example, but community participation ininfrastructure is increasingly common across the region.
Community empowerment works best when infrastructure is small scale. For large-scaleinfrastructure, however, sheer scale can make direct community management difficult. But thisdoes not preclude community participation in aspects of infrastructure that affect them – Japanhas useful lessons for the region about how community participation turned around the country’sapproach to environmental externalities.
Competition can also be used to hold service providers accountable. When competition exists,and customers are dissatisfied with a service, they can simply go elsewhere. Although mostinfrastructure networks cannot be provided competitively, services over those networks can.
On the whole, however, East Asia has not been in the forefront of introducing infrastructureservice competition. In telecommunications, competition is still limited by internationalstandards. And in the electricity sector, East Asia has typically brought the private sector intogeneration through the least competitive means possible – through a market structure in which astate-owned single buyer intervenes between private generators and customers.
Across the region, the choice of this model reflects some of the broader reasons behind thelimited introduction of competition in infrastructure: the state’s desire to maintain cross-subsidies for socio-political reasons; monopoly rent-seeking, the protection of incumbent stateenterprises; risk mitigation for the private sector and the political control of strategic assets.
Regulation is a third tool that can be used to hold service providers accountable. Independenceand accountability are traditionally cited as key pre-requisites of regulatory effectiveness. Thereare various ways of holding regulators accountable. Some relate to process and participation:clear statutes, judicial reviews, or subjecting the performance of regulators to independent audit.Others relate to transparency: requiring regulators to publish decisions, licenses andbenchmarked performance.
East Asian countries pursue these measures to various degrees. But infrastructure – in East Asiaas elsewhere – is intensely political, and the accountability of the regulator cannot be divorcedfrom broader institutions of political accountability. Nor can the ability of the regulator to holdservice providers accountable be separated from the political context.
Moving towards regulatory independence is proving slow in East Asia, which is not surprisinggiven the region’s tradition of strong central control. Independence is difficult to measure, but inone survey of East Asian infrastructure regulators, less than 40 percent of them describedthemselves as even nominally independent (See Chapter 4, spotlight 3).
The key issue for East Asian infrastructure regulation is how to accommodate the evolutionarynature of independence. Ensuring that regulators are not given more discretion than the politicalculture can absorb is critical. Leaving the day-today application of regulation of a concessioncontract negotiated between government and service provider one option. Contracting out keyaspects of regulation to third parties, until greater discretion can be allowed is another. And
Executive Summary
19
granting regulators more discretion over time, and liberating them gradually from politicalpressures, could enhance predictability, and reduce policy-based risk that is currently so high inEast Asia.
Risk sharing, accountability and managing government support
Issues of risk management and accountability arise with equal prominence in the relationshipbetween government and service provider, in particular through the support that governmentsfrequently give service providers in the form of subsidies or guarantees.
Subsidizing the provision of services can be important for many reasons. Environmentalprotection and poverty reduction are the least controversial. But it may also be politicallyimportant to retain subsidies captured by influential, non-poor groups, gradually phasing themout over time (particularly if reform will eventually bring benefits that can be sustained withoutsubsidies).
But subsidies have implications for risk and accountability. They weaken the accountabilityrelationship that binds providers and governments, by weakening the incentive to provideservices in the most efficient manner possible. And they can be highly risky: the more you get,the more you ask for.
There are various ways East Asian countries manage subsidies: reducing the need for them byaddressing excessively high costs, through competition, regulation, technology choice or publicenterprise reform; or reducing them directly, by making them transparent (and thus subject toscrutiny), make them as one-off payments, channel them through performance-basedarrangements or adjusting taxes or subsidies on competing products. Cross-subsidies are oneoption of maintaining accountability of the bottom line, although they come with other costs:primarily untransparency, and the difficulty they pose to introducing competition.
But there are a range of less direct mechanisms besides subsidies that provide fiscal support andshare risk – power-purchase obligations in the Philippines, for instance, or Thai governmentbacking for borrowing of the state railways. The accountability issues that these raise are all themore difficult given the contingent nature of the claims to which many of them give rise.
Addressing these contingent liabilities requires high quality fiscal information, utilization of thisinformation during the budget process. Ideally governments should decide on overall ceiling forfiscal risk, issue guidelines on risk assumption to sector agencies and local government, monitorrisk, and require approval of assumption of risk.
Many governments in the region have resorted to risk-sharing transactions with the privatesector, rather than undertaking investment through the budget, to get an expenditure “off thebooks”. But whether this improves solvency, as well as liquidity, depends on whether transfer ofrisk to the private sector really brings efficiency gains.
This depends on the accountability framework for service providers. In East Asia’s electricitysectors, for instance, governments frequently have to provide guarantees, because they prevent
Executive Summary
20
private sector participants for competing for lucrative parts of the market. Here efficiency gainsare likely to be limited, and governments are left carrying most of the risks.
Who in fact carries risk, however, is not always clear. Risk is hidden in certain arrangements,and is more open under others. And risks are often reassigned in the lifetime of a concessioncontract, in response to shocks, but equally as part of a learning process involving bothgovernment and private sector provider.
And so to the eternal ownership issue. Are privately-owned infrastructure service providers moreor less accountable for performance than publicly-owned ones? Accountability cannot bemeasured directly, but performance can be. Empirical evidence shows that private providersperform better on average, when the incentive environment gives them a good reason to do so,but private ownership on its own doesn’t seem to make much difference. But when ownership ispublic, and markets are not competitive, accountability is a considerable challenge indeed.
In other words, ownership does not generally matter by itself. We have seen plenty ofdisappointments in private provision in East Asia. What does matter, however, is that privateprovision tends on average to respond better to competition and well-crafted regulation than doespublic provision. In short, it is easier to use incentives to hold the private sector accountable forperformance than to do so for the public sector.
Outgrowing the top-down model means greater delegation, and use of decentralized incentivemechanisms. The more this happens, the more necessary it will become to attract the privatesector, if infrastructure provision and efficiency are to keep pace with East Asia’s needs. Butthis time around, private participation should come with competition and good regulation.
Chapter 5: The way forward
The framework set out in this study is analytical. It suggests a way of approaching problems, butis not a “tool kit” for implementing particular policies. Nonetheless, the framework hasimportant policy implications. Here we trace out twelve of them. These reflect key concernsarticulated in the consultations undertaken in preparing this report, with the region’s policymakers, policy implementers, infrastructure service providers, civil society organizations andother stakeholders.
The twelve policy messages constitute an approach to strengthening infrastructure’s contributionto inclusive development, as set out in Chapter 2. They promote the role of infrastructure inunderpinning growth and poverty reduction. Infrastructure does not lead to inclusivedevelopment on its own – it requires actions that support the delivery of services to the poor whoneed them, and that underpin the growth dynamics on which improvements in welfare depend(Box 5.1). What do we need to think about in order to do this?
The discussion of coordination in Chapter 3 provides the basis for three of the policy messagesarising from the framework. In Chapter 3 we saw how strategic vision has proved crucial forensuring the effectiveness of infrastructure interventions. We also looked at a number of the

Executive Summary
21
challenges that arise in formulating and implementing this vision – coordination across financingand planning institutions, coordination across infrastructure and fiscal institutions, andcoordination across decentralized government. The analysis set out in Chapter 3 gives us thefollowing three policy messages:
Infrastructure provides basic services on which survival and livelihoods depend; infrastructure isthe backbone of economies and societies; infrastructure has major environmental impacts;infrastructure can bring powerful monopolies and foreign participation into areas of greatsensitivity. As such, infrastructure is intensely political.
But infrastructure is also economically and technically complex, and has very long-termimplications. So the technocrats have a critical role to play also, to complement the role ofpoliticians. This extraordinary blend of technocracy and politics places a premium on high-level,central institutions, which can articulate strategies that are politically sustainable andeconomically effective.
Institutions that can formulate those long-term strategies, and can coordinate the policies ofdifferent agencies to implement them, are essential to effective infrastructure service provision.Objectives that move beyond the purely economic, to mainstream environmental and socialconsiderations, demand higher levels of coordinating capacity than hitherto. Sector ministriesand local governments cannot work in policymaking isolation.
Old top-down models of detailed economic planning should be eschewed, but new models ofstrategic planning and central coordination need to evolve. This should underpin tendenciestowards democratization, decentralization, independent regulation, private participation, and thecommercialization of service providers.
There has been substantial decentralization of government in East Asia, and this has oftenincreased the responsiveness of infrastructure service provision to local needs. Decentralizationhas undoubtedly played an essential political role.
However, decentralization poses a number of coordination challenges, both vertically (betweencentral and local governments) and horizontally (between various sub-national institutions).
Decentralized governments have sometimes been isolated within their own jurisdiction. This isproblematic since most network infrastructure has inter-jurisdictional backbones. Isolation can
1. The center matters – infrastructure demands strong planning and coordinationfunctions
2. Decentralization is important – but raises a host of coordination challenges
Executive Summary
22
mean secondary or tertiary infrastructure lacks connections to primary infrastructure – in a sense,it goes nowhere. Some municipalities may be too small to achieve the scale necessary to deliverinfrastructure efficiently. In competing with each other, municipalities may duplicate expensiveinfrastructure facilities, when such facilities could in fact have been shared. Avoiding thesepitfalls depends critically on inter-jurisdictional cooperation – on filling in the “missing middle”.
Higher tiers of government need to encourage lower tiers to collaborate where primaryinfrastructure requires such collaboration. Matching grants to induce decentralized governmentsto participate in such investments, and institutional mechanisms to encourage cooperation ininfrastructure planning will play a major role.
Central governments also have to ensure that they maintain sufficient capacity to monitor,manage and coordinate, in line with policy and regulatory frameworks. The inadequacy of suchsystems is a frequent cause of sub-optimal service delivery, and confused authority.
Ultimately all infrastructure is paid for by users through tariffs or taxpayers through subsidies.Covering costs through user charges is a critical long-term objective. In the short-term, usercharges might be legitimately constrained by a variety of factors (see below under “subsidies”)or large investment needs might require upfront financing to be recovered gradually from usercharges.
Sometimes those financial shortfalls can be filled by the private sector, but sometimes privatefinancing will be insufficient, unavailable, or unacceptably expensive. Even where the privatesector comes in, it often requires risk-sharing with the public sector. Where the private sectorcannot or will not provide all the financing or bear all the risk, investments with adequateeconomic rates of return should be allocated fiscal space.3
Adequacy will of course depend in part on competing claims from non-infrastructureexpenditures, and from the need to keep fiscal deficits low. It will also depend on the veracity ofthe claim that user charges or private financing cannot fill the gap; sometimes it requires fiscaltightening to induce sector agencies to make reforms and seek other sources of funds.
In some East Asian countries, expenditure on infrastructure appears to have been less thanoptimal in recent years. Cambodia, Indonesia, Lao PDR, the Philippines, and Thailand could becandidates for that list. This may have undermined economic growth and poverty reduction, andeven long-run fiscal solvency.
This does not of course mean that more fiscal space for infrastructure should be the first step inthose countries. In several cases, fiscal tightening for macroeconomic stability and debtsustainability would take higher priority. In most cases, there is scope for stronger promotion of
3 The term fiscal space covers all forms of fiscal support including guarantees and other contingent liabilities, aswell as direct expenditures.
3. Fiscal space for infrastructure is critical

Executive Summary
23
private financing in infrastructure and for higher user charges. And there can be scope for costreductions, or better management and maintenance of existing assets. In some cases,strengthening public expenditure management should come before more public expenditure.Countries can easily veer from underspending to overspending if adequate institutions andcontrols are not in place.
But if and when those difficult preconditions are met, governments should allocate fiscal spacebased on long-run growth objectives and in pursuit of fiscal solvency. Infrastructure spending onworthwhile projects can create a virtuous circle: more growth, more fiscal revenue, more fiscalspace. The challenge of course is to select the right projects - and put in place the policy andinstitutional frameworks that actually make them worthwhile.
*
Our discussion of accountability and risk management in Chapter 4 provides the basis for fivefurther policy messages. In this chapter we looked at the a number of mechanisms through whichaccountability in infrastructure service provision can be strengthened – through the community,through regulation and through competition - and how accountability and risk managementarrangements can play out when governments provide support to infrastructure providers. Theanalysis set out in this chapter supports the following five policy messages:
Infrastructure subsidies can be justified on a number of grounds including environmentalprotection and poverty reduction.. People often won’t pay the full cost of sanitation, mass rapidtransit, or renewable energy although they would enjoy the environmental benefits. Where thosebenefits are external to consumers, subsidies may be needed to realize the benefits. Clean wateror rural roads may have an important impact on poverty, but not be affordable by the poorwithout subsidies. And reform programs that help the poor or the environment may not bepolitically sustainable without subsidies for those with the power to derail the reforms. Similarly,transitional subsidies may sometimes be worth considering during short periods of economiccrisis.
But subsidies can become open-ended and addictive, their fiscal impact can explode, they canundermine financial discipline and blur accountability, they can postpone much-needed reform.Subsidies need to be employed with great care.
Subsidies should be a last resort after costs have been minimized through competition,regulation, appropriate technology and service standards, or public enterprise reform. Subsidiesthemselves can be minimized through transparency, making them contingent on performance, orthrough subsidy bidding processes.
4. “Subsidy” is not a dirty word – subsidies can be important, but are always risky, andshould be handled with care

Executive Summary
24
Where competition is not yet firmly in place, regulation of monopoly will be needed. Regulatoryindependence from politics is an important long-term goal to ensure service providers can covercosts and earn an adequate return on investments. However, regulators can establish theircredibility with consumers, politicians, and investors only gradually. If regulators exercise morediscretion than the political culture can absorb, a backlash can occur, creating unpredictabilityand instability.
Regulatory independence is a relative concept, and independence should grow step-by-step.New regulators should rely much more on transparent rules than on discretionary power, andsome responsibilities should be delegated to outside experts until in-house capacity can be built.Credibility, and hence independence, can be enhanced by transparency: hearings should bepublic, contracts and licenses should be also wherever possible. Accountability for regulators iskey to their independence.
Infrastructure is quite often a natural monopoly, but institutional and technological innovationare expanding the potential for competition. It is now feasible to provide most infrastructureservices competitively (if not always the infrastructure itself). The most direct, and hence mosteffective, way of holding service providers accountable is through competition.
East Asia has been very cautious about the introduction of infrastructure service competition; ithas often preferred to “throw” more infrastructure at a problem rather than provide incentives formore efficient infrastructure services, or to address the political economy obstacles tocompetition.
This approach may have been effective when basic infrastructure was being built, wheneconomic objectives were relatively simple, and when top-down command solutions prevailed.But as complexity increases those approaches can be expected to work less well, and the role ofcompetition will need to increase also.
Local communities within civil society can often manage local projects. They can participate indecision-making about the large infrastructure networks which touch their community, or those
5. Regulatory independence matters more in the long-run than in the short-run
6. Competition is hard to achieve in infrastructure – but it’s the best way to bringaccountability
7. Civil society has a key role to play in ensuring accountability in service provision

Executive Summary
25
aspects of large projects which affect them directly. They may need special protection, as longas the larger needs of society don’t get lost.
Civil society can play an important role in accountability of infrastructure institutions throughparliaments or through consumer participation in regulation. Civil society organizations andNGOs can provide small scale infrastructure services, be a watchdog against corruption andvested interest, and play an advocacy role for more sustainable infrastructure policies andservices.
Advocacy NGOs face difficult choices between representing the interests of specific groups orissues, and representing the interests of society at large. How effectively and accountably theymake those choices can have a significant impact on development outcomes.
Infrastructure is often provided by monopolies, and can generate large rents. It often providesvital services, which are highly prized and highly political. As a result, financial discipline canbe weak, political intervention intense, and rent-seeking prevalent. And the benefits ofinfrastructure can be easy to claim and hard to verify.
This combination of circumstances can create fertile ground for corruption. But that corruptiondiscredits the very infrastructure on which it preys. This can undermine the politicalsustainability of infrastructure development, and deter those investors and financiers concernedabout reputational risk and the other costs of corruption.
Combating corruption is a long, hard struggle requiring strong top-down political commitment.Major reforms of the judiciary and civil service lie at the heart of any anti-corruption effort. Butwhile these longer-term reforms are being put in place, significant progress can be made byremoving rent-seeking opportunities and exposing transactions to public scrutiny.
*
Four further policy messages derive from analysis developed across this study, although they alltake their departure from what we described as the “funding story” in chapter 1. Here we sawthat infrastructure can only be funded from two sources: the resources of consumers, and theresources of tax payers. But infrastructure can be financed by two other actors – on the one hand,the private sector (which may also be service providers), and official lenders and donors on theother. The policy messages are as follows:
In some places the private sector won’t come in sufficient scale, or will only do so on terms thatare politically unacceptable (at least to specific groups with strong voice). This is likely to be
9. Public sector reform matters – but be realistic
8. Infrastructure has to clean up its act - addressing corruption is a priority
Executive Summary
26
particular relevant to countries with small markets (population or purchasing power), thosewhich are emerging from conflict, those where ideological opposition to private or foreigninvestment is particularly strong, or where adjustment of large state-owned infrastructure ispolitically difficult because of employment effects. In some sectors, natural monopoly remainsstrong, so competition to induce the efficiency gains from private participation is not yetpossible.
In sectoral terms, water and sanitation, large-scale hydropower and electricity transmission, sometypes of transport, and rural or cross-border infrastructure seem to have the hardest timeattracting private investment, or using it to promote efficiency (although with notableexceptions). In those situations reform of the public sector may sometimes be the most feasibleoption for efficiency gains, at least in the near term.
But public sector reform is difficult to achieve, and even harder to sustain, so keep expectationsmodest. If the private sector can’t be attracted because the state is unpredictable and lacksvision, or because tariffs plus subsidies are below costs, then public sector performance is likelyto be disappointing also. Even if costs are covered, public resources may be better used insectors other than infrastructure. The alternative of more thoroughgoing reform in the medium-term to attract private investment should always be kept in mind.
Private investment in East Asian infrastructure peaked in 1997, and declined dramaticallythereafter. It is now showing modest signs of recovery, but has not come close to matching thelevels initially expected in the mid-1990s.
A perceptions survey was carried out for this study amongst 50 private companies active orinterested in East Asian infrastructure investment. One survey response shone out above allothers: a large majority of investors said they were keen to invest, and would do so if policieswere more predictable.
The private sector has certainly not disappeared from East Asian infrastructure, but nor is itactually making large investments. More predictable policies would bring it back. Moreover, ifit came back, better regulation or more competitive market structures would help ensureefficiency gains from its return.
East Asia’s success is built in part on channeling high savings into domestic investment ininfrastructure. The 1997 crisis underlined that domestic savings tend to be less footloose thanforeign savings, and that domestic currency financing is less exposed to foreign currency risk.
10. The private sector will come back – if the right policies evolve
11. Local capital markets matter – but are not a panacea

Executive Summary
27
As domestic savings become scarcer, their efficient allocation becomes more necessary. Asgovernment functions become more complex, the delegation of resource allocation and riskassessment becomes more important. For all these reasons, the contribution of the domesticfinancial sector to infrastructure development needs to grow.
Government will obviously play an important role in domestic financial sector regulation andencouraging financial innovation, as well as in promoting regional capital market initiatives. Incountries where the policy – or quasi-fiscal - role of the financial sector has led to high levels ofnon-performing loans to infrastructure, commercialization of the sector will be a high priority inthe near term. That will restore health to the financial sector and financial discipline to theinfrastructure sector.
But to promote the financial sector’s contribution most effectively over the long-term, policies toimprove the investment climate for infrastructure should take the highest priority. Trying tomake a bad infrastructure project work through financial engineering can have only limitedeffect; making it into a good project through reform beyond the financial sector will usually havemuch greater impact.
The development community is now reasserting its role in infrastructure in East Asia. Butinfrastructure is a long-term asset, and development partners need to stay for the long haul.Reliable partnership – with quick response and harmonized procedures – is critical. Moreover,the nature of this partnership (financing, guarantees, policy advice, capacity building etc.) willhave to be tailored to country conditions. The needs of East Asia’s large, middle-incomecountries are very different from the smaller and poorer countries in the region.
Official development assistance (ODA) accounts for only 1.2 percent of gross investment in lowand middle income countries of East Asia. However, aid financing plays a much moresignificant role in the poorer countries of the region, accounting for more than half of grossinvestment in Mongolia and Cambodia. Aid flows also play a significant role in most PacificIsland countries, Timor Leste, Papua New Guinea and Lao PDR. The level of aid, and how it isallocated (including the share for infrastructure), plays a big role in the public spending andinvestment priorities of these countries.
The case for official financing obviously depends on how well it can be used, the availability ofother sources of financing, and the overall debt position of the government. The level of aidusually declines, and the blend of loans and grants usually becomes harder, as income levels risein recipient countries. However, even higher-income countries may see benefits in tappingofficial financing to ease the debt burden on their budget and to catalyze private sources offunds. The technical assistance embedded in aid-financed projects – for project preparation,environmental and social assessments, and procurement practices – can also be beneficial forshaping the government’s overall policies and procedures.
12. Infrastructure needs reliable and responsive development partners

Executive Summary
28
During the 1990s, some key development partners in East Asia refocused their efforts away frominfrastructure, at least from infrastructure on a large scale. It was felt that poverty reductionshould be more targeted or that the private sector would step in to finance infrastructure projects.This tendency was intensified by the 1997 financial crisis, as the creditworthiness of affectedcountries and many infrastructure service providers declined. Aid financing in crisis-affectedcountries shifted to program support, as budgets were cut and new investments in infrastructurewere sharply curtailed.
The role of official financing for infrastructure is now being reappraised. It is acknowledged thatgrowth is crucial to poverty reduction, that targeting complements growth, and that infrastructureis essential for both. The private sector did step in, then partly stepped out, and may step back inagain. But even when it was at its peak, it was still a relatively minor player in financing terms,especially in the poorer countries of the region, and official financing could be helpful forcatalyzing private investment anyway. Some countries are now emerging from fiscalcompression and need official financing to catalyze both the private sector and provide morefiscal space for infrastructure spending. Support for more complex projects and new approachescan be particularly valuable.
As official financing for infrastructure increases again, it’s important that it is used in a way thatmaximizes development impact. In the past, infrastructure projects have not always been welllinked to a country’s overall development and poverty reduction strategy. Aid must be used tosupport (rather than undermine) good policies. In some cases, this may mean funding sectoralprograms, including recurrent spending for operations and maintenance and even subsidies. Thebroader impact of large-scale projects on government revenues must also be taken into account(as we saw in the case of Nam Theun 2, Chapter 4, Box 4.6).
Some development agencies can also provide instruments to back up government commitmentsto the private sector, at a time when credibility with the private sector is still being established(e.g. guarantees, insurance, official lending to the private sector). The overall case for the use ofthose instruments depends on a number of factors: First, the economic justification for theproject; second, the proper allocation of risks between stakeholders and the ability to structurethe guarantee so as to strengthen rather than dilute operators’ incentives to deliver; and third, arobust budget framework for managing any contingent liabilities arising from governmentcommitments.
However, in no case should such instruments substitute for good policies. Sound policies canreduce risks and demonstrate the government’s commitment to reform. They are therefore morevaluable to investors than official agency support per se.
Finally, development agencies can provide important knowledge on what works and whatdoesn’t work in different countries and sectors. Some of this knowledge comes from higherincome countries that have been there before – and learnt from their mistakes and successes. It’stherefore important that countries like Singapore and South Korea stay engaged with the broaderdevelopment community.

Executive Summary
29
The type of knowledge needed will also vary by country – from basic institution and capacitybuilding in poorer countries to more sophisticated market instruments in middle-incomecountries. For the latter, innovative ways are needed to mix up private and public financing toextend maturities for long gestation projects. New approaches to developing financingmechanisms at sub-sovereign levels also need special attention.

Executive Summary
30

The Infrastructure Challenge
31
1. The Infrastructure Challenge
East Asia’s recent development performance makes for impressive headlines: As a group, theeconomies of the region have grown by over 7 percent annually over the last fifteen years. And thenumber of people living on less than $2 a day has fallen by more than 250 million4.
The story is similar in its infrastructure performance: With investment exceeding 7 percent of GDPannually in some countries. With a doubling of electricity generation capacity in only a decade inothers. Increases in road networks of between 25 percent and 100 percent in still more.
Beyond the headlines, however, the story is more complicated. With large numbers of peoplesurviving on under $2 a day in even the fastest growing countries of the region, the remainingchallenges are daunting.
And much of the aggregate growth and poverty reduction numbers are driven by a single country -China. Behind the aggregates, the developing countries of East Asia in fact differ vastly – bygrowth rates, wealth, population, and poverty incidence (see Table 1.1).
The group includes the most populous country in the world, and the Pacific island states, whichhave among the smallest populations in the world. It includes Malaysia, with GNI per capita ofover $3000, and Cambodia – the people of which enjoys less than a tenth of that amount on a percapita basis. It includes the fast growers, like China and Vietnam, and a number in which growth issporadic and slow. And as we shall see, they differ too in their infrastructure performance.
There are a number of ways to tell the story of infrastructure in East Asia. In this Chapter we lookat it from five inter-linked perspectives. Each of these perspectives define the context ofinfrastructure delivery in the region in different ways.
We start with the economic story, which places infrastructure squarely in the context of theregion’s remarkable growth performance, and its record in reducing poverty. Although growth andpoverty reduction depend on much more than infrastructure alone (see Figure 1.1), the contributionof infrastructure to the region’s macroeconomic story has been considerable. The context set downhere lays the ground for a more detailed discussion of inclusive development in Chapter 2 – thehow of infrastructure, growth, investment and poverty reduction.
4 Since 1999, the population of the developing countries of East Asia has risen by 4 percent to about 1.85 billion, andthe number of people living on less than US$2 a day has fallen from 890 million to 636 million, i.e. from about oneperson in two to one person in three. In China, which accounts for 70 percent of the region’s population, theheadcount of those living on less than US$2 a day is now down to an estimated 32 percent of the population, from 50percent in 1999 (World Bank, 2004d).

The Infrastructure Challenge
32
Table 1.1: Growth, income, poverty and population, East Asia
average growth,1994-2003
total GNI(US$ million)
Population(millions)
GNI per capita($US)
Number ofpoor (million)
*
Malaysia 5.3 93,683 24.77 3,782 1.7
Thailand 3.6 136,063 62.01 2,194 11.6
Philippines 4.1 87,771 81.5 1,077 ..
China 8.9 1,417,301 1288.4 1,100 391.1
Indonesia 3.2 172,733 214.47 805 99.1
Vietnam 7.4 38,786 81.31 477 41.1
Cambodia 6.8 4,105 13.4 306 10.3
Lao PDR 6.2 1,821 5.66 322 4.3
Mongolia 3.3 1,188 2.48 479 ..
Palau 3.5 150 0.02 7,500 ..
Marshall Islands -1.2 143 0.05 2,869 ..
Fiji 2.6 1,969 0.84 2,344 ..
Micronesia, Fed. Sts. 0.0 261 0.13 2,006 ..
Samoa 4.2 284 0.18 1,580 ..
Tonga 2.4 152 0.1 1,515 ..
Vanuatu 1.8 248 0.21 1,179 ..
Kiribati 5.1 84 0.1 840 ..
PNG 0.9 2,823 5.5 513 4.1
Solomon Islands -0.9 273 0.46 594 ..
Timor-Leste -1.0 351 0.81 434 ..
Myanmar N/A N/A 49.36 N/A ..
* living under $2 / day, 2005Source: World Bank (2004h) andWorld Bank (2004d).
We then look at the spatial and demographic story, in particular at the region’s fast-growing urbanareas, and the challenges of connectivity and coordination that this raises. Approaches toaddressing these challenges are dealt with both in Chapter 2, and through the focus on coordinationof Chapter 3.
In our third story we look at infrastructure from the perspective of the environment. Manyinfrastructure investments have a positive impact on the environment, most prominently water andsanitation. But other kinds of infrastructure undertaking entail significant environmental risks –risks that can be mitigated if the political will is present. But mainstreaming environmentalconcerns in the design and implementation of infrastructure raises difficult coordination problems,not dissimilar in nature from those that we raise in Chapter 3.
Our fourth infrastructure story is the political story, which provides some of the context for ourdiscussion of coordination in Chapter 3, and risk management and accountability in Chapter 4.
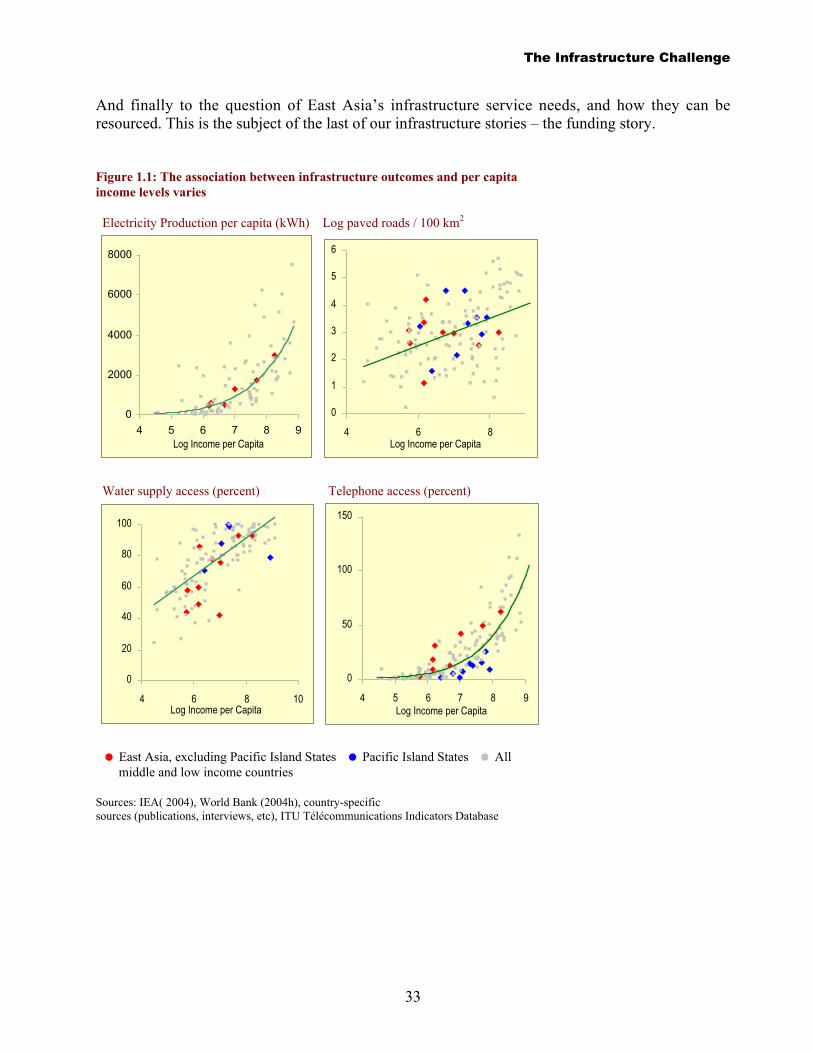
The Infrastructure Challenge
33
And finally to the question of East Asia’s infrastructure service needs, and how they can beresourced. This is the subject of the last of our infrastructure stories – the funding story.
Figure 1.1: The association between infrastructure outcomes and per capitaincome levels varies
Electricity Production per capita (kWh) Log paved roads / 100 km2
0
2000
4000
6000
8000
4 5 6 7 8 9Log Income per Capita
0
1
2
3
4
5
6
4 6 8Log Income per Capita
Water supply access (percent) Telephone access (percent)
0
20
40
60
80
100
4 6 8 10Log Income per Capita
0
50
100
150
4 5 6 7 8 9Log Income per Capita
East Asia, excluding Pacific Island States Pacific Island States All middle and low income countries
Sources: IEA( 2004), World Bank (2004h), country-specificsources (publications, interviews, etc), ITU Télécommunications Indicators Database
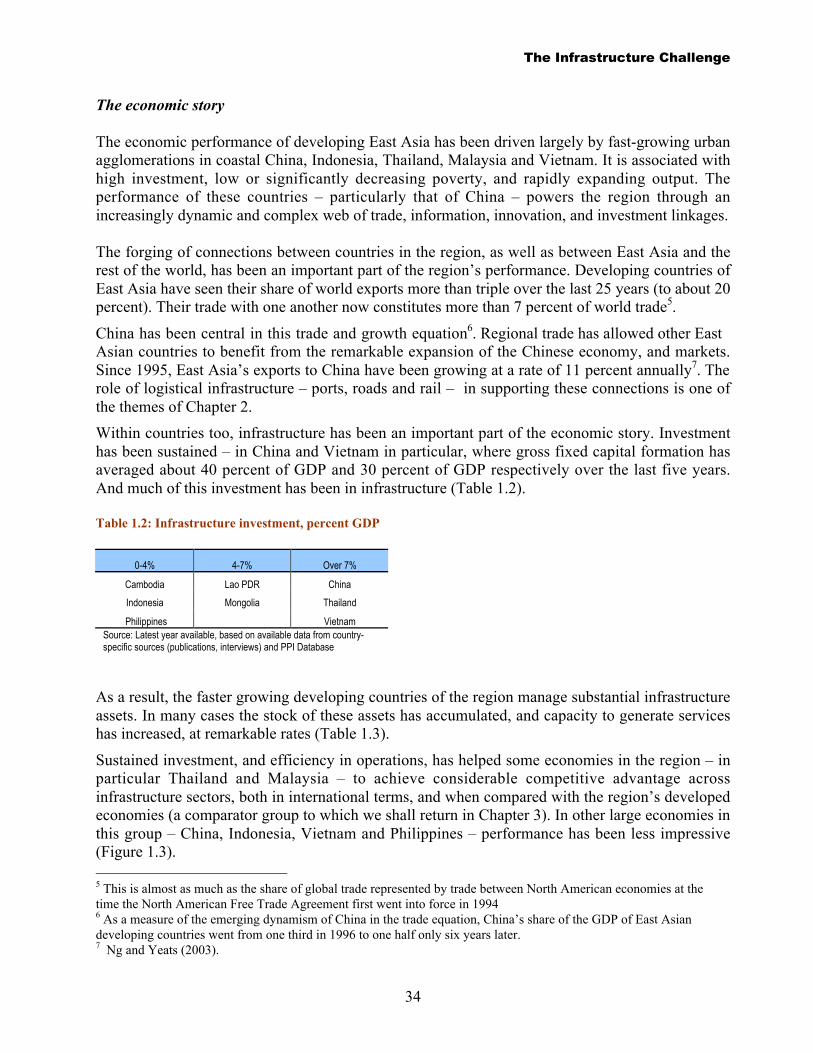
The Infrastructure Challenge
34
The economic story
The economic performance of developing East Asia has been driven largely by fast-growing urbanagglomerations in coastal China, Indonesia, Thailand, Malaysia and Vietnam. It is associated withhigh investment, low or significantly decreasing poverty, and rapidly expanding output. Theperformance of these countries – particularly that of China – powers the region through anincreasingly dynamic and complex web of trade, information, innovation, and investment linkages.
The forging of connections between countries in the region, as well as between East Asia and therest of the world, has been an important part of the region’s performance. Developing countries ofEast Asia have seen their share of world exports more than triple over the last 25 years (to about 20percent). Their trade with one another now constitutes more than 7 percent of world trade5.
China has been central in this trade and growth equation6. Regional trade has allowed other EastAsian countries to benefit from the remarkable expansion of the Chinese economy, and markets.Since 1995, East Asia’s exports to China have been growing at a rate of 11 percent annually7. Therole of logistical infrastructure – ports, roads and rail – in supporting these connections is one ofthe themes of Chapter 2.
Within countries too, infrastructure has been an important part of the economic story. Investmenthas been sustained – in China and Vietnam in particular, where gross fixed capital formation hasaveraged about 40 percent of GDP and 30 percent of GDP respectively over the last five years.And much of this investment has been in infrastructure (Table 1.2).
Table 1.2: Infrastructure investment, percent GDP
0-4% 4-7% Over 7%
Cambodia Lao PDR China
Indonesia Mongolia Thailand
Philippines VietnamSource: Latest year available, based on available data from country-specific sources (publications, interviews) and PPI Database
As a result, the faster growing developing countries of the region manage substantial infrastructureassets. In many cases the stock of these assets has accumulated, and capacity to generate serviceshas increased, at remarkable rates (Table 1.3).
Sustained investment, and efficiency in operations, has helped some economies in the region – inparticular Thailand and Malaysia – to achieve considerable competitive advantage acrossinfrastructure sectors, both in international terms, and when compared with the region’s developedeconomies (a comparator group to which we shall return in Chapter 3). In other large economies inthis group – China, Indonesia, Vietnam and Philippines – performance has been less impressive(Figure 1.3). 5 This is almost as much as the share of global trade represented by trade between North American economies at thetime the North American Free Trade Agreement first went into force in 19946 As a measure of the emerging dynamism of China in the trade equation, China’s share of the GDP of East Asiandeveloping countries went from one third in 1996 to one half only six years later.7 Ng and Yeats (2003).

The Infrastructure Challenge
35
Table 1.3: Total road network and electricity generating capacity
Total Road Network (km) Electricity Generating Capacity (GW)
1990 2000 growth (%) 1990 2000 growth (%)
Annualaverage GDP
growth (%)
China 1,028,348 1,679,848 63% 127 299 136% 9%
Indonesia 288,727 355,951 23% 13 25 98% 4%
Lao PDR 13,971 23,922 71% 0 0 92% 6%
Philippines 160,560 201,994 26% 7 12 81% 3%
Thailand 52,305 60,354 15% 8 19 125% 4%
Vietnam 105,557* 215,628 104% 2 6 180% 7%
Argentina 215,357 215,471 0% 17 24 37% 4%
Brazil 1,670,148 1,724,929 3% 52 69 32% 2%
India 2,000,000 3,319,644 66% 72 108 51% 5%
Poland 363,116 364,656 0% 27 29 9% 4%
South Africa 185,751 362,099 95% 31 40 28% 2%
Korea, Rep. 56,715 86,990 53% 20 50 150% 5%
Source: Country-specific sources, WB World Development Indicators, U.S DOE EIA
Note: Italics refer to data from prior year
* 1992 Figure
This overall impression is mirrored in the response of East Asian firms to World Bank InvestmentClimate Surveys, nearly 20 percent of which report that inadequate infrastructure service provisionis a serious obstacle to the operation and growth of their business.8 This is a lower percentage thanin the rest of the developing world, but is clearly high enough to be of considerablemacroeconomic consequence.
8 See http://rru.worldbank.org/investmentclimate/. This is the proportion of firms saying that any of electricity,telecommunications or transportation are “major” or “severe” obstacles.

The Infrastructure Challenge
36
Box 1.1: The demographic dividend
East Asia has benefited greatlyfrom its “demographic dividend”. Ababy boom has been traveling throughthe age structure of the region’spopulation since the 1950s and 1960s.These young people began entering thelabor force from the late 1960s and early1970s (at around the same time as theproportion of births started to decline).The working age population rose from56 percent of the total population in1965 to 66 percent in 2000. It isexpected to reach about 70 percent by2015-20 (World Bank, 2004e).
One of the distinctive features ofEast Asia is that the high working agepopulation has been combined withinstitutions, traditions, and policieswhich have encouraged high savingslevels in that age group, and havechanneled those savings into domesticinvestment. Infrastructure has been amajor beneficiary of that phenomenon.
Figure 1.2: Savings and investment(percent GDP), 10 year average
0 10 20 30 40 50
Sub-Saharan Africa
Latin America & Caribbean
South Asia
Europe & Central Asia
Middle East & North Africa
East Asia & Pacific
Cambodia
Vanuatu
Mongolia
Philippines
Vietnam
Indonesia
Thailand
China
Malaysia
Investment Savings
World Bank (2004h).

The Infrastructure Challenge
37
Figure 1.3: Infrastructure ranking, World Competitiveness Report, East Asia
Note: Rankings are shown for developing East Asian economies (blue) and advanced East Asianeconomies (grey). Red line is the average for all surveyed countries.
Source: World Economic Forum (2003).
In short, East Asia has provided the infrastructure underpinnings for economic growth better thanother developing regions (on average), but there is much room for improvement, and supply needsto keep pace with rapidly-rising demand.9
9 A perceptions survey of Japanese investors in developing East Asia yielded some interesting findings. For example,Japanese vehicle manufacturers operating in Thailand report that Bangkok traffic congestion has a significant cost-
Overall infrastructure quality
0.0 2.0 4.0 6.0 8.0
Japan
Taiwan
Korea
Hong Kong
Singapore
Philippines
Vietnam
Indonesia
China
Thailand
Malaysia
Telephones
0.0 2.0 4.0 6.0 8.0
Japan
Taiwan
Korea
Hong Kong
Singapore
Philippines
Vietnam
Indonesia
China
Thailand
Malaysia
Electricity supply
0.0 2.0 4.0 6.0 8.0
Japan
Taiwan
Korea
Hong Kong
Singapore
Philippines
Vietnam
Indonesia
China
Thailand
Malaysia
Railroads
0.0 2.0 4.0 6.0 8.0
Japan
Taiwan
Korea
Hong Kong
Singapore
Philippines
Vietnam
Indonesia
China
Thailand
Malaysia
Ports
0.0 2.0 4.0 6.0 8.0
Japan
Taiwan
Korea
Hong Kong
Singapore
Philippines
Vietnam
Indonesia
China
Thailand
Malaysia
Air Transport
0.0 2.0 4.0 6.0 8.0
Japan
Taiwan
Korea
Hong Kong
Singapore
Philippines
Vietnam
Indonesia
China
Thailand
Malaysia

The Infrastructure Challenge
38
In those countries in which infrastructure investment has been most sustained – China andVietnam in particular – high levels of investment have not always implied optimal investment.Often efficiency in the selection and management of investment in general, and infrastructure inparticular, has been lacking. Too much investment may be as dangerous as too little. Thegovernments of these countries now face the challenges of improving efficiency, avoiding“overheating” by restraining excessive investment, and managing a “soft landing” with sustainablegrowth and investment – a point we pick up on in our discussion of Vietnam in Chapter 2.
In the countries most affected by the 1997 crisis, growth has recovered (i.e. in Thailand, Malaysia,and to a lesser extent Indonesia and the Philippines), but this has been driven primarily bydomestic consumption and exports, rather than by investment. In the Philippines, physical capitalper worker has been growing at barely 1 percent per year since the early 1990s. In Indonesia,Malaysia, and Thailand, capital per worker was growing by 4 to 7 percent per year before the 1997crisis, but by less than half that rate since then (World Bank, 2004d).10
Clearly, the post-crisis recovery in growth has come partly from increased capacity utilization, andalso from enhanced labor productivity and innovation, but these factors will eventually reach limitswithout an investment recovery. In these countries therefore, the challenge is to enhance theinvestment climate and increase investment to underpin sustained economic growth (whilecontinuing to realize efficiency gains in management of assets).11
Access to infrastructure services in Malaysia and Thailand, as well as the Philippines, and to alesser extent China, is generally higher than that of its less wealthy (in per capita terms) neighbors(Table 1.4). Similar outcomes have been achieved in some of the tiny Pacific Island nations,although – as we set out in more detail in Box 1.2 – the context of this achievement is substantiallydifferent.
The larger, faster growing economies also stand apart in the degree to which growth, investmentand poverty reduction have accompanied, and supported each other. The poverty headcount inChina has dropped from around 70 percent of the population in 1990, to close to 30 percent of thepopulation today12. Vietnam has seen its poverty headcount drop from around 90 percent to 48percent over the same period (Figure 1.4).
The risk of poverty, however, is much higher than the poverty headcount may suggest at anyparticular time. In all developing countries of East Asia a far larger number of households fallintermittently below the poverty line than are permanently below it.13 The 1997 crisis dramatically
raising impact on the levels of stocks of parts they need to hold. In Vietnam, which has substantial Japaneseinvestment attracted by high labor productivity and rapid economic growth, 32.9 percent of Japanese firms cite poorinfrastructure as their major obstacle. See Nomura Research Institute (2004). See also JBIC (2004).10 This contrasts with capital-per-worker growth in China of about 10 percent a year since 1990.11 Since late 2003, there have been signs of an incipient recovery in investment in parts of the region, particularlyMalaysia and Thailand. It would be premature to assess the sustainability of the investment recovery in thosecountries, particularly given the sensitivity to Chinese macroeconomic policy as well as to global export prospects.12 measured by the $2/day poverty line13 To give one example of the magnitude of the poverty risk: Spencer (2004) quotes a panel data study from Sichuanwhich found over a five-year period that while 30 percent of households fell below the poverty line in at least one
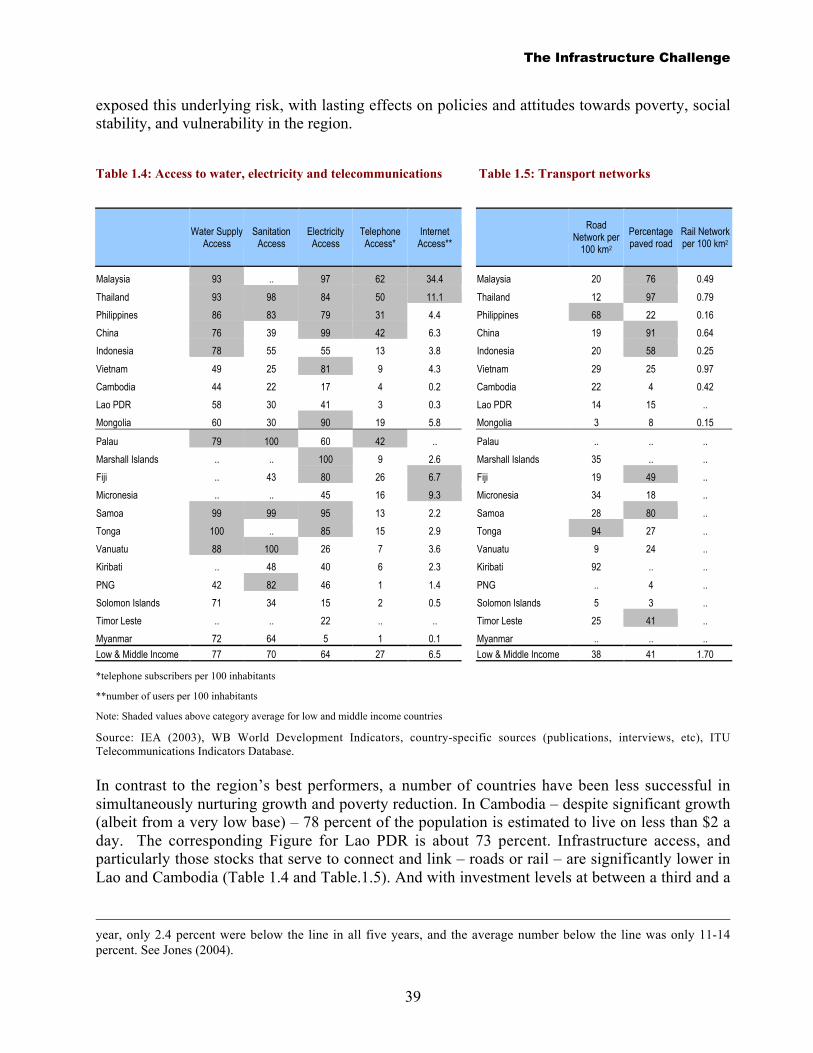
The Infrastructure Challenge
39
exposed this underlying risk, with lasting effects on policies and attitudes towards poverty, socialstability, and vulnerability in the region.
Table 1.4: Access to water, electricity and telecommunications Table 1.5: Transport networks
Water Supply
AccessSanitation
AccessElectricityAccess
TelephoneAccess*
InternetAccess**
Road
Network per100 km2
Percentagepaved road
Rail Networkper 100 km2
Malaysia 93 .. 97 62 34.4 Malaysia 20 76 0.49
Thailand 93 98 84 50 11.1 Thailand 12 97 0.79
Philippines 86 83 79 31 4.4 Philippines 68 22 0.16
China 76 39 99 42 6.3 China 19 91 0.64
Indonesia 78 55 55 13 3.8 Indonesia 20 58 0.25
Vietnam 49 25 81 9 4.3 Vietnam 29 25 0.97
Cambodia 44 22 17 4 0.2 Cambodia 22 4 0.42
Lao PDR 58 30 41 3 0.3 Lao PDR 14 15 ..
Mongolia 60 30 90 19 5.8 Mongolia 3 8 0.15
Palau 79 100 60 42 .. Palau .. .. ..
Marshall Islands .. .. 100 9 2.6 Marshall Islands 35 .. ..
Fiji .. 43 80 26 6.7 Fiji 19 49 ..
Micronesia .. .. 45 16 9.3 Micronesia 34 18 ..
Samoa 99 99 95 13 2.2 Samoa 28 80 ..
Tonga 100 .. 85 15 2.9 Tonga 94 27 ..
Vanuatu 88 100 26 7 3.6 Vanuatu 9 24 ..
Kiribati .. 48 40 6 2.3 Kiribati 92 .. ..
PNG 42 82 46 1 1.4 PNG .. 4 ..
Solomon Islands 71 34 15 2 0.5 Solomon Islands 5 3 ..
Timor Leste .. .. 22 .. .. Timor Leste 25 41 ..
Myanmar 72 64 5 1 0.1 Myanmar .. .. ..
Low & Middle Income 77 70 64 27 6.5 Low & Middle Income 38 41 1.70
*telephone subscribers per 100 inhabitants
**number of users per 100 inhabitants
Note: Shaded values above category average for low and middle income countries
Source: IEA (2003), WB World Development Indicators, country-specific sources (publications, interviews, etc), ITUTelecommunications Indicators Database.
In contrast to the region’s best performers, a number of countries have been less successful insimultaneously nurturing growth and poverty reduction. In Cambodia – despite significant growth(albeit from a very low base) – 78 percent of the population is estimated to live on less than $2 aday. The corresponding Figure for Lao PDR is about 73 percent. Infrastructure access, andparticularly those stocks that serve to connect and link – roads or rail – are significantly lower inLao and Cambodia (Table 1.4 and Table.1.5). And with investment levels at between a third and a
year, only 2.4 percent were below the line in all five years, and the average number below the line was only 11-14percent. See Jones (2004).

The Infrastructure Challenge
40
half that of faster growing neighbors, a mutually supportive relationship between infrastructure,investment, growth and poverty reduction is less apparent than elsewhere in the region.
Finally, other regions in East Asia remain isolated, and relatively unconnected to the major growthpoles of East Asia – most rural areas, the outlying islands of Indonesia and the Philippines, land-locked Mongolia, and most Pacific island states.
In the Pacific island countries, the poverty headcount is generally much lower, but economicgrowth rates tend also to be quite low and incomes are heavily dependent on aid flows, migrantlabor remittances, or non-renewable natural resources with volatile revenue streams. Populationsin those countries therefore remain particularly vulnerable to poverty through slow economicgrowth and lack of economic diversity.
Figure 1.4: Poverty headcount index ($2/day), percent, East Asia, selected countries
Thailand and Malaysia China, Vietnam, Indonesia Lao PDR, PNG, Cambodia
0
5
10
15
20
25
30
35
40
45
50
1990
1994
1997
1999
2001
2003
2005
25
35
45
55
65
75
85
1990
1994
1999
2001
2003
2005
25
35
45
55
65
75
85
1990
1994
1997
1999
2001
2003
2005
Note: data interpolated between 1999 and 1996
Source: World Bank (2004d).
Malaysia
Thailand
Vietnam
China
Indonesia PNG
Cambodia
Lao PDR
The Infrastructure Challenge
41
Box 1.2: Infrastructure challenges in the Pacific Island countries – a case apart
The nine Pacific island countriescovered by this study stand apartfrom the rest of the region in anumber of respects, with importantimplications for their infrastructurechallenges.
Together, the nine islands have acombined population smaller thanJamaica’s, in a total land masssmaller than Cuba’s, spread over anarea larger than China.
The challenging topography andthe low population density clearlycomplicates the task of infrastructureservice provision. The spread of thehigh fixed cost of infrastructureinvestment over a small customerbase inflates unit costs and depressesrevenues from service provision. Dueto their remoteness and lack ofeconomies of scale, the Pacificcountries have a significantcomparative disadvantage inattracting private sector participationand sustaining competition ininfrastructure, in relation to otherEast Asian countries.
The Pacific island countries arelagging behind East Asian countriesin terms of access and quality ofservice provision. A stunning 70percent or more of inhabitants lackaccess to electricity.Telecommunications access is largelylimited to urban areas. Due to a lackof transport alternatives, inter-islandshipping and civil aviation play acrucial role in a complex transportsystem serving hundreds of sparselypopulated small islands.Nevertheless, airports and ports arecharacterized by low throughput on aper capita basis.
But poor performance ininfrastructure cannot be attributedexclusively to geography and lack ofeconomies of scale. The PacificIslands have lower levels of access totelecommunications, electricity, andimproved water and sanitation, than
similar countries with the same levelof income (e.g. in the Caribbean).Policy and institutional choices alsomatter:
Poor coordination. Many Pacificcountries suffer from poorcoordination in infrastructure policyand implementation. Hidden subsidiesto corporatized utilities do notcompete with other fiscal priorities ina transparent manner. Regulatory andpolicy frameworks are often not fullyaligned or contradict each other – forexample, Fiji adopted the ‘Landlord’model for port operations, butcontracted out stevedoring operationsto a monopoly government ownedprovider, thus diluting the potentialefficiency benefits stemming fromcompetition in service provision.
Low accountability. In most ofthe Pacific countries, government-owned utilities are in charge of bothproviding the service and sanctioningits quality. Most of the governmentshave now recognized that this modeldoes not create an enablingframework for accountability to end-users, and have moved towards moreaccountable institutionalarrangements, throughcorporatization of state-ownedutilities.
However, with only a fewexceptions, accountability to end-users has remained low, ascorporatized utilities are often stillsubject to micromanagement by thegovernment. When there is prospectfor private sector engagement, theimbalance between the public sectorand the private utilities in terms ofmonitoring capacity can sometimeslend excessive power to theprivatized utilities and/or lead tocollusive outcomes, with littleimprovement in accountability.
Low capacity to manage risk.The risk management model in the
Pacific countries is often based on amodel of Government as absorber ofrisk – government-owned utilities aregenerally insulated from risk, aslosses flow through to thegovernment and are eventually bornby taxpayers. The cost ofgovernment risk-bearing is oftenhigh, as the Pacific economies areparticularly vulnerable to externalshocks (such as oil price shocks),which also tend to impact on the costof infrastructure service provision.The total cost of risk bearing couldbe reduced through moresophisticated project design, whichwould enable more effective risksharing. Consumers and serviceproviders should be called on to bearat least part of the risk, to the extentthat they are able to absorb it.
Notwithstanding the specificinfrastructure challenges faced by thePacific countries, a few successfulexamples of corporatization (such asthe Fiji Electricity Authority, SamoaPorts Authority and Samoa WaterAuthority) and the positiveperformance of the private electricityand water utility in Vanuatudemonstrates that there is scope forimproved performance andaccountability through bettermanagement and commercial focus.The challenge is to design time-bound performance-based subsidiesto encourage more efficient andinclusive infrastructure servicedelivery. The establishment ofregional bodies (such as the existingPacific Power Association) should beencouraged as the way forward toease individual country capacityconstraints and promote policycoordination among the Pacificcountries.
Source: Castalia (2004b); Mellor(2004).

The Infrastructure Challenge
42
The spatial and demographic story
East Asia’s spatial and demographic challenge plays out across three interlinked dimensions. Thefirst is the urban dimension: Cities drive East Asian growth, and as they do, their populations areexpanding rapidly. Infrastructure not only has to keep up with demand for services, but has acrucial role to play in maintaining cities’ competitiveness.
The second challenge relates to rural areas, where poverty levels are at their highest.Infrastructure can help improve livelihoods. It also has an important role to play in spreading thebenefits of urban growth.
And the third challenges is a regional challenge: Of creating regional markets; enhancing tradeand regional integration; and connecting poorer, isolated areas to the region’s growth poles.
The urban challenge
The urban agglomerations driving East Asia’s growth have profound consequences for economicdevelopment. Cities account for 70 percent of the region’s GDP growth. Urban populations areexpanding rapidly. And with it come a host of infrastructure opportunities and challenges:Challenges that entail integration and connection. Challenges that entail foresight andcoordination. How to meet these challenges is the topic of our next two Chapters.
The urban share of East Asia’s population is not yet high by global standards, but it is risingexponentially. From 16 percent in 1960 to 21 percent in 1980 and then to 36 percent in 2000, itis expected to rise to over 50 percent by 2025 (Figure 1.5).14 By then, East Asia will have abouthalf a billion more urban dwellers than it does now, mainly as a result of migration from ruralareas (World Bank, 2004c).15
Over the period 2000 to 2015, the population living in cities with more than 1 million residents isexpected to increase by about half (to 500 million), and the population living in megacities ofmore than 10 million residents will rise by a similar proportion (to 120 million).
14 These regional Figures disguise substantial differences between the level of urbanization so far attained in specificcountries. For example, Cambodia has an urbanization rate of about 18 percent, China less than 40 percent, and thePhilippines about 60 percent. But the rate of urban population growth is rapid in most developing countries of theregion.15 Urban areas spreading to envelope rural areas is a close second as a cause of urban growth.

The Infrastructure Challenge
43
Figure 1.5: East Asia’s urban population is not yet high by global standards, but it is rising exponentially
Urban population (percent total population), 2000; East Asia, 1960-2025
1960
2025
2000
1980
0
10
20
30
40
50
60
70
80
90
Sub-SaharanAfrica
SouthAsia
MiddleEast &NorthAfrica
LatinAmerica &Caribbean
OECD East Asia& Pacific
Source: World Bank (2004h); World Bank (2004c).
Table 1.6: There is significant variation in the speed and level of urbanizationacross East Asian countries
Level and rate of urbanization, percent total population, 2000; growthrate, 1995-2000
Urbanization level
Low Middle High
Fast Cambodia Indonesia
Lao PDR Philippines
Intermediate China Malaysia
Vietnam
Myanmar
Slow Thailand Mongolia
Urb
aniz
atio
n ra
te
Note: Urbanization level: High >40%, 20% <middle<40%, Low<20%;Urbanization rate: Fast >6%, 2%<middle<4%, Low<2%
Source: UTCE/ALMEC (2004a), based on World Bank (2003e).
The most rapid population growth is taking place in peri-urban peripheries. In Chinese citiesalone, peri-urban areas will grow by about 250 million people over the next 25 years. Andincreasingly, neighboring East Asian cities are connecting with each other and forming into large

The Infrastructure Challenge
44
urban clusters. These include large parts of China’s coastal zone, Bangkok’s eastern seaboard,the Philippines’ National Capital Region, and the cross-border cluster of Singapore-Riau-Johore.
In general, urbanization in East Asia is correlated with increasing national income levels (Table1.6). Cities have driven growth. The rapid growth of cities has been accompanied by a strikingchange in economic structure16. Densely-populated urban areas have provided markets foroutputs, inputs, labor and other services and allow firms to profit from economies of scale andscope, specialization, and the rapid diffusion of knowledge and innovation.
Figure 1.6: Urbanization and increasing income levels are correlated in East Asia
Urban population (percent total population); log GDP per capita, selectedcountries, 1960 to 2000
0
20
40
60
80
10 100 1,000 10,000 100,000
GDP per capita (US$, log)
Japan
Korea
Philippines
Thailand
China
IndonesiaMalaysia
CambodiaVietnam
Note; Data is plotted for every five yearsSource: Source: UTCE/ALMEC (2004a), based on World Bank (2003e), UN (2002).
Agglomeration economies have been very strong in East Asia. Their impact is enhanced by therole of urban areas in the process of globalization. Cities such as Bangkok, Beijing, Hong Kong,Jakarta, Kuala Lumpur, Manila, or Shanghai are now major world centers. Beijing’s selectionfor the 2008 Olympics and Shanghai’s for the 2010 World Expo bear ample testimony to thatevolution. The connection of East Asia’s cities to global markets makes them centers forinternational trade, communications, employment of migrants, and foreign direct investment.Such cities are experiencing unprecedented prosperity as a result of their advantages. Forexample, the per capita GDP of Shanghai alone is about 11 times that of China’s per capita GDP,and Ho Chi Minh City has three times the per capita GDP of Vietnam (Yusuf, Evenett,Nabeshima, Shotten and Webster 2001).
16 The share of agriculture in East Asian GDP has fallen from 28 percent to 13 percent since 1980, while the share ofindustry and services has risen from 72 percent to 87 percent over the same period (World Bank 2004c)

The Infrastructure Challenge
45
Box 1.3: Emerging urban infrastructure gaps in East Asia
In many East Asian cities infrastructure provision is failing to keep up withrapid urbanization and demand on services. Figure 1.7 below gives oneexample. It plots increasing car ownership against road extension pervehicle, which shows how in major East Asian cities, rapid motorization hasoutstripped the capacity of city authorities to meet demand.
Figure 1.7: Changes in Vehicle Ownership and Road Lengths
Road extensions (km/car) against car ownership (per 1000 persons)
Note: Data for Metro Manila: Philippines Statistical Yearbook (excluding barangayroads); Jakarta: Jakarta dalmn Angka (excluding army and diplomatic vehicles);Bangkok: Bangkok Metropolitan Area (BMA) (excluding soi and trucks);Singapore: World Road Statistics and LTA (paved road only); Tokyo: TokyoMetropolitan Government.
Source: JICA (2004).

The Infrastructure Challenge
46
But East Asia’s urban growth brings with it a host of infrastructure challenges. Rapidlyincreasing, and densely distributed urban populations imply increasing demands on infrastructurefacilities and services, as well as the environmental and social risks of inadequate provision.Infrastructure gaps are emerging across urban infrastructure sectors (Box 1.3).
And these gaps tend to affect the poor, frequently in peri-urban, informal settlements, far morethan the rest of the urban populations (Table 1.7). More generally, while cities have drivengrowth, and urban poverty is lower than rural poverty in every country in East Asia, urbanpoverty, and particularly inequality, is a real, and potentially explosive problem. Densely-populated cities can sometimes unleash new political risks, and demands for accountability ofgovernment, when the provision of basic services and the availability of jobs do not matchpopular expectations.
Table 1.7: Inequality in access to infrastructure services in urban areas
Access to services, percent household with connection
Piped waterconnection*
Sanitation Electricity TelephoneAccess toWater**
Citywide 65.9 58 94.4 57.1 94.8East Asia informal
settlements***38.3 7.4 75.7 25.4 89.1
Citywide 75.8 64 86.5 52.1 88.9All developing
countries informalsettlements*** 37.2 19.8 59.1 25.4 57.6
* Refers to percentage of households with piped water connection.
** Portable water within 200 meters of the residence and includes water connections.
*** Data on informal settlement may contain inaccuracies as sample sizes are small and measurement is uncertain
Source : UTCE/ALMEC (2004a).
At the same time, infrastructure has an enormous role to play in maintaining the competitivenessof East Asia’s cities. Urban investment climates, and hence mass employment prospects, candepend critically on the quality of urban infrastructure.
Among these challenges: Connecting cities to hinterlands and international markets throughenhanced transport infrastructure, telecommunications, and logistical services. Exploiting theregion’s comparative advantage in high-value services and hi-tech industry through providingadvanced communications and just-in-time delivery – the increasing tendency for integratedproduction chains to spread across a number of countries in East Asia makes this all the moreimportant.
Creating urban clusters in which innovation thrives. Providing efficient urban transport, forpeople to travel between home, work, school, and leisure activities. Minimizing transportcongestion and emissions. Ensuring environmental health through effective and affordable waterand sanitation services. Making reliable energy services available to businesses and to people,and managing environmental impacts.
The Infrastructure Challenge
47
And perhaps the greatest challenge in rapidly-growing cities: making infrastructure choicesbefore land use patterns become so established that retrofitting infrastructure becomesenormously expensive. Long-term vision, strategic planning, and coordination are at a premiumin East Asia’s urban areas.
Most East Asian countries have responded to pressures on infrastructure services arising fromurbanization by decentralizing substantial government responsibility to the local level. This hastaken many forms, depending on the economic needs, political context, and institutionaltraditions of the countries concerned.
But in most cases, decentralization has brought with it issues of how to coordinate acrossdifferent jurisdictions and agencies, how to restructure infrastructure service providers and howto regulate them, what the appropriate intergovernmental fiscal arrangements are, how toenhance municipal financing options, how much political autonomy different levels ofgovernment will enjoy and how accountability will work, and how to include greaterparticipation by civil society and the private sector. These factors can profoundly shape theprovision of infrastructure services.
We will take up these themes of strategic urban planning and management of infrastructureacross decentralized jurisdictions in Chapter 3, on coordination.
The rural challenge
While East Asia is rapidly urbanizing, about two-thirds of the region’s populations - or 1.2billion people - still live in rural areas. Moreover, East Asia’s poverty is overwhelmingly rural,and rural-urban disparities – across income as well as access to services – provoke politicalconcerns and demands for inclusion in economic development (sometimes with an ethnicminority element)17. A number of generally fast-growing East Asian countries include largepockets of rural poverty, most notably in Western China, the Central Highlands and NorthernMountains of Vietnam, Mindanao in the Philippines, Northeast Thailand (see Table 1.8), andEastern Indonesia.
Rural economies depend increasingly on urban economies – for markets, for financial capital,and for migrant employment. But urban economies also depend on rural economies for humancapital and agricultural products. The contribution of infrastructure provision to the health ofrural economies can therefore have major economic and political impacts in both rural and urbanareas. For example, the provision of rural feeder roads can allow the supply of perishable foodsto high-value urban markets, and the income generated can be invested in health and education toimprove the productivity of eventual migrants to the cities. Rural infrastructure is not alwaysjust for the benefit of rural populations.
But rural infrastructure is also comparatively more expensive to deliver than urban infrastructure.Policy makers are often ill-equipped to strike an appropriate balance, given limited resources.Thereafter, the challenge is how to provide infrastructure as cost-effectively as possible. Thiscan involve making appropriate choices about technologies and service standards: decentralized 17 See UTCE/ALMEC (2004a) for discussion of this issue.
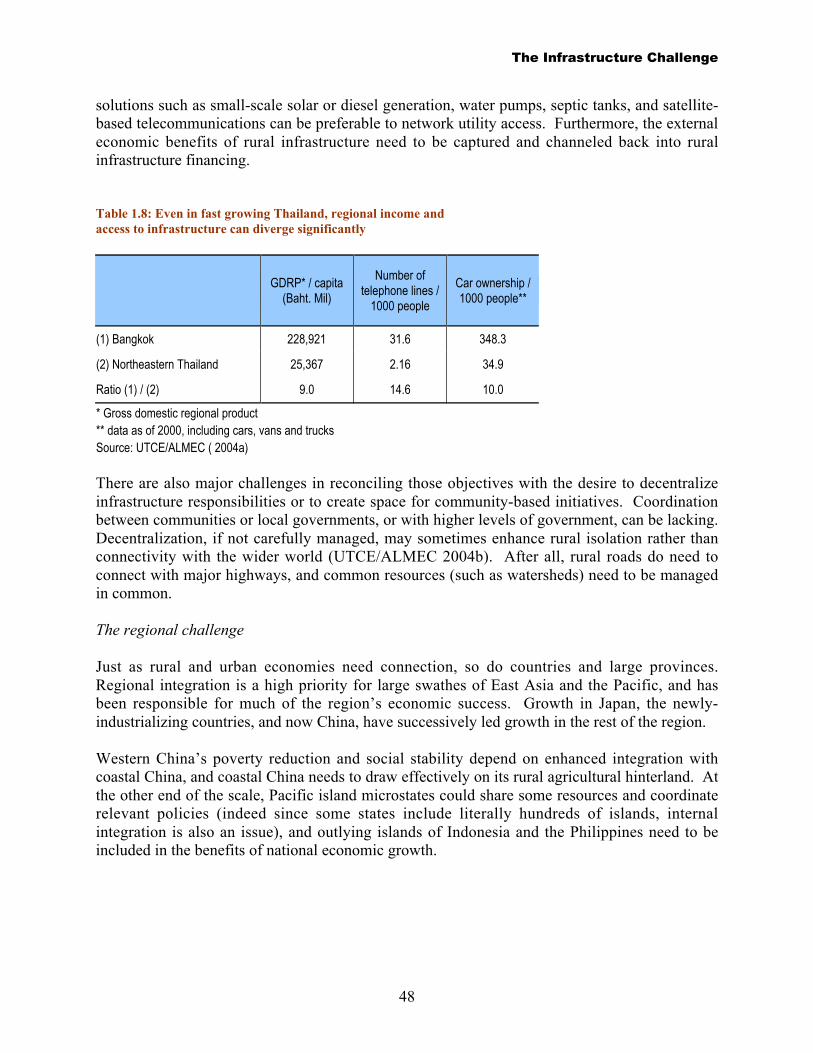
The Infrastructure Challenge
48
solutions such as small-scale solar or diesel generation, water pumps, septic tanks, and satellite-based telecommunications can be preferable to network utility access. Furthermore, the externaleconomic benefits of rural infrastructure need to be captured and channeled back into ruralinfrastructure financing.
Table 1.8: Even in fast growing Thailand, regional income andaccess to infrastructure can diverge significantly
GDRP* / capita
(Baht. Mil)
Number oftelephone lines /
1000 people
Car ownership /1000 people**
(1) Bangkok 228,921 31.6 348.3
(2) Northeastern Thailand 25,367 2.16 34.9
Ratio (1) / (2) 9.0 14.6 10.0
* Gross domestic regional product** data as of 2000, including cars, vans and trucksSource: UTCE/ALMEC ( 2004a)
There are also major challenges in reconciling those objectives with the desire to decentralizeinfrastructure responsibilities or to create space for community-based initiatives. Coordinationbetween communities or local governments, or with higher levels of government, can be lacking.Decentralization, if not carefully managed, may sometimes enhance rural isolation rather thanconnectivity with the wider world (UTCE/ALMEC 2004b). After all, rural roads do need toconnect with major highways, and common resources (such as watersheds) need to be managedin common.
The regional challenge
Just as rural and urban economies need connection, so do countries and large provinces.Regional integration is a high priority for large swathes of East Asia and the Pacific, and hasbeen responsible for much of the region’s economic success. Growth in Japan, the newly-industrializing countries, and now China, have successively led growth in the rest of the region.
Western China’s poverty reduction and social stability depend on enhanced integration withcoastal China, and coastal China needs to draw effectively on its rural agricultural hinterland. Atthe other end of the scale, Pacific island microstates could share some resources and coordinaterelevant policies (indeed since some states include literally hundreds of islands, internalintegration is also an issue), and outlying islands of Indonesia and the Philippines need to beincluded in the benefits of national economic growth.

The Infrastructure Challenge
49
In between, the Greater Mekong Subregion has great opportunities for integration of transport,water resource management, energy and telecommunications.18 And as China emerges as thegrowth engine of the region, connecting with its markets becomes a high priority. Regionalintegration is an economic matter of realizing economies of scale, spreading risk and exploitingcomparative advantage, but also of cementing stable relationships in post-conflict situations andincluding ethnic minorities in mainstream society. We shall pick up on these themes again in ourdiscussion of inclusive development in Chapter 2.
The environmental story
Choices relating to many kinds of infrastructure – roads and road networks, power generation,solid-waste incineration, water supply and sanitation – have potentially significant environmentalimpacts. Often these are negative.19 (Although they may be positive too – sanitation plants, afterall, can be key to reducing water pollution; some infrastructure can help encourage sustainableagricultural practices, or create financially viable alternatives to exploitation of natural forests).
High rates of economic growth and urbanization drive the environmental agenda in manycountries in the region. And infrastructure, as we have seen, helps drive growth and urbanization.For many years, there was a widespread perception among policy-makers in the region thatenvironmental protection could wait, or at least take a back seat, to allow economies to growwithout constraints.
However, in recent years, perceptions have started shifting, perhaps best exemplified by China’spublication in 1994 of the “White Paper on China’s Population, Environment, and Developmentin the 21st Century”. This paper analyzed the environment as a resource whose exhaustion wouldconstrain growth, rather than seeing environmental protection as primarily a constraint ongrowth. In parallel, there has been a gradually increasing focus on the quality of life not merelyon material living standards.
This shift in philosophy conditions policies relating to infrastructure and choices of infrastructureinvestments. Infrastructure policies and projects are increasingly judged by whether theyimprove the environment, or at least minimize environmental risks. Environmental prioritiesgaining strength in the region’s agenda include improving urban air quality, reduction ofemissions affecting greenhouse gases, increasing the availability of clean water and of sanitationservices, and maintaining the functioning of ecosystems that provide livelihoods and otherbenefits.
Interventions at the project level can be important, ranging from environmental safeguards, tomeasures to mitigate (or compensate for) environmental risks and costs, to alternative projectdesign, or even alternative projects: One can deselect projects if environmental costs are likely to 18 The Greater Mekong Subregion (GMS) includes Cambodia, Lao PDR, Myanmar, Thailand, Vietnam, and YunnanProvince (China).19 See, for instance, Rufo and Rufo, 2004; Van Hanh, Song, Duc and Duc, 2002; and Xianqiang and Xiurui, 2001 foranalyses that seek to quantify environmental impacts arising in recent infrastructure undertakings in East Asia. SeeUzawa (1994) for a discussion of the environmental impacts arising from Japan’s construction of its extensivehighway network and several thermal power plants in the 1960s and 1970s.

The Infrastructure Challenge
50
outweigh other positive economic impacts. One can conserve the remaining parts of affectedhabitats. One can decide to use small-scale hydro generation rather than alternative, morepolluting technologies; design urban transport to minimize car-use. One can even try to avoidcatastrophic flooding by protecting watersheds and their associated hydrological functions, ratherthan build expensive and potentially damaging down-stream “hardware”.
Box 1.4: Indications of the high cost of environmental pollution
Many of analyses of theenvironmental damage in the regionare based on Chinese experience.There is enormous variation in theresults of the many studiesconducted to express this inmonetary terms, but even the lowestestimates indicate significantimpacts of environmentaldegradation on GNP.
One major study estimated thatenvironmental damage frompollution alone cost an equivalent of7.7 percent of GDP, whenwillingness-to-pay valuation
methods are used, or 3.5 percent ofGNP when a “human capitalapproach” is taken (World Bank,1997).
In human and physical terms,estimations of costs are equallysobering, and include the following: 178 000 premature deaths inmajor cities each year, due to airpollution, primarily generated by theconsumption of high sulfur coal. 6.4 million work years lostannually to air pollution relatedhealth damages.
Fifty-two urban river sectionscontaminated to such an extent thatthe are not suitable even forirrigation. Ten percent of land areasthreatened by acid rain. Over 1.5 million km2 areaffected by soil erosion, losing theequivalent of twice the nationalproduction of fertilizer.
These are serious impacts byany measure.
Source: Warford (2004)
But the underlying causes of environmental problems cannot be addressed at the project level.The challenge, rather, is to effectively mainstream environmental concerns within nationalpolicymaking agendas.
There are a number of tools at the policy maker’s disposal: Adequate environmental legislationcan be adopted, and efforts focused on building capacity related to traditional responsibilities ofsocial and environmental agencies. Improved information and transparency can go a long way –about the magnitude and incidence of environmental damage related to infrastructure, the costsassociated with infrastructure projects, their direct and underlying causes, and remedialmeasures. Training measures can be taken to better inform communities about environmentalissues. Awareness about cost-effective technologies can be raised within infrastructure relatedagencies and enterprises. (Box 1.4)
In the medium term, measures can be taken to encourage the systematic use of environmentalimpact assessments, not only at the project level, but at the sectoral and national level too.Environmental objectives can be costed into pricing and other policies in key sectors such asenergy, water, agriculture and transport.
Box 1.5 outlines the use of the Strategic Environmental Assessment (SEA) referred to above –using the example of urban infrastructure development in Bali, Indonesia. SEAs can helpidentify linkages and trade-offs, as well as institutional responsibilities for coordinating andimplementing key elements of a program.

The Infrastructure Challenge
51
Box 1.5: Strategic environmental assessments: The Bali Urban Infrastructure Project
The Bali Urban InfrastructureProject was designed to improveurban infrastructure servicesthroughout the island of Bali,Indonesia, and included majorsubprojects in urban roads andtraffic management, watersupply and sanitation, drainageand flood control.
Although not legallyrequired, a StrategicEnvironmental Assessment(SEA) was carried out in orderto help address the most criticalenvironmental issues in Bali,given the threat to watercatchments, forests, and culturalproperty posed by populationgrowth, industrial development,
and tourism. The SEA wasdesigned to ensure that urbaninfrastructure developmentwould take place in the contextof, and be sensitive to, theseenvironmental issues.
The SEA involvedextensive public consultation atlocal levels, which led to severalconcrete recommendationsrelating to implementation of thesub-projects, as well as to theselection of priorities.It alsoincluded detailedrecommendations forinstitutional capacity buildingrequired to ensure properexecution of the investmentprogram.
The SEA produced acomprehensive environmentalprofile of Bali, and in particulara set of maps definingenvironmental zones. Sub-projects and their potentialimpacts were assessed inrelation to the different zones.This information wasindispensable to determiningappropriate land uses indifferent zones, and to helpavoid adverse environmentaland social consequences ofurban infrastructuredevelopment programs.
Source: Warford (2004).
Fundamentally, however, the challenge of mainstreaming is a governance challenge. And thechallenge is difficult indeed. Measurement of environmental risks, costs and benefits, forinstance, is fraught with uncertainty, and hence value judgments play a major role. This meansthat data can easily be manipulated and even corrupted. The politically powerful can exploittheir influence over information dissemination and decision-making processes to exclude theinterests of politically marginalized groups, who tend to be affected disproportionately byenvironmental degradation. The economic interests of the powerful will therefore tend tooverride environmental concerns, unless broader accountability, participation and transparencymechanisms can evolve to counteract that tendency.
Perhaps more benign than political asymmetry but nonetheless very difficult, is the sheercoordination challenge posed by mainstreaming environmental issues. For example, improvingurban air quality may require a shift from individual to mass transit. This can involveinvestments in urban rail, integration with other public transport systems, coordination withresidential and commercial land-use plans, taxation on fuel and private vehicles, fuel efficiencyand quality regulation, regulation of user charges, urban road construction and trafficmanagement, and many other aspects.
In a different context, a hydropower development program may have a negative environmentalimpact on water catchment areas, but a positive impact on carbon emissions, because it allowsreduction of coal-fired generation. This involves complex environmental trade-offs andcoordination between many different actors.
More profoundly, policies with environmental impact may be deeply embedded in broaderpolicy and institutional frameworks, and reform would be required on many fronts in order tomake progress on an environmental issue. Reforming water prices to encourage water

The Infrastructure Challenge
52
conservation, for instance, might depend on parallel reforms in the enterprise, financial andsocial sectors, as one study from China shows (Warford and Li, 2002).
Finally, responsibilities for policies or programs with environmental implications will often befragmented across many state agencies, and private sector and civil society stakeholders may beintimately involved. Environmental ministries may not have the political clout to coordinateeffectively, and more powerful agencies may have other priorities. Decentralization maycomplicate the process, in the absence of good horizontal coordination, when externalities spillover from one jurisdiction to others (see UTCE/ALMEC 2004b). Coordinating across all thesedimensions challenges government capabilities in any country.
The political story
The financial and economic challenges of delivering infrastructure on the scale required in EastAsia have an important political dimension. Among the most important (and discussed) aspectsof this political dimension is the ideological battle over public versus private participation ininfrastructure, and the interplay of ownership, regulation, financing, planning and policy-making.
In infrastructure sectors, investments often have an economic impact well beyond the revenuerecouped by the service provider – that is, economic rates of return frequently exceed financialrates of return by a substantial margin. This creates an a priori case for some form ofgovernment intervention to supplement the workings of markets. At the same time, economies ofscale in infrastructure can yield substantial market power over often essential – and hence highlypoliticized - services. Such market power generally induces governments to control pricestightly in infrastructure sectors to protect against abuse of consumers. This control can beeffected indirectly through regulation, or directly through public provision.
Where infrastructure provision is potentially private, the existence of tight price regulationcreates substantial political risk. Infrastructure is typically large and immobile; massive capitalcosts are sunk and cannot be salvaged. Once investments have been made, governments canundertake creeping expropriation of investors’ assets, but those investors are likely to continueoperating as long as their variable costs are covered by revenues. An investor threat to withdrawin the face of such government behavior is often not credible. In short, any bargain struck with agovernment to give investors rights to a revenue stream that gives an adequate return on capitalemployed can obsolesce rapidly once the deal is struck.
In developed countries, private firms created a substantial portion of the initial infrastructure, butover time this led to underinvestment in the face of political risk or lack of competitive pressure,and to some abuse of market power. After World War II, an ideological shift in favor of publicownership encompassed infrastructure also, and public provision became the dominant model.This took place within a political environment which favored centralized economic planning –often of a highly dirigiste nature. This model was subsequently exported to developingcountries, many of whom were newly-independent and were seeking to expand theirinfrastructure rapidly. In many cases, this preference in developing countries for public

The Infrastructure Challenge
53
provision of infrastructure was accentuated by a post-colonial antipathy to foreign investment, ata time in which private domestic capital for large-scale investment was almost non-existent.
But public infrastructure performance was often below expectations. Prices were frequently keptbelow costs, and costs were often excessively high. Competition or other incentive mechanismsto reduce costs proved difficult to implement in the state sector, even where technologicaladvance made it more feasible. Vested interests resisted performance improvements in order toretain the benefits of overstaffing or appropriation of monopoly rents for personal or politicalpurposes. Accountability to customers or citizens for performance was generally weak. Supply-driven or corruption pressures led to white elephant investments and an inherent bias againstfunding maintenance. State-owned enterprises were burdened with many non-commercialobjectives.
Low tariffs were often not targeted to the poor (who frequently didn’t have service accessanyway because of funding constraints), but instead were directed at middle class groups withpolitical voice. Sometimes the resulting deficits were funded from cross-subsidies, often fromcommercial customers (thereby effectively taxing production and employment). Sometimes theywere funded from government budgets or quasi-fiscal loans from state-controlled financialinstitutions, often with a poor repayment record. And sometimes the deficits were funded bycapital consumption (lack of maintenance or capital replacement) or by reducing operations.
In the late 1970s and early 1980s many countries started to undergo fiscal compression, as aresult of global recession, inflation, and commodity price shocks. This was compounded by anideological shift in favor of the private sector, and ushered in an era of fiscal conservatism andslimming down the direct economic role of government. An impetus towards private provisionof infrastructure remerged, and by the late 1980s had spread to East Asia in a range or forms,from management contracts to transfer of ownership to the private sector. This trend acceleratedin the early 1990s. Indonesia, the Philippines, Thailand, and Malaysia were initially at theforefront of this process, but China, Vietnam and others were players also (Figure 1.8).
In many cases, private participation in infrastructure was pursued under fiscal pressure.20
Subsidies were drying up, and infrastructure assets were seen as a potential source of publicrevenue if privatized. Poor performance resulting from underfunding increased public supportfor change. East Asia was growing rapidly, and was attracting investor interest; global costs ofcapital were cyclically low, appetites for emerging market risk were correspondingly high, andplanning horizons generally short. Few actors had yet had bad experience – or indeed muchexperience at all - in private infrastructure in developing countries.
20 In contrast to the Latin American experience, East Asian private participation in infrastructure tended to beconfined to individual greenfield projects with little sector restructuring, rather than privatization of existing assetsin the context of sector-wide reforms designed to enhance overall efficiency.

The Infrastructure Challenge
54
Figure 1.8: East Asia has attracted significant levels of private sector investment in infrastructure, althoughlargely concentrated in a small number of countries
Private sector investment in East Asia and globally, 1990-2004 Share of total East Asian investment /US$ million number of projects in brackets
Note: other = Cambodia (15); Fiji (2); PNG (2); Samoa (1); Solomon Islands (1); Vanuatu (1)Source: World Bank PPI database (2005).
But the underlying political economy had not greatly changed. The political incentives remainedfor government to regulate prices tightly. In fact, years of subsidies to the middle classes hadstrengthened those incentives. Concession contracts or regulatory frameworks may have impliedcost-reflective tariffs, but politically realities in countries where property rights can be fragilesuggested otherwise. And fiscal conservatism meant that subsidies were often not available tocover the deficits that resulted from low tariffs (or subsidies were kept off the fiscal books,which made it hard to be sure they would be honored in times of fiscal crisis).
Firms therefore wanted to push up tariffs, while governments wanted to keep them down (i.e. tohave firms fund the subsidies to the middle class that governments didn’t want to pay forthemselves). Lack of sector restructuring to accompany private participation meant thatcompetitive pressures to reduce costs and improve performance were often not much greater thanthey had been under public ownership – so cost-reflective tariffs were high and politicallycontentious. Some deals created perceptions of corruption and cronyism. The warning signs forprivate infrastructure were in place.
And then in the late 1990s came financial crisis in emerging markets, rapid currency declines,the bursting of the bubble in global capital markets, and sectoral crises in the wake of the Enronscandal and the end of the telecoms boom. Several East Asian countries faced economiccollapse, which plunged millions into poverty. In turn this economic crisis brought in a period ofdramatic political change – a wave of democratization has since been sweeping the region.
Under these pressures, many private infrastructure deals were renegotiated (voluntarily orotherwise), damaging investor perceptions. Many were cancelled (see Figure 1.9). Tariffadjustments to offset currency depreciation were highly unattractive both politically and
China (361)
Malaysia
(74)
Other (22)
Indonesia
(67)
Thailand
(77)
Vietnam
(15)
Philippines
(70)
0
50,000
100,000
150,000
200,000
250,000
300,000
350,000
400,000
Sub-Saharan
Africa
Middle Eastand North
Africa
Europe andCentral Asia
South Asia LatinAmericaand the
Caribbean
East Asia
Greenfield projects
Concessions, divestitures, lease andmanagement contracts

The Infrastructure Challenge
55
economically in such a period. Governments suddenly found they had underwritten much morecontingent off-budget support for private infrastructure than they had realized or now felt theycould afford. The role of capital flight and currency speculation in the financial crisis turnedpublic sentiment against foreign investment. In some countries, democratization brought aflourishing civil society newly-vocal in its criticisms of government policies, including those onprivate participation, financial management, and tariff adjustments. Private investor interestdeclined sharply, governments became much more cautious, and civil society was decidedlyskeptical. For a while private investment in infrastructure was out of fashion in East Asia.Nobody – government, private sector, or civil society - wanted to take the risk.
The economic crisis is now over, most countries have resumed high growth levels, and privateinvestment in general is beginning to recover. But private investment in infrastructure isreturning only very cautiously, and governments are sometimes tentative in their response.
The pendulum swings between public and private provision of infrastructure throw into relief anunderlying political reality: a policy and institutional environment that is lousy for the privatesector is lousy for the public sector too. Governments that have long-term economic vision andplan for the future can acknowledge the importance of efficiency incentives for infrastructureand of ensuring sustainable infrastructure financing mechanisms, regardless of ownership.Those governments will have a conception of how infrastructure makes its macroeconomiccontribution, how it will be financed, how policies should be coordinated, and how institutionsshould be developed.
Governments which live for the short term will be tempted to deprive long-lived infrastructureassets of adequate funding, and will be reluctant to undertake risky sector reforms – againregardless of ownership. In those countries, infrastructure development will be more piecemeal,financing more ad hoc, and institutions more fragile and fragmented.
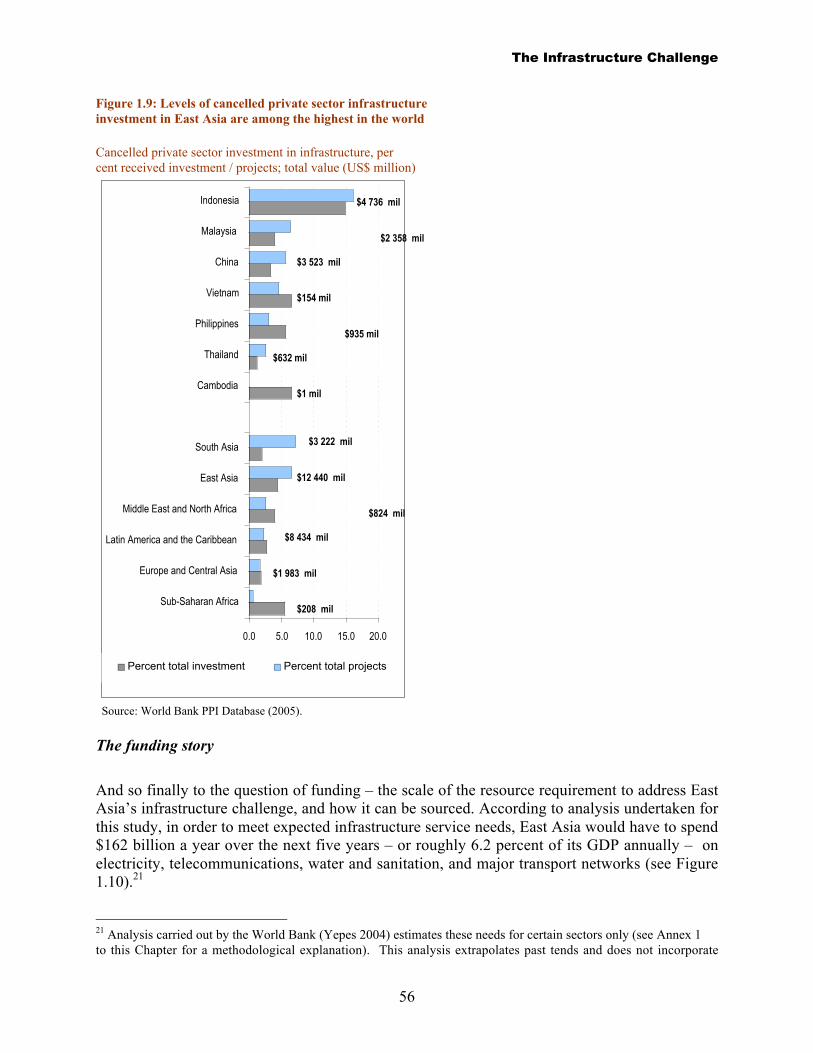
The Infrastructure Challenge
56
Figure 1.9: Levels of cancelled private sector infrastructureinvestment in East Asia are among the highest in the world
Cancelled private sector investment in infrastructure, percent received investment / projects; total value (US$ million)
0.0 5.0 10.0 15.0 20.0
Sub-Saharan Africa
Europe and Central Asia
Latin America and the Caribbean
Middle East and North Africa
East Asia
South Asia
Cambodia
Thailand
Philippines
Vietnam
China
Malaysia
Indonesia
Percent total investment Percent total projects
Source: World Bank PPI Database (2005).
The funding story
And so finally to the question of funding – the scale of the resource requirement to address EastAsia’s infrastructure challenge, and how it can be sourced. According to analysis undertaken forthis study, in order to meet expected infrastructure service needs, East Asia would have to spend$162 billion a year over the next five years – or roughly 6.2 percent of its GDP annually – onelectricity, telecommunications, water and sanitation, and major transport networks (see Figure1.10).21
21 Analysis carried out by the World Bank (Yepes 2004) estimates these needs for certain sectors only (see Annex 1to this Chapter for a methodological explanation). This analysis extrapolates past tends and does not incorporate
$4 736 mil
$2 358 mil
$3 523 mil
$154 mil
$935 mil
$632 mil
$1 mil
$3 222 mil
$12 440 mil
$824 mil
$8 434 mil
$1 983 mil
$208 mil
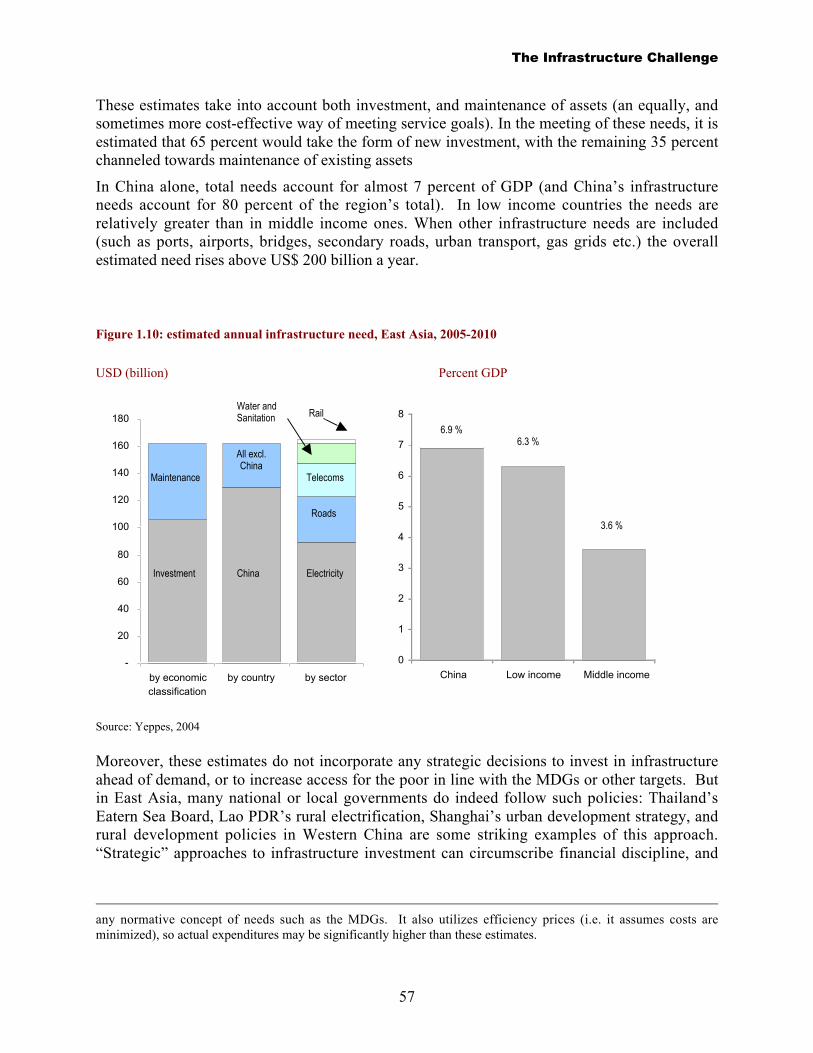
The Infrastructure Challenge
57
These estimates take into account both investment, and maintenance of assets (an equally, andsometimes more cost-effective way of meeting service goals). In the meeting of these needs, it isestimated that 65 percent would take the form of new investment, with the remaining 35 percentchanneled towards maintenance of existing assets
In China alone, total needs account for almost 7 percent of GDP (and China’s infrastructureneeds account for 80 percent of the region’s total). In low income countries the needs arerelatively greater than in middle income ones. When other infrastructure needs are included(such as ports, airports, bridges, secondary roads, urban transport, gas grids etc.) the overallestimated need rises above US$ 200 billion a year.
Figure 1.10: estimated annual infrastructure need, East Asia, 2005-2010
USD (billion) Percent GDP
Source: Yeppes, 2004
Moreover, these estimates do not incorporate any strategic decisions to invest in infrastructureahead of demand, or to increase access for the poor in line with the MDGs or other targets. Butin East Asia, many national or local governments do indeed follow such policies: Thailand’sEatern Sea Board, Lao PDR’s rural electrification, Shanghai’s urban development strategy, andrural development policies in Western China are some striking examples of this approach.“Strategic” approaches to infrastructure investment can circumscribe financial discipline, and
any normative concept of needs such as the MDGs. It also utilizes efficiency prices (i.e. it assumes costs areminimized), so actual expenditures may be significantly higher than these estimates.
-
20
40
60
80
100
120
140
160
180
by economicclassification
by country by sector
0
1
2
3
4
5
6
7
8
China Low income Middle income
Rail
Maintenance
Investment China
All excl.China
Electricity
Roads
Telecoms
Water andSanitation
6.9 % 6.3 %
3.6 %
The Infrastructure Challenge
58
therefore bring risks of inefficiencies and corruption, but there are nonetheless plenty of regionalsuccess stories. And so infrastructure needs in the region could therefore legitimately
Box 1.6: What about efficiency?
East Asia has seen considerableamounts of investment ininfrastructure in the past. Andequally large amounts are likely tobe spent in the future.
Delivering infrastructure servicesclearly requires resources. And this iswhy policy makers focus onexpenditure levels (whether oninvestment or operations andmaintenance).
But the same level of spendingcan yield very different serviceoutcomes. Efficiency of expenditure –getting the most service out of everyyuan, peso, dollar or rupiah – mattersenormously.
In the framework we set out inthis study, inefficiency is not a theme.It is an outcome that arises when thefocus of policy is not inclusivity,when coordination is poor, when
accountability is lacking, and risks arebadly managed.
When we talk about the costlyenvironmental infrastructure impactswe are talking about inefficiency. Andlikewise when we consider poorlyaligned spatial and sectoral planning;infrastructure retrofitting; badlyfunded utilities providing poorservices because consumers pay tolittle, or tax-payers subsidize too little,or both (Chapter 1).
Inefficiency is also wheninfrastructure has lower economicreturns because the poor were nottaken into account; when disabledaccess has to be funded post-investment; when returns oninfrastructure are lowered becauseregional coordination was notpursued; when infrastructure didnot link the right people, to the
right market, at the right time(Chapter 2);
Inefficiency is also wheninfrastructure investments are notaligned with long termdevelopment strategies; whenfinancing is out of synch withplanning; when not enoughemphasis is given to maintenanceof existing assets; when spilloversacross municipalities are poorlymanaged; where differentjurisdictions engage in “destructivecompetition”; when scarceresources are fragmented; whenvertical coordination is weak(Chapter 3).
And it is also whenaccountability breaks down,financial risks are realized,corruption destroys value (Chapter4).
Who funds infrastructure? Tax payers, consumers, and the role of finance
How can East Asia achieve the resource required to meet these estimated needs? Ultimately,there are only two ways in which infrastructure is funded: by consumers (via user charges) andby taxpayers (via subsidies) – as shown in Figure 1.11. Financiers – whether the private sector,or official lenders and donors – can change the requisite time profile of taxes or user charges byproviding financing in the form of loans or equity, but eventually those need to be repaid orremunerated (or at least, failure to do so will generally rebound on to taxpayers or consumerssubsequently through a higher cost of capital).
This ability to change the time profile of taxes and user charges can be very important politically– effectively allowing a smoothing of tax or tariff increases. It can also be welcomed from thepoint of view of competitiveness for the economy or affordability for households, permittingtime to adjust to higher tariffs levels. But loans and equity per se do not generally add to thetotal resources available to an economy over time.22 In effect, they unlock the potential of otherresources by allowing investment to take place despite economic or political constraints – taxesand user charges remain central.
22 One exception to this general point is the grant element in official loans and grants, which does provide additionalresources. Conceptually, this can be seen as foreign taxpayers supplementing the resources available from domestictaxpayers, rather than being considered to be financing as such.
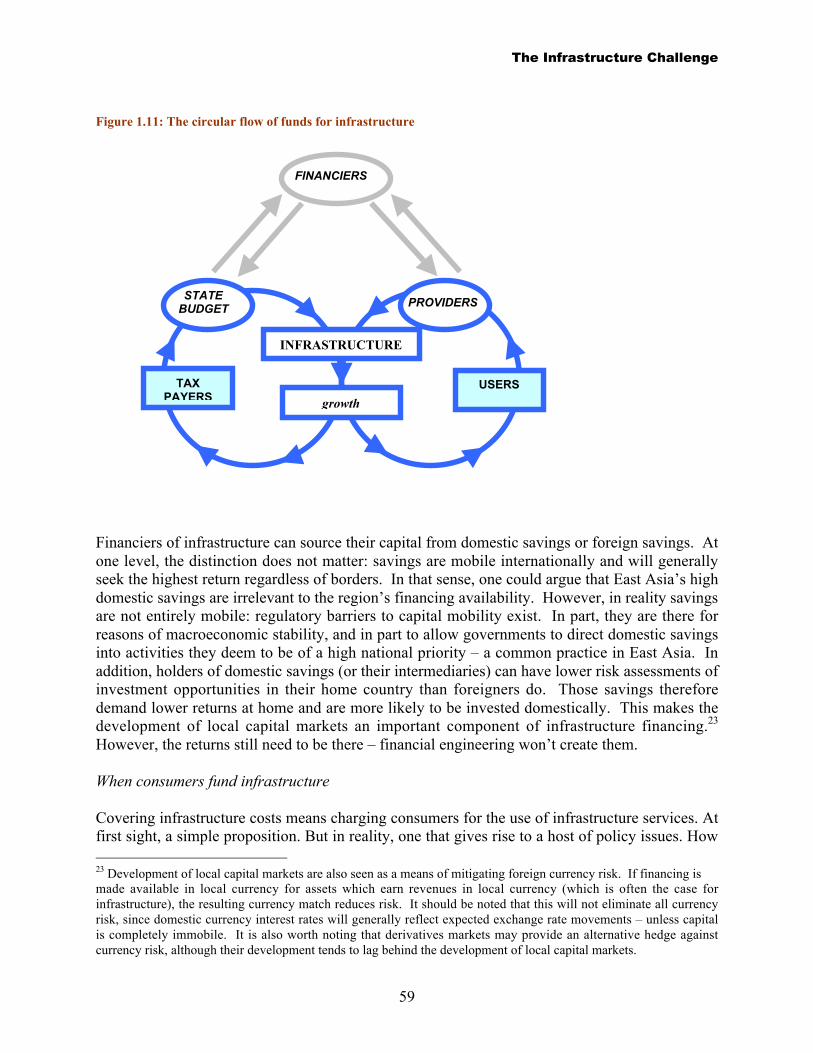
The Infrastructure Challenge
59
Figure 1.11: The circular flow of funds for infrastructure
Financiers of infrastructure can source their capital from domestic savings or foreign savings. Atone level, the distinction does not matter: savings are mobile internationally and will generallyseek the highest return regardless of borders. In that sense, one could argue that East Asia’s highdomestic savings are irrelevant to the region’s financing availability. However, in reality savingsare not entirely mobile: regulatory barriers to capital mobility exist. In part, they are there forreasons of macroeconomic stability, and in part to allow governments to direct domestic savingsinto activities they deem to be of a high national priority – a common practice in East Asia. Inaddition, holders of domestic savings (or their intermediaries) can have lower risk assessments ofinvestment opportunities in their home country than foreigners do. Those savings thereforedemand lower returns at home and are more likely to be invested domestically. This makes thedevelopment of local capital markets an important component of infrastructure financing.23
However, the returns still need to be there – financial engineering won’t create them.
When consumers fund infrastructure
Covering infrastructure costs means charging consumers for the use of infrastructure services. Atfirst sight, a simple proposition. But in reality, one that gives rise to a host of policy issues. How 23 Development of local capital markets are also seen as a means of mitigating foreign currency risk. If financing ismade available in local currency for assets which earn revenues in local currency (which is often the case forinfrastructure), the resulting currency match reduces risk. It should be noted that this will not eliminate all currencyrisk, since domestic currency interest rates will generally reflect expected exchange rate movements – unless capitalis completely immobile. It is also worth noting that derivatives markets may provide an alternative hedge againstcurrency risk, although their development tends to lag behind the development of local capital markets.
INFRASTRUCTURE
growth
TAXPAYERS
USERS
STATEBUDGET
FINANCIERS
PROVIDERS

The Infrastructure Challenge
60
much of the costs of infrastructure provision should consumers pay, how much should besubsidized by tax payers? When are users unwilling to pay, and when are they are unable to pay?Should the poor pay less than the non-poor? Is it preferable to provide a less expensive service ata lower rate? If costs are to be subsidized, which users capture those subsidies? And when is costrecovery a matter of low tariffs, and when a matter of inefficient service provision leading tohigh costs? Many questions, to which the answers vary by sector, country and policy regime.
In the water sector, for instance, tariffs are insufficient to cover even operating and maintenancecosts of many of the region’s water utilities (Figure 1.12). Taking into account capital costs, it isunlikely that any water utilities in East Asia (and few in the world) achieve full cost recovery24 .This is not a situation that plays out in every sector (among infrastructure sectors, water mostexhibits natural monopoly characteristics, and is least amenable to competition), but aninstructive example nonetheless.
Non-cost reflective (average) tariffs may arise for many reasons. They may reflect theexcessively high costs of inefficiently run services, which consumers cannot reasonably meet.But sometimes costs may be high for good reason (reflecting, for instance, the cost of networkexpansion or natural supply constraints), but nonetheless be unaffordable.
Sometimes tariffs remain low when there is a reasonable case for raising them, for politicalreasons: Infrastructure assets are often long-lived, and so infrastructure providers can be starvedof funds before deterioration becomes noticeable. When politicians have short time-horizons, thepopularity of low tariffs is more important to them than the medium-term costs.
Sometimes policy makers keep average tariffs below cost-recovery levels in order to protect thepoor. And this is where many of the key policy questions we flagged arise. In fact, whengovernment lack good information about where the poor live, how they access infrastructure, andthe choices they would make if they could choose between different services and price options,keeping average tariffs low may not be an unreasonable position.
Although it has its down-side too: Research over the past decade has repeatedly shown that it’sprimarily the relatively well-off who are able to connect to utilities networks that price belowcost – extending services to the poor is too expensive for the utility. This leaves the poor toprovide for themselves, frequently at much higher prices. In Indonesia, for instance, one surveysuggests that people unable to access the services provided by the local utility, PDAM, paidbetween 33 and 122 times the price-per volume faced by PDAM customers (World Bank 2004a)
There is now a growing consensus that subsidies can and often should be used to meet the needsof consumers who are too poor to pay for services. The challenge is how to design instrumentsthat most effectively target the most needy, while trying to ensure that average tariffs are as closeto cost recovery levels as possible.
24 On the basis that up to 80 percent of the costs of delivering water are fixed costs (see Castalia (2004c) for moredetails)

The Infrastructure Challenge
61
Figure 1.12: Few water utilities cover even O&M costs
Working ratio (O&M costs per m3 / tariff per m3), selected utilities
0
1
2
3
Engl
and
and
Wal
es
Phno
m P
enh
Che
ngdu
Jaka
rta
Ula
anba
atar
Shan
ghai
Vien
tiane
Ho
Chi
Min
h
Man
ila
Kual
a Lu
mpu
r
Hon
g Ko
ng
Source: ADB (2004b).
There are a host of options, but they basically work in the three main ways (Estache 2004): byreducing bills, through, for instance, means-tested subsidies; by reducing the cost of services byimproving efficiency; and by making it easier for the poor to pay their bills. But effectivetargeting is difficult. It requires data that are often unavailable (Gomez-Lobo, Foster andHalpern, 2000). And of course subsidies also bring with them economic efficiency and incentivecost problems – although recent analysis suggests that in many cases these costs are modest(Ravallion, 2003).
When tax-payers fund infrastructure
The kind of subsidies we have been talking about are frequently transfers from tax-payers toinfrastructure users. When taxpayers fund infrastructure, a number of important microeconomicquestions arise. Is the tax revenue channeled into public expenditures with the highest rates ofreturn? Are the expenditures transparent or are there contingent liabilities which are hard tomonitor? In East Asia, with its high levels of directed lending from state-controlled financialinstitutions and revenue guarantees to infrastructure service providers (both in essence quasi-fiscal subsidies) this is a hugely important question. Are subsidies designed in a cost-minimizingmanner? Is there an exit strategy to phase out subsidies? Is the balance between expenditures oninvestment and on operations and maintenance appropriate? And subsidies also have importantimplications for risk management and accountability – issues we shall take up in more detail inChapter 4.
There is also a vital macroeconomic question: is there too much public expenditure oninfrastructure, thus jeopardizing fiscal stability (and hence also the investment climate). Or isthere too little expenditure, thus endangering economic growth and poverty reduction. This hasbecome known as the “fiscal space” debate, and has arisen primarily as a result of decade of
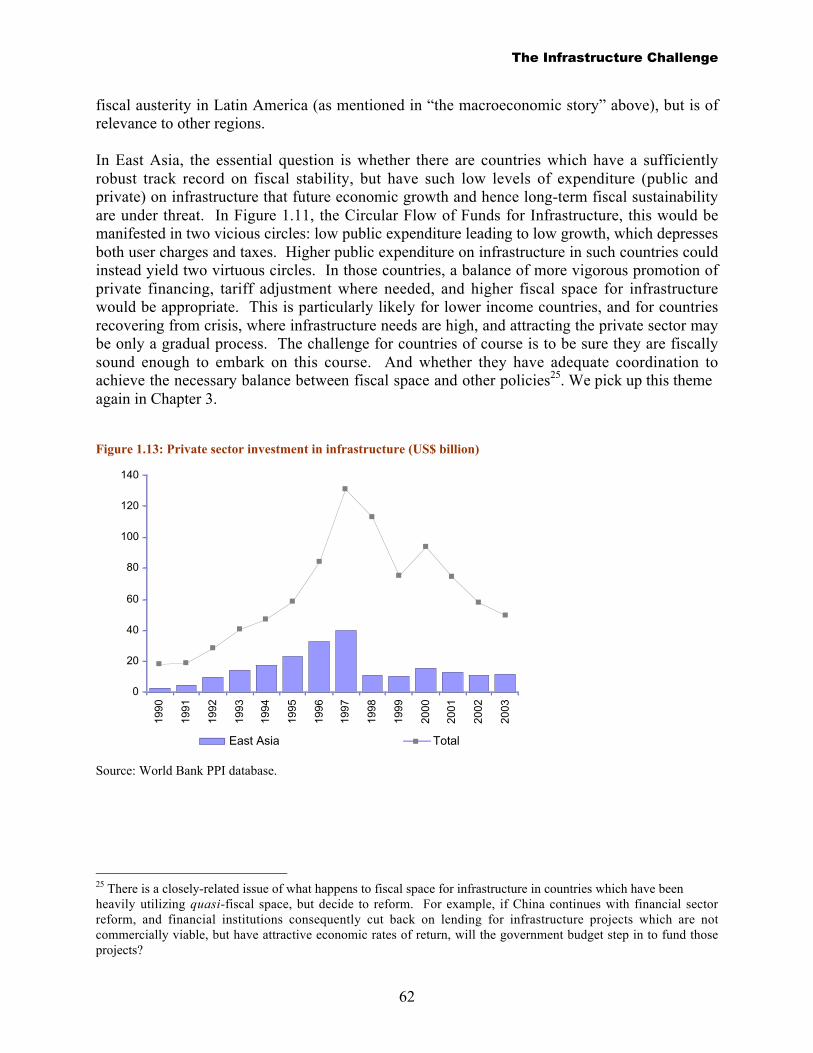
The Infrastructure Challenge
62
fiscal austerity in Latin America (as mentioned in “the macroeconomic story” above), but is ofrelevance to other regions.
In East Asia, the essential question is whether there are countries which have a sufficientlyrobust track record on fiscal stability, but have such low levels of expenditure (public andprivate) on infrastructure that future economic growth and hence long-term fiscal sustainabilityare under threat. In Figure 1.11, the Circular Flow of Funds for Infrastructure, this would bemanifested in two vicious circles: low public expenditure leading to low growth, which depressesboth user charges and taxes. Higher public expenditure on infrastructure in such countries couldinstead yield two virtuous circles. In those countries, a balance of more vigorous promotion ofprivate financing, tariff adjustment where needed, and higher fiscal space for infrastructurewould be appropriate. This is particularly likely for lower income countries, and for countriesrecovering from crisis, where infrastructure needs are high, and attracting the private sector maybe only a gradual process. The challenge for countries of course is to be sure they are fiscallysound enough to embark on this course. And whether they have adequate coordination toachieve the necessary balance between fiscal space and other policies25. We pick up this themeagain in Chapter 3.
Figure 1.13: Private sector investment in infrastructure (US$ billion)
0
20
40
60
80
100
120
140
1990
1991
1992
1993
1994
1995
1996
1997
1998
1999
2000
2001
2002
2003
East Asia Total
Source: World Bank PPI database.
25 There is a closely-related issue of what happens to fiscal space for infrastructure in countries which have beenheavily utilizing quasi-fiscal space, but decide to reform. For example, if China continues with financial sectorreform, and financial institutions consequently cut back on lending for infrastructure projects which are notcommercially viable, but have attractive economic rates of return, will the government budget step in to fund thoseprojects?

The Infrastructure Challenge
63
Box 1.7: So why didn’t the private sector solve all East Asia’sinfrastructure problems?
A number of possible reasons:(1) The initial expectations
about levels of private investmentwere not realistic. The majority ofinfrastructure investment in themajority of countries – developed ordeveloping – is publicly-owned andoperated. It would take a very longtime for private investment to evenovertake public investment let alonedisplace it. Not all sectors arecreated equal – some are moreattractive to private investment thanothers.
(2) There was a globaldownturn in capital marketsgenerally, and in the power andtelecommunications sector inparticular. However, when thosemarkets recovered, East Asianinvestment turned up only slightly.Clearly local factors were moreimportant than global ones.
(3) East Asia undertook onlylimited infrastructure sector reform,and minimal privatization ofexisting assets (most investmentswere greenfield). Competition andindependent regulation did not playa major role. Most privateinvestment therefore took placewithin more or less the sameincentives framework as hadpreviously existed, so performancecould not really be expected tochange very much. Lack of reformmeant that many private providershad only one customer – a stateenterprise. This was risky.
(4) Government often proved tobe unpredictable and property rightswere difficult to enforce. Judicialsystems did not always help much.Bargains obsolesced onceinvestments were sunk. Marketgrowth helped offset these politicalrisks to some extent, but not enough.
(5) The subsidy framework wasvery unclear. Infrastructure servicesoften enjoyed hidden subsidies thatwere reduced quite abruptly whenthe private sector came in.Consequent tariff increases createdpolitical backlashes against theprivate sector (particularly foreigninvestment). Sometimes tariffsincreases came early, serviceimprovements only later.
(6) However, some hiddensubsidies remained, particularly inthe form of guarantees where thestate was the sole customer for theprivate provider (these guaranteesusually went unrecognized in fiscalaccounts). The 1997 crisis causedmany of those guarantees to becalled up: as a result governmentseither faced unexpected fiscalpressure or reneged on theguarantees. This discredited theconcept of private investment.
(7) Contractual agreements withthe private sector were not crisis-proof. Even though currency crisescan be expected to happen sometime during the long life of aninfrastructure asset, few contractsanticipated that eventuality.
(8) Too many private sectordeals were tainted with corruptionallegations. Few people made acomparison between the allegedcorruption in those private sectordeals to the corruption in publicsector projects.
(9) Determining how best toallocate risk between public andprivate sectors in infrastructure is anexperimental process. What isinitially seen as outright failure, canbe seen as a learning experienceonce the dust has settled. And lifecan then move on.

The Infrastructure Challenge
64
When the private sector finances infrastructure
As for private financing of infrastructure, developments in East Asia have to be viewed againstglobal trends. Private investors have invested approximately $190 billion in East Asianinfrastructure since 199026. But even at its mid-1990’s peak, was only a minor share of totalinfrastructure investment in the developing world – 20 to 25 percent – as well as in much of thedeveloped world.27 And the private investment bubble of the mid-90s has now burst throughoutthe developing world.28
However, annual private infrastructure investment levels in developing countries as a wholewere still about 50 percent higher in 2001-03 than in 1990-95, while in the region they wereroughly the same over those two periods (see Figure 1.13 and World Bank 2004f). In short, thecurrent levels of actual new direct investment in East Asia appear to have stabilized at the levelsof about 10 years ago, lagging behind the global average. Private investment appears to financeonly about 5 percent of the region’s total investment needs today, compared to perhaps 20percent at its peak. Clearly these trends are partly an issue of cycles in global capital markets,and partly a matter of the investment climate for infrastructure in the region.
A survey undertaken for this study shows very positive sentiment among potential privateinvestors in East Asian infrastructure. But this sentiment varies by country and sector, and isvery contingent on policy improvements to reduce risk (see Figure 1.14).29 East Asian investorsare somewhat more optimistic than investors from outside the region, but a large majority ofthose surveyed plan to “wait and see” whatever their origin.
Much needs to be done on the policy and institutional front to mitigate risks for the private sector– but most of it needs to be done for the public sector too. In essence, the core issues are notpublic versus private, but about how they share the risk and rewards in a way that works for bothsides, and how the public sector harnesses the efficiency gains that the private sector can bring.The sources of funding and ownership are secondary.
26 World Bank, PPI database. Note that the PPI Project Database records total investment in infrastructure projectswith private participation, not private investment alone. Investment commitments include expenditures on facilityexpansion, divestiture revenues, and license or canon fees. For all infrastructure projects with private participation indeveloping countries, the private sector accounted, on average, for 85 percent to 90 percent of total investment.27 These are measures of investment in physical infrastructure (e.g. roads) rather than in infrastructure service assets(e.g. trucks). There are of course important subsectoral differences: private investment is most significant intelecommunications, second comes electricity, third is transport, and last comes water and sanitation.28 Significantly, private investment in infrastructure in the developed world seems to have recovered from the 1997crisis quite quickly. For example, project finance lending (one proxy measure for infrastructure investment trends)reached an all-time high in 2000, because the growth in such lending to developed countries (which climbed steadilyfrom 1997 onwards) more than offset the post-1997 decline in lending to developing countries (see Sorge 2004).29 This is one of the principal findings of the East Asia and Pacific Private Investors in Infrastructure PerceptionSurvey (2004). The survey included 50 interviews with infrastructure investors (all operators) active in East Asia(the firms were split roughly 50-50 between those from East Asia and those from elsewhere. This paper can befound on http://www.worldbank.org/eapinfrastructure.
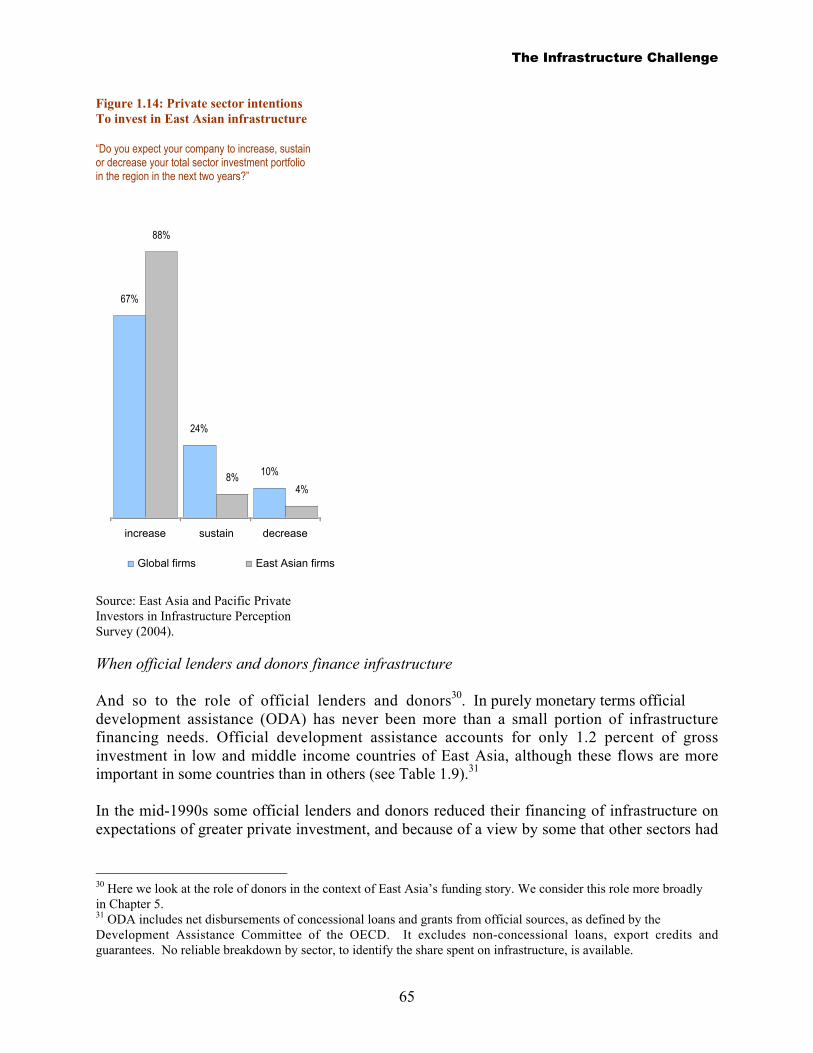
The Infrastructure Challenge
65
Figure 1.14: Private sector intentionsTo invest in East Asian infrastructure
“Do you expect your company to increase, sustainor decrease your total sector investment portfolioin the region in the next two years?”
24%
10%
88%
8%4%
67%
increase sustain decrease
Global firms East Asian firms
Source: East Asia and Pacific PrivateInvestors in Infrastructure PerceptionSurvey (2004).
When official lenders and donors finance infrastructure
And so to the role of official lenders and donors30. In purely monetary terms officialdevelopment assistance (ODA) has never been more than a small portion of infrastructurefinancing needs. Official development assistance accounts for only 1.2 percent of grossinvestment in low and middle income countries of East Asia, although these flows are moreimportant in some countries than in others (see Table 1.9).31
In the mid-1990s some official lenders and donors reduced their financing of infrastructure onexpectations of greater private investment, and because of a view by some that other sectors had
30 Here we look at the role of donors in the context of East Asia’s funding story. We consider this role more broadlyin Chapter 5.31 ODA includes net disbursements of concessional loans and grants from official sources, as defined by theDevelopment Assistance Committee of the OECD. It excludes non-concessional loans, export credits andguarantees. No reliable breakdown by sector, to identify the share spent on infrastructure, is available.

The Infrastructure Challenge
66
more direct impact on poverty reduction. Official financing also fell temporarily in the aftermathof the 1997 financial crisis due to creditworthiness concerns.
Box 1.8: Risk, return, and private investment in East Asian infrastructure
Given East Asia’s large markets,and significant potential returns, itis difficult to imagine that privatesector interest will not eventuallyrevive.
While it is not possible topredict when this will be, we can befairly confident about the conditionsunder which this return will takeplace: when the financial returns tocapital exceed the perceived risks.
How, in this respect, does EastAsia compare with other emergingand developing regions?
Evidence based on a sample ofcompanies active in electricity,
water, ports and railways suggeststhat the average risk-adjusted costof capital (CoC) – the hurdle ratefaced by investors – has beensignificantly lower in East Asia overthe period 1998-2002, than in anyother region of the world (Figure1.15).
And the same evidencesuggests that East Asia is the onlyregion in which returns on equity(RoE) are higher than the cost ofequity (CoE) - although just (Figure1.16).
One could speculate thatmarket growth is the primary
driver rather than policy reform,because East Asia has been slow toreform. But given that returns arejust sufficient to compensate thecost of capital, policy reform couldpush returns high enough to lead tosignificant private sectorinvestment. And with hugeinfrastructure needs, countries in theregion have every incentive toundertake those reforms.
Source: Estache and Pinglo (2004)
.
Figure 1.15: CoC, by region, percent (1998-2002) Figure 1.16: East Asia, CoE v RoE, percent, 1998-2002
0
4
8
12
16
East Asia& Pacific
SouthAsia
Europeand
CentralAsia
LatinAmerica
andCaribbean
Africa,MiddleEast 0
4
8
12
1998 1999 2000 2001 2002
Cost of Equity
Return onEquity

The Infrastructure Challenge
67
Official financing of infrastructure in the region is on the rise again. The contribution ofinfrastructure to poverty reduction – indeed of growth to poverty reduction – has beenreappraised. The depth of the policy and institutional challenge in infrastructure, and the long-term nature of reform, are now better appreciated. The emphasis has shifted away from theprivate sector’s potential replacement of the public sector, towards a relationship of mutualsupport and partnership between private and public actors. And so official lenders and donors arerepositioning themselves, and infrastructure now has a higher profile in the developmentcommunity at large.
In most infrastructure sectors there are activities in which private sector financing can helpunlock resources. But there are others in which private sector interest is likely to be limited,where private sector participation is more difficult to structure, or where the private participationcannot demonstrate additional value. This includes most rural infrastructure, for instance (exceptwhere smart subsidies can be brought to bear); infrastructure with strong natural monopolycharacteristics, like high-voltage transmission lines; most roads, except where traffic volumes(and willingness to pay) are high enough to justify tolls; and even potentially competitiveelements of network utilities that are rendered uncompetitive by small scale.
Table 1.9: Aid dependency in East Asia and the Pacific, 2002
Income Aid Aid as percentage of:
Per Capita Per Capita National Gross
(US$) (US$) Income Investment
Malaysia 3,540 4 0.1 0.4
Thailand 2,000 5 0.2 1.0
Philippines 1,030 7 0.7 3.7
China 960 1 0.1 0.3
Indonesia 710 6 0.8 5.3
PNG 530 38 7.5
Vietnam 430 16 3.6 11.3
Mongolia 430 85 18.6 60.8
Lao PDR 310 50 17.3
Cambodia 300 39 12.7 54.7
EAP Average /1 960 4 0.4 1.2
1/ For low and middle income countries.
Source: World Bank, World Development Indicators 2004.
In these situations official financing has an important role to play in unlocking a country’s ownresources to meet infrastructure challenges32. It may also have a role to play in leveraging privatesector finance. (Some studies suggest that official finance – in particular concessional loans –may even serve to encourage domestic revenue mobilization33).
32 To the extent that there is any concessional element in donor financing, that concessional element will be anaddition to a country’s domestic resources33 See Clements, Gupta, Pivovarsky, and Tiongson (2004).

The Infrastructure Challenge
68
However, the role of official lenders and donors is always going to be limited in comparison withthe scale of East Asia’s funding needs (although relative importance may vary by country). Thechallenge is how to focus those relatively small amounts of official financing so that their role ismaximised: in stimulating experimentation and innovation, supporting efficiency gains,mainstreaming environmental and social considerations, attracting private investors to share riskswith the public sector, and building effective institutions to plan, coordinate and regulateinfrastructure services. We will pick up this story again in Chapter 5, where we look morebroadly at the role of official lenders and donors.

The Infrastructure Challenge
69
Annex 1: Estimation of Infrastructure Needs
Overview of Methodology
Developing economies in East Asia will need to spend an estimated total of $162 billions perannum between 2006-2010 in certain infrastructure sectors, namely electricity,telecommunications, major paved inter-urban roads, rail routes, water and sanitation (comparedto an estimated $147 billion p.a. in 2000-2005).34 This amounts to nearly 6.2 percent of the GDPfor the region, comprising 4.0 percent for investment and 2.2 percent for maintenance. Further,China alone is expected to account for 80 percent of infrastructure expenditures in the region.Among the sectors, electricity in China has the largest share (44 percent) of total annualexpenditure in infrastructure in the region. See Table 1.10, Table 1.11 and Table 1.12 for moredetailed breakdowns.
Table 1.10: Investment and maintenance needs, East Asia 2006-2010, US$ and percent GDP
US$ million percent GDP
Investment Maintenance Total Investment Maintenance Total
Electricity 63,446 25,744 89,190 2.4 1 3.4
Telecom 13,800 10,371 24,171 0.5 0.4 0.9
Roads 23,175 10,926 34,102 0.9 0.4 1.3
Rails 1,170 1,598 2,768 0 0.1 0.1
Water 2,571 5,228 7,799 0.1 0.2 0.3
Sanitation 2,887 4,131 7,017 0.1 0.2 0.3
Total 107,049 57,998 165,047 4 2.3 6.3
Table 1.11: Investment and maintenance needs, China 2006-2010, US$ and percent GDP
US$ million percent GDP
Investment Maintenance Total Investment Maintenance Total
Electricity 51,668 20,739 72,407 0.6 0.4 1
Telecom 11,735 8,232 19,967 1 0.4 1.4
Roads 19,345 7,424 26,769 0.1 0.1 0.1
Rails 963 1,258 2,221 0.1 0.2 0.3
Water 2,097 4,090 6,187 0.1 0.1 0.2
Sanitation 1,830 2,644 4,474 4.6 2.3 6.8
Total 87,638 44,387 132,025 0 0 0
34 That is, the data exclude: urban roads, unpaved roads, secondary tertiary paved roads, mass transit, ports, airports,gas grids, bridges, and waterways. The analysis therefore excludes substantial infrastructure expenditures.

The Infrastructure Challenge
70
Table 1.12: Investment and maintenance needs, East Asia excluding China, 2006-2010,US$ and percent GDP
US$ million percent GDP
Investment Maintenance Total Investment Maintenance Total
Electricity 11,778 5,005 16,783 1.6 0.7 2.3
Telecom 2,065 2,139 4,204 0.3 0.3 0.6
Roads 3,830 3,503 7,333 0.5 0.5 1
Rails 207 341 547 0 0 0.1
Water 474 1,138 1,612 0.1 0.2 0.2
Sanitation 1,057 1,486 2,544 0.1 0.2 0.3
Total 19,411 13,612 33,023 2.6 1.9 4.5
These predictions follow the methodology used in Fay and Yepes 2003. Infrastructure stocktrends are obtained from a panel data estimation of the eight35 East Asian countries for whichadequate data were available using lagged dependent variables and controlling for economicgrowth and economic geographic variables. Projected stocks levels were then valued at “bestpractice costs”. Investment expenditures are calculated as the increment in stock values overtime, while the annual maintenance expenditures are estimated as a fixed percentage36 of thestock value.
Projections for 12 other countries37 were obtained by assuming the same sector expenditure as apercent of GDP as for those countries in the same income group within the sample of 8 countries.Estimates for Vietnam assume sector percentages equivalent to those in China. Collectivelythese 13 countries for which direct data were not available represent only 2 percent of the GDPof developing countries in East Asia, so using the indirect estimation method described abovedoes not introduce any possibility of serious bias in the overall results.
Note that the estimates do not capture any absolute measure of "need" such as those developed inthe Millennium Development Goals, nor do they estimate what will actually be spent.Projections are only what expenditure would be at “best practice” prices, and consistent withprojected economic growth rates. The prices used are a mixture of global, regional, and country-specific prices.
35 Countries included in the model are China, Indonesia, Lao PDR, Malaysia, Mongolia, Papua New Guinea, thePhilippines, and Thailand, which collectively represent 98 percent of the total GDP of the 21 developing countries inthe East Asia and Pacific region.36 For electricity, roads and railways we use 2 percent, water and sanitation 3 percent, and telecommunications 8percent.37 Cambodia, Fiji, Kiribati, Marshall Islands, Micronesia, Myanmar, Palau, Samoa, Solomon Islands, Timor Leste,Tonga, and Vanuatu.

The Infrastructure Challenge
71
Methodology by Sector
Electricity
Estimates for electricity include power generation capacity and associated networks fortransmission and distribution. A model is used to project kilowatts of generation capacity percapita based on a dataset in 5-year blocks covering 1960-2000. Physical stock is then valued at$1000 per kilowatt of plant generation capacity plus $900 for the associated transmission anddistribution networks (based on IEA 2003 which estimates that investment in generation indeveloping countries will account for about half of the total investments in the sector).
Generation capacity is a supply indicator and our estimations work with the assumption thatgovernments provide it based on planned demand to avoid recurrent outages.
Telecommunications
Estimates of infrastructure investment needed in East Asia are also strongly driven by demandfrom the telecom sector. This is expected to be the result of a rapidly expanding mobile market,which is already the biggest in the world. In China penetration rate for mobile phones is alreadyup to 170 lines per 1000 people in 2003 compared to 18 in 2000. For the region as a whole, therewere approximately 230 million mobile phone users in 2003, and market analysts estimate themarket to be growing at 4 million per month. Further, unmet demand for landlines remains quitehigh in East Asia. The waiting period for telephone connections is more than 10 years in thePhilippines, and about 2.6 years in Indonesia in 1993. Together these two factors, i.e. growth incellular phone usage and existing unmet demand, will contribute to a significant demand forinvestment.
Unit costs for telecommunications are particularly difficult to project given the high rate oftechnological progress in the sector. The cost projections are taken from Pyramid 2004 andWorld Bank sector specialists, but are subject to a considerable margin of error.
Roads and Rails
Estimations for the stock of roads (and the investment required to both maintain and add to thestock) refer to the paved networks, taking into consideration expressways, first and second-classroads. These results do not include urban and county networks, and unpaved roads. Paved roadswere divided into land area to capture country size differentials (the same has been done for allother sectors by dividing the stock by population). Roads as well as rails used 5-year data blocks.
Unit cost for roads is the average of paving type interventions available for the region in theROCKS database. The Chinese National Trunk Highway System, to be completed in 2007, wasaccounted for at implicit unit cost of $150 billions for 35.000kms. The Figures assume the levelof highways in China to continue growing at the same rate after 2007.

The Infrastructure Challenge
72
Other transportation sub sectors were not included due to lack of historical information. Data onwaterways including any ocean or inter-island shipping routes, ports or airport are hardlyavailable for this period and not likely to depend on the determinants that we use to projectinfrastructure stocks.
Water and Sanitation
Lack of historical and consistent information across countries is one the main hurdles in waterand sanitation analysis, due to considerable heterogeneity in supply mechanisms acrosscountries. Even the definition of what is acceptable access to water or sanitation is fraught withdifferences. This report uses definitions currently used in the World Development Indicators.The definitions are:
• Access to an improved water source refers to the percentage of the population withreasonable access to an adequate amount of water from an improved source, such as ahousehold connection, public standpipe, borehole, protected well or spring, and rainwatercollection. Unimproved sources include vendors, tanker trucks, and unprotected wells andsprings. Reasonable access is defined as the availability of at least 20 liters a person a dayfrom a source within one kilometer of the dwelling.
• Access to improved sanitation facilities refers to the percentage of the population with atleast adequate excreta disposal facilities (private or shared, but not public) that caneffectively prevent human, animal, and insect contact with excreta. Improved facilities rangefrom simple but protected pit latrines to flush toilets with a sewerage connection. To beeffective, facilities must be correctly constructed and properly maintained.
Comparable data for access water and sanitation are only available for 1990 and 2000. Weestimate a random coefficients panel data model for those two years using 139 middle and low-income countries across the world.
Multiplying projected access rates by projected number of households yields estimates for stockof connections available for each period in time. The estimated stock has then been valued atbest practice unit cost to yield sector stocks values that provides the basis to calculate thevariation (investment need) and depreciation (maintenance need).
73
2. Inclusive Development
Development, inclusiveness, and infrastructure
As we saw in Chapter 1, economic development in East Asia has typically been inclusive.Within countries it has benefited the poor, as well as the non-poor. Integration between andwithin countries has fostered high economic growth overall, and the fruits have generally beenshared. Inclusive development has brought political cohesion and social stability through mutualinterdependence. Infrastructure has underpinned that interdependence, and has played anessential role in making development inclusive.
But there is no assurance that this will continue into the future. Significant income disparitieshave developed in East Asia: between low- and high-income countries in the region, and withincountries. The structure of growth in many Asian countries has been changing. The dividebetween rural and urban areas is growing. Within rural areas there are some pockets of deeppoverty, often with an ethnic minority dimension. Coastal areas are prospering and are well-connected to global markets; remote and landlocked regions are lagging behind. Peri-urbanareas are becoming a volatile halfway house for migrants, urban environments are underpopulation pressure, and congestion is choking broad-based growth.
This chapter is about how infrastructure can reinforce inclusive development in East Asia. It isabout what we can expect infrastructure to do for growth and poverty reduction in the region.About what makes “good” infrastructure. As we shall see these are complex issues, and so wewill have to address them in a number of ways.
This chapter has four parts. We start by looking at what’s so different about infrastructure – atwhat infrastructure is – and how this relates to the principal themes of this study. This hasimportant implications for how we get infrastructure to serve the goals of inclusive development,and – as we pick up in Chapter 4 – for accountability.
What is “inclusive development”?
Inclusive Development equals Economic Growth plus Sharing the Benefits of Growth to reduce Poverty.
As we shall see, infrastructure helps connect the growth to the sharing of benefits, thereby making the developmentmore inclusive.
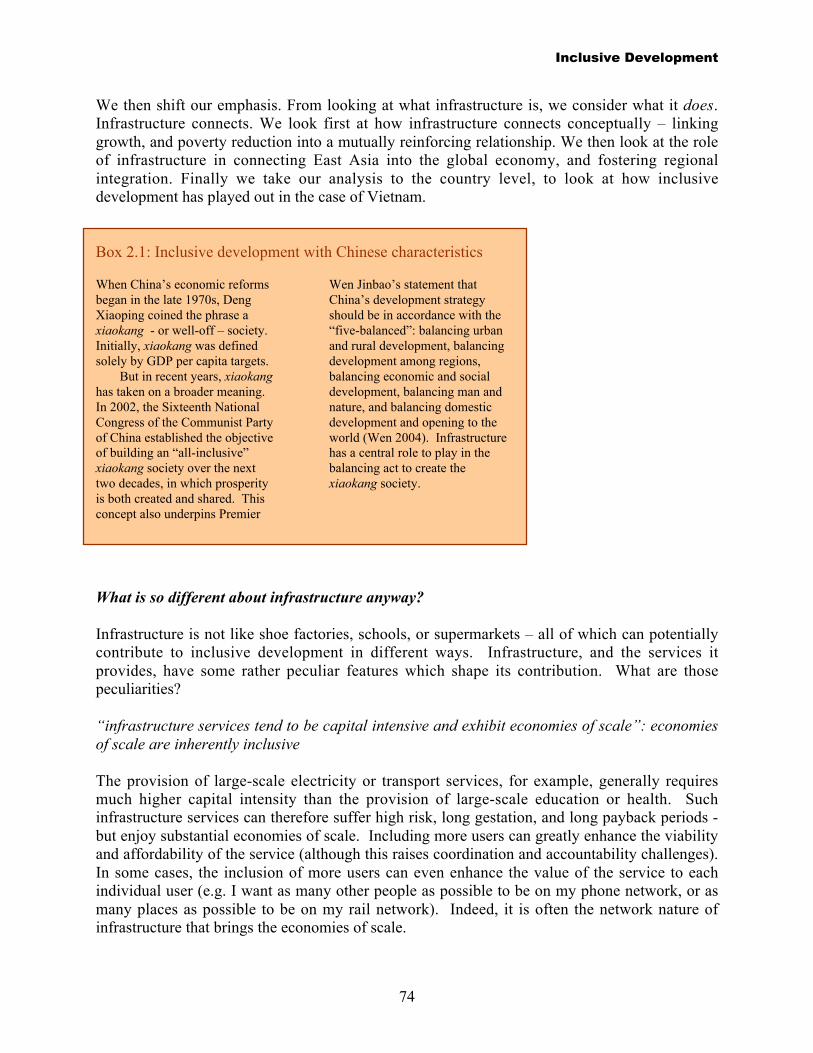
Inclusive Development
74
We then shift our emphasis. From looking at what infrastructure is, we consider what it does.Infrastructure connects. We look first at how infrastructure connects conceptually – linkinggrowth, and poverty reduction into a mutually reinforcing relationship. We then look at the roleof infrastructure in connecting East Asia into the global economy, and fostering regionalintegration. Finally we take our analysis to the country level, to look at how inclusivedevelopment has played out in the case of Vietnam.
Box 2.1: Inclusive development with Chinese characteristics
When China’s economic reformsbegan in the late 1970s, DengXiaoping coined the phrase axiaokang - or well-off – society.Initially, xiaokang was definedsolely by GDP per capita targets.
But in recent years, xiaokanghas taken on a broader meaning.In 2002, the Sixteenth NationalCongress of the Communist Partyof China established the objectiveof building an “all-inclusive”xiaokang society over the nexttwo decades, in which prosperityis both created and shared. Thisconcept also underpins Premier
Wen Jinbao’s statement thatChina’s development strategyshould be in accordance with the“five-balanced”: balancing urbanand rural development, balancingdevelopment among regions,balancing economic and socialdevelopment, balancing man andnature, and balancing domesticdevelopment and opening to theworld (Wen 2004). Infrastructurehas a central role to play in thebalancing act to create thexiaokang society.
What is so different about infrastructure anyway?
Infrastructure is not like shoe factories, schools, or supermarkets – all of which can potentiallycontribute to inclusive development in different ways. Infrastructure, and the services itprovides, have some rather peculiar features which shape its contribution. What are thosepeculiarities?
“infrastructure services tend to be capital intensive and exhibit economies of scale”: economiesof scale are inherently inclusive
The provision of large-scale electricity or transport services, for example, generally requiresmuch higher capital intensity than the provision of large-scale education or health. Suchinfrastructure services can therefore suffer high risk, long gestation, and long payback periods -but enjoy substantial economies of scale. Including more users can greatly enhance the viabilityand affordability of the service (although this raises coordination and accountability challenges).In some cases, the inclusion of more users can even enhance the value of the service to eachindividual user (e.g. I want as many other people as possible to be on my phone network, or asmany places as possible to be on my rail network). Indeed, it is often the network nature ofinfrastructure that brings the economies of scale.

Inclusive Development
75
Conversely, providing infrastructure services on a small scale can be expensive. But small canalso be beautiful, because it may involve low risk, limited need for coordination, or a positiveenvironmental impact – these factors can be worth the extra unit costs.
“infrastructure is usually lumpy rather than incremental”
Infrastructure tends to come in lumps, and those lumps tend to form networks. Roads connectingpopulation centers do actually need to go all the way, and to join other roads, in order to beuseful. A power plant with only ten percent of a turbine is not a power plant, and a power plantwithout a transmission and distribution grid doesn’t give many people power. An urban watersupply system can’t function with only half a treatment plant, and a whole treatment plant needsan extensive water distribution system to justify itself.
Of course some infrastructure can be incremental: a wind turbine, a borehole, a household boiler,a septic tank, a feeder road. Such infrastructure can be crucial in particular circumstances, suchas in rural or peri-urban areas, to realize environmental benefits, or to overcome financing andrisk constraints. Or incremental approaches may facilitate community participation ingovernance (lumpy infrastructure has a strong association with top-down institutions).Incremental infrastructure can certainly be the best available option for a particular communityof end-users. But with current technology, lumpy infrastructure will usually be the cheapest wayof providing for large-scale general use.
“infrastructure is long-lasting”
Once you’ve built it, it’s probably going to be there a long time, even if inattention tomaintenance reduces its useful life. A port, a street system, a sewerage network, mass transit, ahydropower dam, can last for decades. Once built, it can define for may years how and wherepeople live and work. It can define which areas prosper and which stagnate, who accumulateswealth and who does not, who exercises power and who has little voice. In short, who isincluded in development and who is not.
Periods of rapid urbanization present massive opportunities and challenges, and can shapeeconomies and societies profoundly. For some sectors, periods of rapid technological changecan radically change what used to make sense38.
So risks are high, and infrastructure mistakes can haunt you for a very long time. Missingwindows of opportunity can cost dearly, and so can locking in the wrong solutions. Long-termvision matters enormously.
38 Technological change can have a profound impact on infrastructure provision: it can change the longevity ofassets, affect the potential for competition and the challenge of regulation, and alter the balance betweenincrementalist approaches and lumpy ones. Telecommunications and some parts of transport for example have seensome radical technological development in recent decades (for instance, cellular telephony, or containerization).Energy has seen some important changes (such as the. introduction of combined-cycle gas turbines, advances in gasliquefaction), and may be on the verge of breakthroughs in decentralized and renewable solutions. In water andsanitation, technological change has been more modest.
Inclusive Development
76
“infrastructure is space-specific and use-specific”
Shoe factories, schools and supermarkets can move location, or can easily be used for somethingdifferent. Some harbors have become leisure centers, and power plants museums, but mostinfrastructure can’t go anywhere else or do something new (and its scrap value can be very low).
Infrastructure therefore makes a good hostage. With high sunk costs, revenues can be drivenway down and operation will continue (as long as variable costs are covered, it’s worse to stopthan to carry on). At the same time, those sunk costs and space-specificity mean monopolypower is quite likely. A hostage with monopoly power can attract predators, particularly whenthe services it provides are politically sensitive. Consequently, infrastructure faces considerablepolitical risk (and this is not just a private sector problem; public infrastructure can also bekidnapped by rent-seekers).
And space-specificity can bring local social and environmental impacts: dams can displacepeople nearby, vehicles kill people where the roads are, airports bring noise to host communities,power plants emit noxious chemicals locally, and untreated sewage is a health hazard for itsneighbors.
“infrastructure is complicated: it provides inputs for multiple purposes simultaneously - anddoes so along with multiple non-infrastructure inputs”
Infrastructure is intertwined with the fabric of our economic and social lives, and connects ustogether. For example, water reticulation can simultaneously be the energy source for electricity,the provider of drinking water and sanitation to households, the source of fertility for foodproduction, the source of steam for chemicals production, the carrier of heat for homes, and amedium of transport for people and goods. But that water helps produce chemicals, for example,only if there are skilled and healthy workers available, capital to fund the business, and a host ofother services to help it operate and sell its products. Infrastructure is useless in isolation.
The fact that so much of our lives depends so intricately on infrastructure services makes theirprovision very important both economically and politically - but also intrinsically hard to value.A disruption to water or energy supply, a breakdown in transport or telecommunications, canhave incalculable economic, environmental and social reverberations, but can be very expensiveto prevent. Correspondingly, reliable provision of those services can have benefits well beyondthe revenues accruing to the provider of those services, but do we know what those benefits areworth?
Knowing that infrastructure per se is important is very easy; measuring the precise importance ofa particular piece of infrastructure is very difficult. Our world would be unimaginable withoutelectricity, but that doesn’t mean it’s the highest priority for every village. Choices are all themore complex when programs of infrastructure are involved. Infrastructure priorities are hard tomeasure and choices hard to make. But choices do need to be made about infrastructure, so weneed to know what the impacts are, how they are channeled, and what they depend on.

Inclusive Development
77
Connecting growth, poverty reduction and investment through infrastructure
This study is about the connecting role of infrastructure. We can think of this in a number ofways. Here we start with the connecting role that infrastructure plays in a series of mutually-reinforcing relationships that links growth and poverty reduction – a subject on which thedevelopment world has come to broad consensus39.
In the first, place, infrastructure provides people with services they need and want. Water andsanitation, power for heat, cooking and light, telephones, computers and transport all makeimmeasurable differences in the lives of people. The absence of some of the most basicinfrastructure services is an important dimension of what we often mean when we talk aboutpoverty.
Infrastructure also impacts on the activities through which people earn their livings. Itcontributes to the health and education that people need to fill jobs, or create them. Butinfrastructure is also an intermediate input into production. Without power and water, all but themost basic production processes would grind to a halt. Infrastructure raises the productivity offactors of production – by generating the power that allows factories to mechanise, by allowingworkers to get to work quicker, or by providing the networks through which information canpass electronically. Infrastructure connect goods to markets, workers to industry, people toservices, the poor in rural areas to urban growth poles. Infrastructure lowers costs, it enlargesmarkets and facilitates trade.
In sum, infrastructure both impacts directly on poverty through services, and supports theprocesses of growth on which much poverty reduction depends. And at its best, infrastructuredraws poverty reduction, service provision and growth into a reinforcing cycle (Figure 2.1).
Figure 2.1. Linkages between Infrastructure, Poverty Reduction and Growth
39 See, for example, Prud’homme, 2004, Kessides, 1996 or DfID, 2002
Growth ServiceAccess
PovertyReduction
InfrastructureGrowthDeterminants
AccessDeterminants
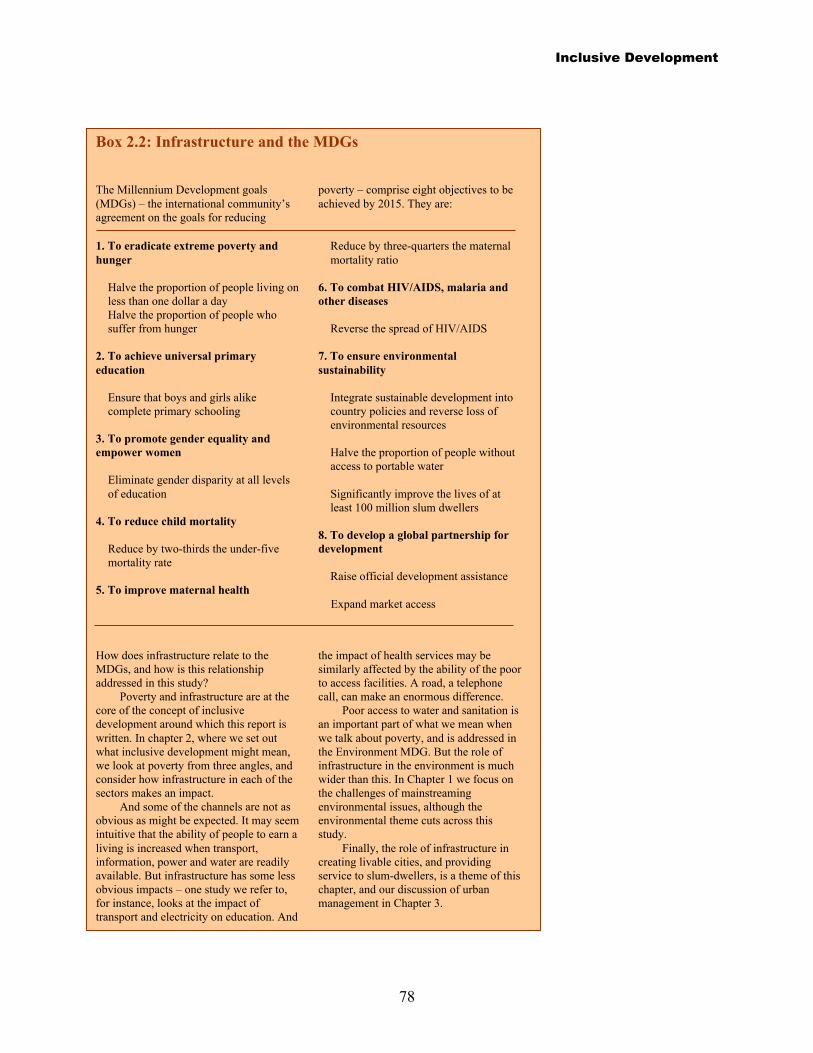
Inclusive Development
78
Box 2.2: Infrastructure and the MDGs
The Millennium Development goals(MDGs) – the international community’sagreement on the goals for reducing
poverty – comprise eight objectives to beachieved by 2015. They are:
1. To eradicate extreme poverty andhunger
Halve the proportion of people living onless than one dollar a dayHalve the proportion of people whosuffer from hunger
2. To achieve universal primaryeducation
Ensure that boys and girls alikecomplete primary schooling
3. To promote gender equality andempower women
Eliminate gender disparity at all levelsof education
4. To reduce child mortality
Reduce by two-thirds the under-fivemortality rate
5. To improve maternal health
Reduce by three-quarters the maternalmortality ratio
6. To combat HIV/AIDS, malaria andother diseases
Reverse the spread of HIV/AIDS
7. To ensure environmentalsustainability
Integrate sustainable development intocountry policies and reverse loss ofenvironmental resources
Halve the proportion of people withoutaccess to portable water
Significantly improve the lives of atleast 100 million slum dwellers
8. To develop a global partnership fordevelopment
Raise official development assistance
Expand market access
How does infrastructure relate to theMDGs, and how is this relationshipaddressed in this study?
Poverty and infrastructure are at thecore of the concept of inclusivedevelopment around which this report iswritten. In chapter 2, where we set outwhat inclusive development might mean,we look at poverty from three angles, andconsider how infrastructure in each of thesectors makes an impact.
And some of the channels are not asobvious as might be expected. It may seemintuitive that the ability of people to earn aliving is increased when transport,information, power and water are readilyavailable. But infrastructure has some lessobvious impacts – one study we refer to,for instance, looks at the impact oftransport and electricity on education. And
the impact of health services may besimilarly affected by the ability of the poorto access facilities. A road, a telephonecall, can make an enormous difference.
Poor access to water and sanitation isan important part of what we mean whenwe talk about poverty, and is addressed inthe Environment MDG. But the role ofinfrastructure in the environment is muchwider than this. In Chapter 1 we focus onthe challenges of mainstreamingenvironmental issues, although theenvironmental theme cuts across thisstudy.
Finally, the role of infrastructure increating livable cities, and providingservice to slum-dwellers, is a theme of thischapter, and our discussion of urbanmanagement in Chapter 3.

Inclusive Development
79
What of the empirical literature on the impacts of infrastructure on both growth and povertyreduction? A number of studies have confirmed the significant impact of infrastructure(particularly telecommunications and roads) on output, using cross-country data (e.g. Canning1999; Fernald 1999; Demetriades and Mamuneas 2000; and Roeller and Waverman 2001).Using a related approach, one analysis (Canning and Bennathan 2000) found that in developingcountries rates of return to infrastructure are higher than for overall capital investment, while indeveloped countries returns equalized. This implies that developing countries haveunderinvested in infrastructure (particularly in roads in middle-income countries, and electricityin poor countries).40
Other studies found that public expenditure on transport and communications significantly raiseseconomic growth (e.g. Easterly and Rebelo 1993; and Miller and Tsoukis 2001), although onefound a negative relationship between the share of infrastructure spending in total publicexpenditure and economic growth (Devarajan, Swaroop, and Zhou 1996).
The specific impact of infrastructure on welfare, especially of the poor, has been studied in anumber of ways, and departs from how one defines poverty. The narrowest poverty definitionsfocus on incomes and livelihoods, measured, for instance, by the “dollar a day” poverty line. Interms of this approach, the impact of infrastructure on poverty is measured through the degree towhich infrastructure increases the real incomes of the poor (for instance, by reducing the costsfaced by the poor for services they use); the degree to which infrastructure opens up employmentopportunities; and the degree to which infrastructure enhances the productive assets on which thepoor depend (for instance, when access roads increase the value of land owned by the poor).
But poverty can be defined more broadly, reflecting some of the key dimensions identified in theMillenium Development Goals (See Box 2.2). Here, research into the impact of infrastructure onpoverty has also looked at the extent to which infrastructure improves access to education andhealth services (transport, communications, and power infrastructure are likely to play roles here)as well as the impact of improved water and sanitation services on health.
And perhaps the widest definition focuses on enhancing social inclusion, human capabilities andfreedoms. Such approaches might focus on the impact that transport and communicationsinfrastructure can have in improving people’s ability to engage in collective activities, accesswider sources of information and opportunity, or free up time for both economic and non-economic purposes (particularly for women in cases where they bear principal responsibility forwater and energy provision for the household).
Some studies show that water and sanitation access explains a substantial portion of thedifference in infant and child mortality rates experienced by rich and poor, that bettertransportation increases school attendance, and that electricity access allows more study time(see Leipziger, Fay, Wodon, and Yepes, 2003). Another study (Calderon and Serven, 2004)found that infrastructure quantity and quality – particularly water and sanitation - have a strongpositive impact on income equality, as well as on economic growth. And a further study showedthat enhanced access to roads and sanitation has been an important determinant of reducingdisparities between the poorer and richer regions of Argentina and Brazil (Estache and Fay 40 See Briceno, Estache, and Shafik (2004) for a recent literature survey.

Inclusive Development
80
1995). Studies of rural roads have shown they raise the productivity and value of land for poorfarmers (e.g. Jacoby 2000).
Rural roads have been found to have a substantial positive impact on overall poverty reduction ina number of other studies, but there are some interesting nuances. One found that rural roadswere the form of public expenditure that reduced poverty most effectively in India (Fan 2003).For China, the same study found that they were the most effective form of public expenditure oninfrastructure, but that expenditure on education and agricultural research and development wasmore effective means of reducing poverty. A study of rural roads in the Philippines (Balisacanand Pernia 2002) found access to them is important for poverty reduction, and that the impact isincreased if the roads are coupled with education expenditure. By contrast, this study found thatthe very poorest households lacked the minimal income and complementary facilities necessaryto benefit from access to electricity.
Within that broad category “infrastructure”, the literature suggests that transport,telecommunications, and electricity are very important overall for growth and povertyresduction, and that rural roads, water and sanitation are critical for reducing the poverty of thevery poorest. Table 2.1 spells out some of these impacts in more detail. Although precisely howany set of infrastructure undertakings would impact on poverty depends very much on countrycontext (Box 2.3). Most importantly, the literature emphasizes that infrastructure is effectiveonly when combined with other interventions.
Box 2.3. The importance of infrastructure in particular poverty reduction programs may vary
While infrastructure has animportant part to play in addressingpoverty, the nature of its role mayvary depending on the nature ofpoverty in a particular setting.
Where there is mass poverty,affecting large proportions of thepopulation throughout a country,infrastructure investment may be animportant part of a broader strategyfor poverty reduction and economicgrowth, though precise prioritieswill vary depending on the context.
Where poverty is highlylocation-specific (for instance in
remote highland areas) and clearlylinked to geographical remotenessor poor access to key services (forinstance water supply and sanitationin urban slums), a targeted strategyof improving infrastructureprovision to areas of high povertyconcentration may be the singlemost important element of a povertyreduction strategy.
In some cases, however,countries may choose to placesignificantly less emphasis oninfrastructure investment inpursuing poverty reduction. This
may be the case, for instance, wherepoverty affects a relatively limitedproportion of the population anddepends on factors other than thosedirectly related to geographicalremoteness – for instance factorslike caste, histories ofdiscrimination against particularethnic groups, cultural or otherfactors that have limited educationattainment or employmentopportunities for certain groups
None of this implies, however, that everyone benefits from investments in infrastructure, noreven that they benefit equally. While broad-based impacts on poverty may often be positive, thelocal socioeconomic impacts from infrastructure development can sometimes be negative, unlessdeliberately mitigated. For example, hydropower might provide inexpensive electricity to large

Inclusive Development
81
numbers of consumers, yet displace people living and working in the vicinity of the hydropowerdam, or negatively affect their agricultural land or fishing grounds41.
Table 2.1: Potential positive impacts of infrastructure services on the poor
Sector Direct Impact on Poor Indirect Impacts on Poor
Mainly for lighting, TV, radio at low levels of income.Reduced energy costs for enterprises encouraging employment
creation across wide range of activities
Heating, cooking, appliances for self-employment at higher levelsof income
Improved health and other services (refrigeration, lighting etc)Electricity
Improves ICT access
Limited impact at low income levelsPiped gas
Heating, cooking at higher levels of income
Reduced energy costs for enterprises encouraging employmentcreation (limited range of activities)
Access to employment and marketsRoads
Access to services (health, education)
Reduced transport costs and improved market access forenterprises and service providers, lowering costs of serving
remote communities
Railways Limited Reduced costs and improved market access for enterprises
Urban Mass Transit Access to employment opportunities Employment creation from more efficient labor markets
Ports LimitedReduced transport costs for enterprises encouraging employment
creation (e.g. bulk commodities like agriculture)
Airports LimitedReduced transport costs for enterprises encouraging employment
creation (high value low bulk commodities, and services)
ICTBetter communication access, aiding migration, information on
opportunities, access to knowledge and potential engagement inwider communities
Employment creation through improved knowledge of markets,reduced management supervision costs, access to wider
knowledge base
Water supply Improved health outcomes; time savings; lower costs Limited
Sanitation Improved health outcomesImproved health outcomes (e.g. reduced pollution by non-poor
households and others)
Source: Jones (2004a).
41 At one end of the spectrum of wealth and power, this tension between general and local interests demandssafeguarding highly vulnerable groups against dispossession and exploitation. At the other end, it can involvehighly-advantaged and powerful groups engaging in the phenomenon of NIMBYism (Not-in-my-Backyard).Infrastructure development runs along a fault line of general versus local interests probably more often than anyother sector, and hence can become highly politicized.
Inclusive Development
82
At the same time there may be genuine choices to be made between infrastructure investmentsthat impact on aggregate growth and poverty reduction unequally: Between some investmentwith strong poverty related impacts, but limited implications for short-run aggregate growth – forinstance, rural water supply; and those with strong growth focus, but with limited povertyreduction impacts.
Institutions often face difficult trade-offs that have to be made between the interests of differentgroups of poor and non-poor, and to share the benefits of infrastructure equitably. Participationof affected groups in decision making can help assure that equity is achieved - a theme we pickup in Chapter 4 on accountability and risk management.
Making the links: infrastructure, trade and logistics42
But how do these inclusive development issues play out in East Asia as a region? As we saw inchapter 1, trade and regional integration have helped share the benefits of growth. The role ofinfrastructure in sustaining this process, in particular that of logistics, is the subject of thissection. In our next section we’ll trace out some of the links between infrastructure, growth andpoverty reduction through a country case-study – that of Vietnam. In both examples we showhow infrastructure can help make the process of economic growth poverty-reducing. This is atthe core of inclusive development.
Getting the goods to market has been the key to East Asia’s prosperity. Trade has been a crucialingredient in the rapid growth of much of the region, and is likely to remain so. Sharing in theregion’s growth, particularly for the poorest in the region, will depend heavily on countries’ability to carry out infrastructure investments, and improve the efficiency of delivery ofinfrastructure services, in support of regional trade opportunities.
For some countries of East Asia – in particular landlocked Lao PDR and Mongolia – effectiveregional infrastructure cooperation will be crucial43. Box 2.4 sets out how the participation ofLao PDR in the Greater Mekong Subregion (GMS) has enabled it to take advantage of itsgeographical location to pursue its development objectives through greater regional integration.
Superior logistics and low transport costs have been an important part of East Asia’s outwardorientated growth. This is particularly so in the region’s most impressive long-term performers –Singapore, Taiwan (China), Hong Kong (China), Japan, Korea; but also in a number ofdeveloping countries – Malaysia, Thailand, China and the Philippines. (Figure 2.2).
And continuous logistics improvements will be required to increase the prosperity that manyEast Asian countries have enjoyed from trade, and bring prosperity to more of East Asia’scitizens. As countries move progressively into more complex and higher-value manufacturing,
42 This discussion draws on Carruthers, Bajpai, and Hummels (2003), and Fujita and Hisa (2004).43 The case for regional infrastructure coordination, of course, is broader than just trade alone. Regionalinfrastructure coordination can play an important role in lowering infrastructure costs. It has been estimated, forinstance, that a full-trade energy scenario within the Greater Mekong Subregion would save the member states morethan ten billion dollars over a 20 year period when compared with the other extreme of individual national self-sufficiency (Crousillat, 1998). Interconnection would also significantly reduce future project related environmentalimpacts throughout the subregion.

Inclusive Development
83
and greater integration into global production chains, logistics requirements become moresophisticated. There is a premium on short transit times, certainty of delivery schedules, carefulhandling of goods, certification and standardization of product quality, and security from theft.The quality of freightforwarding, warehousing, storage, packaging, and trucking servicesbecomes more important, as does e-business use and the associated telecommunicationsinfrastructure. Logistics “software” issues are often as important as transport infrastructure“hardware”.
Box 2.4: Inclusive development on a regional scale: Opportunities for land locked Lao PDR
Lao PDR is a landlocked countrybordered by Thailand, Cambodia,Vietnam, China and Myanmar. Itis one of the poorest and leastdeveloped countries in the region,with per capita income estimated atUS$320 in 1998. Despite growthachieved in the last decade, thesocial indicators of Lao PDR areamong the worst in the region.There are few economicopportunities in Lao PDR with itssparse population to addressdevelopment challenges.
The membership of Lao PDRin the Greater Mekong Subregion(GMS) – which brings together fiveother neighboring partners,Cambodia, Myanmar, Thailand,Vietnam, and Yunnan Province,China – has enabled it to takeadvantage of its geographicallocation to pursue its developmentobjectives through greater regionalintegration. .
Over the 12 year course of itsexistence, the GMS has steadilyevolved from a disparate collectionof wary neighbors into a highlyeffective but informal collaborationthat can now point to numeroussuccessful cross borderinfrastructure investments.
GMS members have identifiednine priority sectors: transport,telecommunications, energy,tourism, human resourcesdevelopment, environment,agriculture, trade, and investment.
To focus on regionalintegration through infrastructure,
individual sub regional forumshave been established for electricpower, telecommunications, andtransport.
One of the concepts favored bythe GMS is that of the developmentof economic corridors, focusing onroad investments to improveaccess, institutional and policychanges for trade facilitation andtransit policies to reduce logisticcosts.
Traversing the sub region andreflecting primary transportroutings, five economic corridors(two North-South; one East-Westand two Southern) have beenidentified; several road investmentsare underway within these corridorswhile feasibility studies areaddressing prospective railwayimprovements. Plans for regionalpower interconnections andtelecommunications backbone havealso been drawn.
These investments promoteinclusive development for largeremote areas of landlockedcountries, such as Lao PDR andparts of China.
Among these undertakings isthe Northern Economic Corridorproject, which links Thailand andChina through a short road link vianorthern and remote parts of LaoPDR.
In addition to hardinfrastructure investments requiredto create a trade and transitcorridor, the project includedcomponents that will benefit local
communities along the road. Asocial action plan comprisingcommunity roads, small water andsanitation schemes, education andHIV/AIDs awareness programs,and local capacity buildingprograms were integral parts of theproject design. These componentswere planned in a participatoryprocess involving large numbers ofethnic minority groups.
The project was fundedthrough resources from twoprimary beneficiaries, Thailand andChina, with catalytic support frommultilaterals.
The multilateral role was three-fold: First, to help mobilizeresources; second, to assist inproject design to ensure not onlygreater regional connectivity, butthat isolated regions like Lao PDRwould be included; and third, topromote pricing policies that wouldmaintain newly created assetswithout undue fiscal burden onparticipating countries.
A number of similar projectsthat seek to coordinate regionalinfrastructure are underway in theregion. The development challengeis to ensure that they’re able toreplicate, and scale up some of thefeatures that are proving soimportant to Lao PDR. Achallenge, in short, to designinfrastructure that truly promotesinclusive development on aregional scale.
Source: ADB (2002).

Inclusive Development
84
Figure 2.2: In the most open economies of the region, logistics costs are typically much lower
Trade openness and accessibility, East Asia
Philippines
Philippines Mindanao
Mongolia
Indonesia Sulawesi
Laos
Hong KongTaiwan
Singapore
KoreaJapan
Thailand NEMalaysia
ChinaThailand
China Inland
Vietnam Inland
-1.00
PNG
-2.00
-1.50
-1.00
-0.50
0.00
0.50
1.00
1.50
2.00
2.50
-15.00 -10.00 -5.00 0.00 5.00 10.00 15.00
Accessibility
Trade Openness
Cambodia
Note: The measures of trade openness are based on those indicated in the Global Competitiveness Report, 2001-2002 (World Economic Forum, 2002). Values for countries not included in the Global Competitiveness Report havebeen added using World Bank assessment, in keeping with those of the World Economic Forum. All values havebeen normalized for the countries of East Asia. The measure of accessibility are based on the cost of transporting astandard TEU from the metropolitan region of the largest port to Hamburg. For inland regions, the land transportcost to the metropolitan region has been added.
Source: Carruthers , Bajpai, and Hummels (2003).
Improved logistics would reduce the wedge between prices paid by consumers and received byproducers. Imported goods would become cheaper to inland consumers, raising real disposableincome. A greater variety of goods would become competitive in those markets, raising livingstandards through increasing choice. Expanded input variety in manufacturing can increaseproductivity. For exports, ex-factory or ex-farm prices will increase, as will the associated landvalues and wages. Exports of a wider range of products to a wider range of markets wouldbecome possible.44 Larger and larger areas of inland East Asia would be connected tointernational markets (and coastal domestic markets also).
Improved logistics is also a form of risk-management, and therefore opens up new economicpossibilities. The product diversification just mentioned protects incomes against volatile pricesfor specific commodities. Similar arguments apply to market diversification. For agriculturalcommodities, efficient logistics allows surplus regions to sell to deficit regions, dampening price
44 Evenett and Venables (2001) show that 40 percent of trade growth in East Asia comes from offering new productsand finding new trade partners.

Inclusive Development
85
and income fluctuations. This is particularly important in countries such as Lao PDR, Cambodiaand Vietnam where agriculture constitutes a large share of GDP and rural poverty is high. For abroader range of products, efficient logistics can help overcome seasonal obstacles to transport,and hence reduce price and income volatility.
Figure 2.3: Interdependence of auto manufacturing within ASEAN
Source: Nomura Research Institute, Ltd. (2004).
In a similar vein, uncertainty about delivery schedules induces high inventory levels as a form ofrisk management. Producers hold stocks of parts and components, and retailers hold stocks offinished products as an insurance against late delivery. Gausch and Kogan (2001) find thatinventory holdings in developing countries are two to five times the US level, and estimate thatmerely halving them would lower production costs by an average of 20 percent, which wouldobviously bring more producers to market. Uncertainty in delivery schedules is caused byunderdeveloped or poorly-maintained road and rail networks, congestion in urban areas whereeconomic activity and population growth have outpaced infrastructure, onerous borderprocedures, poor security, and unreliable information flows (particularly where information andcommunications infrastructure does not allow sophisticated electronic data interchange).
And countries which have good logistics are more able to participate in global production chains.In East Asia this is particularly important for the electronics and automotive industries (seeFigure 2.3 on Japanese auto manufacturing), in which the production process can include a
JapanHigh grade parts
(Engine related etc.)
ThailandDiesel Engine
starter, Alternator, steering column.
Body panel
Based on interviewsWith major Japanese manufacturers
The PhilippinesTransmission
Combination switchJoints
IndonesiaGasoline engineDoor lock, frame
clutch
MalaysiaPower steering
Condenser (for air cons)Engine computers

Inclusive Development
86
number of countries. Participation in global production chains can help enhance the value ofexports – an especially important development for those countries in which manufactures are lowskilled, and low wage.
East Asia has been largely competitive until recently – although performance varies acrosscountries (see Figure 2.4 for some variation in logistics costs between and within countries, andBox 2.5 for an outline of how logistics capacity varies across countries in the region).
Box 2.5. East Asia’s logistics challenge – country differences
East Asian countries differ in theirlogistics capabilities, and theirlogistics challenges. One logisticsstudy attempts to classify them intofour groups.
In Group 1 are those which areoutward orientated, and are highlyaccessible, i.e. have lowtransportation costs and superiorlogistics (These include Singapore,Hong Kong (China), South Korea,and Taiwan (China)).
And then we have thedeveloping countries whichapproach the Group 1 model tovarying degrees.
Group 2 includes thosecountries which have open trade butface serious logistics challenges toinclusive development (Thailand,Philippines, Malaysia, China,Indonesia). In these countries,
policies and institutions toencourage multi-modal transport areat an early stage of development.Transport inefficiencies persist insome parts of these countries,particularly in rural areas.Penetration of 3PL logisticsproviders is generally low.
Group 3 includes the less openbut accessible countries (Cambodiaand Vietnam), while Group 4includes the landlocked and islandcountries (e.g. Mongolia, Lao PDR,Pacific island states).
The countries in Group 3 andGroup 4 are either former socialisteconomies or are small island statesdependent on a small number ofcommodities and tourism. Historyor geography largely explain thesmall role of international trade intheir economies, although for some
the situation is changing rapidly(e.g. Vietnam).
In Group 3 and 4, countrieslack adequate transportinfrastructure. Roads are frequentlyclosed or impose high vehicleoperating costs, customs clearanceis slow, border delays can be long,ports are often expensive andinefficient, and intermodal transportis generally poorly integrated.Government transport policies lackconsistency and predictability, andpolicy coordination betweendifferent agencies and tiers ofgovernment is generally poor.Logistics services are rudimentary.
Source: Carruthers, Bajpai andHummels (2003).
But right now the efficiency of East Asia’s logistics is falling behind. Costs of transportationrepresent a high proportion of the final price of goods. High logistics costs in East Asia stemfrom inadequate transport infrastructure, underdeveloped logistics and transport services, andbureaucratic (and sometimes corrupt) import and export procedures. Much of the problem isbehind the border, and indeed beyond the port. The cost of internal access to ports is greater thanthe costs associated with the ports themselves or with maritime transport.45 This has limited thespread of the benefits of trade-induced growth to areas beyond those adjacent to ports, and hascreated congestion near the ports46. Reducing logistics costs is therefore crucial to inclusivedevelopment.
45 To cite just one example, 63 percent of the cost of transporting goods from Chonqing to the West coast of the USis incurred before arriving at the Chinese port of export.46 For example, more than 90 percent of the FDI in export-oriented industries in China has gone to the four maincoastal provinces. Similarly, the multiplier effect of the textile export boom in Cambodia has been limited mainly toareas easily accessible to the Sihanoukville port. On congestion, a study of Bangkok estimated that moving port-
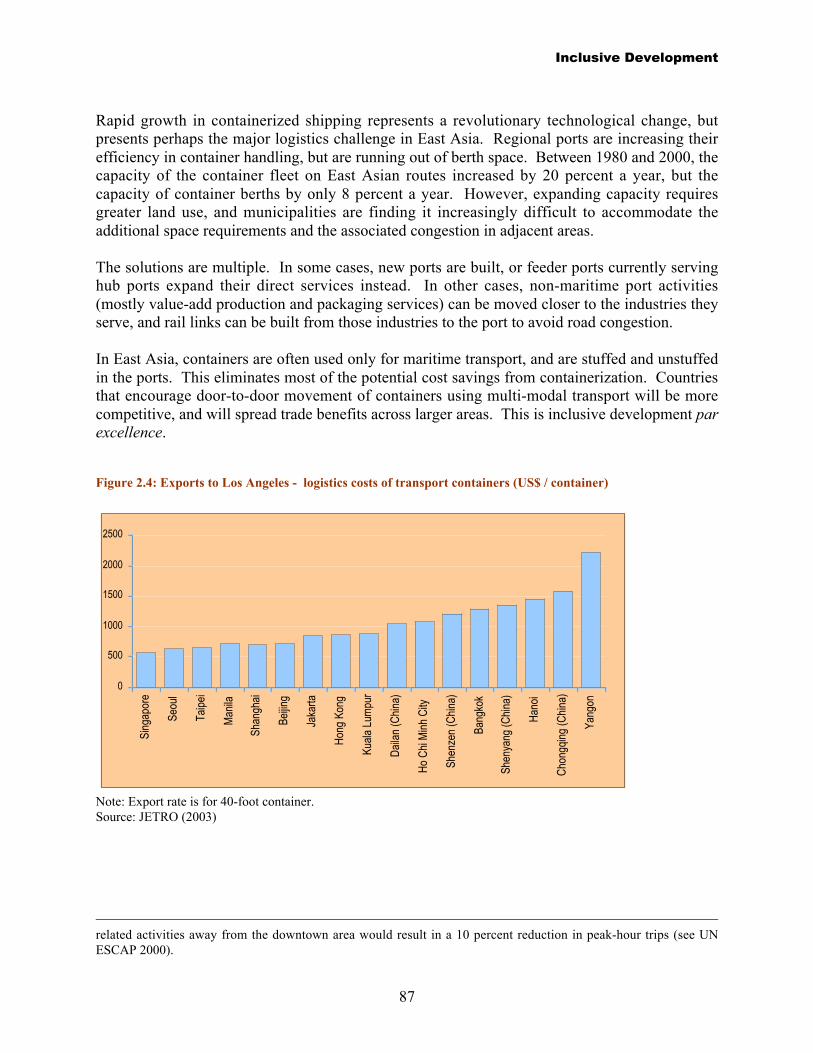
Inclusive Development
87
Rapid growth in containerized shipping represents a revolutionary technological change, butpresents perhaps the major logistics challenge in East Asia. Regional ports are increasing theirefficiency in container handling, but are running out of berth space. Between 1980 and 2000, thecapacity of the container fleet on East Asian routes increased by 20 percent a year, but thecapacity of container berths by only 8 percent a year. However, expanding capacity requiresgreater land use, and municipalities are finding it increasingly difficult to accommodate theadditional space requirements and the associated congestion in adjacent areas.
The solutions are multiple. In some cases, new ports are built, or feeder ports currently servinghub ports expand their direct services instead. In other cases, non-maritime port activities(mostly value-add production and packaging services) can be moved closer to the industries theyserve, and rail links can be built from those industries to the port to avoid road congestion.
In East Asia, containers are often used only for maritime transport, and are stuffed and unstuffedin the ports. This eliminates most of the potential cost savings from containerization. Countriesthat encourage door-to-door movement of containers using multi-modal transport will be morecompetitive, and will spread trade benefits across larger areas. This is inclusive development parexcellence.
Figure 2.4: Exports to Los Angeles - logistics costs of transport containers (US$ / container)
0
500
1000
1500
2000
2500
Sing
apor
e
Seou
l
Taip
ei
Man
ila
Shan
ghai
Beijin
g
Jaka
rta
Hon
g Ko
ng
Kual
a Lu
mpu
r
Dai
lan
(Chi
na)
Ho
Chi
Min
h C
ity
Shen
zen
(Chi
na)
Bang
kok
Shen
yang
(Chi
na)
Han
oi
Cho
ngqi
ng (C
hina
)
Yang
on
Note: Export rate is for 40-foot container.Source: JETRO (2003)
related activities away from the downtown area would result in a 10 percent reduction in peak-hour trips (see UNESCAP 2000).

Inclusive Development
88
Box 2.6: Integration of ports and land transport networks in South Korea
South Korea has one of East Asia’smost developed land accessnetworks to its ports, making use ofroad and rail links to the ports ofPusan and Kwangyang, the latteralongside a major steel mill andindustrial complex and now in itssecond stage of development with apotential capacity of 2.4 millionTEU (twenty foot equivalent unit,size of a standard container). BothPusan and Kwangyang, have beenplanned in conjunction with majorroad and rail links to Korea’s majormanufacturing regions. Pusan inparticular has adopted a strategy ofencouraging people to live and workin the city, and has for this reasondeveloped a new port area away
from the downtown area to allowthe original port area to beredeveloped for residential andcommercial use. This has reducedtraffic congestion and air pollution,and improved logistics efficiencyhas made the new port easier toreach from the city’s industrial areasand the rest of Korea.
The Yangsan inland containerterminal has been constructed torelieve port generated trafficcongestion and environmentalproblems resulting from the massivetransport movements the portgenerates. Another inland containerterminal (ICD) us underdevelopment in the center of the
Korean peninsula, to serve thegrowing industrial zones on thewest coast and in the central regionof the country. Together with theports, the ICDs are part of alogistics system based on anadvanced EDI and informationservice. In this way, Korea will beable to maintain the competitivenessof its industrial base, while movingits manufacturing away from theexisting congested urban areas andspreading its benefits more widelythroughout the country.
Source: Carruthers, Bajpai andHummels (2003).
Five elements are essential to achieving this inclusion through multi-modal transport. First,adapting the rail and road vehicle fleet to carry loaded containers. Second, industry contractingout logistics to third-party suppliers of logistics services (3PL).47 Third, regulatory reform toallow single trade documentation for all transport modes and clearance of containers away fromport locations. Fourth, effective communications systems for freight forwarders. And last butnot least, effective coordination between agencies responsible for different modes of transport.
Issues of coordination – the subject of our next chapter – feature prominently in the broadermeasures required to address East Asia’s logistics challenge, in particular coordination acrossnational boundaries, and in urban management.
Cross border facilitation would yield major efficiency gains in East Asia (although less so forcountries that are already both highly accessible and highly open – see Box 2.6). This requirescoordination between countries and could be achieved through harmonization and simplificationof customs procedures, information sharing, customs modernization, establishment of transparenttransit rules, and post-entry compliance audit.48 For all countries, streamlining and coordinatingsecurity procedures in the post 9/11 environment would enhance trade facilitation.
Urban governments need to implement land use policies for the location of logisticsinfrastructure and ports which internalize externalities.49 This is not easy. Firms cluster togetherbecause it is to their mutual advantage. The positive productivity externalities they experience
47 In many industrialized East Asian countries barely 10 percent of trade-related transport services are contracted to3PL providers, in contrast to almost a third of such services in OECD industrial countries.48 There are various ongoing regional and subregional initiatives in this area including those under the auspices ofASEAN, APEC, the Mekong River Commission, the Greater Mekong Subregion, and UNESCAP.49 This could include protecting rights-of-way for future road or rail development, land banking, and ensuring land isavailable for services that require easy access to ports, airports etc.

Inclusive Development
89
include the stimulus to innovation, information exchange, access to inputs, and specialized skills– the agglomeration economies. These become more important as production moves up thevalue-added chain, and are a significant part of the high-growth story in East Asia. But of coursefirms do not take into account the effect their own move has on overall congestion and pollution– the negative externalities – that can ultimately choke growth and the urban environment. Theurban management policy challenge is to trade-off the positive and negative externalities forurban areas, and to do so in coordination with national or regional strategies for inclusiveness.
Focus on Vietnam: infrastructure and inclusive development
In our last section we looked at the connecting role that infrastructure plays across the region,enlarging markets and facilitating trade. In this section we drill down a little further into the roleof infrastructure in fostering inclusive development in one of the region’s best performers:Vietnam.
Over the last decade, Vietnam has grown at an annual average rate of 7.6 percent, placing itamong the fastest-growing countries in the world. Economic development has also beenremarkably pro-poor, lifting around 20 million people out of poverty in less than a decade50. Infact Vietnam is one of the best performers in East Asia in terms of elasticity of poverty to growth(4th out of an analysis of 23 middle and low income countries), with one extra point of GDPgrowth leading to a decline in the poverty rate by slightly more than one percent.51
Infrastructure and investment have been an important part of this story, complementing thecountry’s many targeted poverty reduction initiatives. Approximately one third of GDP has beendirected into capital investment. 44 percent of government investment has been in infrastructure,both national and local. Infrastructure investment has risen as a percentage of GDP, to 10 percentin 2003, as GDP itself continued to rise significantly (Figure 2.5)
Since 1993, continuous economic growth, fueled in part by infrastructure investment, has beenthe main engine for poverty reduction, complemented by targeted poverty reduction programs.The mutually-reinforcing relationships set out in Figure 2.1 are deeply embedded in theprocesses of inclusive development that characterize Vietnam recent development experience.Let’s look at some of the evidence.
Infrastructure has impacted on poverty in Vietnam both through large-scale investments, andthrough smaller scale rural infrastructure. On the large scale, trunk infrastructure has played acritical role in creating linkages between growth centers and their surrounding rural areas. It hasconnected remote areas with power grids, trunk roads with feeder roads, and in the process,
50 The strong linkages between economic growth and poverty reduction in Vietnam can be attributed in part to thepeculiar nature of poverty in the country. The poor are not a static group: a high share of the population is clusteredaround the poverty line and the poverty status of households fluctuates over time (with the exception of ethnicminorities). While this suggests a high vulnerability to shocks, it also implies that small increases in per capitaincome may be sufficient to lift the poor out of poverty.51 The elasticity of poverty reduction to economic growth indicates the proportionate reduction in poverty (inpercentage points) for every percentage point of GDP growth. See Larsen, Pham, Lan and Rama (2004).
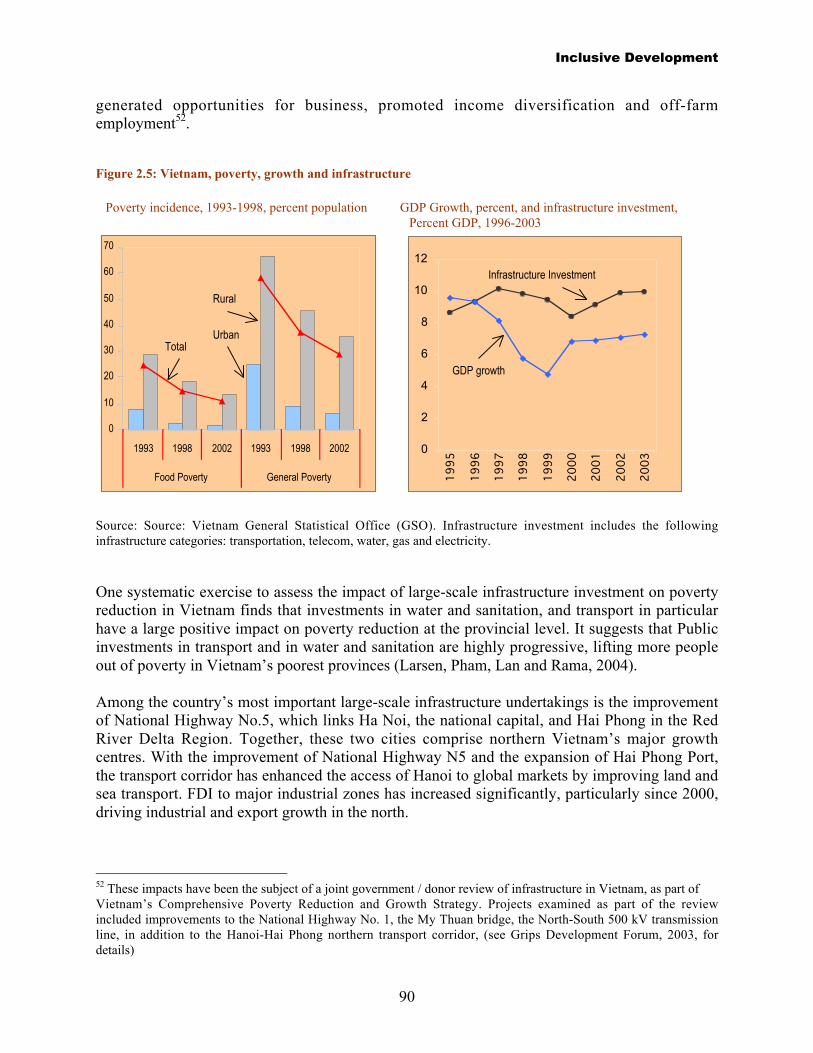
Inclusive Development
90
generated opportunities for business, promoted income diversification and off-farmemployment52.
Figure 2.5: Vietnam, poverty, growth and infrastructure
Poverty incidence, 1993-1998, percent population GDP Growth, percent, and infrastructure investment, Percent GDP, 1996-2003
0
10
20
30
40
50
60
70
1993 1998 2002 1993 1998 2002
Food Poverty General Poverty
0
2
4
6
8
10
12
1995
1996
1997
1998
1999
2000
2001
2002
2003
Source: Source: Vietnam General Statistical Office (GSO). Infrastructure investment includes the followinginfrastructure categories: transportation, telecom, water, gas and electricity.
One systematic exercise to assess the impact of large-scale infrastructure investment on povertyreduction in Vietnam finds that investments in water and sanitation, and transport in particularhave a large positive impact on poverty reduction at the provincial level. It suggests that Publicinvestments in transport and in water and sanitation are highly progressive, lifting more peopleout of poverty in Vietnam’s poorest provinces (Larsen, Pham, Lan and Rama, 2004).
Among the country’s most important large-scale infrastructure undertakings is the improvementof National Highway No.5, which links Ha Noi, the national capital, and Hai Phong in the RedRiver Delta Region. Together, these two cities comprise northern Vietnam’s major growthcentres. With the improvement of National Highway N5 and the expansion of Hai Phong Port,the transport corridor has enhanced the access of Hanoi to global markets by improving land andsea transport. FDI to major industrial zones has increased significantly, particularly since 2000,driving industrial and export growth in the north.
52 These impacts have been the subject of a joint government / donor review of infrastructure in Vietnam, as part ofVietnam’s Comprehensive Poverty Reduction and Growth Strategy. Projects examined as part of the reviewincluded improvements to the National Highway No. 1, the My Thuan bridge, the North-South 500 kV transmissionline, in addition to the Hanoi-Hai Phong northern transport corridor, (see Grips Development Forum, 2003, fordetails)
Urban
Rural
Total
GDP growth
Infrastructure Investment

Inclusive Development
91
Table 2.2: Comparison of the growth rate and poverty reductionrate of each province in the Red River Delta region
LocationAnnual growth rate /
capita (%) 1995-2000
Reduction Rate of poorhousehold (%) 1998-2000
Ha Noi A 6.9 61
Hai Phong A 4.2 40
Hai Duong A 6.0 42
Hung Yen A 7.6 23
Bac Ninh B 8.8 44
Vinh Phuc B 11.9 46
Quang Ninh B 5.1 32
Ha Tay 5.4 42
Ha Nam 5.7 18
Nam Dinh 4.1 27
Tay Binh 4.2 4
Ninh Binh 5.0 44
Thai Nguyen 2.3 34
Phu Tho 5.3 39
Bac Thuan 4.7 37
Regional Average 6.1 35
National Average 5.7 27
Top five provinces in each category in bold
A: Provinces located along National Highway No 5
B: Provinces connected with Ha Noi, Hai Phong Port by other National Highways
Source: General Statistics Office of Vietnam
An interview survey with over 70 FDI firm managers suggests that nearly 90 percent of newinvestments would not have been realized without the improvement of NH5 and the Hai Phongport. The survey indicates that managers were attracted by cost reduction in transportingimported inputs; time-saving in delivering raw-materials and final products; and improvedcoordination of production and sales schedule.
Most of the provinces in the Hanoi-Hai Phong corridor achieved faster growth in per capitaincome and reduction in the number of poor households, compared to the average for the RedRiver Delta or the whole country (Table 2.2).
And growth has now spread to neighboring areas, particularly Hung Yen and Hai Duongprovinces (located between the two economic hubs), with similar transformation of the ruraleconomy. Rural households have diversified their agricultural production (from rice to fisheryand poultry) and have been increasingly engaged in new business opportunities. Moreconvenient transportation has also spurred demand for tourism in Ha Long Bay, in effect,extending the corridor into a Hanoi-Hai Phong-Ha Long development triangle.

Inclusive Development
92
But Vietnam has also concentrated on the small scale. Enormous investments have been made inrural roads – reducing the number of communes lacking all-season road access to district centresby over 50 percent – with significant effects on poverty.
One study into these rural road investments suggests that the establishment of a new road in avillage raised the per capita income of households by 30 percent between 1993 and 1998, aftercontrolling for other factors, such as household size and education (Deolalikar, 2001). Moreover,the spatial location of roads increased the household probability of moving out of poverty by 68percent over the same period of time. It showed that rural roads expanded school enrolment ofchildren at all levels, and improved the utilization of public health services. And the spatial andeconomic benefits of rural roads were significantly larger in poorer provinces than in the richerones.
Another study into the marginal returns in agricultural growth and poverty reduction to variouskinds of government spending suggests that the payoff of investment in roads is second only tothat of investment in agricultural research. Returns to road investment proved higher than thosein even education53 (Fan, Huong and Long, 2004).
But as important as these achievements have been, Vietnam is in no position to rest on its laurels.Access to basic infrastructure services has not been equal, and the degree of this inequality isincreasing. The percentage of the population in the lowest income quintile with access to cleanwater is 22.7 percent, less than half than the national average. It is also striking that only 2percent of the population in the lowest income quintile has access to hygienic latrines, comparedwith 70 percent for the top quintile of the population
Increasing inequality, particularly between urban and rural areas, raises new infrastructurechallenge54. On the one hand, infrastructure can be used to continue to reach into those isolatedregions who’s inhabitants are cut off from services, and from economic participation. But rapidurbanization is also placing significant strain on urban infrastructure, and the capacity of urbanmanagers to keep up with demand. New pockets of poverty are emerging in peri-urbansettlements.
And as the complexities of the infrastructure challenges multiply, and the scale of the risksincreases, Vietnam will be increasingly unable to sustain the inefficiencies that characterize bothits coordination, and delivery of infrastructure and infrastructure services.
53 The authors found that for every billion dong spent on agricultural research, 339 poor people would be liftedabove the poverty line. Road investment yields the second largest return, with every billion dong spent on roadslifting 132 poor people above the poverty. For every billion dong spent on education, 76 poor people were liftedabove the poverty line.54 Between 1998 and 2002, the rate of poverty reduction in rural areas was only 5.4 percentage points against theurban figure of 7.1 percentage points. Poverty among ethnic minorities has decreased by only 2 percent (WorldBank, 2003b). More than 50 percent of the poor live in three regions (Northern Uplands, North Central Coast andCentral Highlands), which account for only 34 percent of the total population.

Inclusive Development
93
Box 2.7: Inclusive development: transport access for the disabled
Including individuals withdisabilities is an important factor toconsider during the planning anddesign phase of infrastructureprojects. Equally important isrectifying existing infrastructuredeficiencies, which may hamper thequality of life of disabled personsby denying them the ability toeffectively utilize their surroundingenvironment.
One important means ofinclusiveness is to address publictransport design to enhance accessand safety. Four major disabilitygroups should be considered: orthopedic: ambulant and non-
ambulant (wheelchair users) sensory: visually impaired and
hearing impaired cognitive: mental,
developmental, and learningdisabilities
multiple: combination of any orall of the aboveIndividuals with orthopedic
disabilities are generally those withlocomotive disabilities that affectmobility. Those who are wheelchairusers face a particular challenge indeveloping countries—the spatialneed of wheelchair users oftenexceeds that of persons with othertypes of disabilities, and the needfor provision of ramps, curb-cutsand elevators is critical. Individualswith sensory impairments needvisual signs and tactile clues such asroute finders, and adequate signagemust be provided to increasedirectional clarity for the hearing
impaired. Disabled individuals whoare cognitively challenged and thosewith multiple disabilities need acombination of the aboveprovisions.
Some mass transit systemsdeveloped recently in the East Asiaregion do include full accessibilityfeatures – sometimes as the result ofcampaigns by disability advocacygroups during the project planningstage. The new Bangkokunderground system, Malaysia'sPURTA mass transit system, andBeijing's new subway and light railsystem under development includebarrier-free components in theirdesign. Manila is betting on the busrapid transport (BRT) system todramatically improve theaccessibility of persons withdisabilities. The BRT utilizes buseslinked by threes or fours withdedicated corridors running along a22 mile highway that surrounds thecity. These buses have low floorsfor ease of entry and exit, tend tomove at a uniform speed and stoponly at designated stations. BRTsystems are currently operating invarious Asian cities, includingJakarta and Shijiazhuang, with asystem under construction inBeijing, and in the planning stage inShanghai, Bangkok, Chengdu, andChongqing.
Whenever new infrastructure isconstructed or new vehicles arebought, access features that servemost passengers who are considereddisabled can be incorporated at
relatively low-cost. For example,elevator installation at 18 stations ofthe Bangkok underground systemcost approximately 46 million Baht(about USD $1.1 million) —out of atotal of 105 billion Baht (aboutUSD $2.6 billion) in constructioncosts for the whole system—orroughly .0004 percent of total costs.However, retrofitting an existingsystem is much more expensive.The cost of installing just oneelevator in an existing New Yorkcity subway station isapproximately USD $2 million.
Consequently, city plannersneed to incorporate accessprovisions in their planning at theearliest stages. Development bankscan be helpful by adopting policiesfor universal and inclusive designfor built environments and publictransport in infrastructure projectsthey finance. These institutions canalso provide specialist expertise.
Finally, one criticalconsideration concerning disabilityissues and infrastructure in EastAsia is the emergence of an ageingsociety. Disabilities—or degrees ofimpairment—increase with age,even in seemingly healthyindividuals. Infrastructure plannershave time now to plan for thisdemographic shift, and toadequately provide enablingenvironments for all members ofsociety.
Source: Takamine (2004).

Coordination
94
Coordination
95
3. Coordination
Infrastructure is hard to do
It’s easy to build infrastructure. But building the infrastructure that delivers the right services tothe right people at the right cost is extremely hard. So the quality of the institutions managingthat delivery process is crucial.
The peculiarities of infrastructure discussed in Chapter 2 have major implications forinstitutional needs. The lumpiness and capital intensity, the long gestation periods, the use- andspace-specificity, all imply that quite specialized agencies and local autonomy are needed forinfrastructure. The risks, the complexity, the longevity of the assets, infrastructure’s intenselypolitical nature, all speak for centralized coordination and planning. In short, managinginfrastructure is about balancing politics and economics, centralization and decentralization,leadership and participation, the big picture and the specifics.
And the East Asian experience demonstrates that the big picture is at least as important as thequality of a specific infrastructure ministry or service provider. What matters most is strategicvision. We need to look at how infrastructure fits with broader development strategy andpolitical context, how that strategy gets formulated, and how it connects through service deliveryto outcomes. This is what we call “coordination”.
In this chapter we look at the issue of coordination in three ways. We start with an example – orsix examples – of the region’s most advanced economies (as well as the most advanceddeveloping country case – Malaysia). These we call “the high flying geese”. The experiences ofthese economies give us useful illustrations of one broadly successful East Asian model ofcoordination. These examples are also proving useful to a number of the developing countries inthe region, as they struggle with coordination in their own contexts.
What is “Coordination”?
“Coordination” is about the State’s ability to generate strategic vision, and its ability turn that vision into reality.It requires making trade-offs between multiple objectives, particularly when multiple actors are involved. Andits important who makes those trade-offs, and how leadership and participation get balanced in that process.
As we said in Chapter 2, “Infrastructure is intertwined with the fabric of our economic and social lives”.Intertwining requires a lot of coordination.

Coordination
96
From here, we turn our attention to coordination issues proving most important for thedeveloping countries in the region. We look at three issues. We first consider the challenge thatgovernments face in getting the level of infrastructure spending right. Often, in times ofeconomic expansion, poor coordination between the agencies responsible for investment andfinancing leads to too much infrastructure, or inefficient infrastructure. Other times, especiallyunder conditions of fiscal retrenchment, poor coordination may result in too little space forinfrastructure (especially when we consider infrastructure’s long-term impact on solvency). Wethen look at the considerable challenge of coordinating infrastructure through decentralizedgovernment structures. And third, we look at the challenge of coordination infrastructure inurban areas.
In the final part of this chapter we reflect on the quality of coordination in four of the region’sdeveloping countries – Indonesia, the Philipines, China and Thailand. These we refer to as the“geese trying to catch up”.
A “Flying Geese” theory of infrastructure?
The “Flying Geese” explanation of economic development in East Asia essentially says that theflying geese in the lead (i.e. the most successful economies) transmit their success to the geeseflying just behind them, and so on down the line. The transmission can be simply throughsuccessful geese demanding the exports of other geese, or by making investments in them. Or itcan be through the strategies and institutions of the successful geese inspiring the other geese.
One could argue that the infrastructure strategies of East Asia’s developing countries today wereinspired to some degree by the approach of five of the region’s developed economies in aprevious era: by Hong Kong (China), Japan, Korea, Singapore, and Taiwan (China), as well asby one of the more successful developing countries, Malaysia. Of course, in each case, thatapproach has been heavily adapted to country circumstance, and there have been many otherinfluences, but an inspiration can still be discerned.
In these six economies, political leaders and senior policymakers played a major role in creatingthe long-term development vision, and the sectoral strategies which flowed from that vision.55
All these economies had a strong emphasis on export-led growth, high savings and investmentlevels (sometimes with an FDI focus), and generally balanced social development. Infrastructurestrategies were formulated to help achieve those objectives. These strategies usually enjoyedbroad consensus amongst the policymaking elites. Policy enjoyed a high degree ofpredictability.
In each economy, growth was rapid over a period of decades. Sustained periods of high growthhelped create the policy consensus behind infrastructure investment to support that growth.Infrastructure investment in these economies was high by international norms, with significantincreases in infrastructure stocks across sectors (Figure 3.1). The discipline of needing to remaincompetitive in export markets and to continue to attract investment, helped inject efficiency intoproject choice and service delivery. 55 Mody (1997) gives a detailed account of infrastructure strategies in these six countries.

Coordination
97
Figure 3.1: Infrastructure development in the ‘high-flying geese’, Km, kWh (million), telephone lines(thousands)
Hong Kong (China) Korea Taiwan (China)
Hong Kong
0
2,000
4,000
6,000
8,000
10,000
12,000
1960
1970
1980
1990
Korea
0
20,000
40,000
60,000
80,000
100,000
1960
1970
1980
1990
2000
Taiwan
0
10,000
20,000
30,000
40,000
1960
1970
1980
1990
2000
Singapore Japan Malaysia
Singapore
0
1,000
2,000
3,000
4,000
5,000
1960
1970
1980
1990
2000
Japan
0
50,000
100,000
150,000
200,000
250,000
1960
1970
1980
1990
2000
0.9
0.9
1.0
1.0
1.1
1.1
1.2
1.2
mil
Right Axis
Malaysia
0
2,000
4,000
6,000
8,000
10,000
12,000
1960
1970
1980
1990
2000
0
10
20
3040
50
60
70
'000
Right Axis
Total Road Length (km) Electricity generating capacity (million kWh) Main Telephone Lines (000s)
Source: Canning (1998).
Sometimes infrastructure investment anticipated demand, but in general it reacted to constraintsas they began to emerge. Taiwan (China)’s large-scale infrastructure program, known as the TenMajor Projects, for instance, was a response to the transportation bottlenecks that had becomeapparent by the late 1960s (Reinfeld, 1997).
However, the reactions were often rapid and quite strategic. Overall sector strategies tended toadapt as production structures changed, rather than responses being only in a piecemeal manner.A number of very bold and large single projects were undertaken with success – such as theKobe-Nagoya Highway and the Tokyo-Osaka Super Express Railway in Japan, and the Seoul-Pusan Highway in Korea – although inevitably some white elephant projects occurred also.
Each country had strong planning agencies to drive infrastructure development, at the central orsectoral level – Korea’s Economic Planning Bureau, Singapore’s Economic Development Board,Malaysia’s central planning agency and policymaking body in the Prime Minister’s Office, orJapan’s strong sector ministries and advisory boards. These agencies generally enjoyed

Coordination
98
considerable political clout. They were simultaneously vehicles for political leaders to implementtheir long-term development vision, major contributors to the creation of that vision, and atechnocratic restraint on more short-termist political pressures. The agencies were the focalpoints for interagency coordination in policymaking and implementation.
But much of this did not take place in public view. Individual accountability tended to beinternal to the elite, as long as the broader public were enjoying the fruits of economic growth.In many cases political life was dominated by one party, which often remained in power formany years.
Infrastructure service delivery in these economies was predominantly the domain of publiccorporations, often with monopoly status. Oversight by a strong planning agency or morespecialized ministries, and a clear incentives framework, appears to have induced better publicenterprise performance than seen in most other economies. Cost recovery policies weregenerally encouraged, and reliance on operational subsidies was limited. For example,Singapore’s 1961-1964 Development Plan proceeded on the basis that several infrastructuresectors would be self funding – electricity, water, gas, and certain telecommunications and portsprojects (Yuan, 1997).
However, service providers were substantial beneficiaries of financing from state-directeddomestic financial institutions, which captured high levels of domestic savings. Japan’s FiscalInvestment and Loan Program – which mobilized postal savings and social security pensionsinto infrastructure (and other) investments, and was described as a second national budget – isone of the most prominent of such mechanisms56. But similar mechanisms were used extensivelyacross the six economies.
Since these financial mechanisms were often used to lend in line with government sectoralpolicies, and savings were to some extent locked in by capital controls, infrastructure serviceproviders were effectively in receipt of quasi-fiscal subsidies. The key criteria for success werethe degree of risk assessment carried out by financial institutions before lending, and thesubsequent enforcement of credit discipline.
The model adopted in these six economies delivered impressive infrastructure results,particularly in the relatively early stages of laying the groundwork for sustained economicgrowth – beginning in the 1950s. However, by the late 1980s and the 1990s, the strains andcontradictions in the model were evident. It did not deal well with financial crisis or economicslowdown. Slow growth and tighter financing conditions revealed risks and inefficiencies thatwere not so apparent hitherto. Lending from the financial sector directed by policymakers couldbecome a major public liability, as could a lack of transparency in corporate governance.Strategic approaches could sometimes descend into supply-driven investment, cronyism, andcorruption.
The highly top-down approach had restricted the space for civil society participation ordecentralized tiers of government. Old models of accountability were increasingly open toquestion. In the pursuit of growth, environmental considerations had not generally been given 56 see Kuninori (1997), for a more detailed analysis of how Japan approached infrastructure finance
Coordination
99
strong emphasis (with some exceptions, particularly in Japan), but the public was nowdemanding a higher quality of life, including in particular a more livable urban environment.
Infrastructure sector restructuring to allow efficiency gains through greater competition orautonomous regulation of monopolies had not been high on the agenda for most economies.Similarly, private participation had usually been confined to greenfield projects, and thereforetended to play a relatively marginal role in improving sector performance (again with somenotable exceptions).
As the state’s role became more complex, and its objectives more diverse, its ability to squeezeefficiency gains from the existing system of public sector monopolies began to falter. At thesame time, continued efficiency gains became all the more important as economies opened up toever fiercer global competition. In general, greater complexity meant that the state at the centerneeded to focus more exclusively on the big picture, and delegate more of the details: tocompanies, regulators, local governments, civil society and the market.
The geese flying behind these economies – particularly China, Indonesia, the Philippines, andThailand – face the task of adapting the inspiration from the way the six dealt with the past, tohow they themselves deal with the future. A future that looks more complex than the past in anumber of important ways. Lets consider some of these complexities, before turning to thedeveloping country case studies.
Coordinating infrastructure levels
Infrastructure is important, for reasons we have set out in Chapter 1 and Chapter 2. Butinfrastructure is only one of many government priorities. And governments face budgetconstraints. Achieving the right emphasis on infrastructure, for the prevailing conditions, can bedifficult. Sometimes, in times of high growth and free fiscal policy, governments may end upspending too much, or inefficiently. Other times, in times of fiscal retrenchment, they may spendtoo little. The first is arguably the case in Vietnam and China. Elements of the latter appear inThailand, the Philippines and Indonesia.
One of the reasons that governments spend too much, or with unacceptably high levels ofinefficiency, is the separation of investment from financing, and difficulties in coordinatingpolicy across these functions. The separation of investment from financing is a common featureof the planning frameworks of many of the countries of the region, with the former assigned to aministry of planning and investment, and the latter to a finance ministry. Frequently, theinstitutional separation of planning and financing is given force through a dual budgeting system,with responsibility for investment vested with the planning ministry, and recurrent expenditureassigned to the finance ministry.

Coordination
100
Box 3.1: Poorly coordinated planning and finance in the Vietnamese roads sector
Investment approval and financingoften proceed on separate tracks inVietnam. Frequently investmentsare approved without provision forearmarked financing. One of theoutcomes of the inefficientresourcing of approved (andsometimes unapproved)investments, is that ministries areincreasingly borrowing fromcommercial banks, on theexpectation that central governmentwill meet the liabilities they incur.
In the case of the transportsector, this practice has led toconsiderable government arrearsand destabilization of theconstruction industry. Over 1999 to2002, about 35 percent ofcommitments for transport had beenapproved by the Prime Minister’s
office, but had not been allocatedfunding. In order to meet theshortfall, the Ministry of Transport(MOT) contracted (state-owned)construction companies toundertake work, on the promise ofreimbursement at a later time. Thishas imposed a significant debtburden on contractors, who were inturn forced to take loans from statebanks to finance their operations.State banks have subsequently beenforced to grant loan rollovers, as inmany cases the interest paymentsdue are in excess of enterprisecapitalization. Arrears in the MOTto contractors, amount to VND1200 billion, and those of theTransport Construction Corporationamount to a further VND 1000billion.
Debts incurred in this waythreaten the overall stability of thefiscal framework. Taking intoaccount borrowing for unfundedinvestment across all sectors, debtstotaling approximately VND 11trillion have been incurred. Thegovernment has agreed to absorbVND 5 trillion of debt incurred forprojects that were implemented infulfillment of a master-plan. Theexistence of a further VND 6 trillionof debt for projects implementedoutside of any master plan bearstestament to a non-transparentenvironment.
Source: Vietnam DevelopmentReport (2004); World Bank(2004g).
The separation of planning and financing functions is not without advantages. Most importantly,it creates space for the setting of long-term development objectives. It can allow policy makers tothink beyond the constraints of a short-term fiscal horizon, to consider the “big picture”57.
But as the scope and complexity of East Asia’s development challenges have increased, theability of governments to plan and efficiently resource infrastructure investments has not keptpace. In many countries this has resulted in unsustainable, delayed, or incomplete projects, andultimately financial and fiscal stress.
The separation between planning and financing in a dual budgeting system is also a frequentcause of inadequate expenditure on operations and maintenance. This arises both as a result ofthe bias towards new investment that the system engenders, and the division of responsibilitiesthat are better kept together.
In our discussion of China further on in this chapter, we look at how this separation, in particularin respect of the financing of local government infrastructure investment, is grounds for concern.Box 3.1 takes up this story in the context of Vietnam’s roads sector, in which coordinationweaknesses within the public finance management system has exposed the government, and thebanking and construction sectors, to liabilities that the government now has to absorb.
57 Which is not to say, of course, that at times the short term fiscal horizon is not more important than the long term.Governments with poor fiscal track records, or recovering from financial crisis, would often do well to concentrateon short term liquidity.
Coordination
101
In times of fiscal retrenchment – as is the case in a number of countries in the region followingthe financial crisis of the late 1990s – a different coordination challenge may arise with respect tothe level of infrastructure expenditure.58. This entails coordination between agencies responsiblefor fiscal policy and those responsible for infrastructure planning, as well as between thoseresponsible for planning and finance, with sector ministries intent on driving throughinfrastructure reform. Lets look at this more closely.
If – in times of economic downturn – a government is preoccupied with increasing liquidity itwill tend to cut any large spending items it can. This may be justified if the government faces alooming debt crisis, or if it can only meet its expenditure commitments through an inflationaryprinting of money. In such cases, establishing debt sustainability and cutting fiscal deficits arelikely to be paramount.
However, what if a liquidity-constrained government cuts out a large infrastructure project withan expected economic rate of return of 30 percent (which is not particularly high for aninfrastructure project in a developing country)? It is often infrastructure spending that gets cut infiscal crisis, because it comes in large lumps of cost today and its benefits are usually severalyears away.
Cutting that project is equivalent to the government borrowing at an interest rate of 30 percent toovercome its liquidity problem. If that happens to be the cheapest way to stave off a crisis, itmay well be justified. But if there are cheaper alternatives - such as taking a loan at less than 30percent - then cutting the project is obviously not a good solution. Indeed, in this case cuttingout the project reduces the Government’s net worth, and hence worsens its solvency. In otherwords, across-the-board cuts in infrastructure spending during fiscal crisis are often shortsighted(If you need a little more convincing, have a look at Box 3.2, which addresses some of thearguments made against this point… and the counter-arguments).
And so agencies responsible for fiscal adjustment need to coordinate long-term fiscal policy withthose responsible for infrastructure development spending. In most countries, this means therelationship between the finance and planning functions needs to be designed strategically, notmerely be allowed to follow the fiscal cycle. That is, infrastructure budgets should get protectionwhere merited during fiscal crisis (but not be allowed to race ahead during fiscal booms!). Thismay sometimes mean that other priority sectors also get protected, and that short-run fiscaldeficits are therefore larger than otherwise. In short, less liquidity may be needed to helpsolvency.
The analysis also suggests that liquidity crises can force infrastructure reform. That means thatcentral agencies (of finance and/or planning) should coordinate with sector agencies to try andensure that reform is promoted as much as possible – but not pushed too fast to be sustainable.And to ensure that liquidity pressure doesn’t just shift state liabilities off-budget. Ultimately theobjective is to ensure that fiscal space – in the broadest sense – provides adequate infrastructurefor inclusive development.
58 For further analyses of these points see IMF (2004), Brixi and Irwin (2004), and Easterly and Serven (2003).
Coordination
102
Box 3.2: Infrastructure and fiscal space – arguments and counter-arguments
There are a number of argumentsthat are made against the view thatcutting infrastructure at times ofcrisis may be shortsighted. Letslook at a few of them.
One argument is that the highreturns to the infrastructureinvestment may not accrue directlyto the government.
But they are likely to accrueindirectly if infrastructure raiseseconomic activity and that activityis taxed. And anyway, the taxsystem can be designed to capturethe benefits more directly if that isperceived to be desirable. Anotherargument is that infrastructureprojects are often white elephants,i.e. they don’t have high rates ofreturn. But it would be as naïve tobelieve that all infrastructurespending is for white elephants as itwould be to believe that none of itis. The “white elephant” argumentdoesn’t argue for indiscriminatecutting of infrastructure projectsduring fiscal adjustment (although itobviously does argue for tacklingthe process of public investmentselection).
A further argument is that theprivate sector can do it, so whyshould the public sector spendscarce resources?
On one level this argument ismisguided: the majority ofinfrastructure investment in anycountry is public, and it would takea very long time to make all of itprivate (if that is even desirable).On another level, a more subtleversion of this point can be made:ministries of finance can pressuresector agencies towards allowingprivate participation where it isindeed possible, by cutting theirbudgets. More generally,infrastructure reform can oftenimprove solvency through moreefficient service provision andreduced fiscal risk, but may onlyhappen if the sector’s budgetconstraint is hard.
In many cases, this “liquiditypressure” approach may be the bestway to overcome excessive cautionor vested interests on the part ofsector agencies, and to hold themaccountable for performance. Butin other cases caution may be well-grounded in terms of the readiness
of the sector for privateparticipation or other reforms. Andthere is a risk that transparent fiscalsupport will be replaced by non-transparent contingent liabilities,unless the ministry of finance hasvery effective control.
And last, but not least, there isthe argument that capital marketsworry about sovereign liquidity, andtherefore governments need toworry about it too.
It may be hard to makeconvincing solvency arguments tocapital markets unless the countryhas an established track record ofliquidity. In other words, capitalmarkets may be short-termist withshort-termist governments. In suchcases, high-return infrastructureprojects may well need to bepostponed – but this argues foraccelerating infrastructure reformsthat yield alternative finance in theinterim from efficiency gains andgreater cost recovery. Of course, italso argues strongly that theeconomic costs of fiscal crisis – andof short-termism - can be extremelyhigh.
Coordinating infrastructure through sub-national government
Much of the challenge the governments face in coordinating infrastructure reflects balances thatneed to be struck between different functions – between planning and financing, infrastructureand overall fiscal sustainability. When these functions are spread across separate agencies, thechallenge becomes all the more difficult. And this is also the case with the challenge ofcoordinating infrastructure through decentralized government structures.
Decentralization in East Asia is a comparatively recent phenomenon. In the space of less thantwenty years, however, previously centralized state structures have been significantly reformed.Subnational government expenditure as a percentage of total expenditure now ranges from 10percent in Thailand, to close on 70 percent in China (World Bank, 2005b).
If well managed, and accompanied by effective accountability mechanisms, infrastructuredecentralization may bring significant benefits – by tailoring service provision to the needs of

Coordination
103
local constituencies. But it also brings a number of new coordination challenges. Some of theseplay out horizontally across government structures – managing services whose benefits spanjurisdictions (the so called “spillover” problem), excessive fragmentation, and destructivecompetition. Others play out vertically, between different levels of government (seeUTCE/ALMEC 2004b).
Managing spillovers in service provision
Increased decentralization increases the chances that projects will bring benefits, and incur costs,outside of any one single jurisdiction. Decision making often needs to span municipal boundariesto ensure effective coordination. But frequently, local governments are too small, or lack thecapacity and incentives to perform such coordinating roles.
Voluntary cooperation between local governments is rare. One prominent exception in voluntaryinter-jurisdictional cooperation in investment planning and project implementation is theconstruction of a circumferential toll road across Cabanatuan City and the adjacentmunicipalities of San Leonardo and Sta. Rosa, in the Philippines.
But more commonly, local governments lack necessary short-run political incentives tocooperate. The CALA (Cavite- Laguna Provinces) peri-urban region in the Philippines, forinstance, has paid a particularly high price in terms of loss of competitiveness, arising from theinability of local jurisdictions to jointly fund a common transportation network and solid wastesystem (Webster 2004).
In Dak Lak, Vietnam, the absence of an intermediate tier of government responsible forintegrated water resource management has led to over-use and degradation of natural resources.Local agencies have repeatedly failed to resolve the conflict between upstream and downstreamwater users in the Ea Tul catchment of the Upper Srepok basin, and Water Users Associations(WUA) have emerged to take on various coordinating functions (Dupar and Badenoch 2002).
Governments have therefore had to come up with new coordination tools, and a number have. Inboth Thailand and Vietnam, the provision of fiscal incentives – in the form of matching grantsavailable to projects involving governments that are part of the same extended urban region –have been successful (Webster 2004).
Other mechanisms include the formation of Special Districts or Regions, which comprise severallocal governments, with the specific mandate of coordinating infrastructure service delivery inextended urban regions. This approach has been successful implemented in Canada and theUnited States. The Greater Vancouver Regional District (GVRD) in Canada, for instance,comprises 13 local governments which now cooperate in the planning and provisioning of avariety of services – regional transportation, solid waste, wastewater and regional parks.
Excessive fragmentation
Size matters in other ways too. Newly formed municipalities may often be too small to achievethe minimum efficient scale necessary to ensure technical efficiency in service provision –

Coordination
104
evidence suggests that this may already be the case in Thailand, Indonesia and the Philippines(see Table 3.1 below for a comparison of average population size by local government acrossEast Asian countries). This is particularly the case where infrastructure services are local innature but require large capital investments – water supply, electricity distribution, or publictransport.
Where excessive fragmentation is a concern, efficiency gains may be achieved by clusteringmunicipalities to form regional areas of service provision (albeit at the expenses of localaccountability). Often, this requires the creation of an institutional interface at a higher level ofgovernment, charged with coordinating the setting of investment priorities, and regulatingservice provision.
“Destructive Competition”
Decentralization may increase efficiency by promoting competition among local governments.But in the absence of coordination at higher tiers of government, excessive competition amongmunicipalities may induce inefficient allocation of resources and over-investment, withmunicipalities building or upgrading ports, airports or other infrastructure facilities in their ownareas for reasons of prestige rather than relying on those in adjacent regions.
In Thailand’s aviation planning, for instance, the resource allocation process significantlyreflected local successes in lobbying for air facilities – resulting in gross oversupply. Most of thelocal airports managed by the Department of Air Transportation (DAT) have essential facilities,but no commercial service; many are essentially in a state of abandonment. Nevertheless, thepressure to build more regional airports persists (Webster and Theeratham. 2004).
Table 3.1: Hierarchy and average population size by local government
Malaysia Lao PDR Cambodia China Vietnam Thailand Indonesia Philippines
Area (000 km2) 330 237 181 9,597 330 514 1,919 300
Population (million) 23.8 5.4 12.0 1,270 78.5 61.2 211.7 78.3
State/ Province 16 17 24 33 61 75 32 79
Municipality/Districts 145 142 171 2,457 715
1,133(795)* 416 1,610Local
GovernmentsCommunes/Subdistricts - 10,868 1,510 45,462 10,594
6,738(7,255,
71,864)* - 41,944
Municipality/Districts 184 38 70 517 110 54 (77) 509 49
AveragePopulationSize (000) Communes/
Subdistricts - 0.5 7.9 27.9 7.4 0.9 56.3 1.9
* Local administrative body with 795 districts, 7,255 subdistricts, 71,864 villages
Source: CLAIR (2004,), MRI (2003), CLAIR (2000).
So too, in China, amid economic transition and decentralization, municipalities tend to competewith each other to attract outside investment for businesses and for infrastructure projects. Thetools of competition primarily comprise preferential policies – tax holidays, free land, and

Coordination
105
discounted land concessions. Given the absence of other coordination mechanisms, such ad hocpolicies tend, in some cases, to unduly distort resource allocation between municipalities as wellas between various stakeholders within a given municipality (Liu 2004).
The lesson again is that effective coordination requires effective institutions. Institution building,and strengthening is essential, if the allocation of responsibilities across multi-tiered forms ofgovernment is to be successful.
Vertical coordination
Decentralization of infrastructure service delivery to subnational governments changes, but doesnot remove the role of central governments. New functional systems need to be developed thatallow central ministries to monitor, manage and coordinate, in line with policy and regulatoryframeworks. The inadequacy of such systems is a frequent cause of sub-optimal service delivery,and confused authority.
Functional decentralization has frequently not been matched by fiscal decentralization, with localbodies deciding policy and regulatory matters (such as pricing, service standards, expansionstrategies), while central governments often continue to provide the bulk of investment financingand to some degree financing for operations and maintenance.
In the absence of adequate coordination of fiscal and regulatory policies, local bodies have littleincentive to make sustained progress toward reducing unit costs, recovering those costs, and –where private participation is involved – respecting contractual obligations. This is a story thathas played out across most infrastructure sectors in East Asia, as elsewhere, but especially forurban transport, water supply and sanitation, and to some degree rural electrification (seeUTCE/ALMEC 2004b).
This situation has been exacerbated by shifts in the composition of central transfers. Revenuesharing grants and other forms of unconditional transfers frequently constitute an increasingshare of central transfers to local authorities, for which there is little if any reporting on uses andcosts, much less accountability in the broader sense of tracking efficiency of expenditure andservice delivery performance.
Coordinating urban infrastructure
As we saw in Chapter 1, much of East Asia’s infrastructure challenge arises from growthgenerated by cities. Delivering urban infrastructure and infrastructure services poses arguably themost complex of infrastructure coordination problems: In part, because of the sheer pace ofurbanization in East Asia, which frequently outstrips the response capacity of urban managers. Inpart, as we shall see, because urban management requires coordination that brings together somany different functions.
Infrastructure has a major role to play in shaping urban space – determining where people work,live, and create wealth, how they travel and how they sell their goods. Formulating and
Coordination
106
implementing practical plans with long term vision is vital. When successful, it can set the stagefor long term growth and prosperity. The development of Thailand’s Eastern Seaboard (ESB)area – a peri-urban export orientated zone developed around state-sponsored infrastructureinvestment – is among the regions most successful examples (see Box 3.8 later on, in ourdiscussion of Thailand for more details).
But Thailand, as we saw in Chapter 1, is among the least urbanized, and slowest urbanizingcountries in the region. In other countries, the pace of population growth has made it difficult forthe authorities to keep up. And timing is of the essence. When urbanization precedes theinvestment necessary to make for livable cities, the costs of improving infrastructure levels tendto escalate, in part due to the costs of land acquisition and resettlement; and infrastructuresolutions tend to sub-optimal.
Ideally, land use management – the incentives and restrictions that determine which activities arelocated in which areas, and of which infrastructure is a large part – is key to managing urbangrowth. But city managers in many East Asian countries are often hampered in this role in anumber of ways: insufficient legal frameworks, deficient application of existing restrictions, andpolitical intervention.
Coordination between the multiple agencies that are typically involved in urban management andinfrastructure delivery is also vital, but often difficult to achieve. Returning to Thailand, beforeBangkok began reforming its urban management, there were at least 27 government departments,and state-owned enterprises with responsibilities related to urban transport. Four separateagencies, under three different ministries, had powers to develop mass transit schemes. In oneextreme case, two megaprojects were even planned to occupy the same physical space. Whencompeting parties held rival agencies, the incentives for better alignment were even weaker(Carruthers, Bajpai, and Hummels 2003). A similar picture unfolds in the case of Vietnam,despite the country’s significantly different political and social context (see Box 3.3).
Coordination across urban boundaries is also a particular challenge. When urbanization spreadsbeyond administrative boundaries, so do urban activities, and urban needs. In water supply,waste management, transport and other network infrastructure services wider administrativecooperation mechanisms are essential. Frequently, however, they are lacking. In the Philipines,for example, the Metropolitan Manila Development Authority (MMDA) is responsible forcoordinating urban development for the entire Metro Manila area, which consists of 17 cities andmunicipalities. However, its legal authority is not firmly established, and its power is limited toactual coordination and enforcement of land-use management and infrastructure development.And with urban growth expanding beyond its boundaries, to the adjoining provinces of Caviteand Laguna, its inability to provide infrastructure services is of serious concern (Webster 2001).
The geese catching up: four snap-shots
We are not going to attempt a comprehensive account of strategic vision, planning and policycoordination for the infrastructure of these four countries. That by itself would be worth a book.Instead, we will tell a brief story about each, illuminating some of the key challenges they faceand how they tackle them.

Coordination
107
Box 3.3: Urban management in Vietnam
In Vietnam, urban management(quan ly do thi) is nominally theresponsibility of the centralMinistry of Construction. However,the Ministry’s power areconstrained by a web ofindependent decisions by othergovernment entities responsible forland management, transportation,finance and budget allocation,social-economic planning,management of SOEs, andenvironment, at national, province,city and district level.
These actors frequentlycompete against each other for statefinancial resources and FDI, withlittle benefit accruing to individualdepartments from cooperation. Thisis further complicated by thetraditional vesting of quan lyauthority with local officials in
communes and wards, which oftenresults in the treatment of laws,decrees and plans more as guidance,with ultimate responsibility restingwith local officials.
Effective urban planningrequires the achievement ofobjectives in spatial, as well assectoral terms. In Vietnam, prioritysetting in the socioeconomic plansand implementation of physicalplanning are allocated across twoseparate planning exercises, andhave proved difficult to integrateand coordinate. The plans of theMinistry of Construction, whichdeal with development in spatialterms, tend to overlook theeconomic and social dimension ofurban master planning, while theplans of the MPI tend to overlookthe spatial and environmental
dimensions of investment programs.This frequently results isdisconnected and impracticalphysical plans, weakly related tosocio-economic plans, lacking inimplementation mechanismsbeyond directing the location ofstate investment.
Because the spatial plans areunable to produce usable guidelinesfor challenging urban growth, muchgrowth takes place in unauthorizedand unplanned areas, is moreunlikely to be inconsistent withoverall strategic objectives, andproceed without adequate provisionof required urban services.
Source: Vietnam (2005d).
The Philippines59
The Philippines’ story is that long-term vision and development plans are often undermined byshort-term pressures within a fluid and fragmented political system. The fragmentation of thesystem diminishes accountability and nurtures corruption. Leadership is sporadic, clientilism isstrong, and the state has been captured to some degree by special interests. Politicians frequentlyoverride technocrats, and policies can be very unpredictable. There have been boom periods ofrelatively high growth and fiscal stability, but they have alternated with periods of bust. This hassubstantially impacted Filipino institutions, and their effectiveness in delivering infrastructureservices.
The Filipino planning agency is the National Economic and Development Authority (NEDA). Inperiods of bust, NEDA’s long-term development role has tended to be secondary to the goal offiscal retrenchment (under the leadership of the Department of Budget and Management). Inperiods of boom, which tend to precede elections, NEDA’s role tends to be undermined bymultiple pressures to give financial support to highly-politicized infrastructure projects. Thissupport is often spread very thinly to keep a lot of different constituencies happy (see Box 3.4 fora description of the Philippines’ “pork-barrel” funds). Long-term development plans and actualbudgets often bear little relation to each other. NEDA’s policymaking role – for example on usercharges – is frequently pre-empted by executive authority, or eroded by other politicalinfluences. And so NEDA’s ability to set priorities, and to coordinate policies or projects, ishighly constrained. Crisis management tends to be the dominant mode of operation.
59 This section is based on Medalla (2004), except where otherwise indicated.

Coordination
108
Box 3.4. “Pork-barrel” interventions in infrastructure in thePhilippines
One of the consequences of thepersonalization of the Filipinopolitical process is the allocation ofbudgets to congressmen and senatorsfrom which to fund politically orpersonally motivated “pork-barrelprojects”, through so-called“augmentation funds”
This result in fragmentation ofscarce fiscal resources, weakensaccountability and significantlyundermines existing planning andcoordination mechanisms.
Table 3.2 below gives an indicationof the prevalence of thisphenomenon.
Between 1997 and 2001, 22.5percent of the Department of PublicWorks and Highway’s (DPWH)budget – or close to P 50 billion –was allocated to “pork barrel”project, under various rubrics. Andthis outweighed the funds allocatedto local government units forinfrastructure projects by over 25percent.
Table 3.2: Augmentation Funds for local infrastructure, DPWHbudget, 1997-2001 (P billion)
Total
1997 1998 1999 2000 2001 1997–2001
Total budget 49.05 38.25 42.65 42.33 48.96 221.24
of which:
Augmentation Funds 14.17 3.04 6.83 8.1 17.56 49.7
Various infrastructure projects 13.68 2.84 0.32 8.1 17.29 42.23
Project DevelopmentAssistance Fund 0 0 0 0 0.27 0.27
Countrywide DevelopmentFund 0.5 0.2 0 0 0 0.7
Rural/Urban DevelopmentInfrastructure Fund 0 0 5.36 0 0 5.36
Food Security Program Fund 0 0 1.14 0 0 1.14
Source: Manasan (2004).
Decentralization in the Philippines is a source of further coordination weakness, and contributessignificantly to the government’s inability to implement strategic plans. The ports in Manila, forinstance, and the roads leading to them, have become highly congested. The Governmentdecided to upgrade Batangas port about 100 kilometers from Manila, which could serve factoriesin the peri-urban areas south of Manila. This required a large investment that would benefitmany different local government areas. It could therefore not attract the requisite funds, becauseeach local government preferred to try and freeride on what the others would do. Eventually theport was donor-funded, but access to it is restricted by a narrow highway the expansion of whichstill cannot attract domestic funding.

Coordination
109
The lack of policy coordination has led to generally inadequate fiscal space for infrastructure,and low levels of private infrastructure investment. In 2002, total infrastructure investment wasonly 2.8 percent of GDP.
To cite just one example of weak coordination over fiscal issues: the electricity sector. There isan official policy of minimal and well-targeted subsidies in the sector. In reality, electricity tariffincreases are highly politicized – a round was postponed just before the May 2004 presidentialelection. At the same time, overcontracting by the National Power Corporation (NPC) forindependent power producers has resulted in the Government taking over service of much ofNPC’s debt. This has crowded out high priority expenditures in other sectors (particularly giventhe Philippines weak tax collection), and in the power sector itself there are insufficient funds forinvestment in transmission and distribution capacity. Regulatory autonomy has beenundermined. Lack of predictability has deterred further private investment.
In some cases, the State’s inability to deliver infrastructure services has led to an ambitiousrestructuring of the sector – almost in desperation. For example, in telecommunications, beforethe PLDT monopoly was broken up a typical consumer would have to wait almost a decade for atelephone to be installed, and teledensity was far below that in neighboring countries.60 Since theintroduction of competition in 1995, teledensity has increased dramatically – threefold for fixedlines and by more than 70 percent a year for mobiles (for mobiles, technology is often ahead ofthe state’s ability to control it). Technology and competition have succeeded in the Philippineswhere the state was failing – and the state facilitated that process.
But even here progress has been undermined by state coordination weaknesses. The telcos weregiven lucrative monopoly franchises for certain services (e.g. international calls) so that theycould cross-subsidize expansion of fixed-line service into unprofitable (“missionary”) areas. Inessence, competition was restricted because the alternative of the Government subsidizingmissionary expansion directly had no credibility. Nobody believed the subsidies would flowwithout disruption, whatever the stated policy. However, to a considerable extent, thefranchisees’ monopoly power, and hence the ability to cross-subsidize, has been undermined byillegal competition from bypass operators using new technologies (e.g. Voice over InternetProtocol) which the state is unable to regulate effectively.
The mainstreaming of poverty reduction and environmental concerns is another area wherepolicy and reality diverge in the Philippines. The formulation of the national development planis highly consultative, and addresses social and environmental issues as high priorities not justadd-ons. However, there is a huge gap between what the plan says on the one hand, and theprojects that get resources and the policies that are actually implemented on the other hand.Civil society’s main mechanism for impacting decisions with environmental and socialimplications is not really through participation at the planning stage, but through campaigns andprotest at the permitting or implementation stage. The frequency of such protest can be seen as astrength of Filipino democratic culture, reacting to the weakness of the state - it does notrepresent coordinated environmental and social mainstreaming. Similarly, community and NGO
60 A joke has been attributed to Prime Minister Lee Kuan Yew of Singapore that in the Philippines 90 percent of thepeople were waiting for a telephone line, while the other 10 percent were waiting for a dial tone.
Coordination
110
initiative for small-scale infrastructure services is vibrant in the Philippines, filling some of thegaps in state provision (Conan 2004).
The effects of weak coordination present themselves across the Philippines’ infrastructuresectors (see World Bank 2005c). Investment climate assessments show that weaknesses ininfrastructure provision – in particular in electricity supply and transport – have significantadverse affects on investment and competitiveness61. The power sector is imposing a financialcrisis on the Government, and cannot fund needed expansion62. Transportation service quality isgenerally poor, and costs are high; the road network is badly interconnected and many roads arein bad condition63. Access to improved water appears to be in decline 64 particularly in smallerurban centers across the country, and water quality and service reliability are major issues.Sanitation standards are a major health concern, with only about 4 percent of the populationhaving acceptable on-site treatment and disposal. Telecommunications has seen progress, butperformance and access remain behind regional norms.
However, there are positive signs. Filipino political culture undermines long-term strategicvision and the role of the state, but it does allow private and civil society initiative to emerge.Where technology, competition, community initiative, or small-scale infrastructure can getaround the state and make a contribution, therein lies most hope in the Filipino context. In large-scale, network, monopolistic subsectors, where a significant state role is inevitable, progress canbe expected to be slower.
Indonesia
Indonesia’s story is that the pendulum has swung from autocratic technocracy to somethingconsiderably more participatory and decentralized, but that pendulum has not yet come to rest.Leadership and the center are struggling to find their proper role, and to define a strategic vision.The old symbiosis between politicians and technocrats has gone, but the new relationship has notyet fully taken shape. The autocratic period was one of generally high growth andmacroeconomic stability which ended dramatically in economic crisis; the post-crisis period hasseen a painful economic recovery that is now being consolidated. This has been a formativeperiod for Indonesia’s economic management institutions.
Under the Suharto regime, policy planning and coordination was centralized in two institutions:BAPPENAS which prepared national five-year development plans, and coordinated policy
61 33.4 percent of firms interviewed in the World Bank’s 2003 Investment Survey for the country stated thatelectricity posed a major or severe threat to business operation and growth; 18.3 percent reported the same oftransport ( http://rru.worldbank.org/InvestmentClimate/).62 In 2003, for instance, the financing gap (including loan repayment and capital expenditures, before externalfinancing) of the state-owned generation and transmission company, NPC, increased sharply to P86 billion pesos($1.6 billion) from P19 billion ($500 million) in 1999, contributing in turn to the country’s ballooning public sectordeficits.63 Less than 50 percent of the monitored national road network, for instance, is considered to be in good conditionas measured by the International Roughness Index.64 Recent government data shows nationwide averages of access to safe drinking water deteriorated from 81.4percent in 1999 to 80 percent in 2002, while the percentages for the poorest segment of the population decreasedfrom 71.5 percent to 70.2 percent for the same time period.

Coordination
111
initiatives along with the Coordinating Ministry for the Economy and Industry (EKUIN). Ineffect, these two institutions operated more or less as one, and had substantial ability to planstrategically, and oversee the translation of that vision into reality (see Asanuma 2005; andWorld Bank 2004a). The regime gave considerable technocratic authority to its planningagencies, although in the regime’s declining years corruption tended to undermine technocracyincreasingly.
Under the post-Suharto, reformasi regimes, the power of the planning agencies has beensignificantly diffused. The power of the executive as a whole has become circumscribed by theemerging role of the legislature and the judiciary as democratization evolves. Power has beenredistributed downwards to local government, under Indonesia’s “big-bang” approach todecentralization since 1999. Fiscal crisis, from which Indonesia is only now beginning torecover, shifted influence to the Ministry of Finance and the central bank and placed a strongemphasis on short-term macroeconomic stability. BAPPENAS is now essentially a planningadvisor, without even authority over the state’s development budget. EKUIN’s successor, theCoordinating Ministry of Economic Affairs, focuses mainly on short-term implementationissues. Strategic vision is in search of a home.
Figure 3.2: Indonesia has gone through a period of fiscal contraction with importantimplications for infrastructure
Total public expenditure (US$ billion) Infrastructure expenditure (US$ billion)
0
2
4
6
8
10
12
14
16
18
1996 2001
public private
0.0
2.0
4.0
6.0
8.0
10.0
12.0
14.0
16.0
1994 2002infrastructure other
Source: World Bank (2004a).
Fiscal space for infrastructure has been limited in the last few years, with infrastructureexpenditure as a portion of total expenditure declining significantly. In parallel, private investorinterest, which remains significant, has not led to much actual investment (see Figure 3.2) – inlarge part because the State abrogated contracts during and after the 1997 crisis, and confidencehas not yet been re-established. Box 3.5 takes up this story in the energy sector.

Coordination
112
Box 3.5: Indonesia’s renegotiated power purchase agreements
Faced by escalating electricitydemand, and limited publicresources, many East Asiancountries had little choice but toinvite private, frequently foreigninvestment in power plants, mostlyas Independent Power Producers(IPPs).
In Indonesia, 26 primarily US$-denominated power purchaseagreements were signed betweenIPP sponsors and PLN forapproximately US$18 billion,increasing capacity by roughly 11000 MW.
Funds for these IPPs weresecured from international sources,but predominantly from unsolicitedproposals. Although theGovernment did not issue explicitguarantees, “letters of support” weregiven to the IPPs though which theMinistry of Finance or the Ministryof Mines and Energy requires PLNto perform its obligations.
As a result of the crisis anddevaluation of the rupiah, the
Government – faced with large andescalating debts – postponed someIPP projects, and directed PLN toreimburse only part of itsobligations to the operating IPPs.
Investor response was mixed,depending on whether each took ashort or long-term view of itsinvolvement. In some cases theGovernment was sued and in one, aninternational arbitration panel ruledin favor of the IPPs.
The government has nowsettled or renegotiated all disputeswith the IPPs (excluding the casementioned above).
At the same time, however, itremains exposed to importantcontingent liabilities associated withits obligations to the IPPs. Andfuture market development will besignificantly affected by the settariffs and dispatchability levelsassociated with the power purchaseagreements.
Source (World Bank, 2004a)
Severe infrastructure backlogs have emerged. Real spending on road maintenance, for instance,dropped in 2000 to less than 40 percent of its 1985 level. This has resulted in a serious backlogof preservation and upgrading, particularly for the provincial and kabupaten road networks. Andboth quality and access have seen little progress – PDAM coverage and electricity access remainextremely low, at 17 and 55 percent, respectively (World Bank, 2004a).
The State’s ability to pursue growth and poverty reduction objectives through infrastructureprovision has thus become very constrained since the crisis. However, the ongoing fiscalrecovery may now allow for more public expenditure on infrastructure, although much of thefunding burden will need to be born by user charges and tariffs.
Infrastructure investment is now at a crossroads: a rebound in infrastructure expenditure is vitalto revamp investment and sustain economic growth. With steady macroeconomic conditions andpolitical stability, Indonesia is well poised to address its infrastructure bottlenecks—providedthat it follows through on the policy reforms initiated in a mixture of infrastructure sectors.Failure to seize this window of opportunity may jeopardize growth prospects for decades.
Based on international comparisons, as well as comparisons with levels of government spendingbefore the crisis, it is estimated that an increase in annual total infrastructure investment of US$
Coordination
113
5 billion above the current trend (amounting to an additional 2 percent of GDP) is required tomeet the projected medium-term growth target of 6 percent (World Bank 2004a). Sustainedpolicy reforms would attract sizeable private investment back to Indonesia. However, for theforeseeable future public sector funding is likely to play an important role in closing the fundinggap for infrastructure.
There is little doubt that creating increased fiscal space for economically sound infrastructureprojects is vital to build the fundamentals necessary for long-term growth in the country. Furthercompressing productive public infrastructure expenditure to achieve short-term macroeconomicstability risks engendering a vicious circle, with depressed prospects for growth, user fees andtaxes. The challenge for Indonesia now lies in building the requisite coordinating capacity andaccountability mechanisms. This will be needed to strike a careful balance between fiscalprudence and fiscal space, attracting private investment, and implementing infrastructure sectorreforms. A more reliable cost-recovery policy, and greater certainty over fiscal space forsubsidies, would also help attract private investment.
Over the last 10-15 years, infrastructure service provision has been increasingly delegated byGovernment to corporatized state enterprises or to the private sector, with some efficiency gains(albeit modest)65. However, this delegation has not generally been accompanied by sectorrestructuring to allow competition. Nor has the rule of law yet replaced the rule of a strongleader, so the ability of the judicial system or of capital markets to bring better corporategovernance or to encourage further private investment is limited.
So for the time being, top-down oversight and regulation remain at a premium to ensureperformance and to catalyze reform (particularly as vested interests in infrastructure sectorsremain very strong). But as we have seen, the planning agencies’ scope to provide that oversightand regulation is now severely limited, and new institutions have not emerged to fulfill theseroles.
In the same way as corporatization and privatization has brought modest performanceimprovements, Indonesia’s radical decentralization to the kabupaten and kota level (with alimited role for provinces) laid the foundation for greater government responsiveness tocommunities.66 However, it has also created considerable uncertainty about inter-jurisdictionalresponsibilities and has limited fiscal space for central initiatives. Case in point: The transportsector, where conflicting government regulations and sector laws regarding the functions ofcentral and provincial governments have created a coordinating vacuum. As a result primaryinfrastructure networks – such as major national and provincial roads - have been neglected. 12.3percent of the national and provincial road network remains unsealed; in Kalimantan and EasternIndonesia, the percentage rises to 27 percent (World Bank, 2004a). Local governments’ share ofpublic investment in infrastructure is now almost equal to that of central government (at justunder 1 percent of GDP a piece in 2002). Interestingly, although this would appear to favor those
65 For instance, following concessioning of local telecoms services in 1995, telephone mainlines per employeeincreased from 82 to 181 over a period of six years.66 Indonesia has more than 400 local governments in kabupatens (counties) and kotas (municipalities) as comparedto only 33 provincial governments.
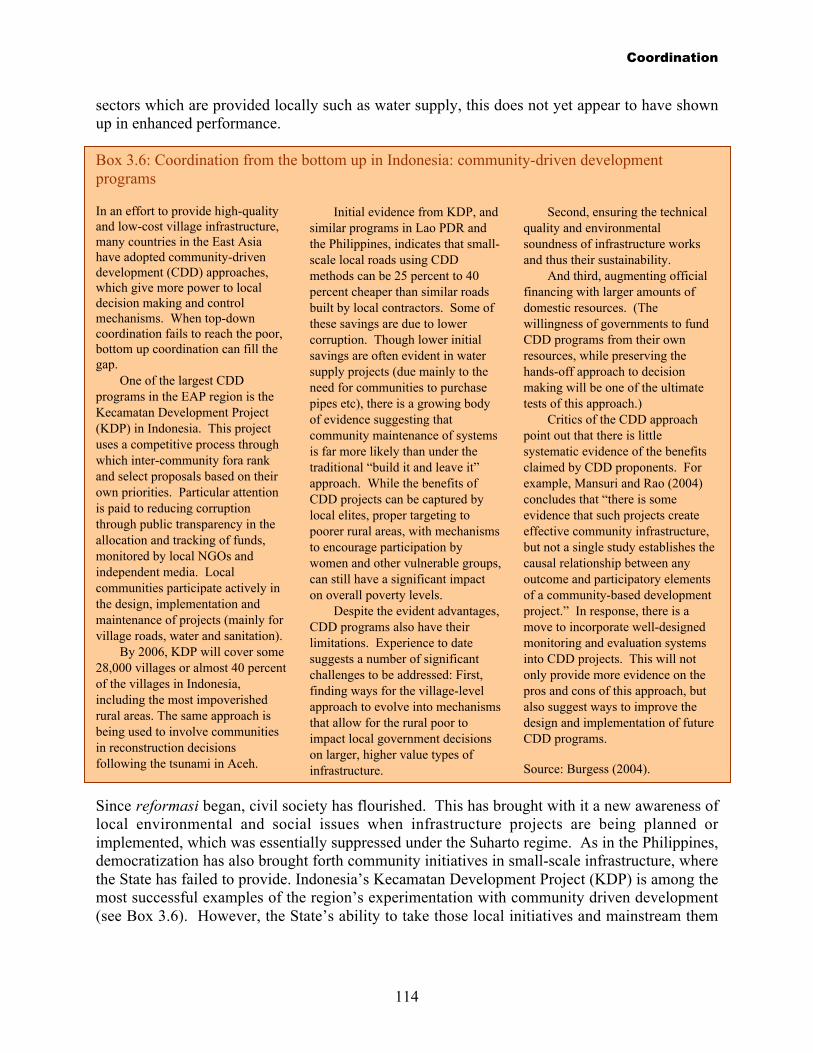
Coordination
114
sectors which are provided locally such as water supply, this does not yet appear to have shownup in enhanced performance.
Box 3.6: Coordination from the bottom up in Indonesia: community-driven developmentprograms
In an effort to provide high-qualityand low-cost village infrastructure,many countries in the East Asiahave adopted community-drivendevelopment (CDD) approaches,which give more power to localdecision making and controlmechanisms. When top-downcoordination fails to reach the poor,bottom up coordination can fill thegap.
One of the largest CDDprograms in the EAP region is theKecamatan Development Project(KDP) in Indonesia. This projectuses a competitive process throughwhich inter-community fora rankand select proposals based on theirown priorities. Particular attentionis paid to reducing corruptionthrough public transparency in theallocation and tracking of funds,monitored by local NGOs andindependent media. Localcommunities participate actively inthe design, implementation andmaintenance of projects (mainly forvillage roads, water and sanitation).
By 2006, KDP will cover some28,000 villages or almost 40 percentof the villages in Indonesia,including the most impoverishedrural areas. The same approach isbeing used to involve communitiesin reconstruction decisionsfollowing the tsunami in Aceh.
Initial evidence from KDP, andsimilar programs in Lao PDR andthe Philippines, indicates that small-scale local roads using CDDmethods can be 25 percent to 40percent cheaper than similar roadsbuilt by local contractors. Some ofthese savings are due to lowercorruption. Though lower initialsavings are often evident in watersupply projects (due mainly to theneed for communities to purchasepipes etc), there is a growing bodyof evidence suggesting thatcommunity maintenance of systemsis far more likely than under thetraditional “build it and leave it”approach. While the benefits ofCDD projects can be captured bylocal elites, proper targeting topoorer rural areas, with mechanismsto encourage participation bywomen and other vulnerable groups,can still have a significant impacton overall poverty levels.
Despite the evident advantages,CDD programs also have theirlimitations. Experience to datesuggests a number of significantchallenges to be addressed: First,finding ways for the village-levelapproach to evolve into mechanismsthat allow for the rural poor toimpact local government decisionson larger, higher value types ofinfrastructure.
Second, ensuring the technicalquality and environmentalsoundness of infrastructure worksand thus their sustainability.
And third, augmenting officialfinancing with larger amounts ofdomestic resources. (Thewillingness of governments to fundCDD programs from their ownresources, while preserving thehands-off approach to decisionmaking will be one of the ultimatetests of this approach.)
Critics of the CDD approachpoint out that there is littlesystematic evidence of the benefitsclaimed by CDD proponents. Forexample, Mansuri and Rao (2004)concludes that “there is someevidence that such projects createeffective community infrastructure,but not a single study establishes thecausal relationship between anyoutcome and participatory elementsof a community-based developmentproject.” In response, there is amove to incorporate well-designedmonitoring and evaluation systemsinto CDD projects. This will notonly provide more evidence on thepros and cons of this approach, butalso suggest ways to improve thedesign and implementation of futureCDD programs.
Source: Burgess (2004).
Since reformasi began, civil society has flourished. This has brought with it a new awareness oflocal environmental and social issues when infrastructure projects are being planned orimplemented, which was essentially suppressed under the Suharto regime. As in the Philippines,democratization has also brought forth community initiatives in small-scale infrastructure, wherethe State has failed to provide. Indonesia’s Kecamatan Development Project (KDP) is among themost successful examples of the region’s experimentation with community driven development(see Box 3.6). However, the State’s ability to take those local initiatives and mainstream them

Coordination
115
into policies or programs is weak. Indeed, in general the coordination necessary to mainstreamenvironmental and social considerations has not been strong in Indonesia.67
China68
In China, authority has been extensively decentralized to the provincial and municipal level.Local government projects accounted for 86 percent of fixed asset investment in 2003 (WorldBank, 2004x). But the center remains substantially in charge and generates the strategic visionthat binds the system together.69 High growth and clear objectives have been a force forinstitutional cohesion. Politicians and technocrats are not so easily distinguished from eachother, given the leadership role of the Communist Party (although obviously the top leaders aredistinguishable from the bureaucracy at large).
Accountability is essentially upwards, and civil society’s role is limited. Planning has becomeprogressively more strategic and flexible. Market forces play an ever-increasing role in statedecision-making; the transition has been gradual and adaptive, within a framework of politicalcontinuity and authority.
China’s principal planning agency is the National Development and Reform Commission(formerly the National Planning Commission). Unlike BAPPENAS or NEDA, NDRC has notseen its strategic planning role seriously undermined. China did not face a fiscal crisis post-1997(indeed it undertook a deliberately countercyclical fiscal expansion), and has maintained a steadyhigh-growth path. Democratization has not emerged to change the role of leadership oraccountability as it has in many other parts of the region, and the executive branch ofgovernment remains very strong. NDRC continues to play a major strategic role, insubordination to the Communist Party and the State Council.
The central role of infrastructure in supporting national economic development has beenemphasized by the Communist Party of China (CPC) since it took power in 1949. This role hasbeen further emphasized since the CPC made the strategic choice in the 1980s to adopt anexport-led economic development strategy and to promote economic growth by attracting FDI.China’s infrastructure investment is the highest in the region as a percentage of GDP, and iscertainly amongst the very highest in the world.
To a great extent, China benefited as a late comer, learning from its neighboringeconomies—Japan, South Korea, Taiwan (China), Hong Kong (China) and Singapore. Thespecial economic zones (SEZ) and coastal open cities were variants of the tax-freemanufacturing zones and industrial parks in neighboring countries. Adaptation and learninghave been a hallmark of Chinese planning. The early infrastructure investment was mostlyassociated with the SEZs. It was concentrated heavily on the port capacity and road transport 67 Indonesia’s fuel subsidies are a good example of the lack of mainstreaming of environmental and socialconsiderations. Although fuel subsidies make good populist politics, they are very poorly-targeted (so reduce fiscalspace for programs that genuinely help the poor), and exacerbate urban congestion and pollution.68 This section is based on Liu (2004), except where otherwise indicated.69 Although by way of context, the average Chinese province has a population about twice that of the whole ofMalaysia. China has roughly the same number of provinces as Indonesia – but with more than five times the totalpopulation. Decentralization in China cannot easily be compared to decentralization in smaller countries.

Coordination
116
links in a few selected harbor cities. The significant improvement of economic infrastructure inthe coastal urban areas in the 1980s, and the policy to allow rural labor to enter the urban labormarket, made these areas highly competitive in attracting manufacturing FDI, setting theprecedents for the subsequent waves of infrastructure investment.
As China broadens its infrastructure strategy from a strong growth focus to a more inclusivedevelopment model, the shift is very much steered by strategic vision from the top. The WesternRegional Development Strategy, for instance – which seeks to narrow income inequalitybetween the richer coast areas and the poorer western regions – has enjoyed high-level partysupport from its outset. This has helped ensure implementation, and more importantly,administrative commitment in the face of unexpected implementation challenges.
However, the emphasis on strategic direction from the center is not to deny the great significancefor infrastructure of decentralization in China, nor the ability of decentralized agencies toundermine some of the intentions of the center. The ability of provinces and cities to borrowfrom the state-owned financial sector for infrastructure investment with only limited creditassessment has challenged the Government’s ability to exercise macroeconomic control, as wepick up in Box 3.7. That same overheated pace of infrastructure investment has exacerbatedenvironmental degradation and generated social tensions, particularly in the process of landacquisition. At a more microeconomic level, central government is decreasingly able to controlthe infrastructure investment choices of decentralized governments.
But whatever the difficulties, it is clear that in a country the size of China, rapid infrastructuredevelopment would not have been possible without substantial decentralization ofresponsibilities to local governments and enterprises. And it is interesting to see how China isdealing with the issue of inter-jurisdictional infrastructure. The Pearl River Delta, the YangzeDelta and the Beijing-Tianjin region are emerging as highly prosperous and integratedmetropolitan areas covering a number of provinces and other jurisdictions. Leaders of localitiesare beginning to group together in cross-jurisdictional infrastructure initiatives, but with someclear top-down central guidance.
The most ambitious to date is perhaps the initiative for the Pan-Pearl River Delta RegionalCooperation and Development. It involves nine Southern provinces, seven ministries, and HongKong (China) and Macau, covering almost one fourth of China’s territory. The region comprisesa few highly-developed coastal urban economic centers and several poor but natural resource-abundant interior provinces. The idea was initiated by the CPC leader of Guangdong Province, amember of the powerful political bureau. The initiative is based on priority investments inhighways and railways pledged by the central ministries, and a 29-kilometer, US$2 billion bridgeacross the Pearl River Mouth Bay between Hong Kong (China) and Zhuhai.
But China is facing some of the stresses and strains in the system faced by the six geese in front.Complexity is increasing, objectives are multiplying. Continuing to deliver infrastructureperformance will almost certainly require more decentralization and delegation. This willinvolve an even greater role for market forces – particularly through competition in serviceprovision and increased commercialization of financing – but also will challenge the center tocontinue to play its crucial strategic role. Savings will need to be transformed into investment
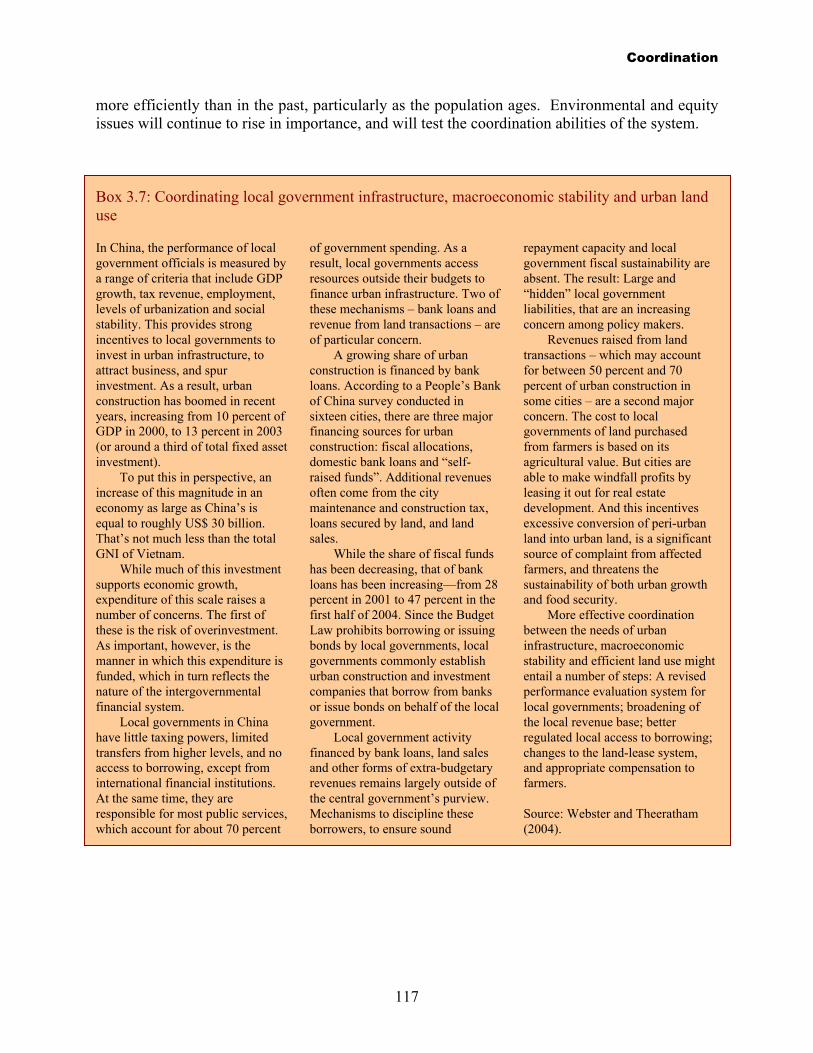
Coordination
117
more efficiently than in the past, particularly as the population ages. Environmental and equityissues will continue to rise in importance, and will test the coordination abilities of the system.
Box 3.7: Coordinating local government infrastructure, macroeconomic stability and urban landuse
In China, the performance of localgovernment officials is measured bya range of criteria that include GDPgrowth, tax revenue, employment,levels of urbanization and socialstability. This provides strongincentives to local governments toinvest in urban infrastructure, toattract business, and spurinvestment. As a result, urbanconstruction has boomed in recentyears, increasing from 10 percent ofGDP in 2000, to 13 percent in 2003(or around a third of total fixed assetinvestment).
To put this in perspective, anincrease of this magnitude in aneconomy as large as China’s isequal to roughly US$ 30 billion.That’s not much less than the totalGNI of Vietnam.
While much of this investmentsupports economic growth,expenditure of this scale raises anumber of concerns. The first ofthese is the risk of overinvestment.As important, however, is themanner in which this expenditure isfunded, which in turn reflects thenature of the intergovernmentalfinancial system.
Local governments in Chinahave little taxing powers, limitedtransfers from higher levels, and noaccess to borrowing, except frominternational financial institutions.At the same time, they areresponsible for most public services,which account for about 70 percent
of government spending. As aresult, local governments accessresources outside their budgets tofinance urban infrastructure. Two ofthese mechanisms – bank loans andrevenue from land transactions – areof particular concern.
A growing share of urbanconstruction is financed by bankloans. According to a People’s Bankof China survey conducted insixteen cities, there are three majorfinancing sources for urbanconstruction: fiscal allocations,domestic bank loans and “self-raised funds”. Additional revenuesoften come from the citymaintenance and construction tax,loans secured by land, and landsales.
While the share of fiscal fundshas been decreasing, that of bankloans has been increasing—from 28percent in 2001 to 47 percent in thefirst half of 2004. Since the BudgetLaw prohibits borrowing or issuingbonds by local governments, localgovernments commonly establishurban construction and investmentcompanies that borrow from banksor issue bonds on behalf of the localgovernment.
Local government activityfinanced by bank loans, land salesand other forms of extra-budgetaryrevenues remains largely outside ofthe central government’s purview.Mechanisms to discipline theseborrowers, to ensure sound
repayment capacity and localgovernment fiscal sustainability areabsent. The result: Large and“hidden” local governmentliabilities, that are an increasingconcern among policy makers.
Revenues raised from landtransactions – which may accountfor between 50 percent and 70percent of urban construction insome cities – are a second majorconcern. The cost to localgovernments of land purchasedfrom farmers is based on itsagricultural value. But cities areable to make windfall profits byleasing it out for real estatedevelopment. And this incentivesexcessive conversion of peri-urbanland into urban land, is a significantsource of complaint from affectedfarmers, and threatens thesustainability of both urban growthand food security.
More effective coordinationbetween the needs of urbaninfrastructure, macroeconomicstability and efficient land use mightentail a number of steps: A revisedperformance evaluation system forlocal governments; broadening ofthe local revenue base; betterregulated local access to borrowing;changes to the land-lease system,and appropriate compensation tofarmers.
Source: Webster and Theeratham(2004).
Coordination
118
Thailand70
And like China’s, the Thailand story is quite close to those of the geese flying in front. Strategic,long-term vision has played a major role, coordination amongst technocrats has been quiteeffective on the whole, and growth has been high (with a brief crisis interruption). Participationand decentralization have played a fairly limited role, although civil society is active. However,the relationship between politicians and technocrats has not been a fixed one: at times,technocrats have been the prime generators of vision; at other times, it has been the politicians.
The National Economic and Social Development Board (NESDB) is Thailand’s principalplanning agency. From late 1992 through 2000, Thailand was governed by coalitions. Differentparties controlled different ministries which substantially weakened coordination and integratedplanning at the Cabinet level. NESDB effectively filled the gap, through its mandate to producenational development plans and to approve all infrastructure projects above 1 billion baht invalue (about $ 25 million).
The elections of 2000 brought new direction to infrastructure policy, and reconsideration of thecountry’s coordination mechanisms. With its dominant control over government, the Thai RackThai Party initiated a major infrastructure investment program, which included an emphasis onlogistics, affordable housing, urban mass transit, and small-settlement water supply. These areasof emphasis derive from an analysis of Thailand’s evolving competitiveness needs, as well asfrom social concerns.71 The Prime Minister’s Office took on the role of identifying major newdirections in infrastructure. The Ministry of Finance (MoF) appeared to rise in importance in thecoordination of the new infrastructure strategy, given the crucial role that financing would playin implementation of the new planned mega-projects, and the mandate of the MoF to overseestate enterprises (which account for about 55 percent of infrastructure investment in Thailand).72
The role of NESDB became uncertain for a while, but it now appears to again be in charge of thecoordination of infrastructure planning and mega-projects.
Like many other East Asian countries, Thailand’s move towards private participation ininfrastructure has been fairly marginal and did not involve much sector restructuring.Competition in infrastructure service provision has been largely avoided, and regulatoryinstitutions enjoy little autonomy. Thailand has strategically managed to preserve its investmentclimate by remaining broadly predictable in its behavior. Contracts in infrastructure havegenerally been honored, and its key state enterprises – such as EGAT and MEA in the electricitysector, PWA in the water sector – have maintained good creditworthiness and service deliverytrack records, even through the 1997 crisis and its aftermath.
70 This section is based on Webster and Theeratham (2004), except where otherwise indicated.71 For example, the rise of China as “factory of the world” is causing Thailand to focus more on the high-levelservice sector. This requires dense, high-transaction business environments with easy accessibility. The desire tocreate such environments has meant an increased focus on mass transit in the urban core (see Spotlight 1 later in thisChapter). In peri-urban areas, manufacturing is becoming increasingly centered in dominant clusters of integratedsupply chains (e.g. the automotive sector) as a result of competition from China, and infrastructure in peri-urbanareas has been reoriented accordingly.72 Directed lending and government guarantees on loans or bonds have played a significant role in Thaiinfrastructure financing.
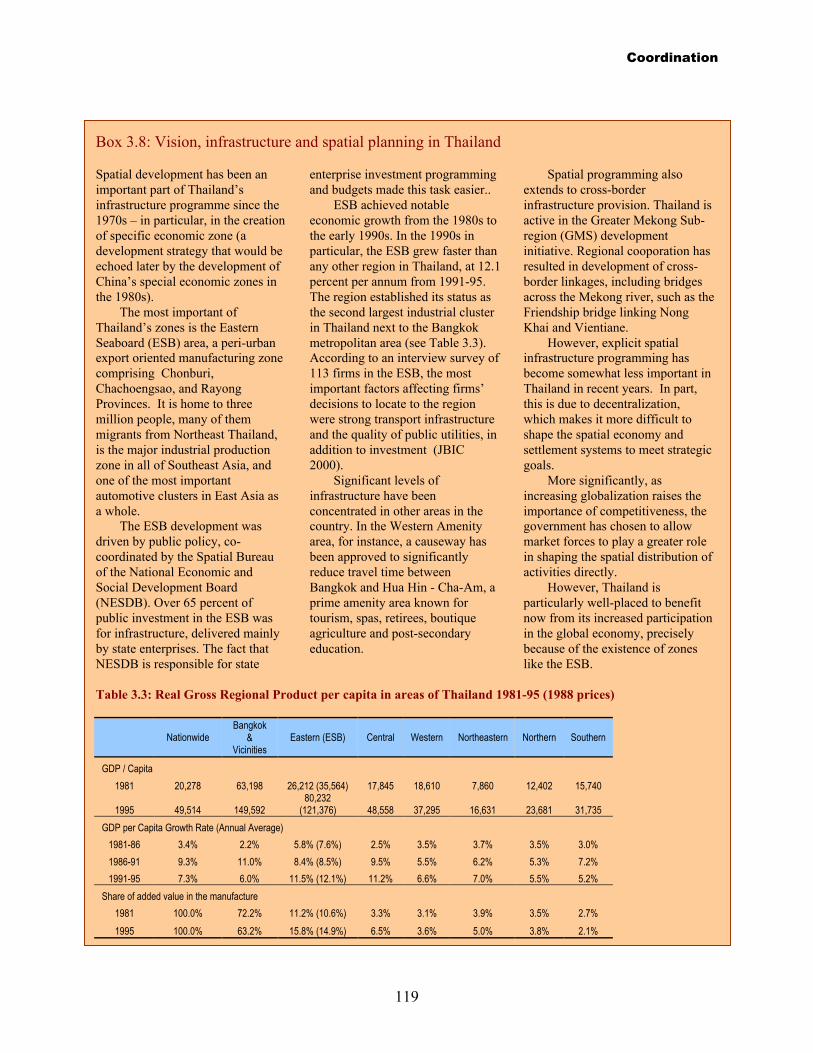
Coordination
119
Box 3.8: Vision, infrastructure and spatial planning in Thailand
Spatial development has been animportant part of Thailand’sinfrastructure programme since the1970s – in particular, in the creationof specific economic zone (adevelopment strategy that would beechoed later by the development ofChina’s special economic zones inthe 1980s).
The most important ofThailand’s zones is the EasternSeaboard (ESB) area, a peri-urbanexport oriented manufacturing zonecomprising Chonburi,Chachoengsao, and RayongProvinces. It is home to threemillion people, many of themmigrants from Northeast Thailand,is the major industrial productionzone in all of Southeast Asia, andone of the most importantautomotive clusters in East Asia asa whole.
The ESB development wasdriven by public policy, co-coordinated by the Spatial Bureauof the National Economic andSocial Development Board(NESDB). Over 65 percent ofpublic investment in the ESB wasfor infrastructure, delivered mainlyby state enterprises. The fact thatNESDB is responsible for state
enterprise investment programmingand budgets made this task easier..
ESB achieved notableeconomic growth from the 1980s tothe early 1990s. In the 1990s inparticular, the ESB grew faster thanany other region in Thailand, at 12.1percent per annum from 1991-95.The region established its status asthe second largest industrial clusterin Thailand next to the Bangkokmetropolitan area (see Table 3.3).According to an interview survey of113 firms in the ESB, the mostimportant factors affecting firms’decisions to locate to the regionwere strong transport infrastructureand the quality of public utilities, inaddition to investment (JBIC2000).
Significant levels ofinfrastructure have beenconcentrated in other areas in thecountry. In the Western Amenityarea, for instance, a causeway hasbeen approved to significantlyreduce travel time betweenBangkok and Hua Hin - Cha-Am, aprime amenity area known fortourism, spas, retirees, boutiqueagriculture and post-secondaryeducation.
Spatial programming alsoextends to cross-borderinfrastructure provision. Thailand isactive in the Greater Mekong Sub-region (GMS) developmentinitiative. Regional cooporation hasresulted in development of cross-border linkages, including bridgesacross the Mekong river, such as theFriendship bridge linking NongKhai and Vientiane.
However, explicit spatialinfrastructure programming hasbecome somewhat less important inThailand in recent years. In part,this is due to decentralization,which makes it more difficult toshape the spatial economy andsettlement systems to meet strategicgoals.
More significantly, asincreasing globalization raises theimportance of competitiveness, thegovernment has chosen to allowmarket forces to play a greater rolein shaping the spatial distribution ofactivities directly.
However, Thailand isparticularly well-placed to benefitnow from its increased participationin the global economy, preciselybecause of the existence of zoneslike the ESB.
Table 3.3: Real Gross Regional Product per capita in areas of Thailand 1981-95 (1988 prices)
NationwideBangkok
&Vicinities
Eastern (ESB) Central Western Northeastern Northern Southern
GDP / Capita
1981 20,278 63,198 26,212 (35,564) 17,845 18,610 7,860 12,402 15,740
1995 49,514 149,59280,232
(121,376) 48,558 37,295 16,631 23,681 31,735
GDP per Capita Growth Rate (Annual Average)
1981-86 3.4% 2.2% 5.8% (7.6%) 2.5% 3.5% 3.7% 3.5% 3.0%
1986-91 9.3% 11.0% 8.4% (8.5%) 9.5% 5.5% 6.2% 5.3% 7.2%
1991-95 7.3% 6.0% 11.5% (12.1%) 11.2% 6.6% 7.0% 5.5% 5.2%
Share of added value in the manufacture
1981 100.0% 72.2% 11.2% (10.6%) 3.3% 3.1% 3.9% 3.5% 2.7%
1995 100.0% 63.2% 15.8% (14.9%) 6.5% 3.6% 5.0% 3.8% 2.1%
Coordination
120
Decentralization in Thailand has also been quite limited. Indeed, it has progressed littlecompared to many neighboring countries. After some past perceived failures withdecentralization to a low level of government – the tambon - the TRT Government has focuseddecentralization on the 76 provinces. However, the provincial governors – styled “CEOGovernors” – are appointed by the Government rather than being elected, and their role is more adeconcentration of central authority than a real decentralization. Nonetheless there has been amarked shift in spending: in 2003, 23 percent of public expenditure was by local governments,up from 8 percent in 1997. Much of this shift has been in infrastructure. As elsewhere in theregion, inter-jurisdictional coordination has been an issue.
Stakeholder participation in infrastructure projects has made significant progress at the localgovernment level. Civic fora in which the expected impacts of proposed projects are debatedhave become the norm. However, nationally-initiated large-scale projects have shown lessprogress. Environmental Impact Assessments are prepared for most large projects, buttransparency in the EIA process is often lacking, and the EIAs themselves often have littleimpact on project selection, design or implementation. EIAs are not generally used to provideframeworks for constructive negotiations amongst different stakeholders. Instead they are oftenjust formal attachments to projects, which are already seen by their proponents as a fait accompli(this approach can of course lead to conflict and delays).
Thailand’s infrastructure planning and coordination has performed fairly well, although somesectors – such as electricity – have performed much better than others – such as wastewater.There have been substantial delays in some key projects – e.g. the Suvarnabhumi airport, theBangkok subway – which are due to very slow and bureaucratic decision-making and to theinadequate stakeholder participation process. But on the whole, the system has been flexible andadaptive; it has dealt well both with crisis and with long-term strategy. In general, the systemhas evolved effectively as the political context has changed, and strategic vision has usuallymanaged to play a central role.
From coordination to accountability and risk management
We have seen that the strength of infrastructure service delivery in the leading geese – HongKong (China), Japan, Korea, Malaysia, Singapore and Taiwan (China) – derived from theirability to formulate high-level economic strategy and to translate that into implementation on theground. They did this principally through top-down planning and coordination, with fairlylimited public participation or delegation of service delivery beyond a small number of largemonopolies. Accountability was largely vertical.
We saw that this was successful when economic growth was high, and policymakers formed aconsensus around relatively simple objectives, centered on sustaining that growth throughexports and investment. When those economies began to encounter economic slowdown orcrisis, and objectives broadened to include more social and environmental considerations, ormonolithic politics started to open to wider participation, the top-down model began to showsigns of strain. But underlying those pressures was the region’s increasing integration in a
Coordination
121
rapidly-changing global economy, which brought with it exponentially increasing complexityand coordination challenges.
Those challenges which the leading geese began to face in the late 1980s after about threedecades of high income growth with the top-down model, the geese flying behind are facing atsignificantly lower levels of income and economic development. China, Indonesia, thePhilippines, Thailand and other developing countries in the region are increasingly looking forinclusive development and global integration, and are therefore facing increasing complexity.They have been responding to that complexity by delegating: to decentralized tiers ofgovernment, to the private sector, to communities, to civil society organizations, to competitivemarkets, and to arm’s length regulators or judicial systems. In general across the region, publicparticipation has also increased.
The degree of delegation and participation varies considerably between countries. To someextent, the variation is explained simply by the abilities of the center to retain control andcontinue to provide services in top-down mode. China and Thailand for example exhibit agreater role for the center than do Indonesia and the Philippines; this is partly a matter ofpolitical objectives and partly of administrative constraints. But overall, there is a sense ofcountries throughout the region struggling to design institutions to reconcile delegation,participation, and effective service delivery.
As we shall see in the next chapter, this will depend critically on the ability of the countries todevelop new accountability mechanisms at the sectoral level, and new ways to reward goodperformance and to manage the corresponding risks. We will talk a lot about competition,regulation, subsidies and risk-sharing. And throughout the discussion will run the themes ofchange, learning, and trade-offs between increasingly complex priorities.

Coordination
122
Spotlight 1: Coordination and a tale of three cities: Mass Rapid Transit in Bangkok, KualaLumpur and Manila.
East Asia’s congested and polluted cities have often looked to urban rail systems to solve theirproblems. Urban MRT requires a high degree of vision and coordination of multiple actors tomake it work, usually involving several jurisdictions and complex financing arrangements.73
Paradoxically, when the private sector is involved, the degree of vision and coordination neededratchets up even higher, because of the precision that private sector procurement brings to theprocess. We look at the experience of private concessions in MRT in three cities: Bangkok,Kuala Lumpur, and Manila.74
Bangkok
Bangkok, now a megacity of 10 million people, started its efforts to put an MRT system in placein 1979. By 1990, no MRT system had yet been built, and Bangkok was notorious for itschronic traffic congestion. The technocratic government that had come to power at this timeafter public unrest and military intervention, was determined to resolve Bangkok’s transportproblems. This was a key part of its strategy to restore economic credibility to Thailand after theunrest.
In 1990, the Governor of the Bangkok Metropolitan Administration instructed his officials tosearch for a private concessionaire to build and operate an MRT project. This initiative andparallel efforts eventually spawned two MRT projects: the BTS Skytrain and the Blue Line.Both had long gestation periods: the Skytrain opened in 1999, and the Blue Line subway in July2004. Both operate under a BOT-type concession (although the two concession contracts differin scope).
Kuala Lumpur
The Government of Malaysia is intent on transforming the country into a “developed society” by2020 (the so-called “Vision 2020”). Infrastructure and the private sector are an integral part ofthat vision – particularly the Malaysian private sector.
Planning studies for MRT in Kuala Lumpur began in the mid-1980s, and MRT came to be seenas essential to making the fast-growing city livable.75 Those plans eventually led to three MRTprojects: KL STAR, KL PUTRA, and KL Monorail. They opened in 1996, 1998, and 2003respectively. All operated under BOT arrangements.76
73 MRT – Mass Rapid Transit – is used as shorthand for urban rail systems that carry a mass ridership rapidly. Theyinclude metros and light rail transit (LRT) systems that are segregated from other road traffic.74 See Halcrow (2004) for a detailed analysis of the Tale of Three Cities.75 Kuala Lumpur’s current population is about 1.3 million people.76 KL STAR and KL PUTRA were subsequently taken over by the State in 2002.
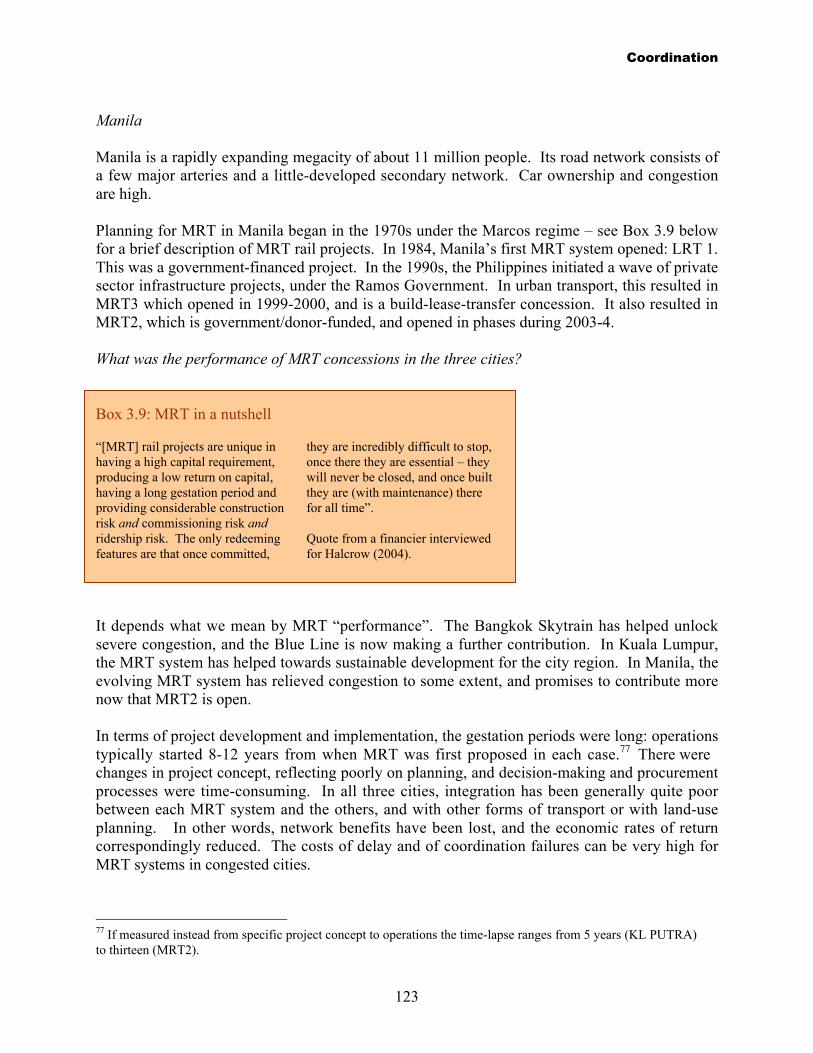
Coordination
123
Manila
Manila is a rapidly expanding megacity of about 11 million people. Its road network consists ofa few major arteries and a little-developed secondary network. Car ownership and congestionare high.
Planning for MRT in Manila began in the 1970s under the Marcos regime – see Box 3.9 belowfor a brief description of MRT rail projects. In 1984, Manila’s first MRT system opened: LRT 1.This was a government-financed project. In the 1990s, the Philippines initiated a wave of privatesector infrastructure projects, under the Ramos Government. In urban transport, this resulted inMRT3 which opened in 1999-2000, and is a build-lease-transfer concession. It also resulted inMRT2, which is government/donor-funded, and opened in phases during 2003-4.
What was the performance of MRT concessions in the three cities?
Box 3.9: MRT in a nutshell
“[MRT] rail projects are unique inhaving a high capital requirement,producing a low return on capital,having a long gestation period andproviding considerable constructionrisk and commissioning risk andridership risk. The only redeemingfeatures are that once committed,
they are incredibly difficult to stop,once there they are essential – theywill never be closed, and once builtthey are (with maintenance) therefor all time”.
Quote from a financier interviewedfor Halcrow (2004).
It depends what we mean by MRT “performance”. The Bangkok Skytrain has helped unlocksevere congestion, and the Blue Line is now making a further contribution. In Kuala Lumpur,the MRT system has helped towards sustainable development for the city region. In Manila, theevolving MRT system has relieved congestion to some extent, and promises to contribute morenow that MRT2 is open.
In terms of project development and implementation, the gestation periods were long: operationstypically started 8-12 years from when MRT was first proposed in each case.77 There werechanges in project concept, reflecting poorly on planning, and decision-making and procurementprocesses were time-consuming. In all three cities, integration has been generally quite poorbetween each MRT system and the others, and with other forms of transport or with land-useplanning. In other words, network benefits have been lost, and the economic rates of returncorrespondingly reduced. The costs of delay and of coordination failures can be very high forMRT systems in congested cities.
77 If measured instead from specific project concept to operations the time-lapse ranges from 5 years (KL PUTRA)to thirteen (MRT2).

Coordination
124
In financial terms, most projects could be deemed a failure in some sense. The projects have notmade the expected financial rate of return, some private investors and financial institutions havelost money, and the state has decided to step in to salvage some of the systems. However, thisappearance of financial “failure” is rather misleading. No MRT system in the world gets bywithout subsidies,78 yet the private concessions in these three cities were optimisticallyconceived without subsidies.79 In short, the “failure” is only by reference to unrealistic financialexpectations (albeit somewhat understandable given that the three cities were among the pioneersin private concessions for MRT).80 The economic rates of return could still be high enough tojustify the projects.
The case for MRT subsidies is straightforward – at least in principle. MRT systems can generatelarge external benefits for vehicle owners and users, and for those who benefit indirectly fromreduced congestion and pollution. Users of the MRT system cannot be expected to pay for thoseexternal benefits, and the external beneficiaries can only be made to pay through some form oftaxation or road pricing channeled back to the MRT network through subsidies.
Of course, that doesn’t mean that subsidized MRT will always be the best way of providingpublic transport, but in East Asia’s wealthier, highly-congested and polluted megacities itsometimes will be. Choosing between subsidizing MRT or something else is essentially astrategic vision and coordination challenge.
What have we learnt about government’s role in private MRT concessions?
Halcrow (2004) finds that in these three cities the involvement of the private sector madeprojects happen that otherwise would not have happened, or made them happen sooner, andbrought greater efficiency to operations than would otherwise have been the case. But this isperhaps not the major lesson of the Tale of Three Cities.
MRT systems represent a long network of expensive infrastructure cutting through densely-packed urban corridors, and shaping the future geography of their cities. As such, governmentsneed to be intimately involved. There are many tasks that the private sector cannot or should notcarry out in planning and implementing an MRT project.
Principal amongst these government functions are defining how a particular MRT project isintended to fit within the city’s overall transport and land-use plans (which will almost inevitablybe fragmented and fall under multiple jurisdictions), how to acquire the land, how the projectwill be designed and procured, how to integrate different transport systems, what theGovernment’s financial contribution will be, how risk-sharing will be negotiated, and howperformance will be regulated. The demands placed by an MRT concession on Government’s
78 Hong Kong is an arguable exception. But even in Hong Kong, whose high-density and prosperous populationcreates probably the most favorable MRT environment possible anywhere, the MRT system is in effect cross-subsidized from property value-appreciation.79 Although some projects were part-financed by state-owned financial institutions, so there may have been somehidden subsidies.80 All the projects in question had highly overoptimistic projections of ridership – a common bias in MRT planning.

Coordination
125
strategic planning and coordination capabilities are heavy, and time is of the essence. MRTwon’t make its contribution without vision and a strong drive to implement that vision.

126

127
4. Accountabilityand Risk Management
In Chapter 3 we looked at how strategic vision is formulated, and traced some of the pathsthrough which vision connects through service delivery to outcomes. In this chapter ourperspective is different. We leave strategic vision behind, and try to understand what happens atthe level at which services are delivered, and outcomes achieved.
Service delivery and outcomes reflect vision (or lack of it). But they are delivered by people,groups and institutions with incentives and objectives, to other people and groups with incentivesand objectives of their own. How do we make sense of the interactions between these actors, andwhat is it about these interactions that lead to good or bad infrastructure outcomes?
In this chapter we look at this question in terms of two-interlinked concepts: accountability andrisk management81. Think of the multiple actors to which we referred – governments,communities, investors, service providers, NGOs – engaged with each other in dynamic tension,each with their own goals, each with their own expectations of the other actors, each trying tohold the others accountable for delivery against those expectations. This we call the “push andpull of accountability”.
81 This is not to say that accountability and risk management only operate at this level. For instance, society’sleaders are also held accountable (or fail to be held accountable) for the practical relevance of their strategic visionthrough their country’s national political institutions. Their strategic decisions are deeply determined by avoidanceof risk, and desire for reward.
What are Accountability and Risk Management, and how are they connected?
Accountability is a set of institutional tools which reward organizations that consistently perform well for theirstakeholders (and penalize those that perform badly).
Risk-management is a set of institutional tools which endeavor to make risks and rewards commensurate witheach other, in order to drive good performance.
In infrastructure services, multiple actors interact. How they hold each other accountable – what we call the“push and pull” of accountability - is intimately related to how they share rewards and risk with each other.

Accountability and Risk Management
128
And as each actor pushes or pulls, they seek to maximize their rewards and minimize their risks,subject to the constraint that everyone else is doing the same thing. This is what we mean by“risk-management”. In this chapter we look at the institutions that help balance competingclaims, to try and make risks commensurate with rewards. Accountability lubricates thatbalancing process and helps make development inclusive; lack of accountability means sharpimbalances between stakeholders, unpredictability, and instability.
As in previous chapters, we will look at our theme from a number of angles. We start byconsidering three available mechanisms through which service provision can be madeaccountable, to both consumers and tax payers: The first is through community participation.The second is through competition. The third is through regulation. In the second part of thischapter, we turn our attention to the risk and accountability issues that arise specifically whengovernments provide support to service providers – through subsidies and other forms of fiscalsupport - and how they can be managed.
But before addressing these issues, lets consider what happens when accountability relationshipsand risk management do not do what they’re meant to do.
When accountability and risk management fail
Accountability and risk management are often most recognizable when they are absent. In itsmost dramatic form, the outcome of poorly functioning accountability and risk-managementframeworks takes the form of financial collapse, as one or other stakeholder is shouldered withobligations that they cannot bear.
Poorly structured infrastructure concessions are part of the story of Asia’s financial instability inthe late 1990s (see, for example, Box 3.5 on Indonesia in chapter 3). And they continue to be asource of important macro, fiscal and financial fragility in a number of countries – we saw this inVietnamese and Chinese cases in chapter 3, Boxes 3.1 and 3.7.
But the most pervasive outcome of poorly functioning accountability systems is corruption. Andwhile the sources of corruption are many and various, there are a number of peculiarities in theinfrastructure sectors that make them a frequent target.
In chapter 2 we saw that infrastructure tends to be capital intensive, that it is often lumpy, long-lasting and space-specific, and that it may run most efficiently at large scale. As a result, it isoften provided by monopolies, and can generate large rents. We saw too that infrastructureprovides vital services, which people and firms prize highly, and to which politicians assignstrategic importance.
And so, infrastructure often involves political protection, and intervention. Financial disciplinecan be weak because of a lack of competition in the market, or the knowledge that politicianswill guarantee service provision without disruption. If monopoly profits are earned, this canattract rent-seekers; if the services are underpriced through heavy regulation of monopoly power,then rents can be earned from allocating the scarce services. The close association of politicsand infrastructure can cement those arrangements in place.

Accountability and Risk Management
129
The absence of financial discipline may provide cover for the kinds of practices through whichcorruption thrives. For example, many utilities in East Asia tend to be overstaffed andemployees paid more than the going rate in the market. Inefficiency, patronage, and corruptionare not the same thing, but the lines between them may be fine, and often crossed. In thePhilippines, for instance, rural electric cooperative employ on average twice as many staff percustomer as comparable privately owned firms. Elected cooperative Board members arefrequently accused of dispensing jobs to favored groups or individuals.
Box 4.1. Corruption in infrastructure in the Philippines
Detailed information on corruptionin infrastructure – as in any activity –is difficult to obtain, and is alwayslikely to be anecdotal, given itsintrinsically covert nature. But anumber of studies in the Philippinesprovide some scope of the problem.
One study on governance issuesin public service delivery estimatedthat the misuse of resources in publicworks was between 20 percent and40 percent (Afzar et al, 2000). Thestudy noted that on certainprocurement and infrastructureprojects, regional directors of centralagencies are said to receive a 10
percent commission, and Departmentof Budget and Management officers,15 percent.
A more recent study lendssupport to this view, finding thatinfrastructure projects selected bylocal development councils, butactually built by the Department ofPublic Works and Highways or othercentral agencies, triggered multiplebribes and unofficial payments ateach layer of governmentinvolvement
(World Bank, 2005c).
With a lumpy, long-term infrastructure asset it is often not easy to discern the relationshipbetween the level of capital investment and flow of infrastructure services. For instance, thethickness of a road will ultimately affect the level of required maintenance, but in the short runwill make little difference to the throughput capacity of a road project. This means that, withoutstrong controls, infrastructure providers can both inflate the levels of capital spending needed,and hide the effects of actual under-investment. Competition for the market can help hold theprovider accountable, but those making the procurement decision need to be accountable also.
And last but not least, the large size of many types of infrastructure creates opportunities forlarge kickbacks associated with its procurement. The added fact that infrastructure’s benefits arecomplex means they are hard to measure: it is easy to claim the virtue of new investments. Newassets can be favored over better management of those already in place. Corruption can thrive inthat environment. (See Box 4.1)

Accountability and Risk Management
130
Box 4.2: Public spending in Indonesia and the search for accountability
It is hard to judge whethercorruption in Indonesia hasworsened or improved since the fallof the New Order Regime anddecentralization reforms. Butcorruption still features high amongpopular and investor concerns, andposes considerable obstacles tofuture infrastructure programs inIndonesia.
Opportunity for corruptionarises at most stages of Indonesia’sinfrastructure project cycle – projectidentification, contract award andnegotiation, as well as financing andimplementation – whileweaknesses in public financemanagement as a whole bluraccountability across government.
In project identification, publicsector corruption has been mostcommon in the design of projectsthat entail SOE and governmentprocurement of highly specializedproducts, usually from abroad.Here, collusion takes place betweenlocal agents and suppliers, withdeals struck at marked-up prices,and narrow bid specificationsprecluding competition.
There are some indications,however, that this is on the wane,with increased exposure tocompetition, through privatizationor capital market discipline, and asthe Ministry of Finance implementsSOE performance audits.
In the private sector,unsolicited bids are the mostimportant source of corruption.During the Soeharto era, thepolitical connections of a localpartner, or financial pay-offs would
often ensure quick project approval,without due attention to the meritsof projects. And many formalreview processes, where theyexisted, were ignored.
Public procurement is a furtherconsiderable source of corruption,with estimates of up to 30 percent ofthe approximately US$7 billion inannually procured goods andservices lost to corruption.
Most corruption in procurementis related to the design of bidspecifications, bid invitation,selection and negotiation.Commonly employed practicesinclude restrictive bid specificationsto tailor bids to particularmanufacturers’ products; restrictingeligible bidders; and fixing theevaluation process.
Most recent public procurementregulations, set out in 2003, are animprovement on previous decrees.They establish an Institution forDevelopment of Public ProcurementPolicy, require procurementcertification for bid committees,remove pre-qualification forcontracts below US$6 million, andintroduce ‘integrity pacts’ forsuppliers and contractors.
But they remain weak inseveral respects. The governmentstill needs to work out manyunresolved details to ensure properimplementation and enforcement.And additional regulations are alsoneed to promote the transparentselection of private partners forprivate infrastructure projects.
Finally, corruption inimplementation is also common,
and usually involves under-supplying on quantity and quality.While such practices should bedetected in supervision, in practicethey are not, due to frequentcollusion between project managers,contractors and supervisors.
But the problem is not onlyprocurement itself. At a moregeneral level, poor budgetformulation gives rise to risk ofduplication of spending, anddiversion of funds to unintendedpurposes. Budgets themselves aresystematically under-funded, budgetprocedures are unpredictable,financial controls weak and auditingis ineffective. In this environment,government agencies are implicitlyexpected to find other means ofmeeting their needs, blurring theline between public and privateexpenditures and encouraging rent-seeking behavior.
In this respect, the new StateFinance Law creates an opening forreforms. Accountability can beimproved by strengtheningparliamentary oversight, equippingthe Supreme Audit Agency to do itsjob properly, and holding StateTreasurers responsible for handlingpublic money. A further keymedium-term reform will be acomplete overhaul of publicspending over a five-year period,providing adequate funding for allkey activities, and eliminating off-budget sources of funds.
Source: World Bank (2004a) andWorld Bank (2003a).

Accountability and Risk Management
131
Mechanisms to strengthen accountability
So how do mechanisms of accountability help prevent these kinds of outcomes and ensure thatrisks are equitably allocated? In the next part of this chapter we focus on three important aspectsof this question: the role of communities, of competition, and of regulation.
Communities for accountability
We saw in Chapter 2 how infrastructure can reach out to communities, particularly to the poor,and help them manage the risk in their lives. Local roads, irrigation, safe and reliable drinkingwater can make an enormous difference to the development prospects of communities.Accessing markets, raising crop yields, and avoiding water-borne disease can both raise andstabilize the incomes of the vulnerable and poor. This is infrastructure for “protective security”,one of Amartya Sen’s “five freedoms”.82
But how to make sure that infrastructure provision answers to the real needs of communities?For some types of infrastructure service, the best way to ensure this accountability is to empowerthe communities to manage their own infrastructure. Indonesia’s Kecamatan DevelopmentProject, highlighted in Chapter 3, Box 3.6, is among the largest and best known in East Asia. Butcommunity participation in infrastructure is now increasingly common across the region – fromChina to Lao PDR, the Philipines to Cambodia.
For many governments, and most of the international development community, it has been a longhard road to arrive at this realization: Local people often know more than enough about theirpriorities and possible solutions, but may just need resources and external catalysts to unlocktheir energies. Local people have more incentive to maintain assets that they choose and maybeeven build themselves, and more reason to watch out for corruption. (See Box 4.2)
Sometimes NGOs can be more effective as external catalysts of local energies than governments(or large-scale donors) can. More traditional, top-down approaches to infrastructure serviceprovision have often been unresponsive to needs at the community level.
An NGO perception survey undertaken for this study suggests that greater provision ofinformation to communities, greater involvement of local government and community-basedorganizations, and more public participation in decision making, are key concerns in anotherwise broadly optimistic outlook (See Box 4.3).
82 Sen (1999).

Accountability and Risk Management
132
Box 4.3: Infrastructure, accountability and NGO perceptions: Survey results
In fall, 2004 132 representatives fromNGOs in six East Asian countriesparticipated in a survey to measure theirperceptions of infrastructuredevelopment in the East Asia & Pacific
region*. The data show that NGOs inthese countries are quite optimistic,overall, about the direction ofinfrastructure development (72 percentof the sample said they were optimistic),
but those surveyed believe that moreshould be done to engender betterinfrastructure development on theground. For example:
Accountability as an Obstacle
86%
77%
57%
14%
24%
43%
Lack ofaccountability
ofgovernments
Lack ofaccountability
of provatesector
Lack ofaccountability
of NGOs
Not a Terribly Serious Obstacle/ Not an Obstacle at all
Very Serious/ Serious Obstacle
Level of Stakeholder involvement
47%
72%
46%
25%
71%
59%
33%
29%
9%
34%
44%
21%
21%
37%
24%
19%
20%
31%
9%
21%
31%
Central/National
Government
LocalGovernment
Local PrivateSector
InternationalPrivateSector
Community-based
Organizations
NGO's
OfficialAgencies
More Less The Same
Corruption
23%
4%
5%
77%
91%
95%
When it comes toinfrastructure development,government does not do
enough to prevent corruption
The extent to which thepotential for corruption
should be taken into account
The extent to whichcorruption is an obstacle
Agree/ Greater Degree/ Serious Obstacle
Disagree/ Less of a Degree/ Not a serious obstacle
Information
32%
68%
The communities mostaffected by infrastructure
development generally haveenough information aboutprojects to make educateddecisions related to trade-
offs
Strongly Agree/Agree Strongly Disagree/Disagree
Public participation
86%
14%The extent to whichinadequate public
participation in decisionmaking is an obstacle
Not a Terribly Serious Obstacle/ Not an Obstacle at all
Very Serious/ Serious Obstacle
Percentage of respondents (n=132/132/130)Percentage of respondents (n=128/132/132)
Percentage of respondents (n=131)
Percentage of respondents (n=131)
* Survey conducted by local, independent research firms in China, Indonesia, Japan, Philippines, Thailand and Vietnam. Respondents wererandomly chosen from lists provided by a number of sources including the Australian Council for International Development, ADB, BankInformation Centre, JBIC, and the World Bank
Percentage of respondents (n=131/131/129/132/132/131)
Percentage of respondents (n=128/132/132)
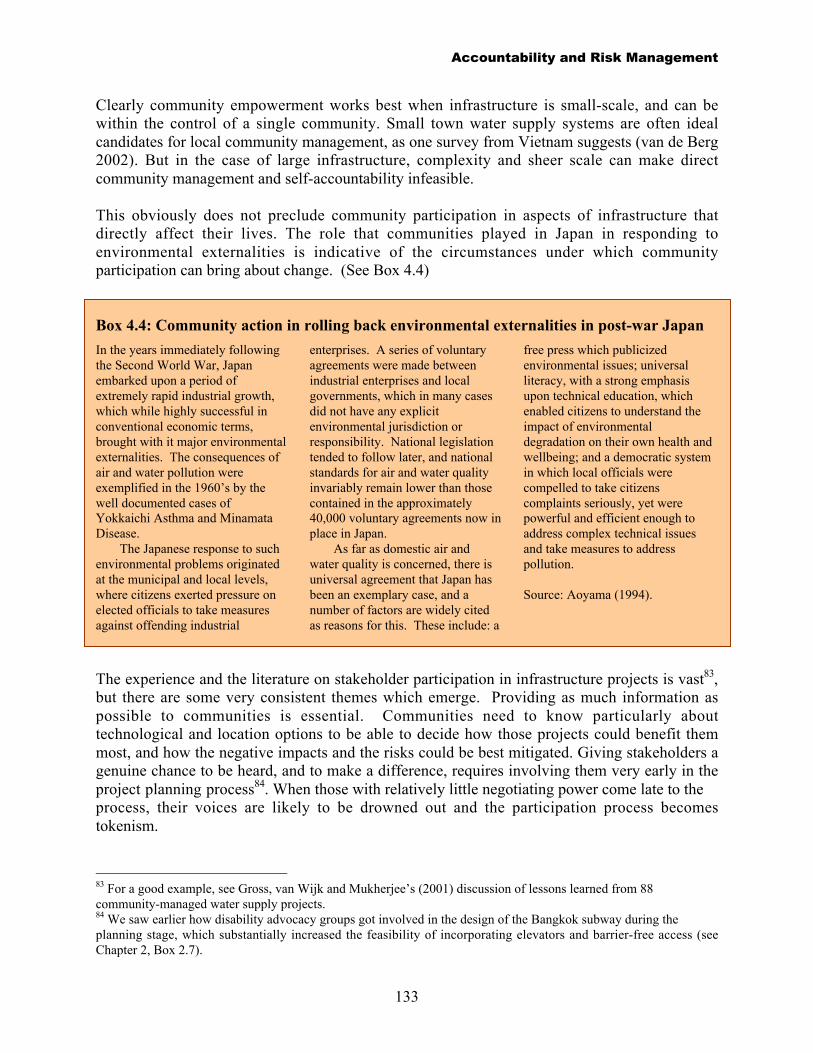
Accountability and Risk Management
133
Clearly community empowerment works best when infrastructure is small-scale, and can bewithin the control of a single community. Small town water supply systems are often idealcandidates for local community management, as one survey from Vietnam suggests (van de Berg2002). But in the case of large infrastructure, complexity and sheer scale can make directcommunity management and self-accountability infeasible.
This obviously does not preclude community participation in aspects of infrastructure thatdirectly affect their lives. The role that communities played in Japan in responding toenvironmental externalities is indicative of the circumstances under which communityparticipation can bring about change. (See Box 4.4)
Box 4.4: Community action in rolling back environmental externalities in post-war Japan
In the years immediately followingthe Second World War, Japanembarked upon a period ofextremely rapid industrial growth,which while highly successful inconventional economic terms,brought with it major environmentalexternalities. The consequences ofair and water pollution wereexemplified in the 1960’s by thewell documented cases ofYokkaichi Asthma and MinamataDisease.
The Japanese response to suchenvironmental problems originatedat the municipal and local levels,where citizens exerted pressure onelected officials to take measuresagainst offending industrial
enterprises. A series of voluntaryagreements were made betweenindustrial enterprises and localgovernments, which in many casesdid not have any explicitenvironmental jurisdiction orresponsibility. National legislationtended to follow later, and nationalstandards for air and water qualityinvariably remain lower than thosecontained in the approximately40,000 voluntary agreements now inplace in Japan.
As far as domestic air andwater quality is concerned, there isuniversal agreement that Japan hasbeen an exemplary case, and anumber of factors are widely citedas reasons for this. These include: a
free press which publicizedenvironmental issues; universalliteracy, with a strong emphasisupon technical education, whichenabled citizens to understand theimpact of environmentaldegradation on their own health andwellbeing; and a democratic systemin which local officials werecompelled to take citizenscomplaints seriously, yet werepowerful and efficient enough toaddress complex technical issuesand take measures to addresspollution.
Source: Aoyama (1994).
The experience and the literature on stakeholder participation in infrastructure projects is vast83,but there are some very consistent themes which emerge. Providing as much information aspossible to communities is essential. Communities need to know particularly abouttechnological and location options to be able to decide how those projects could benefit themmost, and how the negative impacts and the risks could be best mitigated. Giving stakeholders agenuine chance to be heard, and to make a difference, requires involving them very early in theproject planning process84. When those with relatively little negotiating power come late to theprocess, their voices are likely to be drowned out and the participation process becomestokenism.
83 For a good example, see Gross, van Wijk and Mukherjee’s (2001) discussion of lessons learned from 88community-managed water supply projects.84 We saw earlier how disability advocacy groups got involved in the design of the Bangkok subway during theplanning stage, which substantially increased the feasibility of incorporating elevators and barrier-free access (seeChapter 2, Box 2.7).

Accountability and Risk Management
134
Box 4.5: Making a deal with the community: water supply and accountability in Indonesia
Most drinking water in Indonesia issupplied by local government-owned water companies (PDAM).
Audits of a number of PDAMshave found serious problems,including low coverage levels, highlevels of unaccounted-for-water,non-potable water, and severefinancial difficulties due to lowtariffs and mismanagement. Whilethe local councils demand increasedcoverage and improved service,they often do not provide thePDAMs with sufficient resources tobe able to achieve these objectives.
A USAID project assistedPDAMs to break the vicious cycleby developing Corporate Plansfocused on utilizing excess capacity,reducing water losses, increasing
productivity, reducing staffingratios, and enabling tariff increases.
Emphasis on customer serviceis an important part of the plans. Bycommunicating the PDAM’s planfor improving service and focusingon customer service, the PDAMsgained the support of thecommunity, which in turn enabledthe local councils to grant the much-needed tariff increases.
For example, PDAM Banjar inSouth Kalimantan was in poorcondition, with revenues barelycovering out-of-pocket costs, waterlosses reaching 40 percent, andwater provided only 12 hours a day.
A plan was developed to enablethe PDAM to improve services. Butthe success of the plan depended onincreased revenue from tariffs, and
the local council would not approvethe tariff increases. The PDAMtherefore took the plan to thecommunity, explaining theobjectives and why the tariffrevenues were needed. To cementits promises, the PDAM enteredinto a contract with the community,a contract which required realimprovement in customer service.
By gaining the support of thecommunity, the PDAM was able toobtain the tariff increase from thelocal council and has been able todecrease water losses, increasesupply, improve water quality, andre-design their billing and collectionsystem to virtually eliminate longlines and waiting periods.
Source: Parton (2003).
And once the infrastructure is built, stakeholder participation need not end there. Participationcan help ensure service provision remains appropriate to the community’s needs. Box 4.5illustrates the innovative role that community participation has played in water supply inIndonesia.
Community participation may be vital in one more respect. Some kinds of infrastructure frequentbring significant costs to communities that do not enjoy many of the benefits. Power generators,sewerage treatment plants, dams often have to be built in somebody’s back yard. Provision foradequate compensation to affected communities is a generally endorsed principle for allinfrastructure projects of this nature. But ensuring that all costs are compensated, and risksmitigated is difficult even when strong accountability mechanisms are in place. In countries inwhich the governance environment is poor, it is even harder.
Community consultation should always be at the centre of such processes. But official lendersand donors may also have an important role to play. The risk mitigation mechanisms establishedaround the Nam Theun 2 dam project in Lao PDR are one example of how official lenders anddonors have attempted to do this (Box 4.6).

Accountability and Risk Management
135
Box 4.6: Putting accountability mechanisms into large infrastructure projects - Nam Theun 2
Nam Theun 2 (NT2) is a majorhydropower project currently underconsideration in the Lao People’sDemocratic Republic. The projectwould entail investment of $1.2billion, to be undertaken by theprivate sector, 250 km east of theLaotian capital, Vientiane, on theNam Theun River. Its goal is togenerate over 1000 MW ofelectricity, almost all of whichwould be exported to neighboringThailand.
By any scale, the project islarge. In Laotian terms it isenormous – equal to close on thecountry’s current annual GDP. Thereturns of the project to the countryare significant. And Lao PDR hasfew development alternatives.
But the project comes with anumber of important risks, arisingfrom the structure of the investment,
and Lao PDR’s accountabilityenvironment.
The first of these risks –common to major enclaveinvestments in developing countries– is the highly unequal allocation ofcost and benefits. In the case ofNT2, the major benefits of theproject take the form of payments tothe government, arising from its 25percent shareholding in the project,in the form of dividends, androyalties, as well as taxes. The maincosts, however, are carried bycommunities and the environmentin the project area, arising from theconstruction of the dam, theflooding of the Nakai Plateau anddownstream effects associated withthe inter-basin transfer of waterfrom the Nam Theun to the XeBang Fai River
This raises issues both of
equity, and of incentives. Since thegovernment carries limited costs,and enjoys most benefits, itsincentives to intervene in the case ofthose that do carry costs is limited.When those who are most likely tosuffer negative impacts are poor andmarginalized, and whenmechanisms of accountability andparticipation are highly constrained,this becomes all the more so.
The second feature of theproject is the major risk that thesubstantial benefits accruing togovernment will not be effectivelytranslated into benefits for thecountry. While NT2 inflows to thegovernment are likely to account foronly 5 percent of governmentrevenue, their impact onexpenditures has the potential to behighly significant if effectivelytargeted. Projected NT2 revenues tothe government in 2011, adjusted totoday’s prices, are equivalent toapproximately half of domesticallyfinanced expenditure on educationand health.
However, widespreadweaknesses in governance constrainthe ability of Lao PDR tosignificantly address its poordevelopment outcomes. As Figure4.1 shows, Lao PDR’s governanceperformances rates poorly againstaverages for both low-incomeregions, and the region as a whole,particularly on voice andaccountability, and on control ofcorruption. The government’scapacity to channel resources intopoverty reduction is alsoconstrained by one of the leasteffective service deliverymechanisms in the region. Publicexpenditure management remainsboth weak, and highlyuntransparent. The government hasonly recently resumed publicationof the state budget, and the publicfinance management system fails tomeet any of the HIPC benchmarks.
The design of NT2 attempts toaddress these issues in a number of
Figure 4.1. Lao PDR Governance Indicators
0 10 20 30 40 50 60
Control ofCorruption
Rule of Law
RegulatoryQuality
GovernmentEffectiveness
Political Stability
Voice andAccountability
Country Percentile Ranking
Income category average Regional Average Laos
Source: Kaufmann, Kray and Mastruzzi (2003)

Accountability and Risk Management
136
overlapping ways: First, inassigning joint responsibility to theconcessionaire and the government– through provisions written into theconcession agreement – to financeand implement measures tocompensate for impacts and costssuffered in the project area; second,in making changes to the projectdesign to mitigate the risk ofnegative externalities, wherefeasible; third, by bringinginternational financial institutionsinto the financing of the project,effectively making continued donorsupport conditional on thegovernment’s commitment tofulfilling its responsibilities in termsof the concession; and fourth,through the establishment ofmechanisms to earmark projectrevenues for poverty reduction,while improving the public financemanagement system through whichthey – and all expenditure – must bedelivered.
Active participation of theinternational community has helpedencourage local public consultation
and disclosure, to ensure thataffected people are fully informedof the project, and that their viewsare taken into account. Over 200consultations and workshops wereconducted in project-affected areasto ensure that affected people wouldparticipate in the measures toprotect them from the impact of theproject. A total of $89 million hasbeen designated as capital andoperating expenditures forenvironmental and social mitigationand compensation*. Theseobligations are defined, and costedin the concession agreement, whichhas been signed by the governmentand the private sectorconcessionaires.
Mechanisms have also beendeveloped to address weakaccountability arrangements in thepublic finance management system,in particular to facilitate moreeffective and transparent targetingof NT2 revenues towards povertyreduction goals.
Proposed revenue andexpenditure management
arrangements will focus on thedevelopment of the Government’score public expendituremanagement system and will avoidbuilding parallel systems throughwhich to channel NT2 revenues.Under this approach, NT2 revenueswill be channeled through thecentral treasury account to financeexpenditures on eligible povertyreduction and conservationprograms. These programs will berequired to meet management andreporting standards. Expendituresand program impact will bemonitored through a program ofexpenditure reviews andexpenditure tracking surveys. In thisway, the implementation of NT2revenue and expendituremanagement arrangements willsupport broader public expendituremanagement reforms.
* see ADB (2004a), andhttp://www.namtheun2.com for adetailed discussion of theseproposed mechanisms
But outside of this special case, for large-scale network infrastructure, participation is generallybeyond the scope of individual communities, except for the “last kilometer” of the network thatcomes to them: the siting of an electricity substation, the routing of a feeder road, the choice ofcommunity standpipe versus in-house connection, choosing whether to connect to the network atall. At the sector level, the “pull” of accountability needs to be more institutionalized: throughmarkets, regulators and governments. Let’s start with markets.
Competition for accountability
Competitive infrastructure service providers can be held accountable by consumers. If an airline,a jeepney, or a mobile phone company provides an unreliable or expensive service, you goelsewhere.85 That kind of market rewards those who are efficient. This is the short route toaccountability.
85 Competitive markets also tend to hold consumers accountable. Where service providers are monopolists they aresometimes obliged to serve even those customers with bad payments records – in essence, subsidizing them out ofmonopoly profits. In competitive markets, it is harder to impose such an obligation to serve without explicitcompensation. Once compensation is explicit, it is more likely to be targeted to specific types of customer, andother customers face a clearer obligation to pay if they are to continue to receive service.

Accountability and Risk Management
137
Most infrastructure networks cannot feasibly be provided competitively – the economies of scaleare too great – but many infrastructure services provided through those networks can becompetitive. The potential for such competition varies by sector for a combination oftechnological, economic, and political reasons. The “standard model” for harnessing suchcompetition is to unbundle utilities, both horizontally and vertically, and to introduce privatesector participation under conditions of competition where possible. This can take the form offull divestiture of certain assets, but may equally take the form of management contracts, where– for instance – market size in insufficient to allow for unbundling.
In the case of water distribution, for instance, markets tend to be localized and hence small,because the costs of transmitting water over long distances is prohibitive - bulk water costs canincrease by up to 50 percent per 100 km transported, compared with 5 percent for electricity and2.5 percent for gas86.This limits scope for competition in the market, and it’s further limited bythe technical challenges of assuring water quality and safety if different suppliers access thesame network (as well as being limited by availability of a variety of bulk freshwater sources in agiven area). There has been experimentation with third-party access in some developedcountries (as is the case with “inset” appointments in England and Wales87) but so far watersupply competition is rare – although there can still of course be competition for the marketthrough the tendering of concession rights (which is fairly common in East Asia).88
However, in telecommunications, electricity, gas, and most transport services, competition tosupply services over networks is technically much more feasible than in water supply. The lasttwo decades have seen an enormous increase in the prevalence of competition in those sectorsworldwide (see Box 4.7 for a discussion of telecoms in particular). But East Asia has not been inthe forefront of introducing infrastructure service competition. Even in telecommunications,where the technological basis of competition is comparatively straightforward, competition inEast Asia is still limited by international standards (see Figure 4.2).
In electricity, competition is also quite restricted. Indeed, the example of the way thatindependent power producers (IPPs) have been introduced in most East Asian electricity sectors,is illustrative of some of the factors which can limit competition in the region’s infrastructureservices more broadly (Box 4.8).
IPPs have brought private participation to East Asian electricity sectors, but they don’t generallysell power in a competitive market. Instead they usually sell to a state-owned single buyer (oftena transmission company), which then sells the power (as a monopolist) directly to large finalcustomers or to unbundled distribution companies.89 Typically, the IPP sells power under a
86 WRc and Ecologic for the European Commission, 2002. See also Tynan and Kingdom (2005), “Optimal Size forUtilities? Returns to Scale in Water: Evidence from Benchmarking”, Viewpoint.87 The system of “inset appointments” in England and Wales allows large users to choose an alternative licensedsupplier. Inset appointments allow one company to replace another or the statutory service provider for a specifiedgeographical area. For a comprehensive analysis of level of competition in the water sector in European countries,see, for example, WRc and Ecologic for the European Commission (2002), ‘Study on the Application of theCompetition Rules to the Water Sector in the European Community”.88 See Kessides (2004).89 The IPP/single-buyer model obviously allows for competition for the market (through a bidding process for theIPP concession) even it precludes competition in the market. However, under this model, the government generally

Accountability and Risk Management
138
long-term power purchase agreement (PPA), with at least a portion of the payment guaranteed ata pre-determined price regardless of actual demand (so-called “take-or-pay” provisions).90
Figure 4.2: Full competition in telecommunications remains rare in East Asia(International Voice Communications, 2003)
Monopoly Partial Competition Full Competition No data
Source: World Bank staff
Why have East Asian countries chosen to impose a single buyer (which is simultaneously asingle seller) between the IPP generators and the customers? One common reason is that thesingle buyer can facilitate the introduction of private finance for generation quickly whencapacity shortages are looming91 This was the principal reason for using the single-buyer/IPPmodel in the Philippines, Indonesia, Thailand and elsewhere in the region. Private financingmay be wanted to bring efficiency in design, construction or operation – or simply to relieve theimmediate burden on the public purse (and sometimes just to hide the burden on the publicpurse). Another objective for keeping single buyers has been to extract monopoly rent forpolitical or personal gain. A further reason has been a feeling that national control over strategicinfrastructure assets can be politically important (particularly when there is foreign investmentinvolved in generation).
decides significant aspects of the technical specifications in an IPP bidding process, often including the type of fuel,which to some extent limits the impact of competition for the market .90 Usually, the sector structure prior to the introduction of the IPPs was a vertically integrated state-ownedmonopoly. The single buyer frequently retains some generation capacity also.91 Electricity grids need a central operator to coordinate system balancing, reliability and ancillary services, andoperating cultures cannot easily change overnight from the one prevailing in a vertically-integrated utility.Unbundling those operational functions from the control over generation can therefore take time. IPPs can be atransitional step.

Accountability and Risk Management
139
Box 4.7: Technology, competition and regulation – the push and pull of accountability in the telecomssector
The interaction between technology,markets and sound regulation is atthe heart of the recenttransformation of the telecomsindustry across the world.
This is the push-and-pull ofaccountability at its best, asregulators ensure that the levers oftechnology and market forces areexploited by private operators to thebenefit of consumers, and marketsin turn allow consumers to join withregulators in holding privateoperators accountable.
Technology has been thecatalyzing force. As technology haslowered barriers to entry, previouslyunprofitable sectors have beentransformed, new markets haveopened, both in turn increasingcompetition, and spurring thedevelopment of yet more innovativebusiness solutions and service.
Market forces have helped holdservice providers accountable –competition has forced carriers totailor services to the needs of theusers, inducing operators, forexample, to offer bundled free voice
calls and value-added services. InChina and Thailand, it has driventhe trend towards bundling of fixedand wireless services, and is likelyto promote industry convergence, asnew business models replace old.
Among the most importantimplications: New possibilities foruniversal services. Cellular mobilepenetration in rural areas has forcedpolicy-makers to broaden theconcept of universal access,originally conceived for fixed linetelephony, to include substituteproducts.
The interplay between market-based mechanisms and technologyinnovation has proved to be muchmore successful in connecting newusers than the traditional businessmodel, based on an incumbentmonopoly service provider. Withthe introduction of pre-paidtechnology, the mobile operators inCambodia, China, Thailand and thePhilippines are now competing forbusiness in rural villages previouslyuneconomic to serve.
Regulation has a crucial role toplay at the interface betweentechnology and market forces. Itsrole: to facilitate marketliberalization and technologydiffusion, and provide a levelplaying field for incumbent serviceproviders and new entrants. On theone hand this means technology-neutrality: allowing thedevelopment of new technologies,like VoiP, and resisting pressures toprotect incumbent business models,based on outmoded technology.Ensuring that subsidies can befunded in a competition-neutralmanner is equally important:Imposing uniform pricing onuniversal service providers onequity grounds (regardless of costdifferentials) has proved an obstacleto market liberalization, as the mostprofitable segments of the marketare competed away by new entrants,leaving universal service providerswith the loss-making sections of thecustomer base.
Source: Ure (2004).
And a fourth – and very powerful objective – is that a single buyer can easily cross-subsidize. InIndonesia, for example, the state electricity utility, PLN, maintains explicit subsidies betweenlarge and small consumers. At one end of the range, a small residential consumer with a 450VAconnection and consumption of 50 kWh per month currently pays US 3.5 cents per kWh, while alarge residential consumer with a connected capacity of 16,500VA and monthly consumption of2,000 kWh per month pays approximately 10.1 cents per kWh (World Bank 2004a).
Cross-subsidies can be very important for social or political reasons (as we shall discuss in moredetail later). Single buyers can retain creditworthy customers, who might be lured away byprivate generators if competition were possible. Competition therefore makes it difficult for lesscreditworthy customers to be cross-subsidized. Or indeed for the state utility to “cross-subsidize”its own excessive costs.
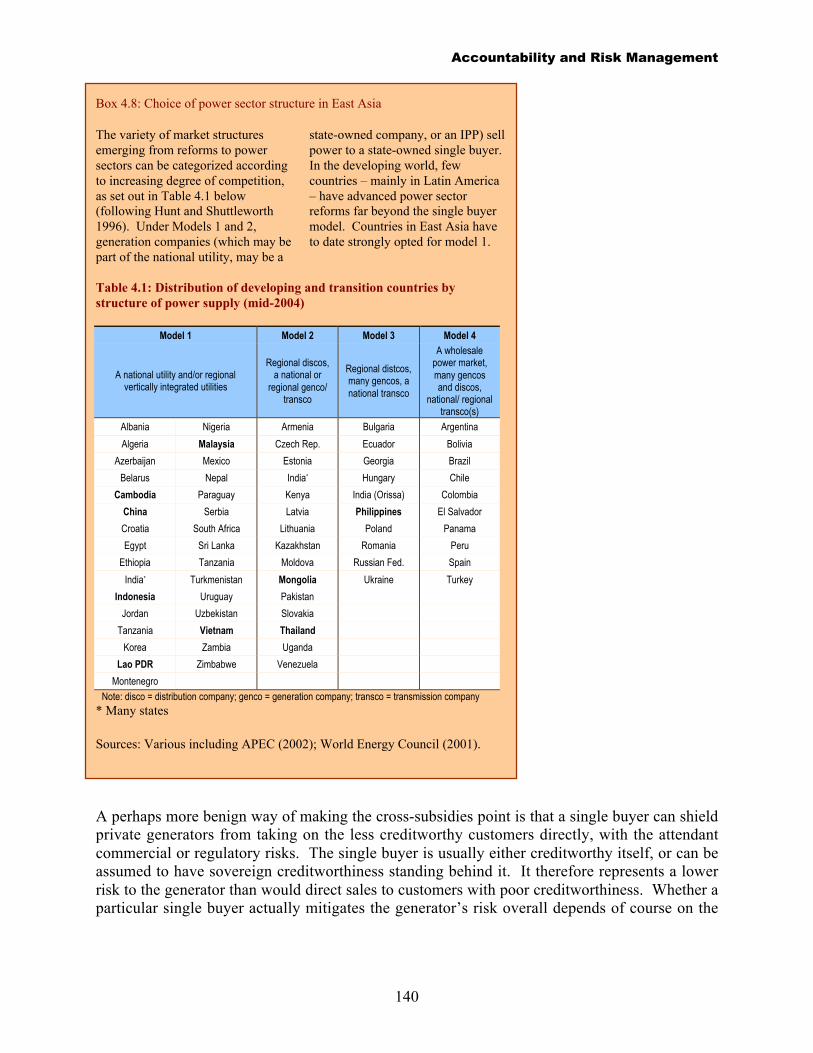
Accountability and Risk Management
140
Box 4.8: Choice of power sector structure in East Asia
The variety of market structuresemerging from reforms to powersectors can be categorized accordingto increasing degree of competition,as set out in Table 4.1 below(following Hunt and Shuttleworth1996). Under Models 1 and 2,generation companies (which may bepart of the national utility, may be a
state-owned company, or an IPP) sellpower to a state-owned single buyer.In the developing world, fewcountries – mainly in Latin America– have advanced power sectorreforms far beyond the single buyermodel. Countries in East Asia haveto date strongly opted for model 1.
Table 4.1: Distribution of developing and transition countries bystructure of power supply (mid-2004)
Model 1 Model 2 Model 3 Model 4
A national utility and/or regionalvertically integrated utilities
Regional discos,a national or
regional genco/transco
Regional distcos,many gencos, anational transco
A wholesalepower market,many gencosand discos,
national/ regionaltransco(s)
Albania Nigeria Armenia Bulgaria Argentina
Algeria Malaysia Czech Rep. Ecuador Bolivia
Azerbaijan Mexico Estonia Georgia Brazil
Belarus Nepal India* Hungary Chile
Cambodia Paraguay Kenya India (Orissa) Colombia
China Serbia Latvia Philippines El Salvador
Croatia South Africa Lithuania Poland Panama
Egypt Sri Lanka Kazakhstan Romania Peru
Ethiopia Tanzania Moldova Russian Fed. Spain
India* Turkmenistan Mongolia Ukraine Turkey
Indonesia Uruguay Pakistan
Jordan Uzbekistan Slovakia
Tanzania Vietnam Thailand
Korea Zambia Uganda
Lao PDR Zimbabwe Venezuela
Montenegro
Note: disco = distribution company; genco = generation company; transco = transmission company* Many states
Sources: Various including APEC (2002); World Energy Council (2001).
A perhaps more benign way of making the cross-subsidies point is that a single buyer can shieldprivate generators from taking on the less creditworthy customers directly, with the attendantcommercial or regulatory risks. The single buyer is usually either creditworthy itself, or can beassumed to have sovereign creditworthiness standing behind it. It therefore represents a lowerrisk to the generator than would direct sales to customers with poor creditworthiness. Whether aparticular single buyer actually mitigates the generator’s risk overall depends of course on the
Accountability and Risk Management
141
preponderance of bad customers over good, and on the reliability of the single buyer as acustomer itself.92 This is clearly very country-specific.93
However, one thing is universal about the single buyer model: it loses much of the accountabilityfor performance that comes from competition. This is relevant well beyond the electricity sector– competition has been limited in other infrastructure sectors for some of the same reasons as ithas in the IPP case. Namely, cross-subsidies for sociopolitical objectives, monopoly rent-seeking, the protection of incumbent state enterprises, risk mitigation for the private sector, andthe political control of strategic assets. In essence, the policy coordination challenge is how toachieve accountability when competition competes with these other objectives.
Regulators for accountability
Where the invisible hand of competition does not reach, regulation will generally be needed tobring accountability to infrastructure service providers. There is a rich literature on infrastructureregulation, but our purpose in this section is specific: to clarify for what regulators are trying tohold service providers accountable, how regulators can get held accountable themselves, andhow all this fits into the East Asian political context.
It is sometimes said that while making service providers accountable, the regulator needs toprotect their interests in parallel with those of consumers, in order to minimize regulatory risk forinvestors. But this is rather misleading. As we saw in Chapter 1, infrastructure is ultimately paidfor by consumers or taxpayers. Regulators can certainly affect the risks of investing ininfrastructure service provision, but if they increase the risk, the cost of capital increases, and it’sthe consumers or taxpayers who pay for it. So the regulator’s role is really to serve the interestsof consumers and taxpayers - and try to hold service providers accountable for providing theservice the consumers and taxpayers want.94 Minimizing regulatory risk is just one key way offulfilling that role.95
92 It is worth noting that single buyers create their own significant risks for generators. If a generator has no choicebut to sell power to the single buyer, it faces a risk of contract abrogation with no escape to other purchasers. Thishelps explain the length and broad scope of take-or-pay PPAs involving single buyers, as well as the sometimes highprices under such contracts. Unfortunately, long-term PPAs covering a substantial portion of generated power in asystem, make it difficult to move later to a competitive market model without expensive compensation of pre-existing contracts.93 See Kessides (2004) and Hunt and Shuttleworth (1996) for a comprehensive discussion of the merits and demeritsof the single-buyer model.94 Of course, this can also involve regulators holding individual consumers accountable, so that their actions don’tnegatively impact other consumers (e.g. allowing service providers to take action against non-paying customers sothat paying customers don’t have to cross-subsidize them).95 The basic analysis of this section applies whether investors are public or private. However, holding publicly-owned infrastructure service providers accountable for performance is generally more difficult than doing so forprivate providers, whether through regulation, competition or other means.
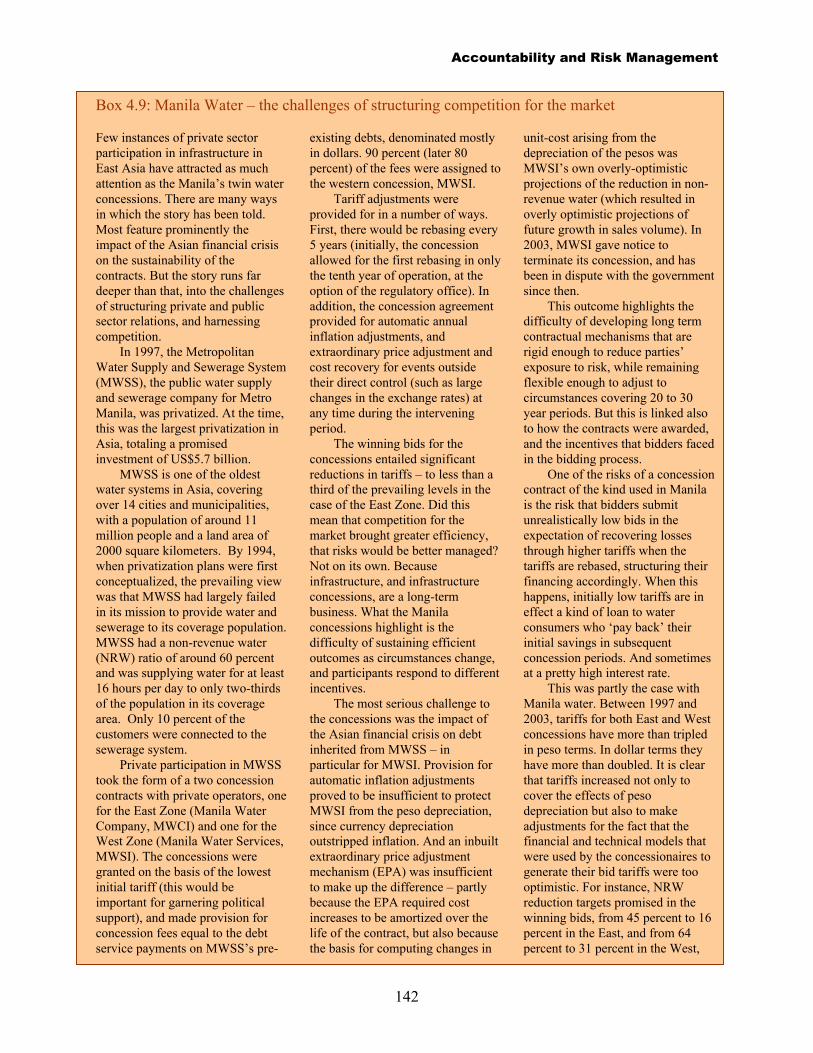
Accountability and Risk Management
142
Box 4.9: Manila Water – the challenges of structuring competition for the market
Few instances of private sectorparticipation in infrastructure inEast Asia have attracted as muchattention as the Manila’s twin waterconcessions. There are many waysin which the story has been told.Most feature prominently theimpact of the Asian financial crisison the sustainability of thecontracts. But the story runs fardeeper than that, into the challengesof structuring private and publicsector relations, and harnessingcompetition.
In 1997, the MetropolitanWater Supply and Sewerage System(MWSS), the public water supplyand sewerage company for MetroManila, was privatized. At the time,this was the largest privatization inAsia, totaling a promisedinvestment of US$5.7 billion.
MWSS is one of the oldestwater systems in Asia, coveringover 14 cities and municipalities,with a population of around 11million people and a land area of2000 square kilometers. By 1994,when privatization plans were firstconceptualized, the prevailing viewwas that MWSS had largely failedin its mission to provide water andsewerage to its coverage population.MWSS had a non-revenue water(NRW) ratio of around 60 percentand was supplying water for at least16 hours per day to only two-thirdsof the population in its coveragearea. Only 10 percent of thecustomers were connected to thesewerage system.
Private participation in MWSStook the form of a two concessioncontracts with private operators, onefor the East Zone (Manila WaterCompany, MWCI) and one for theWest Zone (Manila Water Services,MWSI). The concessions weregranted on the basis of the lowestinitial tariff (this would beimportant for garnering politicalsupport), and made provision forconcession fees equal to the debtservice payments on MWSS’s pre-
existing debts, denominated mostlyin dollars. 90 percent (later 80percent) of the fees were assigned tothe western concession, MWSI.
Tariff adjustments wereprovided for in a number of ways.First, there would be rebasing every5 years (initially, the concessionallowed for the first rebasing in onlythe tenth year of operation, at theoption of the regulatory office). Inaddition, the concession agreementprovided for automatic annualinflation adjustments, andextraordinary price adjustment andcost recovery for events outsidetheir direct control (such as largechanges in the exchange rates) atany time during the interveningperiod.
The winning bids for theconcessions entailed significantreductions in tariffs – to less than athird of the prevailing levels in thecase of the East Zone. Did thismean that competition for themarket brought greater efficiency,that risks would be better managed?Not on its own. Becauseinfrastructure, and infrastructureconcessions, are a long-termbusiness. What the Manilaconcessions highlight is thedifficulty of sustaining efficientoutcomes as circumstances change,and participants respond to differentincentives.
The most serious challenge tothe concessions was the impact ofthe Asian financial crisis on debtinherited from MWSS – inparticular for MWSI. Provision forautomatic inflation adjustmentsproved to be insufficient to protectMWSI from the peso depreciation,since currency depreciationoutstripped inflation. And an inbuiltextraordinary price adjustmentmechanism (EPA) was insufficientto make up the difference – partlybecause the EPA required costincreases to be amortized over thelife of the contract, but also becausethe basis for computing changes in
unit-cost arising from thedepreciation of the pesos wasMWSI’s own overly-optimisticprojections of the reduction in non-revenue water (which resulted inoverly optimistic projections offuture growth in sales volume). In2003, MWSI gave notice toterminate its concession, and hasbeen in dispute with the governmentsince then.
This outcome highlights thedifficulty of developing long termcontractual mechanisms that arerigid enough to reduce parties’exposure to risk, while remainingflexible enough to adjust tocircumstances covering 20 to 30year periods. But this is linked alsoto how the contracts were awarded,and the incentives that bidders facedin the bidding process.
One of the risks of a concessioncontract of the kind used in Manilais the risk that bidders submitunrealistically low bids in theexpectation of recovering lossesthrough higher tariffs when thetariffs are rebased, structuring theirfinancing accordingly. When thishappens, initially low tariffs are ineffect a kind of loan to waterconsumers who ‘pay back’ theirinitial savings in subsequentconcession periods. And sometimesat a pretty high interest rate.
This was partly the case withManila water. Between 1997 and2003, tariffs for both East and Westconcessions have more than tripledin peso terms. In dollar terms theyhave more than doubled. It is clearthat tariffs increased not only tocover the effects of pesodepreciation but also to makeadjustments for the fact that thefinancial and technical models thatwere used by the concessionaires togenerate their bid tariffs were toooptimistic. For instance, NRWreduction targets promised in thewinning bids, from 45 percent to 16percent in the East, and from 64percent to 31 percent in the West,
Accountability and Risk Management
143
proved highly over-optimistic.NRW levels in both east and westzones have in fact hovered in theregion of 57 percent.
This was partly a fault of theconcession design. The concessionhad not in fact specified penaltiesfor NRW reduction shortfalls, as thedesigners thought that failure toachieve NRW targets by itselfwould be sufficient penalty, sinceconcessionaires would have to bringmore equity to the concessions,
especially if lenders refused tofinance the shortfall due toinsufficient NRW outcomes.
Did the concessions bring aboutvalue for money? In terms of newconnections, improvement of waterpressure, and the number ofhouseholds enjoying at least 16hours of water supply per day, bothconcessions have performed muchbetter than MWSS beforeprivatization. Coverage, forinstance, increased to 75 percent by
2002, from 61 percent in 1996. Butthese outcomes do not match thehigh expectations raised by privateparticipation. And those who haveto pay more for water may protestmore loudly than those with newconnections or improved servicepraise the concessionaires.
Source: JBIC (2003); Castalia(2004c); and Medalla (2004).
But how does the regulator get held accountable itself? Well, there are a number of classicmeasures that can help96. Some relate to process and participation: Writing statutes that clearlyspecify the rights and responsibilities of the regulator, and how to prioritize when there aremultiple objectives. Allowing judicial review or effective arbitration of regulatory decisions.Requiring the production of annual reports, and subjecting the performance of the regulator toindependent audit or parliamentary review. Meritocratic appointment and removal of regulators.Allowing stakeholder submissions on issues under review.
Others relate to transparency: Requiring regulators to publish decisions (and the reasoningbehind the decisions), as well as licenses and benchmarked performance of regulated serviceproviders. The Indonesian Water Supply Association (PERPAMSI), for instance, benchmarksand reports on 29 indicators, with information made available to the public on its website. (seeBox 4.10 for how this plays out in East Asia as a whole). Mechanisms are also needed to allowconsumers’ and potential consumers’ voices to be heard in policy and regulatory decisions. Andso in the Philippines, for instance, tariff hearings are public, and customers are allowed to speakand ask questions.97 These issues are taken up further in Spotlight 2 of this chapter, on consumerparticipation in regulation.
But infrastructure is intensely political, and the accountability of the regulator therefore cannotbe divorced from broader institutions of political accountability. Nor can the ability of theregulator to hold service providers accountable be separated from the political context. To somereaders these will seem like rather radical statements. In the last two decades, much energy hadbeen expended in the developed and developing worlds in pursuit of independence for regulators.This has been based on a view that infrastructure regulation should be depoliticized.
There is much value in this argument, and in the pursuit of independence, political interventionin infrastructure can often be damaging, particularly if it is short-termist. But independence is arelative concept. Many countries find their sovereign independence to be evolutionary ratherthan absolute, and many countries struggle to create a separation of powers in their basic political
96 See, for example, Kessides (2004).97 Castalia (2004x)

Accountability and Risk Management
144
institutions. So it’s not too surprising that independence for infrastructure regulators would taketime.
And it is indeed taking time. In the words of one recent paper, “Most new regulators indeveloping countries, when asked whether they have the independence provided for in law, willeither say ‘no’ or avert their glance and change the subject.” (Bakovic, Tenenbaum, and Woolf2003). In the words of another, “The label ‘independent’ is somewhat exaggerated when appliedto new regulators in developing and transition economies.” (Kessides 2004).
Box 4.10: Holding Regulators accountable throughtransparency
The results of the recent survey of EAP regulators suggeststhat around two-third of the surveyed regulators in the EAPregion disclose procedures and decisions, while half of theregulators also release to the public performance indicators ofregulated service providers. However, licenses and contractswith private service providers are still kept confidential by themajority of the regulating entities.
Figure 4.3: Measures to enhance transparency
42%47%
71%
0
20
40
60
80
Disclose procedures
and decisions
Disclose
benchmarked
performance of
service operators
Disclose licenses and
contracts
Question: ‘Which actions does your agency take to ensure thepromotion of consumer awareness?’ Multiple-answersallowed.
Source: Muzzini (2004).
East Asia is certainly no exception – which is unsurprising given its tradition of strong centralcontrol. “Independence” is obviously hard to measure in a comparable manner, but in the survey
Accountability and Risk Management
145
of East Asian regulators discussed in Spotlight 2 of this chapter less than 40 percent describedthemselves as even nominally independent.
So how can the design of regulatory institutions accommodate the evolutionary nature ofindependence? One basic method is to ensure that the degree of discretion allowed to theregulator does not exceed what the political culture can absorb. This implies that fledglingregulators should have relatively limited discretionary powers, and that discretion should buildover time. A key example is that regulators could start out with multi-year tariff-setting systemsin which tariffs are set by specific formulae in the first few years, and according to more generalprinciples in later years.
Another example is that regulation for specific service providers could be established byconcession contract negotiated between the investors and the government (according toprinciples and parameters laid down in generally-applicable legislation). The day-to-dayapplication of the contract would be delegated to the regulator. A third example is that keyaspects of regulation could initially be contracted out to third-party expertise, enhancing thecredibility of regulatory decisions, until such time as greater discretion can be allowed (see Box4.11).
We saw in Chapter 1 that the infrastructure investor perceptions survey conducted for this studyshowed that investor interest in the region was strong, but heavily contingent on reducing policy-based risk. That survey found that predictability of regulation was a major cause for concern inthe region, and a significant determinant of actual investment. Respondents rarely talked about aneed for regulators to be independent, and they often argued that predictable regulation requiredexplicit agreements with political authorities in the East Asia region (and showed acorresponding lack of faith in independent regulation or judicial review).98 In essence,respondents acknowledged the coordination role of the East Asian state that we discussed inChapter 3. Indeed, respondents showed a marked preference for investing in countries whichhave strong strategic vision about infrastructure.
This survey response can be interpreted in various ways, but one key theme emerges: investorswant predictability, and predictability in East Asia may not require initially high levels ofindependence for regulators. Indeed, an evolutionary approach to the discretionary power ofindependent regulators seems appropriate. If discretion exceeds political absorption capacities atany point in time a political backlash is likely (e.g. the head of state overturns a regulator’s tariffincrease); conversely, if regulators’ discretion does not grow as the ability of governments toexercise top-down control declines, a regulatory vacuum could emerge. Discretion that growsover time, and liberates itself progressively from political pressures, could enhance predictability(see Figure 4.4 for an illustration).
98 East Asia and Pacific Private Investors in Infrastructure Perception Survey (2004), which can be found athttp://www.worldbank.org/eapinfrastructure.

Accountability and Risk Management
146
Box 4.11: Contracting out regulatory functions
Contracting out regulatory functionsis a well-established practice ininfrastructure sectors of bothdeveloping and developedcountries. Regulators can outsourcetechnical tasks, specific regulatorydecisions or the whole regulatoryprocess. Contracting outarrangements can be built in theinstitutional framework, as it isoften the case when contracted-outrecommendations are binding, orpursued on ad-hoc basis. Theexternal contracted agency mayconsist of individual consultants,government agencies (at thenational or regional level) or NGOs.
The rationale for seekingexternal advice or contracting outregulatory decisions varies to asignificant extent according to thelocal context as well as the stage ofthe life of the regulatory agency.Experienced regulators tend tooutsource specific regulatoryfunctions (albeit retaining decision-making responsibilities) to reducecosts and bridge the informationasymmetry between the regulatorand service providers. For example,the energy regulator in the UK,Ofgem, employs contractors toconduct independent audits ofregulated companies and monitortheir compliance with qualitytargets. Nascent regulators maydecide to contract out bindingregulatory functions in order toleverage the international expertiserequired to gain regulatorycredibility vis-à-vis privateoperators. For example in 1998 thenewly-established BucharestAgency for Water and SewerageRegulation (ARBAC) appointed apanel of experts to conduct the tariffreview; in 1996, the PalestinianWater Authority (PWA) relied onthird-party technical and financialaudit to review on an annual basisthe performance-based managementfee for the first water utilitymanagement contract in Gaza. The
practice of contracting out is morewidespread in the water sector,where most regulators are set up atthe local level and have limitedregulatory capacity, and in thetelecommunication sector, whereregulators need to be kept abreast ofa rapidly evolving environment.
The practice of contracting outregulatory decision-making toregional institutions can yieldsignificant benefits for very smallcountries, where scarcity oftechnical skills may make itefficient to limit the number ofregulatory agencies. In such acontext, a regional regulatoryagency might be in a better positionthan small national regulatorybodies to build the critical mass ofregulatory capacity required toensure legitimacy of regulatorydecisions. For example, the EasternCaribbean TelecommunicationAuthority (ECTEL) serves themember countries of theOrganization of the EasternCaribbean States as a sharedregulatory body. ECTEL’s mandateis to coordinate regionaltelecommunication policies inaddition to providing advice andsupport to national regulatoryagencies.
Similarly, there is merit inadopting a regional regulatoryapproach when infrastructureregulation affects inter- and intra-regional trade, resulting inadditional transaction costs foroperators. For instance, nationaltransportation safety regulationsmay conflict with each other andhence limit or distort opportunitiesfor trade. In such a context, there isa clear economic argument fornational regulators to relinquishpartially their regulatory jurisdictionto super-national entities betterplaced to promote standardharmonization. There may be forinstance a rationale for setting up aregional transport regulator in the
Pacific Islands, which are part of thesame trade area. A number ofPacific Islands have been moving inthis direction by exploring thepossibility of establishing a regionalaviation safety authority, the PacificAviation Safety Office (PASO).This would be responsible forsetting and ensuring compliancewith standards of safety and securityin the aviation and airport sectoracross member countries.
However, several challengesarise when regulatory decision-making is contracted out. In the firstplace, contracting out regulatorydecisions can weaken theaccountability of the regulator vis-à-vis the local consumer constituency.To avoid loss of accountability,national regulators need to maintainsufficient in-house regulatorycapacity to monitor the contractperformance and ensure thetransparency of the contracting outprocess. Contracting out coreregulatory decisions is often apolitically sensitive decision, asgovernments may be reluctant tosurrender their sovereign regulatoryauthority on contentious issues(such as tariff reviews). Forexample, ECTEL is not authorizedto impinge on member countries’authority to issue licenses tooperators, although disputes can bereferred to ECTEL for mediation.
Overall, contracting outregulatory functions to third-partyagencies appears to be an effectiveinstrument to strengthen thelegitimacy and capacity of nascentregulators as well as promotestandard harmonization and regionalcoordination among nationalregulatory bodies, provided that it isaccompanied by transparency andaccountability mechanisms andthere is enough politicalcommitment to move forward withinfrastructure reforms.

Accountability and Risk Management
147
Figure 4.4: Independent regulators: predictability and discretion
Risk sharing, accountability and managing government support
We have talked about the various ways in which accountability can be brought into the provisionof infrastructure services, and how risk can be managed. We looked at the roles of communities,regulators, and competition, in respect of the relationship between service providers andconsumers. In the last part of this chapter we look at the role of government, and in particular, athow accountability can be brought into the manner in which it shares risks with infrastructureproviders in the delivery of services.
When governments delegate service provision, they typically do it under some kind of risk-sharing arrangement. Often this involves government support, and most frequently, in the formof subsidies or guarantees. By providing this support, the government effectively reduces the riskexposure of service providers (or their financiers) by some corresponding amount, becausehigher tariffs would have entailed greater political or market.
Risk-sharing arrangements of this kind are often crucial to delegation of service provision, but itraises important accountability challenges. Subsidizing the provision of services weakens theaccountability relationships that binds providers and governments (and through them toconsumers and tax-payers) by weakening the incentive to provide services in the most efficientmanner possible. In the remainder of this chapter we highlight these issues, and set out whatgovernments can do about it.
Predictability
Discretion
t
t+1
t+2

Accountability and Risk Management
148
Subsidies, accountability and risk management
Infrastructure is riddled with subsidies. Some subsidies are obvious, some are hidden. Someprotect the poor, some benefit the well-off. Some damage the environment, and some improveit. Some were created by policy, and others are there by accident. There are perhaps only twothings we can say with any certainty about infrastructure subsidies: they are often necessary andthey are always risky.
Subsidies can be needed for a variety of reasons. Perhaps the least controversial of reasons arethe objectives of environmental protection and poverty reduction. Sometimes people are unableto pay for services. Other times they’re unwilling to pay. People typically won’t pay the fullsocial value of sanitation services, because they can easily free ride on the environmental healthbenefits. An individual’s risk of ill-health is much more affected by everyone else’s behavior asregards sanitation, than by his/her own behavior. Mass rapid transit passengers often won’t paythe full value of the service, because the benefits of reduced traffic congestion and pollution arediffuse. When renewable energy is more expensive than fossil fuels, as is often the case, mostconsumers won’t voluntarily pay more, even if they worry about the risk of climate change. Acase can be made for subsidies on environmental protection grounds.
The best subsidy scheme for poverty reduction would of course not target infrastructurespecifically, but would raise the incomes of the poor so that they could afford the basic goodsand services they choose to consume. The reality however is that general social safety nets areoften not feasible, at least in the near term, and targeted subsidies are then the best availableoption. Where infrastructure is a high priority for poverty reduction, it could be a high priorityfor subsidies. Water, sanitation, rural roads are oft-quoted examples. One important criterion forgranting subsidies is not just whether the subsidy raises the disposable income of the poor butalso whether it reduces the volatility of their disposable income. In other words, does thesubsidy provide protective security and reduce the risk of the poor getting even poorer?
And so to a controversial reason for subsidies: politics. Nobody has done a comprehensiveglobal calculation but it is almost certain that the majority of subsidies go to the relatively well-off not to the poor. For the very obvious reason that the well-off have more political influence.But should policymakers always strive to remove subsidies to the well-off in order to free upresources for the poor?
Well, what if a water sector reform in a particular country would increase access for the poor, butthe urban middle classes might resist the reform if their subsidies are removed? A very stronggovernment might forge ahead and remove the subsidies anyway. A more risk-aversegovernment might consider it preferable to maintain the subsidies at least for a while,particularly if the reform will eventually bring benefits to that middle class (e.g. more reliablewater supply after investments have been made). Transitional subsidies for political reasons canbe justified sometimes. And it’s probably desirable to be transparent about the justification.

Accountability and Risk Management
149
But subsidies are risky for a very well-known reason: they can be addictive. The more you get,the more you ask for. They blur accountability, because they undermine the financial disciplineof the service provider through which they are channeled. It is very hard to maintain effectiveperformance in the presence of subsidies, and therefore hard to achieve even the very objectivesof those subsidies. So how to re-inject accountability into subsidies?
One area to focus on is of course the origin of the problem: higher costs than we think people canafford or want to pay. Can we use regulated service standards and technology to bring costsdown? – as we see, for instance, in Manila’s Bayan Tubig water-delivery program, whereappropriate technology standards have helped to reduce water costs by up to 25 percent indensely populated slum-areas (source: World Bank 2003d).
Can we use competition, either in the market or for the subsidies (e.g. bidders for aninfrastructure concession being evaluated according to who asks for the lowest subsidy)? –commonly the case in transport services.
And perhaps most difficult of all, can public enterprise reform help reduce financial losses, as inthe case of the Phom Penh Water Supply Authority, where the successful top-down turnaroundof the company help boost revenues to cost-recovery levels (see Box 4.13)?
If we’ve worked on the cost side, what can we do to minimize the subsidies directly? Can wemake them transparent so that they are more likely to be subject to overall budget prioritization?This is the approach China is taking, in setting out of water and waste-water tariff adjustmentprograms over specified time-frames (Castalia 2004c).
Box 4.12: Bidding for subsidies inFiji
In Fiji, the main island routes are open tocompetition and in 1997 a franchisingscheme was introduced for outer islandsshipping where competition is limited.Under this scheme, the Governmentdefines a minimum service level forshipping to inadequately served areas andspecifies maximum freight rates in thefranchise tender documents. Operatorssubmit tenders on the basis of the subsidythey would require to operate theseservices. The service provider requiringthe least subsidy gets the contract.
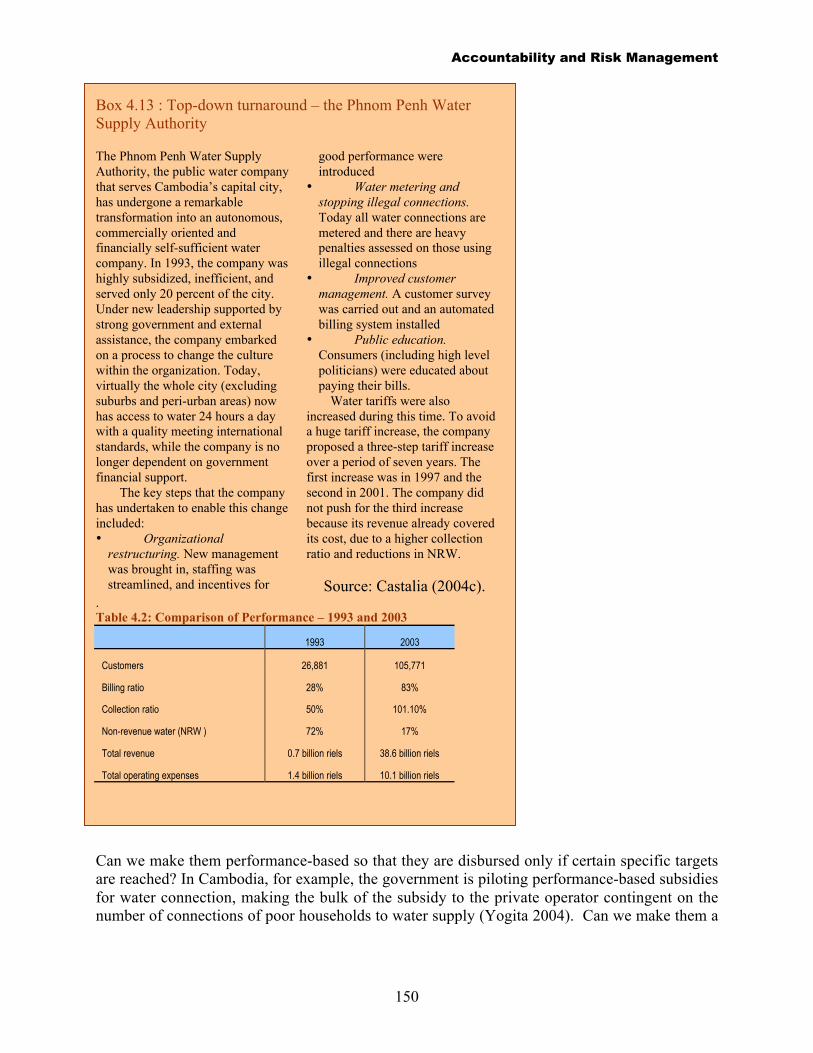
Accountability and Risk Management
150
Box 4.13 : Top-down turnaround – the Phnom Penh WaterSupply Authority
The Phnom Penh Water SupplyAuthority, the public water companythat serves Cambodia’s capital city,has undergone a remarkabletransformation into an autonomous,commercially oriented andfinancially self-sufficient watercompany. In 1993, the company washighly subsidized, inefficient, andserved only 20 percent of the city.Under new leadership supported bystrong government and externalassistance, the company embarkedon a process to change the culturewithin the organization. Today,virtually the whole city (excludingsuburbs and peri-urban areas) nowhas access to water 24 hours a daywith a quality meeting internationalstandards, while the company is nolonger dependent on governmentfinancial support.
The key steps that the companyhas undertaken to enable this changeincluded:• Organizational
restructuring. New managementwas brought in, staffing wasstreamlined, and incentives for
good performance wereintroduced
• Water metering andstopping illegal connections.Today all water connections aremetered and there are heavypenalties assessed on those usingillegal connections
• Improved customermanagement. A customer surveywas carried out and an automatedbilling system installed
• Public education.Consumers (including high levelpoliticians) were educated aboutpaying their bills.
Water tariffs were alsoincreased during this time. To avoida huge tariff increase, the companyproposed a three-step tariff increaseover a period of seven years. Thefirst increase was in 1997 and thesecond in 2001. The company didnot push for the third increasebecause its revenue already coveredits cost, due to a higher collectionratio and reductions in NRW.
Source: Castalia (2004c)..Table 4.2: Comparison of Performance – 1993 and 2003
1993 2003
Customers 26,881 105,771
Billing ratio 28% 83%
Collection ratio 50% 101.10%
Non-revenue water (NRW ) 72% 17%
Total revenue 0.7 billion riels 38.6 billion riels
Total operating expenses 1.4 billion riels 10.1 billion riels
Can we make them performance-based so that they are disbursed only if certain specific targetsare reached? In Cambodia, for example, the government is piloting performance-based subsidiesfor water connection, making the bulk of the subsidy to the private operator contingent on thenumber of connections of poor households to water supply (Yogita 2004). Can we make them a
Accountability and Risk Management
151
one-off payment, to minimize the risk that the subsidy tap remains open?99 Or can we adjusttaxes or subsidies on competing services so as to cut the subsidy requirement on this one (e.g.reduce fuel subsidies/increase fuel taxation in order to increase MRT ridership)?
A further option for injecting accountability into subsidies might be to design cross-subsidiesrather than direct ones. Sometimes there are enough consumers able and willing to pay abovethe price which covers average costs and so subsidize those whom we want to charge less thancost. The accountability of the bottom line can thereby be preserved.
One advantage cross-subsidies can have over direct subsidies is they minimize subsidy risk, i.e.the risk that investments will be made contingent on an expected subsidy flow that actually getsinterrupted. If there is a significant risk that subsidy policy will be poorly coordinated withpolicy on service delivery, it might perhaps be preferable for the two policies to be made by oneagency – the service provider (or a regulator).100
Cross-subsidies can also minimize another risk, namely that givers of direct subsidies (e.g.ministries of finance) and regulators of tariffs may find it difficult to coordinate policies. Aregulator may prefer to tacitly encourage higher subsidies rather than approve higher tariffs;tariffs make the regulator unpopular, while another agency is accountable for subsidies. For thesubsidy-giver, the incentives are reversed. Coordination could be difficult (and it could perhapsbe more difficult if the regulator is independent). Box 4.1 gives an interesting example from thePhilippines, where poor coordination passed on the cost of electricity provision from consumersto tax payers.
However, cross-subsidies come at a cost. They can overtax certain consumers (e.g. highelectricity tariffs charged to industry, which in effect taxes employment). They are often nottransparent (and may sometimes encounter resistance to pay if they are), and they escapebudgetary prioritization. And, as we saw above for IPPs, they can make it difficult to introducecompetition. So we might gain one accountability instrument only at the expense of another(probably better) one. Indeed, it might be preferable to institute competition, and compensatewith direct subsidies those who lose the benefit of cross-subsidies. Overall, accountability couldbe substantially increased.
Contingent liabilities, accountability and risk management
In addition to subsidies, there are other forms of fiscal support that share risk, but which are lessdirect – power-purchase obligations in the Philippines, for instance, or Thai government backingfor borrowing of the state railways. Table 4.3 summarizes some of the most common in EastAsia. This kind of fiscal support raises perhaps even more difficult accountability issues,
99 Subsidies paid per connection, or capital grants made to service providers, are examples of one-off payments.Connection subsidies are one type of performance-based subsidy, and are an important example of measuringperformance by clearly-defined outputs. The funding by donors of subsidies contingent on delivery of outputs hasrecently become known as output-based aid (OBA), although the term is also used to cover other performance-basedsubsidies (including those not funded by aid).100 There are other ways to minimize subsidy risk, including disbursing subsidies into escrow accounts or trustfunds, contracts with private providers, or involving an external donor such as through an OBA scheme.
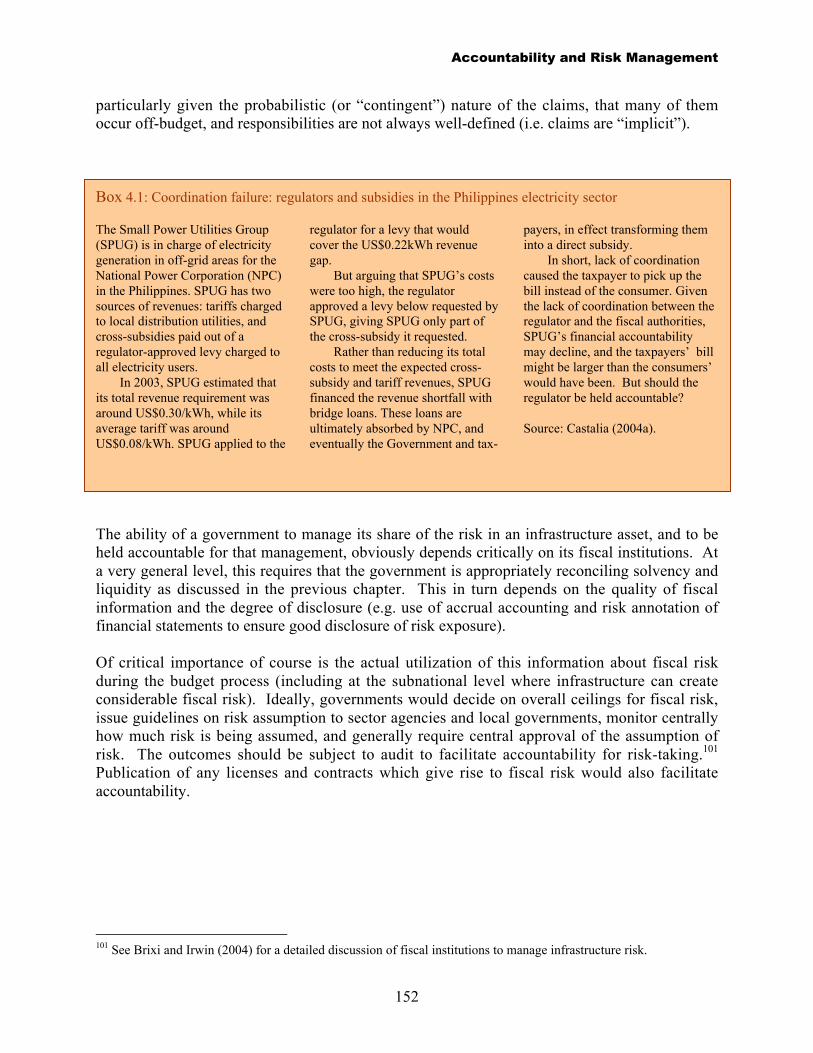
Accountability and Risk Management
152
particularly given the probabilistic (or “contingent”) nature of the claims, that many of themoccur off-budget, and responsibilities are not always well-defined (i.e. claims are “implicit”).
Box 4.1: Coordination failure: regulators and subsidies in the Philippines electricity sector
The Small Power Utilities Group(SPUG) is in charge of electricitygeneration in off-grid areas for theNational Power Corporation (NPC)in the Philippines. SPUG has twosources of revenues: tariffs chargedto local distribution utilities, andcross-subsidies paid out of aregulator-approved levy charged toall electricity users.
In 2003, SPUG estimated thatits total revenue requirement wasaround US$0.30/kWh, while itsaverage tariff was aroundUS$0.08/kWh. SPUG applied to the
regulator for a levy that wouldcover the US$0.22kWh revenuegap.
But arguing that SPUG’s costswere too high, the regulatorapproved a levy below requested bySPUG, giving SPUG only part ofthe cross-subsidy it requested.
Rather than reducing its totalcosts to meet the expected cross-subsidy and tariff revenues, SPUGfinanced the revenue shortfall withbridge loans. These loans areultimately absorbed by NPC, andeventually the Government and tax-
payers, in effect transforming theminto a direct subsidy.
In short, lack of coordinationcaused the taxpayer to pick up thebill instead of the consumer. Giventhe lack of coordination between theregulator and the fiscal authorities,SPUG’s financial accountabilitymay decline, and the taxpayers’ billmight be larger than the consumers’would have been. But should theregulator be held accountable?
Source: Castalia (2004a).
The ability of a government to manage its share of the risk in an infrastructure asset, and to beheld accountable for that management, obviously depends critically on its fiscal institutions. Ata very general level, this requires that the government is appropriately reconciling solvency andliquidity as discussed in the previous chapter. This in turn depends on the quality of fiscalinformation and the degree of disclosure (e.g. use of accrual accounting and risk annotation offinancial statements to ensure good disclosure of risk exposure).
Of critical importance of course is the actual utilization of this information about fiscal riskduring the budget process (including at the subnational level where infrastructure can createconsiderable fiscal risk). Ideally, governments would decide on overall ceilings for fiscal risk,issue guidelines on risk assumption to sector agencies and local governments, monitor centrallyhow much risk is being assumed, and generally require central approval of the assumption ofrisk. The outcomes should be subject to audit to facilitate accountability for risk-taking.101
Publication of any licenses and contracts which give rise to fiscal risk would also facilitateaccountability.
101 See Brixi and Irwin (2004) for a detailed discussion of fiscal institutions to manage infrastructure risk.

Accountability and Risk Management
153
Table 4.3: Common types of central government fiscal support for Infrastructure
Direct Contingent
(Obligation in any event) (Obligation if a particular event occurs)
Explicit (Government liabilitycreated by a law or
contract)
Sovereign debt (or long-term purchase agreements)contracted by central government for infrastructure
investments (e.g. China’s infrastructure bonds)
State guarantees of long-term purchase contracts ofstate owned utilities (e.g. the Philippines’ guarantees
of NPC’s power-purchase obligations)
State guarantees of debt, revenue, exchange rates,and construction costs in private infrastructure
projects (e.g. minimum-revenue and exchange-rateguarantees in Korean toll roads)
Central government subsidies State guarantees for borrowing of publicinfrastructure companies (e.g. of Thai state railways)
State guarantees of financial institutions involved ininfrastructure financing
Tax expenditures, such as exemptions, that reducefuture government revenue
State guarantees for borrowing of local governmentsrelated to infrastructure
The future cost of any no contractual but politicallyunavoidable budget subsidies
Non-contractual claims arising from privateinvestment in infrastructure (e.g. various claims in
Indonesia)
Implicit(A “political” obligation ofgovernment that reflectspublic and interest-group
pressures) Future recurrent costs of public investmentinfrastructure projects
Claims by state owned infrastructure enterprises tohelp cover their losses, arrears, deferred
maintenance, and debt (e.g. debt and arrears ofenergy generators in Mongolia)
Claims by local governments to help cover their non-guaranteed debt, their own guarantees, arrears, and
other obligations related to infrastructure (e.g.municipal bonds to finance infrastructure Vietnam)
Claims by failing financial institutions whoseportfolios have been weakened by financing
infrastructure (e.g. China)
Source: Brixi and Irwin (2004).
The criterion of fiscal solvency is central to sound management of infrastructure risk.Governments in the region have often resorted to risk-sharing transactions with the private sectorrather than undertaking straightforward public investment simply to get an expenditure “off thebooks”. In other words, liquidity improves because a direct claim has been transformed into acontingent one, within an accounting framework that does not fully account for contingentclaims (as in the vast majority of countries). But in general, solvency will have improved only if
Accountability and Risk Management
154
the transfer of risk to the private sector has brought efficiency gains.102 That depends on theaccountability framework in place for the service provider.
And we have seen that competition is very important to service provision accountability. Indeed,we have also seen that competition is intimately linked to the degree of risk that can betransferred to the private sector. Where the state restricts competition by imposing a monopolybetween the private supplier and the final customer (as in the IPP-single buyer case describedabove), that prevents the private supplier from competing for the more creditworthy customers inthe market. The state’s consequent assumption of risk may be seen as compensating the privatesector for this exclusion.
This points to a critical coordination issue: a ministry of finance that wants to minimize fiscalrisk might strongly desire competition in infrastructure sectors, while sector agencies might havestrong incentives to preserve monopoly power. And other ministries (for example social affairs,industry, environment) might want the efficiency gains that could come from competition.
And balancing those interests is never easy, particularly when private sector objectives areinvolved also. In some cases, the private sector might see competitive markets as an opportunity,but in others its efforts to mitigate overall risk might preclude competition. In many cases,overall investment climates present considerable risk, and infrastructure investments presentextra risk for all the regulatory and other reasons discussed in earlier chapters. Against a highlyrisky background, private investors often seek government guarantees and commitments toprotect the rewards from the risks (e.g. fixed price long-term power purchase agreements,minimum revenue guarantees for toll roads, under which risks become fiscal – as we saw inTable 4.3). Once the rewards are protected and government is carrying the risk, there’s little tocompete for. In short, if governments were to minimize infrastructure investment risk that wouldoften minimize fiscal risk and facilitate infrastructure service competition as well. This couldcreate a very virtuous loop.
But we shouldn’t talk as if it is easy to determine how risks are really being shared in a particulararrangement, or how those arrangements compare to potential alternatives. For example, we sawin the Three Cities MRT story in Chapter 3 that the private sector appeared to bear most of therisks, but where that proved excessive, much of it ended up de facto with the state (presumablybecause the projects couldn’t be allowed to fail).
Another prominent example is the treatment of currency depreciation risk under variousinstitutional arrangements in the power sector. In this example, risk is hidden under certainarrangements, and is more open under others (particularly those involving private or foreigncapital). There are many different ways for currency depreciation to impose costs on utilityconsumers or taxpayers. Some are transparent and some are hidden, but the economic costs maynot differ much (see Box 4.15).
102 Even without efficiency gains, solvency could potentially be improved by the transaction if the government’silliquidity would have prevented a pure public investment from being implemented, but private financing overcomesthat constraint (as long as the project rate of return is sufficient to exceed the cost of private capital).
Accountability and Risk Management
155
The involvement of foreign owners makes the economic costs of currency depreciation moretransparent, which raises the political stakes. But the foreign owners may well have broughtsubstantial efficiency gains, which were masked by the effect of the currency depreciation, butthat could benefit consumers and taxpayers in the long run. The dilemma for policymakers: gofor efficiency or go for a quiet political life? Or put it another way: go for a quiet life in the longrun because of efficiency or in the short run because of populism? It depends on accountability.
More generally, a significant proportion of infrastructure concession contracts are formallyrenegotiated during the contract lifetime, and risks then get redistributed.103 Obviously nothingcan chill an investment climate like contract renegotiations forced by governments. Sometimesrenegotiation reflects a shift in bargaining power in favor of government once the concessionairehas sunk costs, often combined with an inability by concessionaires to enforce contracts throughthe court system. Sometimes renegotiation reflects a shock or crisis that neither party anticipatedat the time of concluding the contract, such in Indonesia in the aftermath of the Asian crisis.And it can also reflect a legitimate learning process. Public-private risk-sharing in infrastructureis a relatively new science, the technology needs to be adapted for each sector and each country,and some experimentation is needed (see Spotlight 2 for an example of that learning process inPartnerships Victoria).
Indeed, one lesson to be learnt from crises is that they do recur, and could perhaps be anticipatedin a renegotiated contract. For example, many concession contracts did not anticipate thecurrency crisis of 1997, yet the probability of a sharp currency depreciation during the 15-30year typical period of such contracts is very high in almost every country in the world, all themore so in developing countries. Contracts could conceivably include provisions for tariffincreases to be phased if they result from currency depreciations in excess of a specified rate,with agreement on how transitional liquidity is to be injected. This would avoid renegotiationduring crisis when political constraints are at their height, and the country’s investment climateand creditworthiness at its most vulnerable.
Ownership, accountability, and beyond…
And so to the eternal ownership issue. Are privately-owned infrastructure service providersmore or less accountable for performance than publicly-owned ones? We can’t really measureaccountability directly, but we can of course measure performance. And we saw in Chapter 2that the empirical evidence shows that private providers perform better on average, when theincentive environment gives them a good reason to do so. When faced with competition or withwell-designed regulation that rewards efficiency gains, private ownership seems to yield greateraccountability; private ownership by itself doesn’t seem to make much difference.104
103 For example, Guasch (2004) found from a sample of more than one thousand infrastructure concessions in LatinAmerica and the Caribbean during 1985-2000 that renegotiations occurred in 30 percent of them (this rises to 74percent for water and sanitation concessions alone). See also Harris, Hidges, Schur and Shukla (2003).104 See Kessides (2004) or Coelli, Estache, Perelman, and Trujillo (2003) for surveys of the empirical literature. Theanalysis is of course complicated by the variety of risk-sharing arrangements in infrastructure, and hence difficultyin defining “private” and “public” on a comparable basis, and also in the interdependence of performance ofdifferent entities in a given network (e.g. if private electricity generators rely on a publicly-owned transmissioncompany it would sometimes be difficult to assess their performance independently).
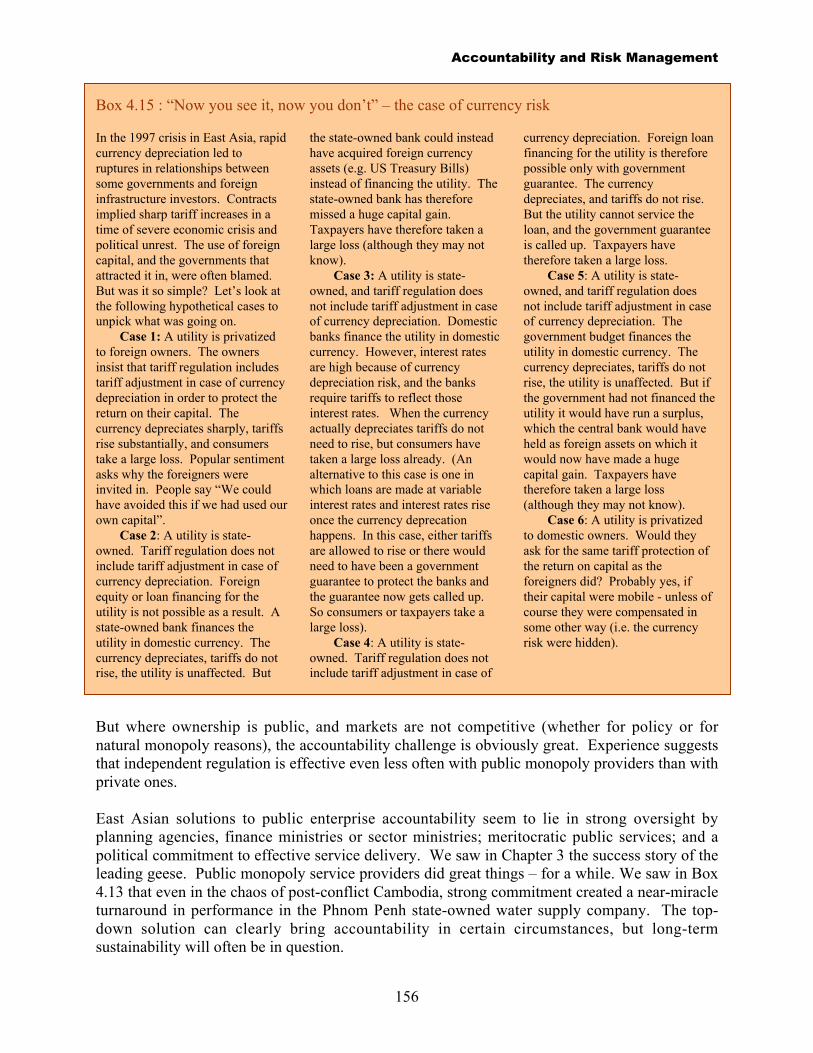
Accountability and Risk Management
156
Box 4.15 : “Now you see it, now you don’t” – the case of currency risk
In the 1997 crisis in East Asia, rapidcurrency depreciation led toruptures in relationships betweensome governments and foreigninfrastructure investors. Contractsimplied sharp tariff increases in atime of severe economic crisis andpolitical unrest. The use of foreigncapital, and the governments thatattracted it in, were often blamed.But was it so simple? Let’s look atthe following hypothetical cases tounpick what was going on.
Case 1: A utility is privatizedto foreign owners. The ownersinsist that tariff regulation includestariff adjustment in case of currencydepreciation in order to protect thereturn on their capital. Thecurrency depreciates sharply, tariffsrise substantially, and consumerstake a large loss. Popular sentimentasks why the foreigners wereinvited in. People say “We couldhave avoided this if we had used ourown capital”.
Case 2: A utility is state-owned. Tariff regulation does notinclude tariff adjustment in case ofcurrency depreciation. Foreignequity or loan financing for theutility is not possible as a result. Astate-owned bank finances theutility in domestic currency. Thecurrency depreciates, tariffs do notrise, the utility is unaffected. But
the state-owned bank could insteadhave acquired foreign currencyassets (e.g. US Treasury Bills)instead of financing the utility. Thestate-owned bank has thereforemissed a huge capital gain.Taxpayers have therefore taken alarge loss (although they may notknow).
Case 3: A utility is state-owned, and tariff regulation doesnot include tariff adjustment in caseof currency depreciation. Domesticbanks finance the utility in domesticcurrency. However, interest ratesare high because of currencydepreciation risk, and the banksrequire tariffs to reflect thoseinterest rates. When the currencyactually depreciates tariffs do notneed to rise, but consumers havetaken a large loss already. (Analternative to this case is one inwhich loans are made at variableinterest rates and interest rates riseonce the currency deprecationhappens. In this case, either tariffsare allowed to rise or there wouldneed to have been a governmentguarantee to protect the banks andthe guarantee now gets called up.So consumers or taxpayers take alarge loss).
Case 4: A utility is state-owned. Tariff regulation does notinclude tariff adjustment in case of
currency depreciation. Foreign loanfinancing for the utility is thereforepossible only with governmentguarantee. The currencydepreciates, and tariffs do not rise.But the utility cannot service theloan, and the government guaranteeis called up. Taxpayers havetherefore taken a large loss.
Case 5: A utility is state-owned, and tariff regulation doesnot include tariff adjustment in caseof currency depreciation. Thegovernment budget finances theutility in domestic currency. Thecurrency depreciates, tariffs do notrise, the utility is unaffected. But ifthe government had not financed theutility it would have run a surplus,which the central bank would haveheld as foreign assets on which itwould now have made a hugecapital gain. Taxpayers havetherefore taken a large loss(although they may not know).
Case 6: A utility is privatizedto domestic owners. Would theyask for the same tariff protection ofthe return on capital as theforeigners did? Probably yes, iftheir capital were mobile - unless ofcourse they were compensated insome other way (i.e. the currencyrisk were hidden).
But where ownership is public, and markets are not competitive (whether for policy or fornatural monopoly reasons), the accountability challenge is obviously great. Experience suggeststhat independent regulation is effective even less often with public monopoly providers than withprivate ones.
East Asian solutions to public enterprise accountability seem to lie in strong oversight byplanning agencies, finance ministries or sector ministries; meritocratic public services; and apolitical commitment to effective service delivery. We saw in Chapter 3 the success story of theleading geese. Public monopoly service providers did great things – for a while. We saw in Box4.13 that even in the chaos of post-conflict Cambodia, strong commitment created a near-miracleturnaround in performance in the Phnom Penh state-owned water supply company. The top-down solution can clearly bring accountability in certain circumstances, but long-termsustainability will often be in question.

Accountability and Risk Management
157
Concluding remarks
In this chapter we came down from the strategic vision at the top of the accountability hierarchyand looked from a sectoral and a community level at how accountability mechanisms can work.We saw that when the traditional East Asian top-down model shows signs of strain there areways of delegating service provision, but maintaining accountability for performance.
This chapter outlined several accountability mechanisms. First, we looked at how communitiescan manage small scale infrastructure for themselves, how they can participate in the “lastkilometer” of larger network infrastructure, how community consultation on large projects couldbe more than tokenist, and how consumers have a role in regulation. Community accountabilityis a powerful force in parts of the region, and could be so much more widely over time.
We next discussed the role of competition as a great force for accountability, and saw thattechnological change and institutional innovation have considerably expanded the potential forcompetition in infrastructure service provision in recent decades. And yet competition in EastAsian infrastructure still plays a relatively marginal role. The top is reluctant to let go.
We talked about economic regulation as an accountability mechanism where competition islimited, and we saw that regulation remains quite highly politicized in the region. Cost recoveryis not yet on solid ground. In this context, we saw the importance of subsidies and thepoliticization of those subsidies, and suggested ways to make regulators and subsidy-givers moreaccountable. But much remains to be done.
We saw how crucial risk-sharing arrangements were to delegation of service provision, and thatrisk-sharing raises substantial accountability and coordination challenges. Most importantly, wetalked about risk-sharing as a learning process. Mistakes get made, experiences teaches, newinformation comes in – all this can contribute to sharing risk in a manner more commensuratewith each party’s ability to bear the risk and manage it. Some East Asian economies have beenhesitant about this learning process since the 1997 crisis – once bitten, twice shy – but others likeKorea are now forging ahead.
And last but not least, we saw that ownership does not matter by itself. We have seen plenty ofdisappointments in private provision in East Asia. What does matter is that private provisiontends on average to respond better to competition and well-crafted regulation than does publicprovision. That means the more the system outgrows the top-down model and needs to delegate,the more it will need to attract the private sector if infrastructure provision and efficiency is tokeep pace with East Asia’s needs. But this time around, private participation should come withcompetition and good regulation.
Throughout the report we have seen a centralized system which is showing some ability to adapt,endeavoring to overcome the strains by decentralizing some accountability: through localgovernment autonomy, private provision, competition, arms-length regulation, and communityinitiative. The challenge going forward is to be less tentative and hesitant in that adaptation, tohave the confidence to deepen the process. And East Asia has plenty of reasons for confidence.

Accountability and Risk Management
158
Spotlight 2: Learning how to share risk: the case of Partnerships Victoria105
The State of Victoria, in Australia, is one of a number of authorities across the world withprograms to facilitate private sector participation in the provision of a range of infrastructure(and other) services through so-called Public Private Partnerships (PPP).
The State’s current “Partnerships Victoria” policy sets out principles and procedures for PPPsundertaken by agencies within the state, and is overseen by a dedicated unit within theDepartment of Treasury and Finance. The framework builds on over fifteen years of PPPexperience, which has included many significant successes as well as a number of mistakes. Butlessons have been drawn from both, to create a PPP framework that maximizes value for money,based on the careful calculation and assignment of optimal – as opposed to maximum – risk tothe private sector.
PPPs use the private sector to deliver traditionally public sector infrastructure services, through aprocess that focuses on services and outputs, rather than short-term inputs. Under a typical PPParrangement, one private party (usually a consortium) is engaged to design, construct, finance,maintain and at times operate an infrastructure facility. Payments are usually made only after thefacility passes commissioning tests, over the term of the contract, based on service deliverymeeting key performance indicators specified in the concession contract.
This contrasts with typical government infrastructure procurement, in which an architect wouldbe engaged to design the facility, based on specified input requirements; a contractor would beengaged to construct the facility; government would operate the facility, and progress paymentswould be made to architects and contractors before commissioning.
Victoria’s experimentation with infrastructure PPPs began in the late 1980s, and early 1990s, andincluded the Victorian Accelerated Infrastructure Program, as well as train and locomotiveleases. During this time, the use of PPPs largely reflected a desire to finance infrastructure off-balance sheet, rather than a concern for increased efficiency and value for money. The financingarrangements that resulted had little impact on the nature of service delivery arrangements, andentailed minimal risk transfer, with government often providing indemnities and guarantees toprivate parties. Some of the PPPs of the time were unwound later at significant cost to taxpayers.
The PPPs undertaken between 1994 and 1999 were governed by the Infrastructure InvestmentPolicy for Victoria, which cast the role of the private sector in terms of increased efficiency andgrowth. Examples of infrastructure PPPs of that period include the Melbourne CityLink, variouswater and wastewater treatment plants, and public transport franchises. During this period therole of the private sector was expanded to also include operation and service delivery, withpayment made only upon commencement of services, as well as significantly higher levels ofrisk transfer, including the removal of government guarantees on returns. While the assessmentof PPP projects of the time is largely positive, the excessive concern with risk transfer lead tounsustainable financing arrangements in some cases. Other shortcomings included insufficient 105 This case study draws on Maguire and Malinovich (2004).

Accountability and Risk Management
159
attention to social and regional impact, limited benchmarking of performance, and insufficientattention to economic evaluation in some cases.
Since 2000, PPPs have been delivered through the state’s new Partnerships Victoria Policyframework. The approach is becoming an increasingly important tool for infrastructure deliveryas a whole: Already 12 projects have been signed with a capital value of more than AU$2.5billion, covering a range of infrastructure sectors, including water, information andcommunications technology, and transport, in addition to health and justice. The largest projectso far is the Mitcham Frankston Freeway Project signed in October 2004 with a capital value ofAU$2.5 billion. Three projects valued at almost AU$1 billion are also currently in the marketand a number of projects are under development.
PPPs in Victoria currently account for around 10 percent of total capital investment ininfrastructure. The public sector continues to deliver the majority of Victoria’s infrastructureneeds, with PPPs most frequently used in large, complex or innovative infrastructure projects,where the private sector is best able to add value.
The new framework draws on lessons of the past in a number of important ways: value formoney – rather than scarcity of capital, or any preference for off-balance-sheet financing – is thekey rationale for whether PPP or traditional procurement arrangements are used to deliverinfrastructure services. Emphasis is placed on whole-of-life costing, as well as on optimal risktransfer to the private sector. PPP projects are allocated funding as if they were to be built andowned by government. The funding is then available to be converted into a recurrent stream inthe event of a Partnerships Victoria contract being executed.
The essence of the Partnerships Victoria approach is that government does not purchase an asset,but a service, or set of services, at an agreed quality, quantity, cost and timeliness – withpayment withheld if services are not provided to specified levels. The government only entersinto a PPP contract if private sector delivery mechanisms can pass a test demonstrating superiorvalue for money, in comparison with the most efficient and likely method of providing therequired output through public sector ownership and operation. The approach provides for arange of partnership models, depending on different private and public sector roles, andcommercial scenarios106. It sets out a rigorous procurement process to be followed by allagencies in the development of Partnerships Victoria projects. It also includes a formal publicinterest test, in which all projects are assessed in terms of their effectiveness, accountability andtransparency, impact on individuals and communities, equity, consumer rights, public access,security and privacy.
Estimation of whether the private sector can deliver superior value for money takes into accountboth qualitative and quantitative factors. Quantitative evaluation criteria include the constructionof a ‘public sector comparator’, which is defined in the framework as an estimate of the‘hypothetical risk-adjusted cost if a project were to be financed, owned and implemented bygovernment’ (Partnerships Victoria, 2001). This public sector comparator is compared with thecost of providing a service through a PPP, and the service delivery option which offers the better
106 In all models, however, the government retains responsibility for the delivery of defined core services, such asnurses in hospital and officers in prisons
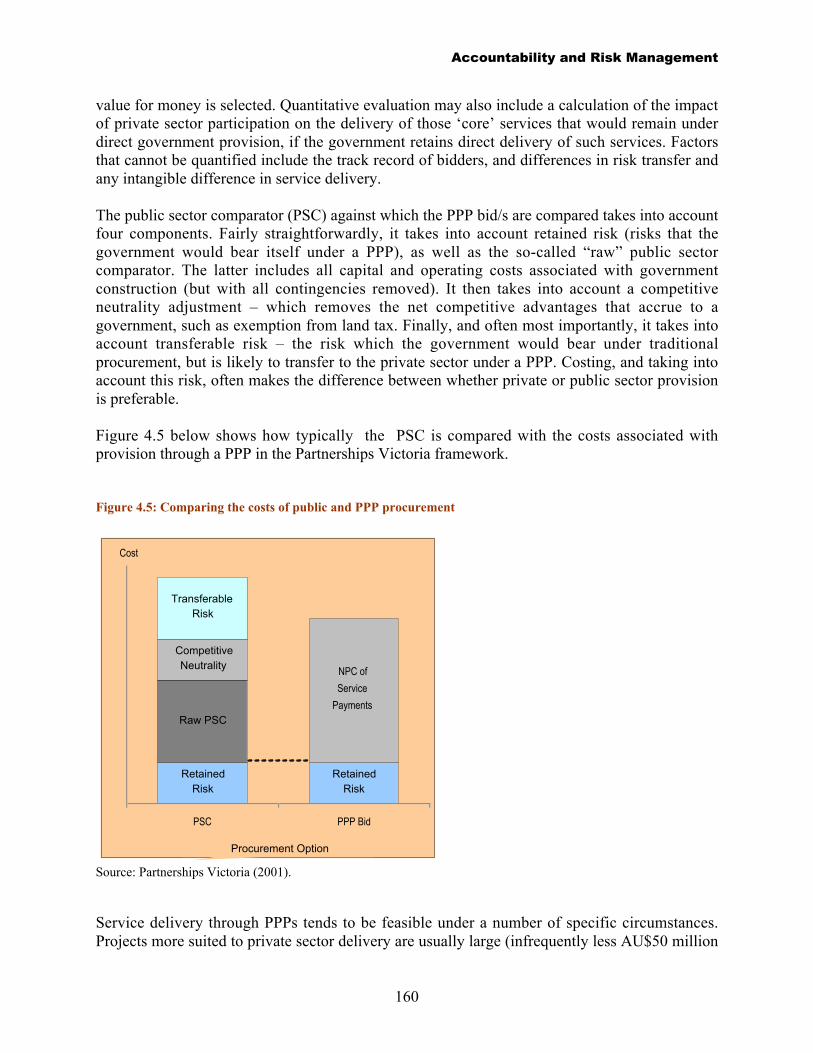
Accountability and Risk Management
160
value for money is selected. Quantitative evaluation may also include a calculation of the impactof private sector participation on the delivery of those ‘core’ services that would remain underdirect government provision, if the government retains direct delivery of such services. Factorsthat cannot be quantified include the track record of bidders, and differences in risk transfer andany intangible difference in service delivery.
The public sector comparator (PSC) against which the PPP bid/s are compared takes into accountfour components. Fairly straightforwardly, it takes into account retained risk (risks that thegovernment would bear itself under a PPP), as well as the so-called “raw” public sectorcomparator. The latter includes all capital and operating costs associated with governmentconstruction (but with all contingencies removed). It then takes into account a competitiveneutrality adjustment – which removes the net competitive advantages that accrue to agovernment, such as exemption from land tax. Finally, and often most importantly, it takes intoaccount transferable risk – the risk which the government would bear under traditionalprocurement, but is likely to transfer to the private sector under a PPP. Costing, and taking intoaccount this risk, often makes the difference between whether private or public sector provisionis preferable.
Figure 4.5 below shows how typically the PSC is compared with the costs associated withprovision through a PPP in the Partnerships Victoria framework.
Figure 4.5: Comparing the costs of public and PPP procurement
Retained Risk
Retained Risk
Raw PSC
Competitive Neutrality
Transferable Risk
NPC of
Service
Payments
PSC PPP Bid
Procurement Option
Cost
Source: Partnerships Victoria (2001).
Service delivery through PPPs tends to be feasible under a number of specific circumstances.Projects more suited to private sector delivery are usually large (infrequently less AU$50 million

Accountability and Risk Management
161
to AU$100 million) – to offset the transaction and ongoing management costs associated withthe Partnerships Victoria approach. They require that government need can be defined inmeasurable output terms; that there is opportunity for efficient risk transfer to the private sector;and that there is scope for the private sector to demonstrate particular skills and/or capacity forinnovation. They also tend to be favored in cases when opportunity exists for revenue from third-party asset utilization (thereby decreasing the net cost to government), and when projects areable to generate competitive market interest.
Accountability and Risk Management
162
Spotlight 3: Consumer participation, regulators, and accountability
The mandate of infrastructure regulators is to shape the ‘regulatory contract’ between consumersand service providers with monopoly power. Regulators are a countervailing power exercised onbehalf of consumers. However, consumers are composed of diffuse interest groups, who maynot be resourced to ‘voice’ their concerns effectively. Regulators need to actively engageconsumers to hold service providers accountable for the delivery of the ‘regulatory contract’.Moreover, consumer participation provides the ‘checks and balances’ required to ensure that theregulator does not stray from its mandate of protector of consumer rights. This Spotlightdiscusses the status of consumer participation in infrastructure regulation in East Asia, drawingon the results of a survey questionnaire conducted among infrastructure regulators.107
Regulatory functions
The following regulatory functions are considered essential to involve consumers in theregulatory process:
Informing and educating consumers
Informing and educating consumers is necessary to hold service providers and regulatorsaccountable vis-à-vis the consumer constituency. An effective strategy to redress informationasymmetries between the parties hinges on a transparent regulatory process and effectiveinformation campaigns.
The degree of transparency of a regulatory regime largely depends on the disclosure policy of theregulating bodies. Almost two-third of the surveyed regulators in the region disclose proceduresand decisions, while half of them also release to the public the benchmarked performance ofregulated service providers. However, licenses and contracts with private service providers arestill kept confidential by the majority of the regulating entities.
The regulator is also responsible for raising consumer awareness of their rights and obligationsunder the regulatory contract. The media is the most common channel of communicationemployed by the surveyed regulators; in addition, more than half of the surveyed regulators drawon ‘two-way’ vehicles of communications (either workshops and one-to-one meetings), whichhave the advantage of leading to a deeper form of consumer engagement. Most of the regulatorsrely on government and service providers as intermediaries to raise consumer awareness.Regulators tend also to leverage the expertise of sector-specific intermediaries (such as NGOs inthe water sector and community leaders in the energy sector) to reach consumers. Consumerassociations do not appear to play a significant role in raising consumer awareness.
107 The survey questionnaire has been prepared for the second meeting of the East Asia and Pacific (EAP) Forum ofInfrastructure Regulators, which was held in Manila on April 5-7, 2004. The survey questionnaire covered 45regulatory bodies from 21 countries (Australia, Cambodia, China, Fiji Islands, Hong Kong (China), Indonesia,Kiribati, Korea, Lao, Malaysia, Micronesia, Mongolia, Papua New Guinea, Philippines, Samoa, Solomon Islands,Singapore, Thailand, Tonga, Vanuatu and Vietnam) and from all infrastructure industries (15 energy regulators; 14regulators in water and sanitation; 10 regulators in telecom; 1 transport regulator and 8 multi-sector regulators).
Accountability and Risk Management
163
Handling consumer complaints
An effective complaint-handling mechanism should be established under any regulatory regimeto hold regulated service providers accountable to consumers for the delivery of the ‘regulatorycontract’. Two-thirds of the surveyed regulatory bodies have in place formal consumer redressmechanisms. While almost half of the regulators (42 percent) represent the first port of call forhandling consumer complaints; for an equal number of cases, consumers’ complaints aredirected in the first instance to service providers. Consumer associations do not appear to play asignificant role in the redress process.108 Even when regulators do not represent the first port ofcall for handling consumer complaints, they retain important regulatory functions throughout theredress process; around half (53 percent) of the surveyed regulators are responsible formonitoring the responsiveness of service providers in handling consumer complaints; half (47percent) maintain the right to step in should the complaint not be solved. However, only fiveregulatory agencies have in place financial incentives to reward/penalize service providers on thebasis of their performance in addressing consumer complaints.
Soliciting consumer input
In non-monopolistic markets, consumers can reveal their preference and/or ‘voice’ theirdissatisfaction by exercising the option of switching to substitute products. This system of‘checks and balances’ ensures that service providers do value consumer information to enhancetheir competitiveness against rival firms. No similar mechanism is in place in monopolisticindustries, where customers are generally locked in to the incumbent service provider. The onusis therefore on the regulator to solicit consumer input throughout the regulatory process to ensurethat provision of infrastructure services is aligned with consumer expectations.
In line with regulatory best practice, the two inputs most often solicited by EAP regulators toinform decision-making are quality of service and consumer satisfaction. The survey findingsindicate that the majority of the regulators have in place well structured mechanisms to consultwith consumers throughout the regulatory process. Informal consultations with consumerrepresentatives appear to be the most common mechanism in place to solicit information fromconsumers, being adopted by two-third of the regulators. In addition, 64 percent of the surveyedregulators have in place at least one formal consultation mechanism (i.e. public hearings and/orformal consultations with advisory bodies), with more than half of the surveyed regulators (56percent) drawing on both formal and informal consultation processes.
Options for consumer representation
Being a diffuse stakeholder group, consumers need to rely on a representative body able toengage in the regulatory process on their behalf. Among the entities that could be tasked with therole of representing consumer rights are the following:
108 A few significant exceptions are to be acknowledged, namely the Consumer Forum in Malaysia and the YayasanLembaga Konsumen Indonesia (YLKI) in Indonesia.
Accountability and Risk Management
164
In-house consumer affairs bureaux
Regulators can establish in-house consumer departments as a basic form of institutionalrepresentation of consumer interests. Economies of scope can often be achieved by entrusting thesame entity with consumer representation and regulatory functions. For example, an in-houseconsumer department would benefit from direct access to consumer-related information thatcould be used to inform the representation function. The findings of the survey questionnaireindicate that in-house consumer affairs bureaux are the most common institutional option forconsumer representation in the EAP region, being adopted by 42 percent of the surveyedregulators.
Consumer representation in the decision-making body
Another option is to institutionalize consumer representation in the regulatory board, thedecision-making body of the regulating entity. This model is currently adopted in several Africancountries (such as Burundi, Ghana and Senegal), but in only a few regulatory regimes (20percent) in East Asia.109 In theory, this form of consumer representation can lead to the highestrungs of consumer engagement in the regulatory process by establishing a direct channel forfeeding consumer input into decision-making. In practice, the potential benefits derived fromconsumer representation in the regulatory board are often outweighed by its costs. In the firstplace, board representation may have the downside effect of trapping consumer representativesin a conflict of interest situation, by making them accountable to both the regulatory body andconsumers. Aside from the risk of regulatory capture, having consumers represented in theregulatory board may bring the regulatory process to a standstill, as it empowers consumerrepresentatives to exercise a right of veto to halt the decision-making process. In addition, thetop-down appointment of consumer representatives to the regulatory board may undermine theirlegitimacy and accountability to the consumer constituency.
External consumer bodies
Consumer representation could also be delegated to external independent entities, such as non-institutionalized consumer associations or statutory consumer councils. Being independent fromthe regulator itself, external consumer bodies are better positioned than in-house consumerdepartments to take a stance against regulatory decisions perceived as unfair vis-à-visconsumers. As a downside effect, independent consumer bodies risk being captured by specificinterest groups at the expenses of the marginalized segments of the customer base. This risk isparticularly high in developing countries, where independent consumer associations may betaken over by middle class consumer groups whose interests are not necessarily aligned (and infact are often conflicting) with those of the poorest customers.110 Delegation of consumerrepresentation to an external body (such as consumer associations) is adopted by one-third of thesurveyed regulators. Moreover, 30 percent of the regulators relies on more than one option for
109 Consumer International (2004).110 Middle-income customers advocating against tariff increases may indeed jeopardize the possibility to expandaccess.

Accountability and Risk Management
165
consumer representation —the most common arrangement being the combination of an in-houseconsumer affair bureau with an external advisory body.
Overall, most of the infrastructure regimes in the region appear to have reached the rung ofconsultation in the ladder of consumer engagement in infrastructure regulation, most of theregulatory regimes have indeed in place well-structured processes to interact with consumersthorough the regulatory process. The findings of the survey questionnaire suggest that, while theonus is on the regulator to ensure effective consumer participation in the regulatory process,most of the regulators in the region rely on governments and service providers as well as anumber of sector-specific intermediaries to interact with consumers.

Accountability and Risk Management
166

Accountability and Risk Management
167
5. The Way Forward
So what does this framework mean for action in East Asian infrastructure? How does thisframework point to challenges in the road ahead, and give guidance towards solutions?
The framework set out in this study is analytical. It suggests a way of approaching problems, butis not a “tool kit” for implementing particular policies. Nonetheless, the framework hasimportant policy implications. Here we trace out twelve of them. These reflect key concernsarticulated in the consultations undertaken in preparing this report, with the region’s policymakers, policy implementers, infrastructure service providers, civil society organizations andother stakeholders.
The twelve policy messages constitute an approach to strengthening infrastructure’s contributionto inclusive development, as set out in Chapter 2. They promote the role of infrastructure inunderpinning growth and poverty reduction. Infrastructure does not lead to inclusivedevelopment on its own – it requires actions that support the delivery of services to the poor whoneed them, and that underpin the growth dynamics on which improvements in welfare depend(Box 5.1). What do we need to think about in order to do this?
Box 5.1: Managing the contribution of infrastructure to inclusive development
While infrastructure is important, onits own it is not enough.Infrastructure has to work withother policies and interventions thatalso impact on inclusivedevelopment: on investment,innovation or policy stability thatimpact on growth; on those factorsthat impact on people’s ability toaccess services.
The impact of infrastructure oninclusive development also dependson a range of choices that countrieshave to make, and balances thatthey have to strike. Sharing of thebenefits of infrastructure is notautomatic. Broad-based impacts on
poverty may be positive, but thelocal impacts can sometimes benegative, unless deliberatelymitigated. There are genuinechoices to be made betweeninvestments that will impact moreon poverty, and those that willimpact more on growth – on ruralroads, for instance, as opposed toport logistics. There are trade-offsto be made between the interests ofthe poor and the non-poor.
How infrastructure contributesto inclusive development will varyby the nature of each country’sgrowth and poverty challenges. InLao PDR is may be through greater
links with the region. In Thailand itmay be the creation of high-transaction business environmentswith easy accessibility. We knowthat infrastructure does impact onpoverty, but precisely whatinvestments are needed depends onwhether a country faces masspoverty, or whether poverty islocation specific; whether isolationis a root cause of poverty, orwhether other factors such as caste,race, or a history of discriminationare more important.

The Way Forward
168
The discussion of coordination in Chapter 3 provides the basis for three of the policy messagesarising from the framework. In Chapter 3 we saw how strategic vision has proved crucial forensuring the effectiveness of infrastructure interventions. We also looked at a number of thechallenges that arise in formulating and implementing this vision – coordination across financingand planning institutions, coordination across infrastructure and fiscal institutions, andcoordination across decentralized government. The analysis set out in Chapter 3 gives us thefollowing three policy messages:
Infrastructure provides basic services on which survival and livelihoods depend; infrastructure isthe backbone of economies and societies; infrastructure has major environmental impacts;infrastructure can bring powerful monopolies and foreign participation into areas of greatsensitivity. As such, infrastructure is intensely political.
But infrastructure is also economically and technically complex, and has very long-termimplications. So the technocrats have a critical role to play also, to complement the role ofpoliticians. This extraordinary blend of technocracy and politics places a premium on high-level,central institutions, which can articulate strategies that are politically sustainable andeconomically effective.
Institutions that can formulate those long-term strategies, and can coordinate the policies ofdifferent agencies to implement them, are essential to effective infrastructure service provision.Objectives that move beyond the purely economic, to mainstream environmental and socialconsiderations, demand higher levels of coordinating capacity than hitherto. Sector ministriesand local governments cannot work in policymaking isolation.
Old top-down models of detailed economic planning should be eschewed, but new models ofstrategic planning and central coordination need to evolve. This should underpin tendenciestowards democratization, decentralization, independent regulation, private participation, and thecommercialization of service providers.
There has been substantial decentralization of government in East Asia, and this has oftenincreased the responsiveness of infrastructure service provision to local needs. Decentralizationhas undoubtedly played an essential political role.
However, decentralization poses a number of coordination challenges, both vertically (betweencentral and local governments) and horizontally (between various sub-national institutions).
1. The center matters – infrastructure demands strong planning and coordinationfunctions
2. Decentralization is important – but raises a host of coordination challenges

The Way Forward
169
Decentralized governments have sometimes been isolated within their own jurisdiction. This isproblematic since most network infrastructure has inter-jurisdictional backbones. Isolation canmean secondary or tertiary infrastructure lacks connections to primary infrastructure – in a sense,it goes nowhere. Some municipalities may be too small to achieve the scale necessary to deliverinfrastructure efficiently. In competing with each other, municipalities may duplicate expensiveinfrastructure facilities, when such facilities could in fact have been shared. Avoiding thesepitfalls depends critically on inter-jurisdictional cooperation – on filling in the “missing middle”.
Higher tiers of government need to encourage lower tiers to collaborate where primaryinfrastructure requires such collaboration. Matching grants to induce decentralized governmentsto participate in such investments, and institutional mechanisms to encourage cooperation ininfrastructure planning will play a major role.
Central governments also have to ensure that they maintain sufficient capacity to monitor,manage and coordinate, in line with policy and regulatory frameworks. The inadequacy of suchsystems is a frequent cause of sub-optimal service delivery, and confused authority.
Ultimately all infrastructure is paid for by users through tariffs or taxpayers through subsidies.Covering costs through user charges is a critical long-term objective. In the short-term, usercharges might be legitimately constrained by a variety of factors (see below under “subsidies”)or large investment needs might require upfront financing to be recovered gradually from usercharges.
Sometimes those financial shortfalls can be filled by the private sector, but sometimes privatefinancing will be insufficient, unavailable, or unacceptably expensive. Even where the privatesector comes in, it often requires risk-sharing with the public sector. Where the private sectorcannot or will not provide all the financing or bear all the risk, investments with adequateeconomic rates of return should be allocated fiscal space.111
Adequacy will of course depend in part on competing claims from non-infrastructureexpenditures, and from the need to keep fiscal deficits low. It will also depend on the veracity ofthe claim that user charges or private financing cannot fill the gap; sometimes it requires fiscaltightening to induce sector agencies to make reforms and seek other sources of funds.
In some East Asian countries, expenditure on infrastructure appears to have been less thanoptimal in recent years. Cambodia, Indonesia, Lao PDR, the Philippines, and Thailand could becandidates for that list. This may have undermined economic growth and poverty reduction, andeven long-run fiscal solvency.
111 The term fiscal space covers all forms of fiscal support including guarantees and other contingent liabilities, aswell as direct expenditures.
3. Fiscal space for infrastructure is critical

The Way Forward
170
This does not of course mean that more fiscal space for infrastructure should be the first step inthose countries. In several cases, fiscal tightening for macroeconomic stability and debtsustainability would take higher priority. In most cases, there is scope for stronger promotion ofprivate financing in infrastructure and for higher user charges. And there can be scope for costreductions, or better management and maintenance of existing assets. In some cases,strengthening public expenditure management should come before more public expenditure.Countries can easily veer from underspending to overspending if adequate institutions andcontrols are not in place.
But if and when those difficult preconditions are met, governments should allocate fiscal spacebased on long-run growth objectives and in pursuit of fiscal solvency. Infrastructure spending onworthwhile projects can create a virtuous circle: more growth, more fiscal revenue, more fiscalspace. The challenge of course is to select the right projects - and put in place the policy andinstitutional frameworks that actually make them worthwhile.
*
Our discussion of accountability and risk management in Chapter 4 provides the basis for fivefurther policy messages. In this chapter we looked at the a number of mechanisms through whichaccountability in infrastructure service provision can be strengthened – through the community,through regulation and through competition - and how accountability and risk managementarrangements can play out when governments provide support to infrastructure providers. Theanalysis set out in this chapter supports the following five policy messages:
Infrastructure subsidies can be justified on a number of grounds including environmentalprotection and poverty reduction. People often won’t pay the full cost of sanitation, mass rapidtransit, or renewable energy although they would enjoy the environmental benefits. Where thosebenefits are external to consumers, subsidies may be needed to realize the benefits. Clean wateror rural roads may have an important impact on poverty, but not be affordable by the poorwithout subsidies. And reform programs that help the poor or the environment may not bepolitically sustainable without subsidies for those with the power to derail the reforms. Similarly,transitional subsidies may sometimes be worth considering during short periods of economiccrisis.
But subsidies can become open-ended and addictive, their fiscal impact can explode, they canundermine financial discipline and blur accountability, they can postpone much-needed reform.Subsidies need to be employed with great care.
4. “Subsidy” is not a dirty word – subsidies can be important, but are always risky, andshould be handled with care

The Way Forward
171
Subsidies should be a last resort after costs have been minimized through competition,regulation, appropriate technology and service standards, or public enterprise reform. Subsidiesthemselves can be minimized through transparency, making them contingent on performance, orthrough subsidy bidding processes.
Where competition is not yet firmly in place, regulation of monopoly will be needed. Regulatoryindependence from politics is an important long-term goal to ensure service providers can covercosts and earn an adequate return on investments. However, regulators can establish theircredibility with consumers, politicians, and investors only gradually. If regulators exercise morediscretion than the political culture can absorb, a backlash can occur, creating unpredictabilityand instability.
Regulatory independence is a relative concept, and independence should grow step-by-step.New regulators should rely much more on transparent rules than on discretionary power, andsome responsibilities should be delegated to outside experts until in-house capacity can be built.Credibility, and hence independence, can be enhanced by transparency: hearings should bepublic, contracts and licenses should be also wherever possible. Accountability for regulators iskey to their independence.
Infrastructure is quite often a natural monopoly, but institutional and technological innovationare expanding the potential for competition. It is now feasible to provide most infrastructureservices competitively (if not always the infrastructure itself). The most direct, and hence mosteffective, way of holding service providers accountable is through competition.
East Asia has been very cautious about the introduction of infrastructure service competition; ithas often preferred to “throw” more infrastructure at a problem rather than provide incentives formore efficient infrastructure services, or to address the political economy obstacles tocompetition.
This approach may have been effective when basic infrastructure was being built, wheneconomic objectives were relatively simple, and when top-down command solutions prevailed.But as complexity increases those approaches can be expected to work less well, and the role ofcompetition will need to increase also.
5. Regulatory independence matters more in the long-run than in the short-run
6. Competition is hard to achieve in infrastructure – but it’s the best way to bringaccountability
The Way Forward
172
Local communities within civil society can often manage local projects. They can participate indecision-making about the large infrastructure networks which touch their community, or thoseaspects of large projects which affect them directly. They may need special protection, as longas the larger needs of society don’t get lost.
Civil society can play an important role in accountability of infrastructure institutions throughparliaments or through consumer participation in regulation. Civil society organizations andNGOs can provide small scale infrastructure services, be a watchdog against corruption andvested interest, and play an advocacy role for more sustainable infrastructure policies andservices.
Advocacy NGOs face difficult choices between representing the interests of specific groups orissues, and representing the interests of society at large. How effectively and accountably theymake those choices can have a significant impact on development outcomes.
Infrastructure is often provided by monopolies, and can generate large rents. It often providesvital services, which are highly prized and highly political. As a result, financial discipline canbe weak, political intervention intense, and rent-seeking prevalent. And the benefits ofinfrastructure can be easy to claim and hard to verify.
This combination of circumstances can create fertile ground for corruption. But that corruptiondiscredits the very infrastructure on which it preys. This can undermine the politicalsustainability of infrastructure development, and deter those investors and financiers concernedabout reputational risk and the other costs of corruption.
Combating corruption is a long, hard struggle requiring strong top-down political commitment.Major reforms of the judiciary and civil service lie at the heart of any anti-corruption effort. Butwhile these longer-term reforms are being put in place, significant progress can be made byremoving rent-seeking opportunities and exposing transactions to public scrutiny.
*
Four further policy messages derive from analysis developed across this study, although they alltake their departure from what we described as the “funding story” in chapter 1. Here we sawthat infrastructure can only be funded from two sources: the resources of consumers, and theresources of tax payers. But infrastructure can be financed by two other actors – on the one hand,
7. Civil society has a key role to play in ensuring accountability in service provision
8. Infrastructure has to clean up its act - addressing corruption is a priority
The Way Forward
173
the private sector (which may also be service providers), and official lenders and donors on theother. The policy messages are as follows:
In some places the private sector won’t come in sufficient scale, or will only do so on terms thatare politically unacceptable (at least to specific groups with strong voice). This is likely to beparticular relevant to countries with small markets (population or purchasing power), thosewhich are emerging from conflict, those where ideological opposition to private or foreigninvestment is particularly strong, or where adjustment of large state-owned infrastructure ispolitically difficult because of employment effects. In some sectors, natural monopoly remainsstrong, so competition to induce the efficiency gains from private participation is not yetpossible.
In sectoral terms, water and sanitation, large-scale hydropower and electricity transmission, sometypes of transport, and rural or cross-border infrastructure seem to have the hardest timeattracting private investment, or using it to promote efficiency (although with notableexceptions). In those situations reform of the public sector may sometimes be the most feasibleoption for efficiency gains, at least in the near term.
But public sector reform is difficult to achieve, and even harder to sustain, so keep expectationsmodest. If the private sector can’t be attracted because the state is unpredictable and lacksvision, or because tariffs plus subsidies are below costs, then public sector performance is likelyto be disappointing also. Even if costs are covered, public resources may be better used insectors other than infrastructure. The alternative of more thoroughgoing reform in the medium-term to attract private investment should always be kept in mind.
Private investment in East Asian infrastructure peaked in 1997, and declined dramaticallythereafter. It is now showing modest signs of recovery, but has not come close to matching thelevels initially expected in the mid-1990s.
A perceptions survey was carried out for this study amongst 50 private companies active orinterested in East Asian infrastructure investment. One survey response shone out above allothers: a large majority of investors said they were keen to invest, and would do so if policieswere more predictable.
The private sector has certainly not disappeared from East Asian infrastructure, but nor is itactually making large investments. More predictable policies would bring it back. Moreover, ifit came back, better regulation or more competitive market structures would help ensureefficiency gains from its return.
9. Public sector reform matters – but be realistic
10. The private sector will come back – if the right policies evolve
The Way Forward
174
East Asia’s success is built in part on channeling high savings into domestic investment ininfrastructure. The 1997 crisis underlined that domestic savings tend to be less footloose thanforeign savings, and that domestic currency financing is less exposed to foreign currency risk.As domestic savings become scarcer, their efficient allocation becomes more necessary. Asgovernment functions become more complex, the delegation of resource allocation and riskassessment becomes more important. For all these reasons, the contribution of the domesticfinancial sector to infrastructure development needs to grow.
Government will obviously play an important role in domestic financial sector regulation andencouraging financial innovation, as well as in promoting regional capital market initiatives. Incountries where the policy – or quasi-fiscal - role of the financial sector has led to high levels ofnon-performing loans to infrastructure, commercialization of the sector will be a high priority inthe near term. That will restore health to the financial sector and financial discipline to theinfrastructure sector.
But to promote the financial sector’s contribution most effectively over the long-term, policies toimprove the investment climate for infrastructure should take the highest priority. Trying tomake a bad infrastructure project work through financial engineering can have only limitedeffect; making it into a good project through reform beyond the financial sector will usually havemuch greater impact.
The development community is now reasserting its role in infrastructure in East Asia. Butinfrastructure is a long-term asset, and development partners need to stay for the long haul.Reliable partnership – with quick response and harmonized procedures – is critical. Moreover,the nature of this partnership (financing, guarantees, policy advice, capacity building etc.) willhave to be tailored to country conditions. The needs of East Asia’s large, middle-incomecountries are very different from the smaller and poorer countries in the region.
Official development assistance (ODA) accounts for only 1.2 percent of gross investment in lowand middle income countries of East Asia. However, aid financing plays a much moresignificant role in the poorer countries of the region, accounting for more than half of grossinvestment in Mongolia and Cambodia. Aid flows also play a significant role in most PacificIsland countries, Timor Leste, Papua New Guinea and Lao PDR. The level of aid, and how it isallocated (including the share for infrastructure), plays a big role in the public spending andinvestment priorities of these countries.
The case for official financing obviously depends on how well it can be used, the availability ofother sources of financing, and the overall debt position of the government. The level of aid
11. Local capital markets matter – but are not a panacea
12. Infrastructure needs reliable and responsive development partners

The Way Forward
175
usually declines, and the blend of loans and grants usually becomes harder, as income levels risein recipient countries. However, even higher-income countries may see benefits in tappingofficial financing to ease the debt burden on their budget and to catalyze private sources offunds. The technical assistance embedded in aid-financed projects – for project preparation,environmental and social assessments, and procurement practices – can also be beneficial forshaping the government’s overall policies and procedures.
During the 1990s, some key development partners in East Asia refocused their efforts away frominfrastructure, at least from infrastructure on a large scale. It was felt that poverty reductionshould be more targeted or that the private sector would step in to finance infrastructure projects.This tendency was intensified by the 1997 financial crisis, as the creditworthiness of affectedcountries and many infrastructure service providers declined. Aid financing in crisis-affectedcountries shifted to program support, as budgets were cut and new investments in infrastructurewere sharply curtailed.
The role of official financing for infrastructure is now being reappraised. It is acknowledged thatgrowth is crucial to poverty reduction, that targeting complements growth, and that infrastructureis essential for both. The private sector did step in, then partly stepped out, and may step back inagain. But even when it was at its peak, it was still a relatively minor player in financing terms,especially in the poorer countries of the region, and official financing could be helpful forcatalyzing private investment anyway. Some countries are now emerging from fiscalcompression and need official financing to catalyze both the private sector and provide morefiscal space for infrastructure spending. Support for more complex projects and new approachescan be particularly valuable.
As official financing for infrastructure increases again, it’s important that it is used in a way thatmaximizes development impact. In the past, infrastructure projects have not always been welllinked to a country’s overall development and poverty reduction strategy. Aid must be used tosupport (rather than undermine) good policies. In some cases, this may mean funding sectoralprograms, including recurrent spending for operations and maintenance and even subsidies. Thebroader impact of large-scale projects on government revenues must also be taken into account(as we saw in the case of Nam Theun 2, Chapter 4, Box 4.6).
Some development agencies can also provide instruments to back up government commitmentsto the private sector, at a time when credibility with the private sector is still being established(e.g. guarantees, insurance, official lending to the private sector). The overall case for the use ofthose instruments depends on a number of factors: First, the economic justification for theproject; second, the proper allocation of risks between stakeholders and the ability to structurethe guarantee so as to strengthen rather than dilute operators’ incentives to deliver; and third, arobust budget framework for managing any contingent liabilities arising from governmentcommitments.
However, in no case should such instruments substitute for good policies. Sound policies canreduce risks and demonstrate the government’s commitment to reform. They are therefore morevaluable to investors than official agency support per se.

The Way Forward
176
Finally, development agencies can provide important knowledge on what works and whatdoesn’t work in different countries and sectors. Some of this knowledge comes from higherincome countries that have been there before – and learnt from their mistakes and successes. It’stherefore important that countries like Singapore and South Korea stay engaged with the broaderdevelopment community.
The type of knowledge needed will also vary by country – from basic institution and capacitybuilding in poorer countries to more sophisticated market instruments in middle-incomecountries. For the latter, innovative ways are needed to mix up private and public financing toextend maturities for long gestation projects. New approaches to developing financingmechanisms at sub-sovereign levels also need special attention.
The Way Forward
177
Spotlight 4: The Way Forward in Indonesia
Indonesia is emerging from a period of fiscal consolidation and political turmoil with a renewedcommitment to addressing a number of delayed development priorities. Infrastructure has beenidentified as one of these priorities, and many of the issues identified in this report are playingout in Indonesia today.
In January 2005 the government held an “Infrastructure Summit” to launch its strategy for thecoming years. The Jakarta Declaration, issued at the end of the Infrastructure Summit, affirmsthe Government’s confidence that this challenge can be met – but only if the public and privatesectors come together now in a strengthened partnership to overcome obstacles to infrastructureprovision.
To this end, the Government underscored its commitment to implementing the necessary reformsto boost the private sector’s involvement in infrastructure in Indonesia – including reforms tolevel the playing field and improve regulatory frameworks and create a climate of predictability.The private sector pledged to behave responsibly, operate transparently, and use their knowledgeand expertise to improve the quality of infrastructure investment in Indonesia.
The international community, including bilateral donors and major development banks,commended the Government’s determination and commitment to accelerate ongoing policyreform in key sectors to foster a new generation of infrastructure development in Indonesia – onein which the private sector will be an integral and long-term partner. Together they are expectedto contribute between US$10-15 billion to support infrastructure development over the next fiveyears.
The main thrusts of this agenda are summarized below.
Increasing spending on infrastructure while maintaining macroeconomic stability.
Indonesia is fortunate that the budget adjustment implemented by the Government over the pastfive years has restored fiscal discipline and opened the possibility of more fiscal space forspending on infrastructure. The role of fiscal policy is now shifting from “the guardian ofmacroeconomic stability through fiscal consolidation” to “supporter of high quality growth”.However, for this to be done in a prudent manner, the Government will have improve revenuemobilization over the medium term.
Prudent fiscal policy will have to be matched with prudent monetary policy – which allowssound projects to be financed, but does not lead to pressure for state banks to lendindiscriminately in the name of infrastructure. Higher public spending on infrastructure will alsohave to be matched by institutional capacity to evaluate project proposals and assess spendingtrade-offs.

The Way Forward
178
Re-attracting private investors and operators in infrastructure.
Improving the overall investment climate is the key pre-requisite to achieve this objective. Thiswill entail tackling a number of challenging issues. Tariff increases are urgent in the watersupply and sanitation sector while, in the transport sector, the Government will have toprogressively eliminate the huge fuel subsidies that exist at present. Regulatory reforms need tobe strengthened: the embryonic telecommunications agency needs to be turned into a competentand autonomous regulator; regulatory bodies, as proposed in recent legislation, need to beestablished and start working for oil and gas and electricity.
The Government needs to build upon the momentum obtained through the adoption of newprocurement regulations to step up efforts to defeat corruption. Finally, a guarantee frameworkstating when and how public support will be extended to private infrastructure projects would goa long way to clarifying key rules of the game for private investors and operators.
Tackling remaining issues associated with the decentralization process.
With decentralization, responsibility for implementing many types of infrastructure projects hasshifted to local governments in Indonesia. However, as yet, this responsibility has not beenmatched by their financial and institutional capacity. In addition, mechanisms for coordinatingthe actions of local governments are currently lacking.
Greater clarity in the responsibilities and resources of different levels of government fordelivering infrastructure services, a stronger provincial role to ensure better coordinationbetween local governments, and effective capacity building at the local level would go a longway to improving the institutional framework for infrastructure development.
The challenge now is to sustain the momentum of the Summit and follow through on theGovernment’s commitments. Some early actions have already been taken to clarify theframework for government guarantees and to issue a number of new regulations designed to easerestrictions and pave the way for greater private sector participation in infrastructure investment.However, much more needs to be done to put in place a clear vision of the Government’sapproach in each sector, along with issuing commensurate policies and laws.
All participants recognized and accepted that it would take time to put all the prerequisites inplace for stronger private participation in Indonesian infrastructure development. Therefore, itwas proposed that the Government could start to gain credibility among private investors byimplementing some demonstration transactions through a fair and transparent process. Thesetransactions could also serve to apply the new risk management framework, and the lessonslearned from the experience can be used to make necessary adjustments for subsequenttransactions.

Statistical Annex: Infrastructure Indicators
A- 1
Statistical Annex: Infrastructure Indicators
Introduction
Table 1. Energy
Table 2. Water Supply and Sanitation
Table 3. Telecommunications
Table 4. Road Transport
Table 5. Rail Transport
Table 6. Urban
Table 7. Infrastructure Finance
Technical Notes

Statistical Annex: Infrastructure Indicators
A- 2
Introduction
This statistical annex is intended to provide an overview of the state of economic infrastructure in themain developing countries of East Asia. It contains for selected years information on stock, access,affordability, efficiency, the state of reform, and financial performance of the Energy, Water Supply andSanitation, Telecom, and Transport sectors. In addition, the annex also presents figures on Urban issuesand rough estimates of infrastructure investment. The annex is comprised of 7 tables and 165infrastructure indicators.
Data Collection
The annex attempts to present the most relevant data needed to assess infrastructure. Because the officiallenders’ and donors’ primary business is to provide lending and advice to low and middle incomecountries, the annex focuses on the main client countries in the region. The majority of this data is on thenational level, the exception being Water Supply and Sanitation indicators, some of which are at the city,urban, or rural level. Virtually all of the data was collected using publicly available sources, includingpublications and internet websites from development institutions, sector-specific international agencies,and national statistical offices. In some cases, data was also collected through conversations with nationalgovernment agencies or World Bank sector specialists and reports. This data set was collected inWashington, D.C. and in World Bank field offices.
Reliability and Comparability
Data collected from publicly available, country-specific sources are always subject to reliability andcomparability issues. These inconsistencies arise from a number of factors, including differences inclassifications, definitions, and coverage across countries. Given these inevitable challenges, even thoughall efforts were made to verify the data in this annex and note any definitional peculiarities by local WorldBank staff and consultants, care must be taken when analyzing these indicators. It is impossible tocompletely guarantee the validity of the data presented, though the figures are current best estimates ofthe indicators presented. In some instances, available data deemed to be too unreliable was excludedfrom the annex. A complete list of indicator definitions, along with any definitional discrepancies ornotes needed to correctly interpret the data by country, is available in the technical notes section. Readersare strongly encouraged to consult the technical notes when interpreting the figures presented in thisannex. More detailed information, including the data set for all available years along with sources foreach figure, can be found on the EAP Infrastructure Flagship website located at:http://lnweb18.worldbank.org/eap/eap.nsf/0/11BB5BBB5C35E03D85256EB6004EFF2E?OpenDocument
Key
Units are provided in the tables next to the indicator name. In addition, a number of notations that arepresent in the tables require further explanation, including:
.. Not available
0.0 Less than half the unit shown
* See notes on the figure(s) in the technical annex
Figures in italics indicate data that are for years or periods other than those specified, or data that iscomprised of figures from years other than those specified (e.g. the sum of data from other year.

Statistical Annex: Infrastructure Indicators
A- 18
Technical Notes
Energy
E1: Household with an electricity connection – Electricity access at the household level. It comprisescommercially sold electricity, both on-grid and off-grid. It also includes self-generated electricity forthose countries where access to electricity has been assessed through surveys by government orgovernment agencies. The data do not capture unauthorized connections.
• Country Notes i. China- Areas covered by the State Grid Corporation
E2: Households using Solid Fuels - The percentage of households using solid fuels, which includewood, straw, dung, coal, and charcoal.
• Country Notes i. China- Figure is for urban households only. 95 percent of rural households use
solid fuels.
E3: Spending on energy services - The average share of total household expenditure spent of energyservices.
• Country Notes i. Cambodia- Urban areas only; figure ranges from 12 percent to 30 percent ii. Lao PDR- 1.4 percent for urban areas, 0.6 percent for rural areas iii. Mongolia – All utilities, not just energy iv. Thailand – Electricity only
E4: Hours of power outages from public grid - The number of hours of service interruptions in a year.• Country Notes
i. Lao PDR – Vientiane area only
E5: Average residential electricity tariff - The national average residential electricity tariff.• Country Notes
i. Cambodia- Phnom Penh only ii. China - There is no available weighted average for the country. It has not
changed much in the last five years, though it increased slightly in 2003. iii. Philippines – Manila area only iv. Vietnam – 1998 figure includes tax, 2003 figure does not include tax
E6: Average industrial electricity tariff - The national average industrial electricity tariff.• Country Notes
i. Cambodia – Phnom Penh only ii. China - There is no available weighted average for the country. The figure is for
the general industry. It is much lower for the heavy industry. iii. Philippines – Manila area only iv. Vietnam – 1998 figure includes tax, 2003 figure does not include tax
E7: Transmission and distribution losses - Technical and non-technical losses. Includes electricitylosses due to operation of the system and the delivery of electricity as well as those caused by unmeteredsupply. This comprises all losses due to transport and distribution of electrical energy and heat.
• Country Notes i. Cambodia – Phnom Penh only ii. China – This is the average for the State Grid. It does not include losses in some
counties which own their own distribution companies.
Statistical Annex: Infrastructure Indicators
A- 19
iii. Lao PDR – 1998 figure for Region 1 only, 2003 figure for entire country
E8, E14, E20, E26, E32: Power, Oil, or Gas: Has the utility (state owned enterprise) beencommercialized and corporatized? - This first step of reform involves (1) the removal of the utilityfrom the direct control that results from being a part of a ministry and (2) the creation of an independentlegal corporation with the goal of behaving like a commercial company (e.g. maximizing profits).
E9, E15, E21, E27, E33: Power, Oil, or Gas: Has an 'Energy Law' been completely passed byParliament (a law that permits the creation of a sector that could be unbundled and/or privatized inpart or whole)? - This second step is crucial to allowing the sale of a state utility to the private sector. Itshould be noted that the question specifically asks whether the law is completely passed, since manycountries have started the process of drafting and validating a new law but have not enacted it, despite thepassage of a considerable period of time.
• Country Notes i. Indonesia – Yes for power sector, but Law was annulled by the Constitution
Court
E10, E16, E22, E28, E34: Power, Oil, or Gas: Has a regulatory body that is separate from the utilityand ministry started work? - Note that the question focuses only on those cases where the regulatorybody is actually in place.
• Country Notes i. Indonesia – Yes for power sector, but Law was annulled by the Constitution
Court
E11, E17, E23, E29, E35: Power, Oil, or Gas: Has there been any private sector investment ongreenfield sites in operation or under construction? - A greenfield site refers to the construction of anentirely new plant, rather than the change in ownership of an existing plant or extension of capacity at anexisting plant.
E12, E18, E24, E30, E36: Power, Oil, or Gas: Has the core state owned utility beenrestructured/separated? - Restructuring/separation results in separate generation, transmission, anddistribution entities.
• Country Notes i. Indonesia – Upstream oil and gas sector currently undergoing restructuring
E13, E19, E25, E31, E37: Power, Oil, or Gas: Has any of the existing state owned enterprises beenprivatized (including outright sale, voucher privatization, or joint ventures)? - This question askswhether there is some privatization, not whether the sector has been completely privatized. To this extentit treats as equal those cases where the state has sold a minority of shares in a company to privateshareholders, and cases where the whole of a generating plant or regional distribution network have beensold outright to a single owner. Hence the answer must been seen as measuring whether the country hasproved itself willing to permit private ownership of previously state-owned assets, rather than measuringthe extent of private ownership.
Water supply and sanitation
W1: Access to Improved Water Services - "Improved" water supply technologies are: householdconnection, public standpipe, borehole, protected dug well, protected spring, and rainwater collection.Availability of at least 20 liters per person per day from a source within one kilometer of the user'sdwelling. "Not improved" are: unprotected well, unprotected spring, vendor-provided water, bottled water

Statistical Annex: Infrastructure Indicators
A- 20
(based on concerns about the quantity of supplied water, not concerns over the water quality), and tankertruck-provided water.
W2: Urban Access to Improved Water Services – See W1 above; limited to urban population only
W3: Rural Access to Improved Water Services - See W1 above; limited to rural population only
W4: Access to Improved Sanitation Services - "Improved" sanitation technologies are: connection to apublic sewer, connection to septic system, pour-flush latrine, simple pit latrine, ventilated improved pitlatrine. The excreta disposal system is considered adequate if it is private or shared (but not public) and ifhygienically separates human excreta from human contact. "Not improved" are: service or bucket latrines(where excreta are manually removed), public latrines, latrines with an open pit.
W5: Urban Access to Improved Sanitation Services - See W4 above; limited to urban population only
W6: Rural Access to Improved Sanitation Services - See W4 above; limited to urban population only
W7: Spending on Water Services - Average share of total household expenditure spent of water services• Country Notes
i. Cambodia – Urban residents only ii. Indonesia – PDAM customers in Jakarta and Bandung pay between 1-2 percent
of average annual income on water, while in areas not served by PDAMs surveyshave found some of the poorest household spending 16-33 percent.
iii. Lao PDR – Public utility connection only; households without a connectionspend 1.4 percent
ii. Mongolia – All utilities, not just WSS
W8: Average Volume of Water Used - Volume of water used from all sources• Country Notes
i. Indonesia – Low income PDAM customers use about 3.8 m3/week; the samefigure for high income customers is 9.6 m3/week
W9: Average water tariff from water utility - The average water tariff of water sold from main utilityin the specified city
• Country Notes i. Manila – The two main providers are MWCI and MWSI
W10 – W11: Average water tariff from alternative sources 2 and 3 - The average water tariff of watersold from alternative sources in the specified city
• Country Notes i. Manila – Source 2 is water vendors reselling MWSS water ii. Phnom Penh – Source 2 is private networks pumping untreated water from rivers,
Source 3 is further treated PPWSA water sold as bottled water iii. Ho Chi Minh – Source 2 is tankers, Source 3 is bottled water iv. Jakarta – Source 2 is private tankers, Source 3 is bottled water from refilling
stations v. Ulaanbaatar – Source 2 is bottle water vi. Vientiane, Savannakhet – Source 2 is 20 liter bottles, Source 3 is 1L drinking
water bottles
W12: Average sanitation tariff - The average sanitation tariff from main utility in the specified city

Statistical Annex: Infrastructure Indicators
A- 21
W13: Percentage of Utility Service Area with 24 hour Supply - Percentage of the population served bymain utility in the specified city with a 24 hour supply
W14: Working Ratio - Operating cost divided by operating revenue for main utility in the specified city
W15: Staff Ratio - Number of staff divided by thousands of connections for main utility in the specifiedcity
• Country Notes i. Mongolian cities – Connections in Mongolia are bulk connections
W16: Collection Rate - Collections divided by billings for main utility in the specified city
W17: Average Revenue Per m3 Produced - Total revenue divided by total water production for mainutility in the specified city
W18: Type of Sewerage Treatment - Type of treatment process for wastewater in the specified city
W19: Type of Water Supply Treatment - Type of treatment process for water supply in the specifiedcity
W20: Water Volume Billed per Connection - Total volume of water billed divided by the total numberof connections for the main utility in the specified city
• Country Notes i. Beijing – Each connection serves approximately 35 people ii. Ulaanbaatar, Darkhan – Each connection serves approximately 260 and 113
people, respectively
Telecoms
T1: Cellular Subscribers per 100 inhabitants - Calculated by dividing the number of cellular mobilesubscribers by the population and multiplying by 100.
T2: Main Lines per 100 inhabitants - Calculated by dividing the number of main lines by thepopulation and multiplying by 100.
T3: Total telephone subscribers per 100 inhabitants – Calculated by summing cellular subscribers per100 inhabitants and main lines per 100 inhabitants.
T4: Internet users per 100 inhabitants - Calculated by dividing the number of internet users by thepopulation and multiplying by 100.
T5: Telephone faults per 100 main lines - This is calculated by dividing the total number of reportedfaults for the year by the total number of main lines in operation and multiplying by 100. The definitionof fault can vary. Some countries include faulty customer equipment. Others distinguish between reportedand actual found faults. There is also sometimes a distinction between residential and business lines.Another consideration is the time period as some countries report this indicator on a monthly basis; inthese cases data are converted to yearly estimates.
T6: Price of analog cellular 3 minute call - Cellular cost of 3-minute local peak call.

Statistical Annex: Infrastructure Indicators
A- 22
T7: Analog cellular monthly subscription charge - Cellular monthly subscription refers to the recurringcharge for a cellular subscriber. The charge should cover the rental of the line but not the rental of theterminal (e.g., telephone set) where the terminal equipment market is liberalized. In some cases, the rentalcharge includes an allowance for free or reduced rate call units. If there are different charges for differentexchange areas, the largest urban area is used.
T8: Price of three minute local call - Local call refers to the cost of a peak rate 3-minute call within thesame exchange area using the subscriber's own terminal (i.e. not from a public telephone).
T9: Residential monthly telephone subscription - Residential telephone monthly subscription refers tothe recurring fixed charge for a residential subscriber to the Public Switched Telephone Network (PSTN).The charge should cover the rental of the line but not the rental of the terminal (e.g., telephone set) wherethe terminal equipment market is liberalized. In some cases, the rental charge includes an allowance forfree or reduced rate call units. If there are different charges for different exchange areas, the largest urbanarea is used.
T10: Residential telephone connection charge - Installation refers to the one time charge involved inapplying for basic telephone service for residential purposes. Where there are different charges fordifferent exchange areas, the charge is generally for the largest urban area.
T11: Waiting list for main lines - Un-met applications for connection to the PSTN which have had to beheld over owing to a lack of technical facilities (equipment, lines, etc.). This indicator refers to registeredapplications and thus may not be indicative of the total unmet demand.
T12: Mobile telecom revenue per subscriber - Calculated by dividing total mobile telecom revenue bythe number of mobile subscribers. Mobile telecom revenue includes revenues from the provision of alltypes of mobile communications services such cellular, private trunked radio and radio paging. Thenumber of mobile subscribers refers to users of portable telephones subscribing to an automatic publicmobile telephone service which provides access to the PSTN using cellular technology. This can includeanalogue and digital cellular systems but should not include non-cellular systems. Subscribers to fixedwireless (e.g., Wireless Local Loop), public mobile data services, or radio paging services are notincluded.
T13: Income per fixed line - Calculated by dividing total fixed line revenue by the number of main linesin operation. The revenue includes non-refundable connection charges, line rentals and local, nationallong distance and international call usage charges. It typically also includes revenue from publicpayphones. The treatment of interconnection and settlement payments varies across countries. Mostcountries include receipts as revenue; some include only billed revenues (not counting anyinterconnection or settlement payments) while others include net revenues (receipts-payments). A mainline is a telephone line connecting the subscriber's terminal equipment to the public switched network andwhich has a dedicated port in the telephone exchange equipment. This term is synonymous with the term"main station" or "Direct Exchange Line (DEL)" which are commonly used in telecommunicationdocuments. It may not be the same as an "access" line or a subscriber. The definition of access line usedby some countries varies. In some cases, it refers to the total installed capacity (rather than lines inservice. In other cases it refers to all network access points including mobile cellular subscribers.Telephone subscribers would not generally include public telephones which are included in main lines.
T14: Telecom revenue per staff - Calculated by dividing total telecom revenue by the total number offull-time telecom staff. The revenue refers to earnings from the direct provision of facilities for providingtelecommunication services to the public (i.e., not including revenues of resellers). This includes revenues

Statistical Annex: Infrastructure Indicators
A- 23
from fixed telephone, mobile communications, text (telex, telegraph and facsimile), leased circuits anddata communications services. Some countries include telecommunication-related revenue such asdirectory advertising and equipment rental or sales. Others include value-added telecommunicationservices such as the provision of electronic mail or on-line services. The denominator includes full-timestaff employed by telecommunication network operators in the country for the provision of publictelecommunication services. Part-time staff are generally expressed in terms of full-time staff equivalents.Some countries do not distinguish between staff working for the provision of telecommunicationsservices and those working in postal services.
Road transport
Rd1: Total road network - Kilometer length of the road network. The road network includes all roads ina given area.
• Country Notes i. Philippines – National, provincial, city, municipal, and barangay roads ii. Lao PDR – Includes 600 km of “special roads” that aren’t included in Rd2
through Rd5 iii. Mongolia – The Ministry of Road, Transport, and Tourism classifies roads
according to national and regional roads only. This figure does not include ruralroads.
Rd2: Motorways, highways, main, or national roads – Motorways include roads specifically designedand built for motor traffic, which does not serve properties bordering on it, and which: (a) is provided,except at special points or temporarily, with separate carriageways for the two directions of traffic,separated from each other, either by a dividing strip not intended for traffic, or exceptionally by othermeans; (b) does not cross at level with any road, railway or tramway track, or footpath; (c) is speciallysign-posted as a motorway and is reserved for specific categories of road motor vehicles. Entry and exitlanes of motorways are included irrespectively of the location of the signposts. Highways, main, ornational roads include kilometer length of A-level roads. A-level roads are roads outside urban areas andother roads outside urban areas. A-level roads are roads outside urban areas that are not motorways butbelong to the top-level road network. A-level roads are characterized by a comparatively high qualitystandard, either non-divided roads with oncoming traffic or similar to motorways. In most countries, theseroads are financed by the federal or national government.
Rd3: Secondary or regional roads - Kilometer length of roads that are the main feeder routes into, andprovide the main links between highways, main or national roads.
• Country Notes i. Indonesia – Provincial roads ii. Philippines – Provincial roads
Rd4: Other urban roads - Length of roads within the boundaries of a built-up area, which is an areawith entries and exists specially sign-posted as such.
• Country Notes i. Philippines – City roads ii. Mongolia – The national and regional network in Rd2 and Rd3 includes urban
roads
Rd5: Other rural roads - Length of all remaining roads in a country not included in categories Rd2,Rd3, and Rd4
• Country Notes i. Indonesia – Kabupaten roads

Statistical Annex: Infrastructure Indicators
A- 24
ii. Philippines – Municipal and barangay roads
Rd6: Total paved roads - Length of all roads that are surfaced with crushed stone (macadam) andhydrocarbon binder or bituminized agents, with concrete or with cobblestones. Aggregate of Rd7, Rd8,Rd9, Rd10
• Country Notes i. Lao PDR – Includes 55 km of paved “special roads” not captured in Rd7 though
Rd10
Rd7: Paved motorways, highways, main, or national roads - Length of highways, main, or nationalroads that are paved.
• Country Notes i. Cambodia – Includes national roads 1-7
Rd8: Paved secondary or regional roads - Length of secondary or regional roads that are paved.
Rd9: Paved other urban roads - Length of other urban roads that are paved.• Country Notes
i. Mongolia – A portion of these roads are national roads in urban areas and areincluded in Rd7
Rd10: Paved other rural roads - Length of other rural roads that are paved.
Rd11: Total roads in “good” or “fair” condition - Total length of roads that are in “good” or “regular”condition. 'Roads in good condition': Paved roads, largely free of defects, requiring only routinemaintenance and perhaps surface treatment. Unpaved roads which need only routine grading andlocalized repairs. 'Roads in regular (or fair) condition': Paved roads with defects and weakened structuralresistance. They require resurfacing of the pavement, but without the need to demolish the existingpavement. Unpaved roads, which require grading and additional new gravel, plus drainage repair in someplaces. Aggregate of Rd12, Rd13, Rd14, and Rd15
Rd12: Motorways, highways, main, or national roads in “good” or “fair” condition - Length ofhighways, main, or national roads in “good” or “fair” condition
• Country Notes i. Indonesia – 75 percent of the national and provincial network in “good” or “fair”
condition; assumes same percentage across both categories
Rd13: Secondary or regional roads in “good” or “fair” condition - Length of secondary or regionalroads in “good” or “fair” condition
• Country Notes i. Cambodia – Includes national B and provincial trafficable roads ii. Indonesia – 75 percent of the national and provincial network in “good” or “fair”
condition; assumes same percentage across both categories
Rd14: Other urban roads in “good” or “fair” condition - Length of other urban roads in “good” or“fair” condition
• Country Notes i. Lao PDR - Includes other rural and urban roads ii. Mongolia – These roads are national and regional roads in urban areas and are
included in those figures (Rd12 and Rd13)
Statistical Annex: Infrastructure Indicators
A- 25
Rd15: Other rural roads in “good” or “fair” condition - Length of other rural roads in “good” or“fair” condition
• Country Notes i. Indonesia – 38 percent of the kabupaten road network is in “good” or “fair”
condition
Rd16: Does an institution that advises the Minister on various matters pertaining to management[and financing] of roads, namely a National Roads Board (NRB) (or Road Council, HighwaysAgency Board) exist? – No definition needed
Rd17: Does the Main (National) Road Agency - responsible for the main road network - operatewith a report published at least on an annual basis? – No definition needed
Rd18: Main (National) Road Agency Administration Cost - The amount of resources spent by theMain (National) Road Agency in conjunction with its own operation and service per year.
Rd19: Annual road expenditure - The total amount of expenditure on new construction and extensionof existing roads, including reconstruction, renewal and major repairs of roads per year.
• Country Notes i. Lao PDR – National Roads only ii. Indonesia – Government expenditure only (includes national, provincial, district,
and toll roads) iii. Philippines – Includes national and local roads iv. Thailand – Highway department only
Rd20: Capital investment - The total amount of investment in the road sector to maintain sufficientcapacity as well as increase capacity per year.
• Country Notes i. China – Capital investment in highway construction; does not include urban
roads, which are under the jurisdiction of the Ministry of Construction ii. Indonesia – Government expenditure only (includes national, provincial, district,
and toll roads) iii. Lao PDR – National Roads only iv. Philippines – Includes national and local roads
Rd21: Maintenance expenditure - The total expenditure for keeping roads in working order per year.This includes maintenance, patching, and running repairs (work relating to roughness of carriageway’swearing course, roadsides, etc.)
• Country Notes i. Cambodia – Includes all costs other than capital investment ii. Indonesia – Government expenditure only (includes national, provincial, district,
and toll roads) iii. Lao PDR – National Roads only iv. Philippines – Includes national and local roads
Rd22: Road maintenance requirement - The amount of financing required per year to keep roads inworking order. This includes maintenance, patching, and running repairs (work relating to roughness ofcarriageway’s wearing course, roadsides, shoulder, drains, structures, slopes, signs, etc.)

Statistical Annex: Infrastructure Indicators
A- 26
Rd23: Total daily traffic - Total number of road motor vehicles that move on a given network per day.When a road motor vehicle is being carried on another vehicle, only the movement of the carrying vehicle(active mode) is considered.
• Country Notes i. Mongolia – Calculated by multiplying the average traffic flow over 11121 km of
the road network
Rd24: Daily traffic on motorways, highways, main, or national roads - Total average daily roadmotor vehicle traffic on main/national highways
• Country Notes i. Mongolia – Calculated by multiplying the average traffic flow over 1720 km of
the main national road network (UB-Darhan, UB-Zuunmod, UB-Lun, UB-Baganuur)
Rd25: Daily traffic on secondary or regional roads - Total average daily road motor vehicle traffic onsecondary/regional highways
Rd26: Number of rural people living within 2 km of an all-season road - “With access” means thatthe distance from a village or household to an all-season road is no more than 2 km; that is that a walk ofno more than 20 minutes or so is required to reach an all-season road. An “all-season road” is a road thatis motorable by the prevailing means of rural transport (often a pick-up or a truck which does not havefour-wheel-drive) all year round. Predictable interruptions of short duration during inclement weather(e.g. heavy rainfall) are permitted, particularly on low volume roads.
• Country Notes i. Thailand – Percentage of rural villages, not number of people
Rd27: Are there clear and reasonable processes for transport operators to be legally able to deliverdifferent forms of transport service in a competitive manner? – No definition needed
• Country Notes i. Cambodia – Bidding processes are in place though real competition is doubtful
Rd28: Are road construction works and road traffic measures subject by law to a thoroughappraisal (at least equivalent to the standards required for WB investment) of environmentalimpact and monitoring? – No definition needed
• Country Notes i. Cambodia – Decree is in place though implementation is doubtful ii. Indonesia – Processes in place though implementation is doubtful
Rd29: Is there a government endorsed plan to improved road safety, which is published and beingactively implemented? – No definition needed
• Country Notes i. China – A new road safety law has been passed on Oct. 28, 2003 and
implemented in May 2004
Rd30: Number of Fatalities from Road Accidents - Number of people who were involved in any injuryaccident with at least one motor road vehicle in motion on a public road or private road to which thepublic has right of access, resulting in at least one person killed as a result of the accident and within 30days of its occurrence. Included are: collisions between road vehicles; between road vehicles andpedestrians; between road vehicles and animals or fixed obstacles and with one road vehicle alone.Included are collisions between road and rail vehicles. Multi-vehicle collisions are counted as only one
Statistical Annex: Infrastructure Indicators
A- 27
accident provided that any successive collisions happen at very short intervals. Injury accident excludesaccidents incurring only material damage.
Rd31: Are road construction works and road traffic measures subject by law to a thoroughappraisal (at least equivalent to the standards required for WB investment) of social impact andmonitoring? – No definition needed
Rail transport
Rl1: Total Network - Total length of railway route open for public passenger and freight services (exl.dedicated private resource railways) Aggregate of Rl2, Rl3
Rl2: Main lines - Total length of main inter-city and other main passenger and freight routes available forpublic services
Rl3: Secondary lines - Total length of remaining passenger and freight routes available for publicservices
Rl4: Single lines - Route length of network consisting of single tracked lines
Rl5: Traffic units – Aggregate of Rl6 and Rl7
Rl6: Passenger travel - Total passenger travel measured in units of one passenger by one kilometer
Rl7: Freight coverage - Total freight travel measured in units of one metric ton by one kilometer
Rl8: Railway Diesel Fuel Consumption - Fuel used for powering trains and other rolling stockmovements
Rl9: Railway Electrical Energy Consumption - Electrical energy used for powering trains and otherrolling stock movements
Rl10: Is the main national railway company predominantly private (including private concession)rather than publicly owned? – Anything above 50 percent is considered predominant
Rl11: If public, is the national railway company a corporatised commercial entity rather than agovernment department authority? – This step of reform include (1) the removal of the entity from thedirect control that results from being a part of a ministry and (2) the creation of an independent legalcorporation with the goal of behaving like a commercial company (e.g. maximizing profits).
Rl12: Is there institutional vertical separation of infrastructure and operations? – No definitionneeded.
Rl13: Are there track access rights for private train operating companies? - No definition needed.
Rl14: Passenger fare revenue - No definition needed.
Rl15: Freight tariff revenue - No definition needed.
Rl16: Other commercial revenue – Other revenue may include interest income, scrap sales, real estate,etc
Statistical Annex: Infrastructure Indicators
A- 28
Rl17: Passenger yield - Total passenger fare revenue divided by total passenger-km
Rl18: Freight yield - Total freight tariff revenue divided by total tonne-km
Rl19: Is there a safety regulator independent of the railway operating department or authority? –No definition needed.
Rl20: Is there a formal safety case or safety plan which is fully documented and regularly updated?- No definition needed.
Rl21: Number of Passenger fatalities - No definition needed.• Country Notes
i. Mongolia – Figure according to the UB Railway Authority, but this type of datais considered confidential
Rl22: Number of Serious incidents – See country specific definitions below.• Country Notes
i. China – Includes derailments, collisions, and incidents involving humancasualties
ii. Mongolia – Figure according to the UB Railway Authority, but this type of datais considered confidential
iii. Philipppines – Incidents include derailment and sideswiping incidents iv. Thailand – Derailment or collision that causes large damage or human casualties v. Vietnam – Vietnam Railways defines "serious rail incident" as an incident that
Vietnam Railways responsible for and that it causes huge damages includinghuman damage
Rl23: Are road construction works and road traffic measures subject by law to a thoroughappraisal (at least equivalent to the standards required for WB investment) of environmentalimpact and monitoring? - No definition needed.
Rl24: Are road construction works and road traffic measures subject by law to a thoroughappraisal (at least equivalent to the standards required for WB investment) of social impact andmonitoring? - No definition needed.
Urban
U1: Slum Population - The definition of a slum varies widely, but they are generally neglected parts ofcities where housing and living conditions are appallingly poor. Slums range from high density, squalidcentral city tenements to spontaneous squatter settlements without legal recognition of rights, sprawling atthe edge of cities. UN Habitat’s publication "Slums of the World," which defines a slum household as agroup of individuals living under the same roof that lack one or more of the following conditions:insecure residential status, inadequate access to safe water, inadequate access to sanitation, poor structuralquality of housing and overcrowding.
• Country Notes vi. Mongolia – Share of households living in ger
U2: Urbanization Rate - Urban Population as a percentage of the total population• Country Notes
vii. Cambodia – PNH municipality only

Statistical Annex: Infrastructure Indicators
A- 29
U3: Annual Growth Rate of Urban Population - Percentage growth rate of the urban population• Country Notes
viii. Cambodia – PNH municipality only
U4 – U7: Number of Urban Cities – Urban area defined by densely populated area containing the cityproper; suburbs, and continuously settled commuter areas
U8: Percentage of housing stock built of materials lasting 20 years or more – Materials lasting at least20 years include cement, brick, iron, tile, etc
• Country Notes i. Cambodia – Based of roof material only ii. Mongolia – Gers not included in housing stock
U9: Percentage of housing stock built and managed by public sector– No definition needed
U10: Number of months to obtain permits for land subdivisions– No definition needed
U11: Percentage of Solid Waste Collected – Municipal solid waste collected as a percentage of what isgenerated
• Country Note iii. Cambodia – Downtown areas of Phnom Penh only iv. Lao PDR – Includes urban residents only v. Mongolia – Best estimate for Ulanbaatar only vi. Philippines – Metro Manila only
U12: Percentage of Solid Waste Safely Disposed - Municipal solid waste safely disposed (sanitarylandfill, incinerated, and/or recycled) as a percentage of what is generated
• Country Notes vii. Lao PDR – Includes urban residents only viii. Mongolia – Best estimate for Ulanbaatar only ix. Philippines – Metro Manila only
Finance
F1 – F6: Total Expenditure on Infrastructure – Includes available capital and current expenditure ontransportation, telecommunications, water supply and sanitation, power, and other urban (solid waste,housing, etc) from national government, local government, SOEs, and private sources. The totalspresented are simply the sum of the components under F7 through F25. Thus, any figures not availablefrom F7 through F25 are also omitted in the total. Further, the available data in F7 through F25 may befrom years other than those specified (denoted by italics) or have omissions/additions themselves(denoted by an asterisk next to the figures in that section). Given these limitations, the figures presentedcan be interpreted as a broad estimate of the true amount spent on infrastructure.
F7 – F11: National Government Expenditure on Infrastructure - Includes capital and currentexpenditure on transportation, telecommunications, water supply and sanitation, power, and other urban(solid waste, housing, etc) from national government unless otherwise specified below.
• Country Notes – i. Cambodia – Telecom includes actual (current) expenditures incurred by Ministry
of Post and Telecommunications. No figures on capital expenditure available.

Statistical Annex: Infrastructure Indicators
A- 30
WSS figures are capital expenditures only. Power figures are currentexpenditures incurred by MIME.
ii. China – Although Telecom and WSS expenditure are not available, mostexpenditure in these sectors come from SOEs.
iii. Indonesia – Transport figures include Transportation, Meteorology andGeophysical sector; WSS figures include water and irrigation; Telecom figuresinclude Tourism, Post, and Telecom (but most expenditures are on telecom)
iv. Lao PDR – Road expenditure only v. Mongolia – Calculation based on fiscal data and GDP composition by sectors; F7
includes telecom vi. Philippines – all figures include capital outlays only, Power figures include other
energy also vii. Vietnam – F7 figures include investment by central and local Government and
SOEs for Transport, Storage, Telecommunications. F9 figures includeinvestment by central and local Government and SOEs for electricity, gas, andwater. Investment outlays are the total expenditure to achieve the goal ofinvestment and include expenditure on investigation for construction planning,preparation of investment, expenditure on design and construction, purchase ofequipment and other
F12 – F16: Local Government Expenditure on Infrastructure - Includes capital and currentexpenditure on transportation, telecommunications, water supply and sanitation, power, and other urban(solid waste, housing, etc) from local government (non-central government) unless otherwise specifiedbelow.
• Country Notes i. Cambodia – Available figures are actual current expenditures spent by the
provincial department only. ii. China – Transport includes urban transport capital construction iii. Indonesia – Transport figures include Transportation, Meteorology and
Geophysical sector; WSS figures include water and irrigation; Telecom figuresinclude Tourism, Post, and Telecom (but most expenditures are on telecom)
iv. Mongolia – Calculation based on fiscal data and GDP composition by sectors v. Philippines – all figures include capital outlays only, Power figures includes
other energy also
F17 – F21: SOE Government Expenditure on Infrastructure - Includes capital and currentexpenditure on transportation, telecommunications, water supply and sanitation, power, and other urban(solid waste, housing, etc) from SOEs unless otherwise specified below.
• Country Notes i. China – Telecom and WSS data includes capital construction only ii. Lao PDR – EdL only, 1998 power figure excludes investment (includes operating
costs only) iii. Philippines – all figures include capital outlays only
F22 – F25: Private Investment in Infrastructure – Includes planned disbursements in assets andfacilities based on financial closure year.
• Country Notes i. Vietnam – F22 figures include non-state and foreign investment outlays for
Transport, Storage, Telecom. F24 figures include non-state and foreigninvestment outlays for electricity, gas, and water. Investment outlays are thetotal expenditure to achieve the goal of investment and include expenditure on

Statistical Annex: Infrastructure Indicators
A- 31
investigation for construction planning, preparation of investment, expenditureon design and construction, and purchase of equipment
F26: Total Local Government Expenditures - Total local government expenditures as a share of totalpublic expenditures
• Country Notes i. Cambodia – Current expenditure only
F27: Total Local Government Revenues - Total local government revenues as a share of total publicrevenues

Statistical Annex: Infrastructure Indicators
A- 32
Statistical Annex: Infrastructure Indicators
B- 1
References
African Forum for Utility Regulation.2002. Background note on Regulatory Governance. Fourth Meeting: Pretoria, South Africa. November 5-7.
Andrews, Charles T. and Cesar E. Yniguez, eds. 2004. Water in Asian Cities: Utilities'Performance and Civil Society Views. Manila: Asian Development Bank.
APEC (Asia-Pacific Economic Cooperation). 2002. Deregulating Energy Markets inAPEC: Economic and Sectoral Impacts. Energy Working Group, Asia-Pacific Economic
Cooperation Secretariat with Abareconomics.
ADB (Asian Development Bank). 2004a. “Nam Theun 2 Hydroelectric Project in LaoPeople’s Democratic Republic.” Summary Environmental and Social ImpactAssessment.http://www.namtheun2.com/gallery/lib_sesia/SESIA%20Final%20Draft%20November%2004.pdf
_______. 2004b. Water in Asian Cities. Manila.
_______. 2002. Report and Recommendation of the President to the Board of Directorson a proposed loan to the Lao People's Democratic Republic for the Greater Mekong
Subregion: Northern Economic Corridor Project. Manila.
Aoyama, Shunsuke et.al. 1994. Japan’s Experience in Urban EnvironmentalManagement. Metropolitan Environment Improvement Program: World Bank andUNDP.
Bakovic, Tonci Bernanrd Tenenbaum, and Fiona Woolf. 2003. “Regulation By Contract:a New Way to Privatize Electricity Distribution?” Washington, D.C.: World BankWorking Paper Series No. 14.
Balisacan, Arsenio M. and Ernesto M. Pernia. 2002. “What Else Besides Growth Mattersto Poverty Reduction? Philippines.” Manila: Asian Development Bank ERPPolicy Brief Series 5. February.
Bardhan, Pranab and Dilip Mookherjee. 2003. “Decentralization and Accountability inInfrastructure in Developing Countries.” Boston University.http://www.bu.edu./econ/Working%20Papers/papers/Dilip%20Mookherjee/ddinf.pdf
Barnes, Douglas F. and Jonathan Halpern. 2000. “The Role of Energy Subsidies”. InEnergy and Development Report 2000. Washington, D.C.: The World Bank.http://www.worldbank.org/html/fpd/esmap/energy_report2000/
Briceno, Cecilia, Antonio Estache and Nemat Shafik. 2004. “Infrastructure Services inDeveloping Countries: Access, Quality, Costs and Policy Reform.” Washington,

References
B-2
D.C.: World Bank working Paper Series No. 3468.
Calderon, Cesar and Luis Serven. 2004. “The Effects of Infrastructure Development onGrowth and Income Distribution.” Washington, D.C.: World Bank Policy Research Paper 3400. October.
Canning, David. 1999. “The Contribution of Infrastructure to Aggregate Output.” Washington, D.C.: World Bank Infrastructure Working Paper No. 2246.
Canning, David. 1998. “A Database of World Infrastructure Stocks.” Washington, D.C.:World Bank Policy Research Working Paper 1929.
Canning, David. and Esra Bennathan. 2000. “The Social Rate of Return on InfrastructureInvestment.” Washington, D.C.: World Bank Policy Research Working Paper2390.
Carruthers, Robin, Jitendra N. Bajpai and David Hummels. 2003. “Trade and Logistics in East Asia: A Development Agenda.” Washington, D.C.: World Bank EASTRWorking Paper 3.
CLAIR (Council of Local Authorities for International Relations). 2004. “LocalAdministration of ASEAN Countries.” http://www.clair.or.jp/e/
______. 2000. “Local Administrative and Financial System in China.”http://www.clair.or.jp/e/
Clements, Benedict, Sanjeev Gupta, Alexander Pivovarsky, and Erwin R. Tiongson.2004. “Foreign Aid: Grants versus Loans.” Finance and Development. Washington,
D.C.: International Monetary Fund. September
Coelli, Tim, Antonio Estache, Sergio Perelman and Lourdes Trujillo. 2003. “A Primer onEfficiency Measurements for Utilities and Transport Regulators.” Washington,D.C.: World Bank WBI Development Studies.
Conan, Herve. 2004. “Small Piped Water Networks: Helping Local Entrepreneurs toInvest.” In Charles T. Andres and Almud Weitz, eds. Water for All. Manilla: AsianDevelopment Bank.
Consumer International. 2004. “Improving utilities: consumer organizations, policy andrepresentation.” Speech given by Marilena Lazzarini, CI President, at the WorldBank, Washington D.C. May 4.
Crousillat, Enrique. 1998. “Developing International Power Markets in East Asia.”Washington, D.C.: World Bank Public Policy for the Private Sector Note 143.
Dailami, Mansoor. 2004. “Korea PPI Market, Financing Sources, Growth Potential, and

References
B-3
New Challenges.” Washington, D.C.: The World Bank. Mimeo.
Demetriades, Panicos and Theofanis Mamuneas. 2000. “Intertemporal Output and Employment Effects of Public infrastructure Capital: Evidence from 12 OECD Economies.” The Economic Journal 110. 687-712.
Deolalikar, Anil B. 2001. “The Spatial Distribution of Public Spending on Roads inVietnam and its Implications.” Manila: Asian Development Bank. September.
Devarajan, Shantayanan , Vinaya Swaroop, and Heng-fu Zhou. 1996. “TheComposition of Public Expenditure and Economic Growth.” Journal of Monetary Economics 37 (2-3). 313-44.
DFID (Department for International Development). 2002. “Making Connections:Infrastructure for Poverty reduction.” London: DFID. http://www.dfid.gov.uk/pubs/files/makingconnections.pdf
Dupar, Mairi and Nathan Badenoch. 2002. “Environment, Livelihoods, and Local Institutions: Decentralization in Mainland Southeast Asia.: Washington D.C.: World Resources Institute.
Easterly, William and Luis Serven, eds. 2003. The Limits of Stabilization. Stanford:Stanford University Press.
Easterly, William. and Sergio Rebelo. 1993 “Fiscal Policy and Economic Growth: AnEmpirical Investigation.” Journal of Monetary Economics 32. 417-58.
Environmental Resource Management Ltd. “Contracting Out Utility RegulatoryFunctions.” Case Study. http://rru.worldbank.org/Documents/PapersLinks/2550.pdf
Eastache, Antonio. 2004. “Emerging Infrastructure Policy Issues in DevelopingCountries.” Washington, D.C.; World Bank. Background paper for the October Berlinmeeting of the POVNET Infrastructure Working Group.
Estache, Antonio and Maria Elena Pinglo. 2004. “Are Returns to Private Infrastructure inDeveloping Countries Consistent UIT Risks Since the Asian Crisis?” Washington,D.C.: World Bank Policy Research Working Paper 3373.
Estache, Antonio, and Marianne Fay. 1995. “Regional Growth in Argentina and Brazil:Determinants and Policy Options.” Washington, DC: The World Bank. Mimeo.
Evennet, Simon J. and Anthony J. Venables. 2001. “The Geographic Spread of Trade: Evidence From Twenty Four Developing Countries.” Processed. Munich: European Research Workshop in International Trade (ERWIT). June 12, 2002.
Faguet, J.P. 2004. “Does Decentralization Increase Government Responsiveness to LocalNeeds: Evidence from Bolivia.” Journal of Public Economics 88(3-4): 867-893.

References
B-4
Fan, Shenggen, Pham Lan Huong, and Trinh Quang Long. 2004. “Government spendingand poverty reduction in Vietnam.” Project report prepared for the World Bank funded project “Pro-poor spending in Vietnam”, by International Food PolicyResearch Institute, Washington DC, and Central Institute for EconomicManagement, Hanoi.
Fan, Shenggen. 2003. “Public Investment and Poverty Reduction: What Have we Learntfrom India and China.” Paper prepared for the ADBI Conference: “InfrastructureInvestment for Poverty Reduction: What Do We Know?” Tokyo, Japan: June 12-13.
Fay, Marianne and Tito Yepes. 2003. “Investing in Infrastructure: What is needed from 2000- 2010.” Washington, D.C.: World Bank Policy Research Paper 3102.
Fernald, J.G. 1999. “Roads to Prosperity? Assessing the Link between Public Capitaland Productivity.” The American Economic Review 89. 619-38.
Fritzen, Scott. 2002. “Growth, Inequality and the Future of Poverty Reduction inVietnam.” Journal of Asian Economics 13 (5). 635-657.
Gomez-Lobo, Andres, Vivien Foster and Jonathan Halpern. 2000. “InfrastructureReform, Better Subsidies, and the Information Deficit.” Washington, D.C.:World Bank Public Policy for the Private Sector Note 212.
Guasch, J Luis and J. Kogan. 2001. “Inventories in Developing Countries: Levels andDeterminants, a Red Flag on Competitiveness and Growth.” Washington, D.C.: The World Bank. Processed.
Guasch, J. Luis.2004. Granting and Renegotiating Infrastructure Concessions—Doing ItRight. Washington, D.C.: The World Bank.
GRIPS Development Forum. 2003. “Linking Economic Growth and PovertyReduction—Large Scale Infrastructure in the context of Vietnam’s CPRGS.”November.
Gross, Bruce, Christine van Wijk, and Nilanjana Mukhejee. 2001. “Linking Sustaiabilitywith Demand, Gender and Poverty.” International Water and Sanitation Centre.http://www.wsp.org/03_ParticipationGender.asp
GSO. Vietnam General Statistical Office.
Harris, Clive, John Hodges, Michael Schur, and Padmesh Shukla. 2003. “InfrastructureProjects: A Review of Canceled Private Projects.” Washington, D.C.: World Bank PublicPolicy for the Private Sector Note 252.http://rru.worldbank.org/Documents/PublicPolicyJournal/252Harri-010303.pdf

References
B-5
Hofman, Bert and Kai Kaiser. 2002. “The Making of the Big Bang and its Aftermath.” Paper presented at the conference: “Can Decentralization Help Rebuild Indonesia?” Georgia State University, May 1-3.http://isp-aysps.gsu.edu/fprc/ino/hofmankaiserAtlanta.pdf
Hunt, Sally. and Graham. Shuttleworth. 1996. Competition and Choice in Electricity. Chichester, U.K.: John Wiley and Sons
IEA (International Energy Agency). 2004. Electricity Information. www.iea.org
______. 2003. World Energy Outlook. www.iea.org
IMF (International Monetary Fund). 2004. “Public Investment and Fiscal Policy.”Prepared by the Fiscal Affairs Department. http://www.imf.org/external/np/fad/2004/pifp/eng/PIFP.pdf
ITU (International Telecommunication Union). http://www.itu.int
Jacoby, H. 2000. “Access to Rural Markets and the Benefits of Rural Roads.” TheEconomic Journal 110. 713-37.
JBIC (Japan Bank for International Cooperation). 2004. “Survey Report on OverseasBusiness Operations by Japanese Manufacturing Companies.”http://www.JBUC.go.jp/autocontents/english/news/2004/000063/reprot .pdf
______2003. “Impact Evaluation Study onPublic-Private Partnerships: The Case of the Angat Water Supply Optimization Projectand the Metropolitan Waterworks and Sewerage System.”http://www.jbic.go.jp/english/oec/post/2003/pdf/1-02_smry.pdf
_____. 2000. “Eastern Seaboard Development Plan Impact Evaluation.” Ex-postEvaluation Report.
JBIC/ IDCJ. 2003. “Impact Assessment of Transport Infrastructure Projects in NorthernVietnam”.http://www.jbic.go.jp/english/oec/post/2003/pdf/1-03_smry.pdf
JETRO (Japan External Trade Organization). 2003. 13th Survey of Investment-RelatedCost, Comparison in Major Cities and Regions in Asia. http://www.jetro.go.jp/
JICA (Japan International Cooperation Agency). 2004. The Study on IntegratedTransportation Master Plan for Jabodetabek (SITRAMP).
______. 2001. “Local Administration and Decentralization.”http://www.jica.go.jp/english/
References
B-6
Kaufmann, Danny, Kray and Mastruzzi. 2003. “Governance Matters III: GovernanceIndicators for 1996-2002.”http://www.worldbank.org/wbi/governance/pubs/govmatters3.html
Kessides, Ioannis. 2004. Reforming Infrastructure—Privatization Regulation andCompetition. Washington, D.C.: The World Bank and Oxford University Press.
Kessides, Christine. 1996. “A Review of Infrastructure’s Impact on EconomicDevelopment.” In Infrastructure and the Complexity of Economic Development, eds.David F. Batten and Charlie Karlsson. Berlin: Springer-Verlag.
Krumm, Kathie and Homi Kharas. 2004. “Overview.” In Kathie Krumm and HomiKharas, eds., East Asia Integrates: A Trade Policy Agenda for Shared Growth.Washington, D.C.: World Bank and Oxford University Press.
Kuninori, Morio. 1997. “Financing Japan's Infrastructure: A Blend of Gradualism and Diversity in Financial Instruments.” Infrastructure Strategies in East Asia. Washington, D.C.: The World Bank.
Larsen, Theon Ib, Pham, Huong Lan and Martin Rama. 2004. “Vietnam’s Public Investment Program and its Impact on Poverty Reduction.” World Bank. Mimeo.
Leipziger, Danny, Marianne Fay, Quentin Wodon, and Tito Yepes. 2003. “Achieving theMillenium Development Goals: The Role of Infrastructure.” Washington D.C.:World Bank Policy Research Working Paper 3163. November.
Manasan, Rosario G. 2004. "Infrastructure and Decentralization". Background Paper forPhilippines AAA. Washington, DC: World Bank. Forthcoming.
Mansuri, Ghazala and Vijayendra Rao. 2004. “Community-Based and –DrivenDevelopment: A Critical Review.” Washington, D.C.: World Bank ResearchObserver 19(1).
Maguire, Glenn and Arseni Malinovitch. 2004. “Development of PPPs in Victoria.”Australian Accounting Review 33(14). No 2. July.
Mellor, Thuy and Jak Jabes. 2004. Governance in the Pacific: Focus for Action 2005-
2009. Manila: Asian Development Bank.
Miller, N.J. and C. Tsoukis. 2001. “On the Optimality of Public Capital for Long-RunEconomic Growth: Evidence from Panel Data.” Applied Economics, 1117-29, July.
Mody, Ashoka (ed.) 1997. Infrastructure Strategies in East Asia. Washington, D.C.: TheWorld Bank.

References
B-7
MRI (Mitsubishi Research Institute). 2003. “Study on National Land Policy Coordination in Asian Region.” http://www.mri.co.jp/E/
Muzzini, Elisa. 2004. “Consumer Particiaption in Infrastructure Regulation: Evidence from the East Asia and Pacific Region.” Washington, D.C.: World Bank. Mimeo.
Ng, Francis and Alexander Yeats. 2003. “Major Trade Trends in East Asia: What areTheir Implications for Regional Cooperation and Growth?” Washington, D.C.:World Bank Policy Research Working Paper 3084.
Panayotou, Theodore and Zhang Zheng. 2000. The Cost of Environmental Damage inChina: Preliminary Assessment and Valuation Framework. Bethesda, MD:Aileen International Press for the China Council for International Cooperation onEnvironment and Development.
Partnerships Victoria. 2001. Public Sector Comparator, Technical Note. http:// www.partnerships.vic.gov.au
Parton, Bennett. 2003. “Saving Utilities During the Asian Financial Crisis.” P3 News. III(3). July-August.
Peterson, George E. and Elisa Muzzini. 2004. “Decentralization of Basic InfrastructureService.” Background paper for the East Asia and Pacific decentralizationflagship.
Prud’homme, Rémy. 2004. “Infrastructure and Development.” Paper prepared for theABCDE (Annual Bank Conference on Development Economics), Washington, D.C.:
May 3-5.
Ravallion, Martin. 2003. "The Debate on Globalization, Poverty, and Inequality: WhyMeasurement matters." Washington, D.C.: World Bank Policy Research WorkingPaper 3038.
Reinfeld, William. 1997. "Tying Infrastructure to Economic Development: The Republicof Korea and Taiwan. In Ashoka Mody (ed.). Infrastructure Strategies in East Asia. Washington, D.C.: The World Bank.
Roller, Lars-Hendrik . and Leonard Waverman,. 2001. “Telecommunications Infrastructure and Economic Development: A Simultaneous Approach.” American Economic Review 91. 909-23.
Rufo, Loreta S and Carlito M. Rufo, Jr. 2004. “Clean Incineration of Solid Waste: ACost-Benefit Analysis for Manila Resources.” Quezon City,Philippines:

References
B-8
Environment and Economics Center for Studies (REECS) Research Report No. 2004-RR7.
Sen, Amartya. 1999. Development as Freedom. Anchor Press.
Shah, Anwar, Theresa Thompson and Heng-fu Zou. 2004. “The Impact ofDecentralization on Service Delivery, Corruption Fiscal Management and Growth inDeveloping and Emerging Market Economies: A Synthesis of Empirical Evidence.”CESifo Dice Report 1: http://www.cesifo.de/
Sorge, Marco. 2004. “The Nature of Credit Risk in Project Finance.” BIS QuarterlyReview. December. 91-101.
Spencer, Seidman. 2004. “Poverty, Growth and Inequality in Gansu, Sichuan andYunnan.” DFID China: Draft paper. July.
Tang, Xinpeng. 2004. “Playing games with policy: the image of project of Fengcheng, Jiangxi.” www.people.com.cn. July 21.
Tuntivate, Voravate, and Douglas F. Barnes. 2000. “Thailand’s Approach to RuralElectrification: How Was It Successful?” Washington, D.C.: World Bank Industry andEnergy Department. Draft.
Tynan, Nicola and Bill Kingdom. 2005. “Optimal Size for Utilities? Returns to Scale inWater: Evidence from Benchmarking.” Washington, D.C.: World Bank Public Policy forthe Private Sector Note 283.http://rru.worldbank.org/documents/publicpolicyjournal/283tynan.pdf
UN (United Nations). 2002. World Population Prospects. http://esa.un.org/unpp/
UN ESCAP. 2000. “State of the Environment in Asia and the Pacific.” ST/ESCAP/2087.
US DOE (Department of Energy). http://www.eia.doe.gov
Uzawa, Hirofumi. 1994. “Infrastructure in Japan: Issues and Lessons.” Background paper for the World Development Report 1994. Washington D.C.: World Bank.
van den Berg, Caroline. 2002. “Viet Nam : Evolving Management Models for SmallTowns Water Supply in a Transitional Economy.” Washington, D.C.: World Bank Waterand Sanitation Program Working Paper 27003.
Van Hanh, Nguyen, Nguyen Van Song, Do Van Duc and Tran Van Duc. 2002.“Environmental Protection and Compensation Costs for the Yali Hydropower Plant inVietnam.” Economy and Environment Program for Southeast Asia (EEPSEA).http://web.idrc.ca/en/ev-29440-201-1-DO_TOPIC.html
References
B-9
Vietnam Development Report-Governance. 2004. Joint Donor Report to the VietnamConsultative Group meeting, Hanoi, December 1-2, 2004
Warford, Jeremy, and Li Yining, eds. 2002. Economics of the Environment in China. China Council for International Cooperation on Environment and Development
Webster, Douglas. 2004. “The need for Inter-Jurisdictional Co-operation in ExtendedUrban Regions.” Mimeo.
Webster, R. Douglas 2001. “On the Edge: Shaping the Future of Peri-Urban East Asia.”Washington, D.C.: World Bank. Mimeo.
Wen, Jiabao. 2004. Report of the World of the Government.
World Bank. 2005a. “China Quarterly Update.” February.
__________. 2005b. Decentralization Flagship. Washington, D.C. Forthcoming.
__________. 2005c. Philippines AAA. Washington, D.C. Forthcoming.
__________.2005d. Vietnam AAA. Washington, D.C. Forthcoming.
__________. 2004a. Averting an Infrastructure Crisis—Indonesia. A Framework for Policy and Action. Washington, D.C.: World Bank.
__________.2004b. “China Brief” April.
__________. 2004c.. East Asia and Pacific Urban Business Directions. Washington, DC:Urban Development Working Papers No. 5. September.
__________. 2004d.. East Asia Update. November. Washington, D.C
__________. 2004e. East Asia Update. April. Washington, D.C
__________. 2004f. “Public Policy for the Private Sector.” Washington, D.C.: World Bank Private Sector Development Vice Presidency Note 274. September.
__________. 2004g. “Vietnam Public Expenditure Review: Managing PublicExpenditure for Poverty Reduction and Growth.” Washington, D.C.: The World Bank.
_________. 2004h. World Development Indicators. Washington, D.C.
_________.2004i. World Development Report 2005: A Better Investment Climate forEveryone. New York: Oxford University Press.

References
B-10
________. 2003a. “Combating Corruption in Indonesia.” Washington, D.C.: World BankPoverty Reduction and Economic Management Unit Report 27246.
_________. 2003b. Irwin, Timothy and Penelope Brook. Infrastructure for PoorPeople: Public Policy for Private Provision. Washington, D.C.: World Bank.
_________. 2003c. “Vietnam Development Report 2004—Poverty.” Washington, D.C.:World Bank Poverty Reduction and Economic Management Unit Report 27130-VN. November.
_________. 2003d. World Development Report 2004: Making Services Work for PoorFor Poor People. New York: Oxford University Press.
_________. 2003e. World Development Indicators. Washington, D.C.
_________.. 1997. Clear Water, Blue Skies: China’s Environment in the 21st Century. Washington, D.C.
World Bank. Private Participation in Infrastructure Database: http://ppi.worldbank.org
World Economic Forum. 2003. Global Competitiveness Report. Oxford University Press.
World Energy Council. 2001. Energy Markets in Transition: The Latin American and Caribbean Experience. London
WRc and Ecologic for the European Commission.2002. “Study on the Application of theCompetition Rules to the Water Sector in the European Community.”http://europa.eu.int/comm/competition/publications/studies/water_sector_report.pdf
Xianqiang, Mao and Guo Xiurui. 2001. “Improving Air Quality in Chinese Cities bySubstituting Natural Gas for Coal: Barriers and Incentive Policies.” Beijing:Institute of Environmental Sciences. http://www.eepsea.org
Yepes, Guillermo. 1990. “Management and Operational Practices of Municipal andRegional Water and Sewerage companies in Latin America and the Caribbean.”Washington, D.C.: World Bank Discussion Paper, Infrastructure and UrbanDevelopment Department.
Yogita, Mumssen. 2004. “Output-Based Aid in Cambodia – Private Operators and LocalCommunities Help Deliver Water to the Poor.” Washington, D.C: Global Partnership onOutput-Based Aid. November.http://www.gpoba.org/documents/OBApproaches_Cambodia_Water.pdf

References
B-11
Yuan, Lee Tsao. 1997. “Infrastructure Geared to International Economic Activity:Singapore.” In Ashoka Mody (ed.). Infrastructure Strategies in East Asia. Washington, D.C.: The World Bank.
Yusuf, Shahid, Simon J. Evenett, Kaoru Nabeshima, Marc Shotten and DouglasWebster. 2001. “East Asia’s Urban Regions: A strategy for the Coming Decade.”Washington, D.C.: The World Bank. Mimeo.
Study Background Papers
Asanuma, Shinji. 2005. “The Role of Planning and Coordination in Asia’s InfrastructureDevelopment.”
Besant-Jones, John. 2004. “Lessons from Experience of Power Sector Reform.”
Brixi, Hana Polackava and Timothy Irwin. 2004. “Fiscal support for infrastructure in EastAsia and the Pacific: toward a more effective and transparent approach.”Background paper for the infrastructure flagship.
Burgess, Steven. 2004. “Rural Infrastructure and Governance.”
Castalia. 2004a. “Integrity in the Provision of Infrastructure: The Way Forward inControl of Corruption and Accountability.”
_______. 2004b. “Pacific Infrastructure Review.”
_______. 2004c. “Sector Note on Water Supply and Sanitation.”
Civil Society Perceptions. 2004. Background survey for the Infrastructure Flagship.
East Asia and Pacific Private Investors in Infrastructure Perception Survey. 2004. Background survey for the Infrastructure Flagship.http: www.worldbank.org/eapinfrastructure
EMBARQ. 2004. “Rapid Motorization in China: Environmental and Social Challenges.”
Fujita, Yasua and Shoichi Hisa. 2004. “Shifting Trade Patterns—How Will They ImpactInfrastructure Needs in the East Asia and Pacific Region?”
Halcrow Group Ltd. 2004. “A Tale of Three Cities: Urban Rail Concessions in Bangkok,Kuala Lumpur, and Manila.”
References
B-12
Jones, Stephen. 2004a. “Contribution of Infrastructure to Growth and Poverty Reductionin East Asia and the Pacific.”
___________. 2004b. “ Regional Integration through Cross-Border Infrastructure:Framework Paper.”
Liu, Zhi. 2004. “Planning and Policy Coordination in China’s Infrastructure Development.”
Medalla, Felippe. 2004. “Policy Coordination, Planning and Infrastructure Provision inthe Philippines.”
Nomura Research Institute. 2004. “Private Sector Perceptions of Challenges and Opportunitiesby Japanese Infrastructure Users.” Background paper for the
infrastructure flagship.
Structured Credit International Corp. 2004. “Role of the Financial Sector: ChannelingPrivate Savings to Infrastructure Investments in East Asia and the Pacific.”
Takamine, Yutaka. 2004. “Infrastructure Services and Social Inclusion of Persons with Disabilities and Older persons in East Asia and the Pacific.”
Ure, John. 2004. “Telecom Note.” Background paper for the infrastructure flagship.
UTCE Ltd. and ALMEC Corporation. 2004a. “Infrastructure Development and ServiceProvision in the Process of Urbanization.”
______________________________. 2004b. “Infrastructure Development and ServiceProvision in the Process of Decentralization.”
Warford, Jeremy. 2004. “Infrastructure Policy and Strategy in the East Asia and PacificRegion.”
Webster, Douglas and Patharaporn Theeratham. 2004. “Policy Coordination, Planningand Infrastructure Provision: A Case Study of Thailand.”
Yepes, Tito. 2004. “Expenditure on Infrastructure in East Asia Region, 2006-2010.”