connecting people to employment - fta · web viewgeneral reporting closed on may 15. however,...
TRANSCRIPT
Connecting People to Employment
An Evaluation of Job Access and Reverse Commute (JARC) Program Services Provided in 2010
Commonwealth Environmental Systems, Inc.TranSystems
Prepared for Federal Transit Administration
October 2011

Disclaimer NoticeThis document is disseminated under the sponsorship of the United States Department of Transportation (USDOT) in the interest of information exchange. The US Government assumes no liability for its contents or use thereof.
[i]
AcknowledgmentsThe work in this document was performed by CES, Inc., and TranSystems under Federal Transit Administration (FTA) contract number DTFT60-08-C00013/Project No. FTA-11-0084. The lead reviewers were Christoph Berendes (CES) and Susan Bregman (CES and Oak Square Resources). Caroline Ferris (TranSystems), Stephen Falbel (Steadman Hill Consulting), and Lauren Miller (CES) provided research and analytical support. Gilbert Williams was the FTA Project Managers, Doug Birnie was the United We Ride Team Leader, and Catherine Caldwell was the Contracting Office’s Technical Representative (COTR).The authors wish to thank the members of the JARC/New Freedom Advisory Committee, who included: Pamella Lee, Iowa Department of Transportation Ref Lindmark, King County Metro Transit, Seattle (WA) Beth Newman, Metropolitan Washington Council of Governments (DC) Jean Palmateer, Oregon Department of Transportation Liz Peak, Jacksonville Transportation Authority (FL) Betty Petrie, Central New York Regional Transportation Authority/CENTRO,
Syracuse (NY) Sarah Probasco, Wisconsin Department of Transportation Lisa Rivers, Connecticut Department of TransportationThe committee members provided helpful advice and input throughout the development and implementation of the JARC/NF Program Performance Evaluation matrix approach.
[ii]

Abbreviations
[iii]
COTR Contracting Office’s Technical Representative
CTAA Community Transportation Association of America
DOT Department of TransportationFTA Federal Transit AdministrationFY Fiscal YearGPRA Government Performance Results ActJARC Job Access and Reverse Commute LED Local Employment DynamicsLEHD Longitudinal Employment-Household
DynamicsNAICS North American Industry Classification
SystemMPO Metropolitan Planning OrganizationNF New FreedomOMB Office of Management and BudgetPART Performance Assessment Rating ToolPPE Program Performance EvaluationSAFETEA-LU Safe, Accountable, Flexible, Efficient
Transportation Equity Act: A Legacy for Users
TEA-21 Transportation Equity Act for the 21st Century
US United StatesUSDOT United States Department of Transportation

Executive Summary
The Job Access Reverse Commute (JARC) program was developed to address the unique transportation challenges that welfare recipients and low-income individuals face in finding and keeping jobs. It also addresses issues related to accessing jobs located in suburban areas, which are difficult to reach from urban and rural areas. FTA contracted with Commonwealth Environmental Services, Inc. (CES) and its subcontractor TranSystems to manage data collection and analysis for the FY 2010 JARC / New Freedom (NF) Program Performance Evaluation. Grant recipients submitted reports on JARC- and NF-funded services using a set of online forms. This report presents findings for the JARC program only. Findings for the New Freedom program are presented in a separate report. Highlights for FY 2010A total of 188 grant recipients submitted complete reports for 1,027 JARC-funded services in FY 2010. Key findings include: JARC-supported services provided 55.3 million one-way trips. JARC-supported services made 53.6 million jobs accessible, which
included 26.5 million low-wage jobs. In addition, 15.9 million jobs were likely reached during the service year.
Out of the active JARC-funded services, most were trip-based (79%). The remaining projects comprised information-based programs (12%), capital investments (8%), and planning studies (1%).
Fixed routes accounted for 39% of the JARC services but 86% of all one-way trips.
Demand response was the second most commonly reported service (23%) but generated only 6% of the trips.
Just under half of JARC-supported services operated in large urbanized areas (47%) and 30% could be found in non-urbanized or rural communities. The balance shifts for one-way trips, however. About 82% of trips generated by JARC-supported services were in large urbanized areas and 7% in rural settings.
Mobility managers generated more than 375,000 one-way trips and initiated 347,000 customer contacts.
Agencies added almost 50 vehicles, which generated more than 112,000 one-way trips. About 70% of the trips were associated with programs designed to improve access / connections.
Grant recipients provided almost 1,700 car loans to individuals, which generated more than 265,000 one-way trips.
[iv]

The most commonly selected goals were expanded geographic coverage (30%), improved access/connections (30%), and extended service hours or days (21%).
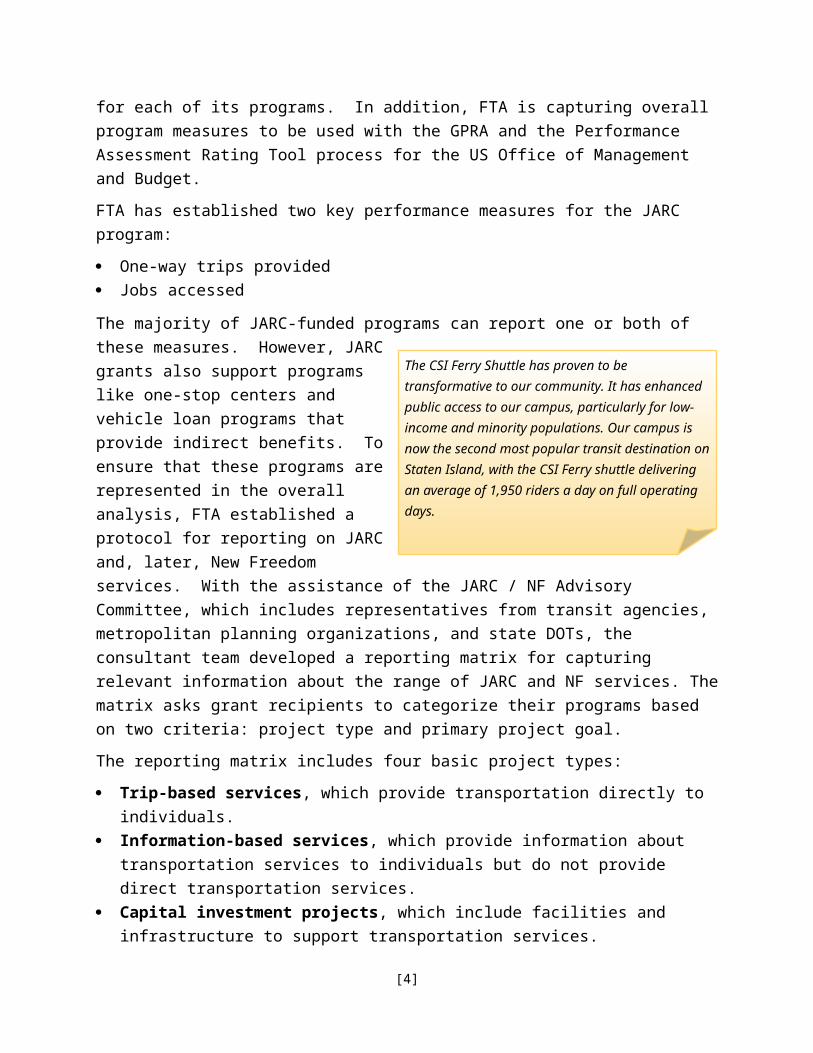
Program Performance MeasuresFTA has established two key performance measures for JARC program: One-way trips provided Jobs accessedThe majority of JARC-funded programs can report one or both of these measures. However, JARC grants also support programs like one-stop centers and vehicle loan programs that provide indirect benefits. To ensure that these programs are represented in the overall analysis, FTA established a protocol for reporting on JARC and, later, New Freedom services. With the assistance of the JARC / NF Advisory Committee, which includes representatives from transit agencies, metropolitan planning organizations, and state DOTs, the consultant team developed a reporting matrix for capturing relevant information about the range of JARC and NF services. The matrix asks grant recipients to categorize their programs based on two criteria: project type and primary project goal. Project types fall into four categories: Trip-based services, which provide transportation directly to
individuals. Information-based services, which provide information about
transportation services to individuals but do not provide direct transportation services.
Capital investment projects, which include facilities and infrastructure to support transportation services.
Planning studies, which include feasibility studies.In keeping with Federal reporting requirements, the five primary program goals are: Expanded geographic coverage Extended service hours or days Improved system capacity Improved access/connections Improved customer knowledgeAfter selecting the combination of service type and primary goal that best described their program, grant recipients were asked to report service output measures. The output measures varied with program type. For example, they included the number of one-way trips for trip-based programs,
[v]

the number of customer contacts for information-based services, and the number of units provided for capital investment projects. In some cases, grantees were asked to report descriptive information.While the numbers associated with non-trip-based services like mobility managers and vehicle-loan programs are small in relation to one-way trips and jobs accessed, they represent very real mobility benefits at a local level. The matrix approach enables FTA to capture this information and ensure that the benefits of these non-traditional programs are not overshadowed by the measures of one-way trips and jobs accessed. Service ProfilesFinally, FTA continued to collect program profiles, or summaries, for each JARC service. While ridership and jobs-accessed statistics allow FTA to provide a national summary of the JARC program, the profiles allow the grantees to convey the benefits of the program at the local level. These qualitative descriptions complement the data collection and provide an additional avenue for understanding the impacts and benefits of both grant programs. The profiles provide a rich source of detailed information about the JARC program and are provided in their entirety under separate cover. For convenience, they are organized in 10 separate documents based on the FTA regions. In addition, relevant excerpts have been incorporated throughout this summary report. As the program profiles made abundantly clear, the JARC program connects with riders and customers on a human scale.
[vi]

Table of Contents
Executive Summary_________________________________________________________iv
Chapter 1: Introduction_____________________________________________________1
JARC Program Performance Evaluation_____________________________________2
Summary of FY 2010 Analysis_____________________________________________4
Document Overview_______________________________________________________7
Chapter 2: Data Collection__________________________________________________8
Reporting Universe________________________________________________________8
Recipient Outreach, Tracking, and Follow Up_______________________________9
Technical Assistance_____________________________________________________11
Overview of Online Technology and Changes_____________________________12
Chapter 3: Overview of JARC Services_____________________________________14
Service Types____________________________________________________________14
Agency Type_____________________________________________________________19
Size of Urbanized Area___________________________________________________20
Chapter 4: One-Way Trips_________________________________________________27
Size of Urbanized Area___________________________________________________31
Compare Trips and Services______________________________________________36
Chapter 5: Jobs Accessed__________________________________________________39
Jobs Estimation Methodology_____________________________________________39
Targeted Jobs____________________________________________________________42
Jobs Accessed in FY 2010_________________________________________________42
Chapter 6: Primary Goals__________________________________________________44
[vii]

Program Goals___________________________________________________________44
Program Outputs_________________________________________________________47
Chapter 7: Conclusions____________________________________________________54
JARC Highlights__________________________________________________________54
Program Profiles_________________________________________________________55
Appendix A:_______________________________________________JARC Service Matrix
Appendix B:_____________________________________Jobs Estimation Methodology
Appendix C:______________________JARC Service Profiles (under separate cover)
[viii]

List of TablesTable 1-1 JARC Services Reported by Fiscal Year____________________________________5Table 2-1 Reporting Response Rate_______________________________________________11Table 3-1 JARC Services by Type__________________________________________________15Table 3-2 Recipients by Agency Type______________________________________________19Table 3-3 Subrecipients by Agency Type___________________________________________20Table 3-4 JARC Services by Type and Size of Urbanized Area (Percentage by Row)_22Table 3-5 JARC Services by Type and Size of Urbanized Area (Percentage by
Column)_____________________________________________________________24Table 4-1 One-Way Trips by Service Type_________________________________________29Table 4-2 One-Way Trips by Service Type and Size of Urbanized Area (Percentage
by Row)______________________________________________________________32Table 4-3 One-Way Trips by Service Type and Size of Urbanized Area (Percentage
by Column)__________________________________________________________34Table 4-4 Comparison of Services and One-Way Trips (Percentage by Column)____37Table 5-1 Targeted Jobs by Service Type__________________________________________43Table 5-2 Jobs Accessed Estimate_________________________________________________43Table 6-1 JARC Service Matrix – Distribution of Services by Primary Goal (Number of
services)_____________________________________________________________49Table 6-2 JARC Service Matrix – Distribution of Services by Primary Goal
(Percentage by row)_________________________________________________50Table 6-3 JARC Service Matrix – Distribution of Services by Primary Goal
(Percentage by column)______________________________________________51Table 6-4 JARC Service Matrix – Service Outputs by Primary Goal__________________52
[ix]

List of FiguresFigure 1-1 FTA JARC Funding, 2005 - 2010__________________________________________2Figure 2-1 Email Outreach, February – May 2011__________________________________10Figure 3-1 JARC Services by Type__________________________________________________16Figure 3-2 JARC Services by Type (Program Detail)________________________________17Figure 3-3 JARC Services by Type FY 2006 – FY 2010_______________________________18Figure 3-4 JARC Services by Type and Size of Urbanized Area (Percentage by Row)
______________________________________________________________________23Figure 3-5 JARC Services by Type and Size of Urbanized Area (Percentage by
Column)_____________________________________________________________25Figure 3-6 JARC Services by Size of Urbanized Area FY 2006 – FY 2010_____________26Figure 4-1 One-Way Trips by Service Type (Thousands of Trips)___________________30Figure 4-2 One-Way Trips by Service Type and Size of Urbanized Area (Percentage
by Row)______________________________________________________________33Figure 4-3 One-Way Trips by Service Type and Size of Urbanized Area (Percentage
by Column)__________________________________________________________35Figure 4-4 Comparison of Services and One-Way Trips (Percentage by Column)___38Figure 6-1 JARC Services by Primary Goal FY 2007 – FY 2010______________________46
[x]

Chapter 1: IntroductionThe Job Access Reverse Commute (JARC) was developed to address the unique transportation challenges that welfare recipients and low-income individuals face in finding and keeping jobs. It also addresses issues related to accessing jobs located in suburban areas, which are difficult to reach from urban and rural areas. JARC was established in 1999 under Section 3037 of the Transportation Equity Act for the 21st Century (TEA-21). Initially, Section 3037 required the Federal Transit Administration (FTA) to select JARC projects through a national competition based on criteria defined by statute, and FTA used a competitive process to select projects for funding appropriated in FY 1999 through FY 2002. However, beginning in FY 2000, Congress also began designating specific projects and recipients to receive JARC funding in the conference reports accompanying the annual appropriations acts, and directed FTA to honor those designations. Each year more projects were Congressionally designated until finally, by FY 2003, all JARC project funding was allocated through directives. Enacted in 2005, the Safe, Accountable, Flexible, Efficient Transportation Equity Act: A Legacy for Users (SAFETEA-LU) repealed Section 3037, and JARC was transitioned into a formula-based program under Section 5316 of the new Act. The new formula was intended to provide an equitable funding distribution to states and communities as well as a stable and reliable funding source. States and public bodies are eligible designated recipients, and they may distribute JARC grants to subrecipients through a competitive selection process. Eligible subrecipients are private non-profit organizations, state or local governments, and operators of public transportation services including private operators of public transportation services. JARC funds are allocated among large urban, small urban, and non-urbanized/rural areas as follows: 60% of funds go to designated recipients in large urban areas with
populations of 200,000 and over, 20% of funds go to states for small urban areas under 200,000, and 20% of funds go to states for non-urbanized/rural areas. States may transfer funds between urbanized and non-urbanized area programs The JARC formula is based on the number of eligible low-income and welfare recipients. SAFETEA-LU authorized a total of $727 million for JARC grants
[1]

from FY 2005 through FY 2009. Starting in FY 2010, Congress continued to authorize funding for the JARC program through a series of continuing resolutions. (See Figure 1-1.)
[2]

Figure 1-1FTA JARC Funding, 2005 - 2010
JARC Program Performance EvaluationFTA contracted with Commonwealth Environmental Services, Inc. (CES) and its subcontractor TranSystems, to manage online data collection and analysis for the FY 2010 JARC / New Freedom (NF) Program Performance Evaluation. Individuals from both firms have been key evaluators of the JARC program since 2002 and developed the JARC / NF Program Performance Evaluation system currently being used to evaluate both programs.1 This volume presents findings for the JARC program only. Findings for the New Freedom program are presented in a separate report. Under the Government Performance Results Act (GPRA), FTA is required to “establish performance goals to define the level of performance” and to also “establish performance indicators to be used in measuring relevant outputs, service levels, and outcomes” for each of its programs. In addition, FTA is capturing overall program measures to be used with the GPRA and the Performance Assessment Rating Tool process for the US Office of Management and Budget. FTA has established two key performance measures for the JARC program:
1 Reports from CES and TranSystems on JARC services in operation from FY 2006 through FY 2009 can be found on the JARC program page of the FTA website at http://www.fta.dot.gov/funding/grants/grants_financing_9292.html.
[3]
2005 2006 2007 2008 2009 2010 $-
$25
$50
$75
$100
$125
$150
$175
$200
$124$138 $144
$156$165
$177
Mill
ions

One-way trips provided Jobs accessedThe majority of JARC-funded programs can report one or both of these measures. However, JARC grants also support programs like one-stop centers and vehicle loan programs that provide indirect benefits. To ensure that these programs are represented in the overall analysis, FTA established a protocol for reporting on JARC and, later, New Freedom services. With the assistance of the JARC / NF Advisory Committee, which includes representatives from transit agencies, metropolitan planning organizations, and state DOTs, the consultant team developed a reporting matrix for capturing relevant information about the range of JARC and NF services. The matrix asks grant recipients to categorize their programs based on two criteria: project type and primary project goal. The reporting matrix includes four basic project types: Trip-based services, which
provide transportation directly to individuals.
Information-based services, which provide information about transportation services to individuals but do not provide direct transportation services.
Capital investment projects, which include facilities and infrastructure to support transportation services.
Planning studies, which include feasibility studies.In keeping with Federal reporting requirements, the five primary program goals are: Expanded geographic coverage, which includes increasing the
coverage area for a service (typically for trip-based or capital investment projects).
Extended hours or days of service, which includes adding hours and/or days to existing services (typically for trip-based or capital investment projects).
Improved system capacity, which includes adding resources that result in additional quantities of service (typically for trip-based or capital investment projects).
Improved access or improved connections, which include projects that improve an individual’s ability to travel (typically trip-based services
[4]
The CSI Ferry Shuttle has proven to be transformative to our community. It has enhanced public access to our campus, particularly for low-income and minority populations. Our campus is now the second most popular transit destination on Staten Island, with the CSI Ferry shuttle delivering an average of 1,950 riders a day on full operating days.
but also some information-based services such as mobility mangers or capital investment projects such as vehicle loan programs).
Improved customer knowledge, which provides additional resources for information-based services especially customer information and training programs.
Based on the combination of service type and primary goal, the cells in the matrix identify the type of service output data to be provided by the reporting grantee. The output measures typically include the number of one-way trips for trip-based programs, the number of customer contacts for information-based services, and the number of units provided for capital investment projects. In some cases, grantees are asked to provide descriptive information. The JARC service matrix also collects information from grant recipients used to develop the jobs accessed measure, including geographic coverage and route length. A more detailed description of the service reporting matrix is included in Appendix A.In addition to providing the basic reporting elements required for the JARC evaluation, grant recipients were asked to complete brief profiles describing each service. The profiles include a description of the service, lessons learned, how the local service is evaluated, and major accomplishments of the program. Recipients were also asked to identify the service area (generally city/county and state). The profile information helps to illustrate the breadth and depth of the projects funded by the JARC program and provides particularly useful information about the nature of the information-based and capital investment projects that do not lend themselves to traditional FTA data reporting. Profiles for JARC services are presented in an appendix to this report under separate cover. For convenience, they are organized into 10 stand-alone volumes based on the FTA region of the designated recipient. Summary of FY 2010 AnalysisA total of 188 grant recipients submitted complete reports for 1027 JARC-funded services in FY 2010. Key findings include: JARC-supported services provided 55.3 million one-way trips. JARC-supported services made 53.6 million jobs accessible, which
included 26.5 million low-wage jobs. In addition, 15.9 million jobs were likely reached during the service year.
Out of the active JARC-funded services, most were trip-based (79%). The remaining projects comprised information-based programs (12%), capital investments (8%), and planning studies (1%).
[5]

Just under half of JARC-supported services operated in large urbanized areas (47%) and 30% could be found in non-urbanized or rural communities.
Year-to-year comparisonsThe current data collection effort, conducted in 2011, covered JARC services in operation during Federal FY 2010 (October 1, 2009, through September 30, 2010). When relevant, this analysis will make comparisons with information reported in previous years. When making year-to-year comparisons, it is important to recognize that annual fluctuations in service provision may not necessarily reflect trends in program performance. Instead, several factors may influence these annual changes.First, as described above, JARC has evolved over time from a national competitive grant program to a congressionally directed grant program to a formula-based grant program with a local selection process. As a result, the grant recipients, and particularly the subrecipients, have changed and will continue to change over time as programs adapt to meet changing local needs. In addition, grant recipients with programs funded through the TEA-21 program (“earmarks”) were asked not to report, a practice FTA initiated for the FY 2009 data collection and analysis. Instead, FTA chose to focus its data-analysis efforts on the programs supported through Section 5316. Table 1-1 illustrates the change in the number of grant recipients reporting in FY 2006 through FY 2010. As the table shows, the number of JARC-supported services dropped in FY 2007 and then showed annual increases through FY 2010. The change in JARC services demonstrates the transition from earmark to formula, as older services ended and newer ones were introduced. Growth can be expected to level off in future years as the number of recipients stabilizes under the formula-based program.
Table 1-1JARC Services Reported by Fiscal Year
JARC Recipients JARC Services Reporting
Fiscal Year
Number
Change
Number
Change
Response Rate
FY 2006 155 - 645 - 92%FY 2007 121 -22% 587 -9% 74%FY 2008 147 +21% 681 +16% 74%FY 2009 171 +16% 910 +34% 99%FY 2010 188 +10% 1027 +13% 99%
Second, the JARC program is designed to support a broad range of services. These include services that provide transportation directly (such as fixed
[6]

route or user-side subsidies) as well as programs that provide information and investments in capital improvements. As the mix of services changes from year to year, the number of one-way trips and jobs accessed will change accordingly. In the aggregate, it may not be possible to determine whether this kind of change reflects a decline in
program performance or simply a new mix of services offered. For example, if the number of capital investment programs increases, the number of one-way trips and/or jobs accessed may well decrease because improvements such as software systems may not translate directly into trips. Third, an analytical convention adopted for this analysis affected how grant recipients reported one-way trips. When grant recipients used JARC funds to purchase one or more vehicles that they placed into service, they were asked to report two separate services or programs: a capital investment to purchase the vehicle and a trip-based service (e.g., fixed route) to provide passenger service. In these cases, trips were attributed to the service and not to the capital investment to avoid double counting. For the same reason, mobility managers that provided service directly were also asked to report on that service separately and to attribute those trips to the service rather than to the mobility manager program. Assigning all the trips from mobility manager and vehicle investments to trip-based services likely overstated the one-way trips associated with trip-based service and understated the number of trips associated with capital investments and information-based services. Although this approach did not influence the overall number of trips reported, it affected the distribution of trips by service type.Another element affecting comparisons is the difference in survey response rates from year to year. As Table 1-1 showed, the response rate ranged from 74% for the FY 2007 / FY 2008 analysis to 99% for the FY 2009 and FY 2010 cycles.Comparing jobs accessed from year to year is especially difficult. Besides reflecting changes in the mix of JARC-supported programs, the number and type of jobs available is tied directly into local economic conditions. In addition, the consultant team has worked to refine the methodology for estimating jobs accessed during the past several reporting cycles. These changes have improved the accuracy of the approach, but they make direct “apples-to-apples” comparisons impossible.
[7]
The Community Coaster services low income housing complexes, retail establishments, the train station and a variety of other job providers, such as assisted living communities. It is the only service available in this part of the county and provides a lifeline to those without an automobile.

This is why the matrix approach, introduced for FY 2006 and refined for this data cycle, is especially important. The service matrix captures performance information for all JARC services and reflects the range of choices made at the local level.While acknowledging these considerations, the data collected still presents a picture of the changing face of the JARC program. Therefore, this analysis: Compares the mix of programs from year-to-year, including service type.
(See Figure 3-3.) Compares the mix of grantees and subrecipients from year to year,
including type of operating setting. (See Figure 3-6.) Compares the primary goals for service provided from year to year. (See
Figure 6-1.) Incorporates information from the profiles into the analysis to show the
diversity of the JARC program, along with lessons learned and elements of success. (See sidebars throughout report and full profiles in Appendix C.)
Data cleaning and validationA total of 189 grant recipients reported initially on 1047 JARC-supported programs. As a first step in the analysis, the technical team reviewed the records to identify errors, invalid entries, duplicate services, missing data, or other error in data entry.Common errors and omissions included the following: For all services -- Reporting on service that was not in operation during
FY 2010 For trip-based services – Classifying demand response services as
flexible routes and classifying deviated fixed route services as fixed route instead of flexible.
For fixed-route, flexible, and shuttles – Reporting annual revenue miles instead of route length
For service area – Indicating “county” or “city” instead of entering the name for the county or city served
When the errors had a clear solution (e.g., an obvious typographical error in the state name), the team made the corrections without further research. In other cases, the team contacted recipients and/or subrecipients by telephone or email to clarify questions and to obtain updated information. The final corrected dataset included 188 grant recipients reporting on 1027 JARC-supported services. This analysis is based on the final validated dataset.
[8]

Data presentationMost of the tables and charts included in this report present data in percentage terms rather than raw numbers. Because the number of services and one-way trips varies by service type, percentages provide a better opportunity to compare programs. In most cases, the percentages are presented in two ways – summed by table row (usually service type) and summed by table column (e.g., size of urbanized area). In Chapter 6, which presents data collected in the context of the JARC service matrix, information is presented in the order used on the data collection forms. Otherwise, throughout the report, charts and tables are sorted by percentage, rather than program type.Document OverviewThe remainder of this document provides information about the process and results of the JARC service evaluation for FY 2010. Chapter 2 summarizes the data collection process. Results of the JARC evaluation are presented in Chapters 3-6: Chapter 3 presents an overview of JARC services, including the
distribution of service types. Chapter 4 summarizes ridership on JARC services. Chapter 5 includes an estimation of jobs accessed. Chapter 6 uses to matrix format to present findings on program goals and
outputs. Chapter 7 recaps the evaluation findings.Appendix A summarizes the service matrix approach and Appendix B provides an overview of the methodology used to estimated jobs accessed for JARC programs. Appendix C includes the JARC service profiles, which are presented under separate cover as a set of 10 separate documents based on FTA regions.
[9]
Chapter 2: Data CollectionConsistent with previous years, New Freedom grantees were asked to use an online form for reporting on FY 2010 New Freedom services. To streamline the data collection process, FTA collected reports for the JARC and NF grant programs at the same time using a single portal. This chapter describes the combined data collection activities for the JARC and NF programs. The team’s focus during the data collection phase is to maximize the percentage of recipients reporting. For FY 2010, 99% of recipients in the reporting universe either reported or indicated that they had no reporting obligation. This matched the reporting rate for the previous cycle and was accomplished by: Verifying recipient contacts and reporting requirements in advance of
data collection Following up repeatedly with non-responding recipientsThe team provided support to recipients via email, an updated support website, and by two webinars. This chapter provides additional details on the data collection process.
Reporting UniverseAs in prior years, FTA required recipients to report for the FY 2010 reporting cycle if they provided JARC- or New Freedom-funded services at any time between October 1, 2009, and September 30, 2010. The reporting requirement was based on actual service dates rather than the year the funds were awarded, obligated, or spent. Starting with the FY 2009 reporting cycle, FTA directed the team to exclude congressionally designated earmark projects, which were funded prior to SAFETEA-LU. By excluding these projects, FTA could focus the JARC and New Freedom reporting efforts on a consistent universe of designated recipients reporting on programs funded through the formula programs established through SAFETEA-LU. Through its TEAM system, FTA tracks the status of JARC and New Freedom grants. However, TEAM does not track when agencies actually provide funded services. As in past years, FTA provided the team with a list of 241 agencies with open JARC or New Freedom grants in FY 2010, which was used as a superset of the agencies required to report. The team then contacted each recipient in the superset to determine whether the recipient had a reporting obligation for FY
[10]

2010. The goal was to have every recipient in the superset either report on JARC and/or New Freedom services or to indicate that no services were provided during the reporting fiscal year.Reporting performance is measured as the ratio of the number of recipients who have either reported or indicated they had no reporting obligation to the number of recipients in the superset. For FY 2010, this percentage was 99%.
Recipient Outreach, Tracking, and Follow UpIt is sometimes difficult to reach a responsive contact at an agency. Agencies may be slow to respond because they know they had provided no JARC or New Freedom services during the fiscal year or because they have other priorities. In a few cases, this has led to agencies discovering that they do have a reporting requirement, close to the end of the reporting period, when it is difficult to gather the needed data and provide it to the reporting system.MilestonesThe official reporting period began on March 15, 2011, and ended on May 15, 2011. The reporting calendar included the following milestones: Screening survey – From the middle of February through the middle of
March, the team focused on inviting and reminding recipients in the superset to complete the screening survey.
Data collection – The reporting site opened to recipients for testing early in March 2011. The site was opened to all recipients and their subrecipients on March 15. General reporting closed on May 15. However, recipients who requested additional time to report were provided with access through June 4.
Follow-up and verification – After May 15, the team worked intensively via email and telephone with recipients who had not yet reported to ensure that they would report. The last submission was received on June 3, and the reporting system was locked to public access on June 4.
Screening SurveyTo improve contact with recipients and support responsiveness, the team instituted a separate effort to determine reporting obligations in advance of the FY 2010 data collection period. The screening survey proved successful for the FY 2009 data collection period, and the team maintained the screening survey for the FY 2010 data collection.Beginning in mid-February 2011, the team, with FTA assistance, contacted all agencies on the superset list, requesting their response to an online screening survey that would allow the agency to (a) determine whether it
[11]

was required to report for FY 2010, (b) revise its point-of-contact information, and (c) indicate whether the agency would prefer to provide two reporting contacts – one for JARC and one for New Freedom.Ultimately, 87% of the 241 agencies on the superset list provided responses to the screening survey, either directly, via the web interface, or via phone or email follow-up from a team member. Most of these responses were received, as intended, before the beginning of the reporting period. The team focused on reaching out to the remaining 13% via phone and email follow-up and obtained correct reporting contact information for each of these organizations.Email CommunicationThe team sent out 1,765 email reminders to specific recipients during the reporting process, to encourage reporting and to ask individual recipients if they needed additional assistance or time to complete their reporting requirements. See Figure 2-1.This year, the team used an email delivery tracking system, which allowed identification and follow-up on messages that were not delivered because they were obstructed by firewalls or spam filters. The system also permitted email recipients to “unsubscribe” from JARC and New Freedom reporting reminders with one click. This provided another avenue for identifying and correcting contact information for each recipient.
Feb-11 Mar-11 Apr-11 May-110
100
200
300
400
500
600
700
800
242
736
533
254
[12]

Figure 2-2Email Outreach, February – May 2011
TrackingThe team used real-time access to the reporting database, in combination with a flexible reporting capability, to identify non-reporters as well as recipients who had provided data but had not completed their submissions for follow-up. This information was used to generate customized reminders and offers of assistance.
Data responsesAs a result of the screening survey, diligent follow-up, and assistance from FTA headquarters, the team was able to maintain the 99% response rate achieved for the FY 2009 reporting cycle. (See Table 2-1.)
Table 2-2Reporting Response Rate
FY 2010 FY 2009 FY 2008Status # % # % # %
Report submitted200
83%
189
67%
158
54%
Not required to report
39 16% 90
32% 59
20%
Unknown2 1%
3 1% 7526%
Total241
100%
282
100%
293
100%
Technical AssistanceThe team provided support to the recipients during the reporting process via a website, webinars, and email and telephone contact.
Support siteAs in previous years, the support effort relied on the FTA JARC & New Freedom Reporting Support Center website (http://ftajarcnf.cesnn.com/). For this reporting cycle, the team substantially reorganized the site, including the graphics and interface. The focus of the redesign was to provide the user with multi-tiered “how to” information coupled with form instructions and to provide users with guidance according to user type. The support site is only available on-line during the reporting period.
[13]

WebinarsIn this reporting cycle, the team continued the practice of enhancing and expanding the effort to support recipients via webinars. Two webinars were held, on March 18 and April 7, and each included participation from FTA staff and the evaluation team. The webinars reached a total of 220 locations, each comprising one or more individuals, presented 38 slides, and handled questions submitted via chat interface and telephone. Participants also used the chat interface (similar to a direct-messaging application) to share information with one another.
Email and telephone contactLauren Miller, the team’s lead for technical assistance, responded to 397 email threads from February 1 through June 5. She also assisted recipients and subrecipients via telephone during the reporting process. Evaluation team members Susan Bregman and Caroline Ferris also provided support to recipients and subrecipients during the reporting period. In addition, as part of the quality assurance process described in Chapter 1, Ms. Bregman and Ms. Ferris reviewed all the records and contacted about two dozen recipients after the reporting period closed to clarify questions about specific data elements or to resolve ambiguities about specific data elements in their service reports. For example, if a record categorized a service as “fixed route” but the profile clearly described a demand-response service, the record was updated to say “demand response.” More than 250 records were modified in some way during the quality assurance process.
Overview of Online Technology and ChangesThe data collection system was originally developed for the JARC program in FY 2003 and has been substantially refined in subsequent years. It was modified to include the New Freedom program starting with FY 2007.
Web infrastructureThe JARC/New Freedom data collection and analysis effort is managed through two public-facing websites and four private websites supporting development and testing.Recipients and subrecipients enter, review, and submit JARC and New Freedom service information through the data collection website – http://ftajarcnf-report.cesnn.com. This site serves as the front-end for the official reporting database, “jnf_fy10a”. Users also have access to the support website – http://ftajarcnf.cesnn.com – as described above.Behind the scenes, the team maintains four additional websites:
[14]

1. The development version of the reporting system2. The preview version of the reporting system3. The development blog, used to narrate changes and issues in the team’s
websites and databases4. A formal software version control system, which provides granular
tracking and control of code changes and serves as the conduit for code moving from development to preview to production
The development and preview websites are backed by databases separate from the formal reporting database
Technical changesFor the FY 2010 reporting cycle, the team modified the reporting interface to support agencies with multiple subrecipients and to enhance data quality.Support for large agenciesThe team improved the reporting experience for recipients at large agencies in two ways:1. All recipients who had submitted JARC or New Freedom reports during the
FY 2008 or FY 2009 reporting cycles had online access to those earlier reports.
2. Large recipients were able to import the relevant portions of the FY 2009 reporting into their FY 2010 forms upon request.
As part of the effort to simplify reporting by recipients with multiple subrecipients, the reporting system provided optional access to subrecipients as well. A total of 655 distinct users logged used the reporting system, suggesting that, on average, each of the 241 recipients comprised a reporting team of close to 3 logins: the recipient itself, plus two subrecipient users. Some reporting teams were quite large: the top four recipients, by reporting team size, accounted for 20% of distinct users, approximately 33 individuals per reporting team.Other changesThree changes were made to enhance data quality:1. The service matrix was expanded to include planning studies;2. Spellchecking was added to the Service Profiles and other descriptive text
fields; and3. Recipients were required to report the specific counties (or equivalent)
served in whole or part by each of their services.Finally, to enhance usability and to streamline the appearance of the service form, certain detailed questions were presented only if they applied to the particular circumstance of the service. For instance, if a recipient indicated,
[15]

for certain New Freedom services, that expanded geographic coverage was provided on Sundays or holidays, they were then asked to indicate by how many square miles Sunday/holiday service was expanded.
[16]

Chapter 3: Overview of JARC ServicesThis chapter reports on the characteristics of JARC grantees and their services for FY 2010. Subsequent chapters cover JARC performance measures, including one-way trips, jobs accessed, and outputs for non-trip-based services. The information is based on data collected from the 188 JARC grant recipients that submitted complete and validated reports for FY 2010; these grantees reported on 1,027 services. Service TypesGrantees reported a total of 1,027 active JARC-funded services for FY 2010. Grant recipients were asked to classify services in one of four ways: Trip-based services, which provide transportation directly to
individuals. These include fixed routes, flexible routes, shuttles, demand response, and user-side subsidy programs (e.g., vouchers, ridesharing, and guaranteed ride home).
Information-based services, which provide information about transportation services to individuals but do not provide direct transportation services. These include mobility managers/brokerages, trip or itinerary planning, Internet-based travel information, informational materials, and one-on-one training.
Capital investment programs, including facilities and infrastructure to support transportation services. These include vehicle based programs (such as those making automobiles available to individuals or organizations), facility or amenity improvements, and technology to support transportation services.
Planning studies, including feasibility studies for future services. These studies are separate from the coordinated public transit - human services transportation plans required by SAFETEA-LU.
User-side subsidies include vouchers, ridesharing, and guaranteed-ride home programs, where the program covers the cost of a specific trip. They do not include fare vouchers, which were not eligible for JARC funding. Although FTA funds mobility managers as an eligible capital expense, they are categorized here as information-based services for reporting purposes.Out of the active JARC-funded services, the vast majority was trip-based, at approximately 79%. The remaining programs were information-based (12%), capital investment programs (8%), and planning studies (1%). (See Figure 3-1.) As Table 3-1 and Figure 3-2 show, the most commonly reported
[17]

programs were fixed route and demand response. Together, these traditional transit services accounted for almost two out of three JARC-funded programs.
[18]

Table 3-3JARC Services by Type
[19]
Service Type # %Trip-Based Services 813 79%Fixed route 397 39%Demand response 237 23%Flexible routing 61 6%Shuttle/Feeder 52 5%User-side subsidy 38 4%Vanpool 28 3%Information-Based Services 120 12%Mobility manager 65 6%One-on-one transit training 15 1%Materials and marketing 13 1%Transportation resource training 10 1%One-stop center 9 1%Trip/itinerary planning 5 0%Internet-based information 3 0%Capital Investment Projects 83 8%Vehicle for agency 32 3%Vehicle for individual 31 3%ITS investments 12 1%Vanpool vehicles 4 0%Other capital projects 3 0%Car-sharing 1 0%Planning Projects 11 1%Feasibility studies 11 1%Total 1027 100%
Figure 3-3JARC Services by Type
Only five categories of JARC-supported services achieved at least a 5% share: Fixed route (N=397) Demand response (N=237) Mobility manager (N=65) Flexible routing (N=61) Shuttle/Feeder (N=52)Together, these five types of JARC services accounted for 79% of the total services. See Figure 3-2. The JARC program supports a broad array of services tailored to the needs of individual communities. While traditional trip-based transit services comprise the majority of JARC-funded services, the share of information-based and capital investment programs has steadily increased since FY 2006. As Figure 3-3 shows, services in these categories accounted for 15% of all programs in FY 2006 but 21% of services in FY 2010. Note that FY 2010 included a separate category for planning projects for the first time.
[20]
79%
12%
8%
1%
Trip-based Information-basedCapital investment Planning studies

[21]

Figure 3-4JARC Services by Type
(Program Detail)
[22]
Car-sharingOther capital projects
Internet-based informationVanpool vehicles
Trip/itinerary planningOne-stop center
Transportation resource trainingFeasibility studyITS investments
Information materials/marketingOne-on-one transit training
Vanpool serviceVehicle for individual
Vehicle for agencyUser-side subsidies
Shuttle/feederFlexible routing
Mobility managerDemand response
Fixed route
0 50 100 150 200 250 300 350 400
Number of programs

Figure 3-5JARC Services by Type
FY 2006 – FY 2010
[23]
FY 2006 FY 2007 FY 2008 FY 2009 FY 20100%
10%
20%
30%
40%
50%
60%
70%
80%
90%
100%
85% 85% 86%81% 79%
8% 7% 7%10% 11%
7% 9% 7% 9% 9%
Trip-based Info-based Capital Planning

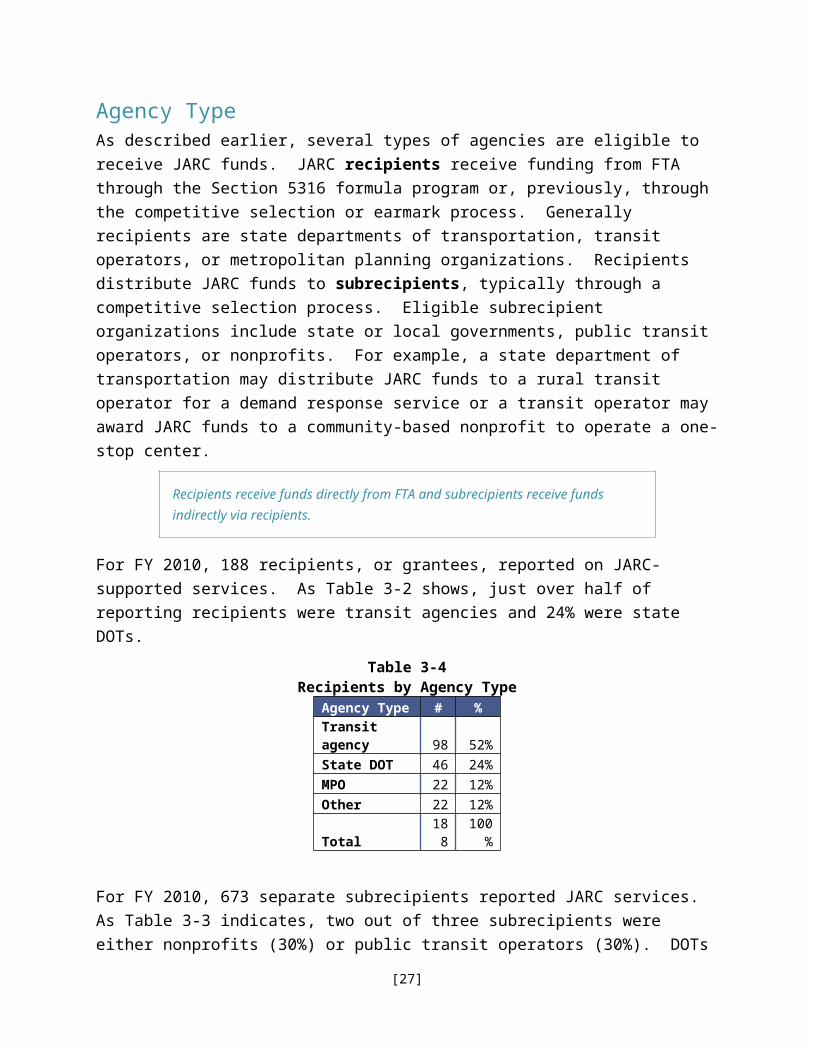
Agency TypeAs described earlier, several types of agencies are eligible to receive JARC funds. JARC recipients receive funding from FTA through the Section 5316 formula program or, previously, through the competitive selection or earmark process. Generally recipients are state departments of transportation, transit operators, or metropolitan planning organizations. Recipients distribute JARC funds to subrecipients, typically through a competitive selection process. Eligible subrecipient organizations include state or local governments, public transit operators, or nonprofits. For example, a state department of transportation may distribute JARC funds to a rural transit operator for a demand response service or a transit operator may award JARC funds to a community-based nonprofit to operate a one-stop center.
Recipients receive funds directly from FTA and subrecipients receive funds indirectly via recipients.
For FY 2010, 188 recipients, or grantees, reported on JARC-supported services. As Table 3-2 shows, just over half of reporting recipients were transit agencies and 24% were state DOTs.
Table 3-4Recipients by Agency Type
Agency Type # %Transit agency 98
52%
State DOT 4624%
MPO 2212%
Other 2212%
Total18
8100
%
For FY 2010, 673 separate subrecipients reported JARC services. As Table 3-3 indicates, two out of three subrecipients were either nonprofits (30%) or public transit operators (30%). DOTs at the city or county level made up the next largest group; in some communities DOTs are also the transit operator. Some subrecipients provided multiple services and a few received funds from multiple recipients. Separate from the FTA definitions, for the purposes of data reporting and analysis, a recipient was also classified as a
[24]

subrecipient if that recipient agency used JARC funds to operate a project itself.
Table 3-5Subrecipients by Agency Type
Agency type # %
Nonprofit234
35%
Public transit operator
205
30%
City DOT 6410%
Other 48 7%Other county 46 7%County DOT 42 6%Other city 15 2%Private transit operator 12 2%State agency 7 1%
Total673
100%
Size of Urbanized AreaAlmost half of all JARC-supported services (47%) operated in large urbanized areas (population over 200,000) in FY 2010. About 23% were located in small-urban localities (population 50,000-199,000) and 30% in non-urbanized or rural areas (population less than 50,000). Note that grantees reported on the size of the service area for each individual program, not for the grantee agency itself. For example, a state DOT that submitted a report for multiple services was asked to characterize the operating setting for each service separately. When a service covered multiple jurisdictions, such as an express route connecting rural residents with city jobs, grantees were asked to select the setting that best characterized the service. Three types of JARC-supported services were especially likely to operate in large urban areas: Shuttles and feeders (60% of reported services), fixed routes (58%), and user-side subsidies and vouchers (53%). Demand response and flexible routes were more common in non-urbanized locations (52% and 41%), where they were a better match for low-density land-use and employment patterns. Some program types seemed adaptable to all operating settings. These included mobility manager program, which could be found in all settings: large urban (45%), small urban (20%), and rural (35%). Programs providing vehicles for individuals showed a similar pattern –
[25]

42% in large urban areas, 23% in small urban, and 35% in rural – although it is difficult to extrapolate from only 31 programs. (This distribution is summarized in Table 3-4 and illustrated in Figure 3-4.)Fixed route comprised nearly half of all programs in large urbanized areas (48%), but accounted for only 21% of the rural programs. Demand response, in contrast, comprised 40% of the non-urban programs but only 13% of the large urban services. Again, these findings are not surprising and indicate that JARC recipients are taking advantage of the program’s flexibility to match service configuration with the operating environment. (See Table 3-5 and Figure 3-5.)Between FY 2009 and FY 2010, the percentage of JARC-supported services in large urbanized areas increased slightly from 44% to 47% but the percentage in rural areas was stable at about 30%. This pattern may reflect the impacts of the formula program, which allocates a fixed percentage of JARC funding for communities in small urban and non-urbanized areas. Figure 3-6 illustrates the trend, showing the percentage of JARC services by size of urbanized area for FY 2006 through FY 2010.
[26]
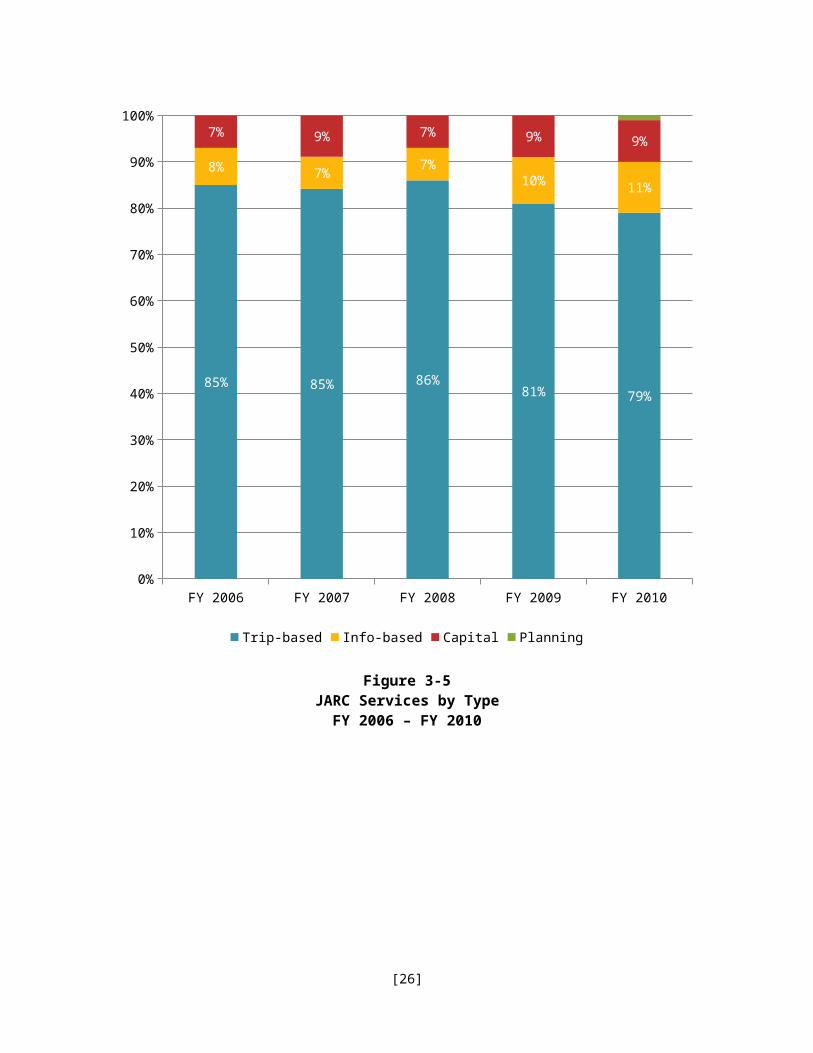
Table 3-6JARC Services by Type and Size of Urbanized Area
(Percentage by Row)
Service Type #Large Urban
Small Urban
Non Urban
Total
Trip-Based Services 813 47% 23% 30%100
%
Fixed route 397 58% 25% 17%100
%
Demand response 237 27% 21% 52%100
%
Flexible routing 61 31% 28% 41%100
%
Shuttle/Feeder 52 60% 21% 19%100
%
User-side subsidy 38 46% 21% 32%100
%
Vanpool 28 53% 24% 24%100
%
Information-Based Services 120 50% 23% 28%100
%
Mobility manager 65 40% 25% 35%100
%
One-on-one transit training 15 80% 13% 7%100
%
Materials and marketing 13 38% 23% 38%100
%Transportation resource training 10 70% 30% 0%
100%
One-stop center 9 44% 22% 33%100
%
Trip/itinerary planning 5 100% 0% 0%100
%
Internet-based information 3 33% 33% 33%100
%
Capital Investment Projects 83 45% 19% 36%100
%
Vehicle for agency 32 34% 16% 50%100
%
Vehicle for individual 31 42% 23% 35%100
%
ITS investments 12 100% 0% 0%100
%
Vanpool vehicles 4 67% 17% 17%100
%
Other capital projects 3 33% 33% 33%100
%
Car-sharing 1 75% 25% 0%100
%
Planning Projects 11 45% 18% 36%100
%
Feasibility studies 11 45% 18% 36%100
%Total 102 47% 23% 30% 100
[27]
7 %
[28]

Figure 3-6JARC Services by Type and Size of Urbanized Area
(Percentage by Row)
[29]
Demand response (N=237)
Flexible routing (N=61)
Internet-based information (N=3)
Other capital projects (N=3)
Vehicle for agency (N=32)
Materials and marketing (N=13)
Mobility manager (N=65)
Vehicle for individual (N=31)
One-stop center (N=9)
Feasibility study (N=11)
Vanpool (N=28)
User-side subsidy (N=38)
Fixed route (N=397)
Shuttle/Feeder (N=52)
ITS investments (N=12)
Transportation resource training (N=10)
Vanpool vehicles (N=4)
One-on-one transit training (N=15)
Trip/itinerary planning (N=5)
Car-sharing (N=1)
0% 10% 20% 30% 40% 50% 60% 70% 80% 90%100%
Large Urban Small Urban Non Urban

Table 3-7JARC Services by Type and Size of Urbanized Area
(Percentage by Column)
Service Type #Large Urban
Small Urban
Non Urban Total
Trip-Based Services 813 79% 81% 78% 79%Fixed route 397 48% 42% 21% 39%Demand response 237 13% 21% 40% 23%Flexible routing 61 4% 7% 8% 6%Shuttle/Feeder 52 6% 5% 3% 5%User-side subsidy 38 3% 3% 3% 3%Vanpool 28 4% 4% 3% 4%Information-Based Services 120 12% 11% 11% 12%Mobility manager 65 5% 7% 7% 6%One-on-one transit training 15 2% 1% 0% 1%Materials and marketing 13 1% 1% 2% 1%Transportation resource training 10 1% 1% 0% 1%One-stop center 9 1% 1% 1% 1%Trip/itinerary planning 5 1% 0% 0% 0%Internet-based information 3 0% 0% 0% 0%Capital Investment Projects 83 8% 7% 10% 8%Vehicle for agency 32 2% 2% 5% 3%Vehicle for individual 31 3% 3% 4% 3%ITS investments 12 0% 0% 0% 0%Vanpool vehicles 4 2% 1% 1% 1%Other capital projects 3 0% 0% 0% 0%Car-sharing 1 1% 0% 0% 0%Planning Projects 11 1% 1% 1% 1%Feasibility studies 11 1% 1% 1% 1%
Total102
7 100% 100% 100% 100%
[30]

Figure 3-7JARC Services by Type and Size of Urbanized Area
(Percentage by Column)
[31]
Large urban Small urban Non-urban0%
10%
20%
30%
40%
50%
60%
70%
80%
90%
100%
Trip-based Information-basedCapital investment Planning studies

Figure 3-8JARC Services by Size of Urbanized Area
FY 2006 – FY 2010
[32]
FY 2006 FY 2007 FY 2008 FY 2009 FY 20100%
10%
20%
30%
40%
50%
60%
70%
80%
90%
100%
47% 51% 48% 44% 47%
27%24% 27%
25% 23%
27% 25% 25% 31% 30%
Large urban Small urban Non-urban

Chapter 4: One-Way TripsAs in previous years, JARC grant recipients were asked to report annual one-way trips. Grantees were able to provide this information for 90% of trip-based services.
For FY 2010, it is estimated that JARC-supported services provided 55.3 million one-way trips.
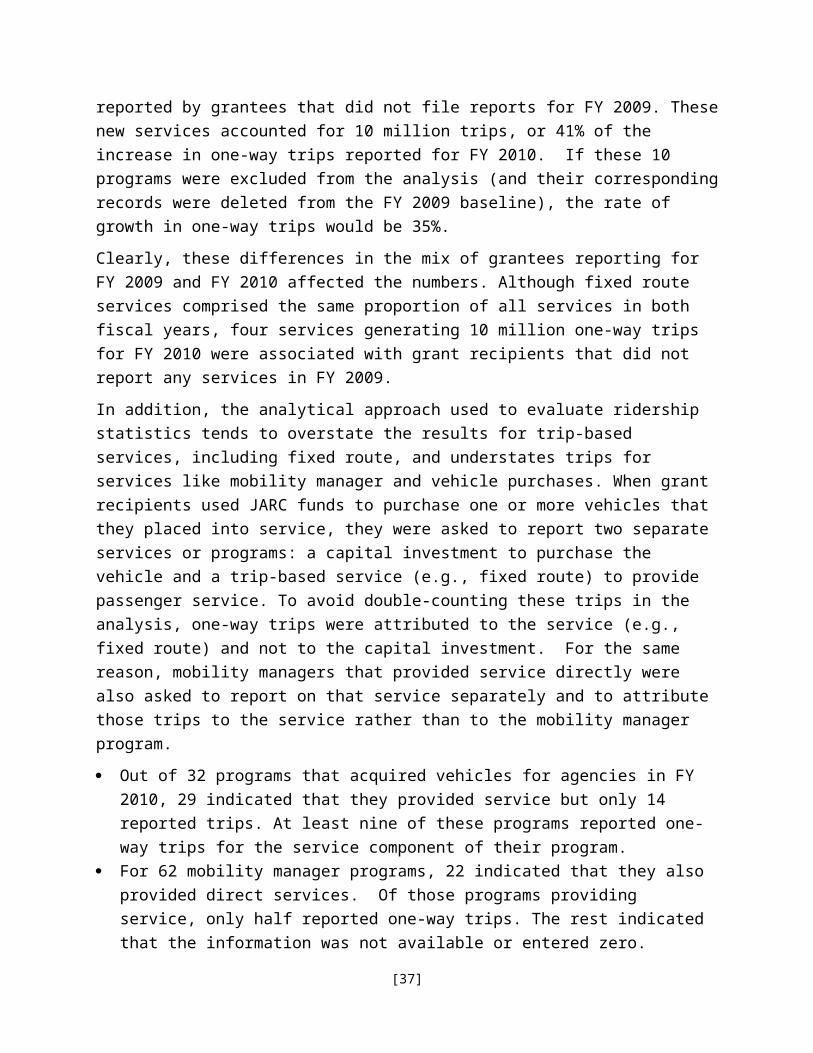
As might be expected, most one-way trips were recorded on fixed route services. Two factors account for this. First, fixed route was the single largest JARC service type reported for FY 2010. Second, fixed route services often use larger vehicles than other types of JARC-supported services and traverse more densely developed corridors. In FY 2010, fixed routes accounted for 86% of reported trips, followed by demand response (6%). No other services accounted for more than 5% of the total trips reported. Table 4-1 and Figure 4-1 show this distribution. As noted in Chapter 1, fluctuations in service provision may not necessarily reflect trends in program performance and direct year-to-year comparisons of changes in the number of one-way trips reported may be misleading. Nevertheless, the number of one-way trips doubled between FY 2009 and FY 2010 – from 27.3 million to 55.3million – and possible explanations are discussed below. First, almost all the growth in one-way trips was associated with fixed route services. Although the proportion of fixed route services was stable between FY 2009 and FY 2010, comprising 41% of all services in FY 2009 and 39% a year later, the number of trips associated with these services more than doubled, from 19.2 million to 47.4 million. Seven fixed-route services accounted for 24.5 million one-way trips, which was 87% of the overall increase in one-way trips between FY 2009 and FY 2010. Four of these services were reported by grantees that did not file reports for FY 2009. These new services accounted for 10 million trips, or 41% of the increase in one-way trips reported for FY 2010. If these 10 programs were excluded from the analysis (and their corresponding records were deleted from the FY 2009 baseline), the rate of growth in one-way trips would be 35%. Clearly, these differences in the mix of grantees reporting for FY 2009 and FY 2010 affected the numbers. Although fixed route services comprised the same proportion of all services in both fiscal years, four services generating
[33]

10 million one-way trips for FY 2010 were associated with grant recipients that did not report any services in FY 2009.In addition, the analytical approach used to evaluate ridership statistics tends to overstate the results for trip-based services, including fixed route, and understates trips for services like mobility manager and vehicle purchases. When grant recipients used JARC funds to purchase one or more vehicles that they placed into service, they were asked to report two separate services or programs: a capital investment to purchase the vehicle and a trip-based service (e.g., fixed route) to provide passenger service. To avoid double-counting these trips in the analysis, one-way trips were attributed to the service (e.g., fixed route) and not to the capital investment. For the same reason, mobility managers that provided service directly were also asked to report on that service separately and to attribute those trips to the service rather than to the mobility manager program. Out of 32 programs that acquired vehicles for agencies in FY 2010, 29
indicated that they provided service but only 14 reported trips. At least nine of these programs reported one-way trips for the service component of their program.
For 62 mobility manager programs, 22 indicated that they also provided direct services. Of those programs providing service, only half reported one-way trips. The rest indicated that the information was not available or entered zero.
Assigning all the trips from mobility manager and vehicle investments to trip-based services likely overstated the one-way trips associated with trip-based service at the expense of capital investments and information-based services. This would not change the overall number of trips reported but may have contributed at least partially to the growth in fixed route trips.
[34]

Table 4-8One-Way Trips by Service Type
Service Type #One-Way
Trips %Trip-Based Services 813 54,522,032 99%Fixed route 397 47,363,009 86%Demand response 237 3,054,526 6%Flexible routing 61 1,431,176 3%Shuttle/Feeder 52 1,229,871 2%Vanpool service 28 870,453 2%User-side subsidy 38 572,997 1%Information-Based Services 120 375,254 1%Mobility manager 65 375,254 1%One-on-one transit training 15 N/A 0%Materials and marketing 13 N/A 0%Transportation resource training 10 N/A 0%One-stop center 9 N/A 0%Trip/itinerary planning 5 N/A 0%Internet-based information 3 N/A 0%Capital Investment Projects 83 377,959 1%Vehicle for individual 31 265,831 0%Vehicle for agency 32 112,090 0%Vanpool vehicles 4 38 0%ITS investments 12 N/A 0%Other capital projects 3 N/A 0%Car-sharing 1 N/A 0%Planning Projects 11 N/A 0%Feasibility studies 11 N/A 0%Total 1027 55,275,245 100%
[35]

Figure 4-9One-Way Trips by Service Type
(Thousands of Trips)
[36]
Vanpool vehicles (N=4)
Vehicle for agency (N=32)
Vehicle for individual (N=31)
Mobility manager (N=65)
User-side subsidy (N=38)
Vanpool (N=28)
Shuttle/Feeder (N=52)
Flexible routing (N=61)
Demand response (N=237)
Fixed route (N=397)
-
10,00
0,000
20,00
0,000
30,00
0,000
40,00
0,000
50,00
0,000

Size of Urbanized AreaClear differences were apparent among geographic settings. For one-way trips on fixed route services, 87% were reported in large urbanized areas, 10% in small urban areas, and only 3% in rural communities. Since fixed route services tend to be well suited for high-density communities, this finding comes as no surprise. About half of the trips for flexible services, which included deviated fixed route, were reported in small urbanized areas. For demand response, 44% of trips were provided in rural areas and only 36% in large urbanized areas. Information-based services, which generated trips for mobility manager programs only, showed ridership in large urban (61% of one-way trips) and rural areas (39%). No trips were reported for the 16 mobility manager programs in small urbanized areas; some grantees may have reported trips for the service delivery component of their programs, and others may not have collected the information. See Table 4-2 and Figure 4-2. In large urbanized areas, fixed route services accounted for nearly all of the one-way trips reported (91%). In small urban areas, fixed route still generated the majority of one-way trips (74%), but flex routes (12% of trips) and demand response (10%) also played a role in these lower-density communities. Fixed route still had the largest market share for rural / non-urbanized areas with 43% of trips, but demand response was a significant presence in these communities with 35% of trips. See Table 4-3 and Figure 4-3.
[37]
Maintaining vehicles that are often driven in undesirable and challenging environments certainly provides a large number of surprises. Expect things to fall apart when you are furthest away from potential aid, and learn to roll with the punches.
Southwest Conservation CorpArizona DOT
Service Type # TripsLarge Urban
Small Urban
Non-Urban
Total
Trip-Based Services 81354,522,0
32 82% 12% 7%100
%
Fixed route 39747,363,00
9 87% 10% 3%100
%
Demand response 237 3,054,526 36% 20% 44%100
%
Flexible routing 61 1,431,176 29% 52% 18%100
%
Shuttle/Feeder 52 1,229,871 63% 16% 21%100
%
Vanpool service 28 870,453 88% 3% 9%100
%
User-side subsidy 38 572,997 86% 7% 7%100
%Information-Based Services 120 375,254 61%% 0% 39%
100%
Mobility manager 65 375,254 61% 0% 39%100
%Other information-based 55 0 0% 0% 0% 0%Capital Investment Projects 83 377,959 71% 12% 17%
100%
Vehicle for individual 31 265,831 91% 5% 4%100
%
Vehicle for agency 32 112,090 24% 28% 48%100
%
Vanpool vehicles 4 38 100% 0% 0%100
%Other capital investments 16 0 0% 0% 0% 0%Planning Projects 11 0 0% 0% 0% 0%Feasibility studies 11 0 0% 0% 0% 0%
Total102
7 55,275,
245 81% 12% 7%100
%Table 4-9
One-Way Trips by Service Type and Size of Urbanized Area (Percentage by Row)
[38]

Figure 4-10One-Way Trips by Service Type and Size of Urbanized Area
(Percentage by Row)
[39]
Vehicle for agency (N=32)
Flexible routing (N=61)
Demand response (N=237)
Mobility manager (N=65)
Shuttle/Feeder (N=52)
User-side subsidy (N=38)
Fixed route (N=397)
Vanpool (N=28)
Vehicle for individual (N=31)
Vanpool vehicles (N=4)
0% 20% 40% 60% 80% 100%
Large Urban Small Urban Non-urban

Table 4-10One-Way Trips by Service Type and Size of Urbanized Area
(Percentage by Column)
Service Type # TripsLarge Urban
Small Urban
Non-Urban
Total
Trip-Based Services 81354,522,0
32 99% 99% 94% 99%
Fixed route 39747,363,00
9 91% 74% 43% 86%Demand response 237 3,054,526 2% 10% 35% 6%Flexible routing 61 1,431,176 1% 12% 7% 3%Shuttle/Feeder 52 1,229,871 2% 3% 7% 2%Vanpool service 28 870,453 2% 0% 2% 2%User-side subsidy 38 572,997 1% 1% 1% 1%Information-Based Services 120 375,254 1% 0% 4% 1%Mobility manager 65 375,254 1% 0% 4% 1%Other information-based 55 0 0% 0% 0% 0%Capital Investment Projects 83 377,959 1% 1% 2% 1%Vehicle for individual 31 265,831 1% 0% 0% 0%Vehicle for agency 32 112,090 0% 0% 1% 0%Vanpool vehicles 4 38 0% 0% 0% 0%Other capital investments 16 0 0% 0% 0% 0%Planning Projects 11 0 0% 0% 0% 0%Feasibility studies 11 0 0% 0% 0% 0%
Total102
7 55,275,
245 100% 100% 100%100
%
[40]
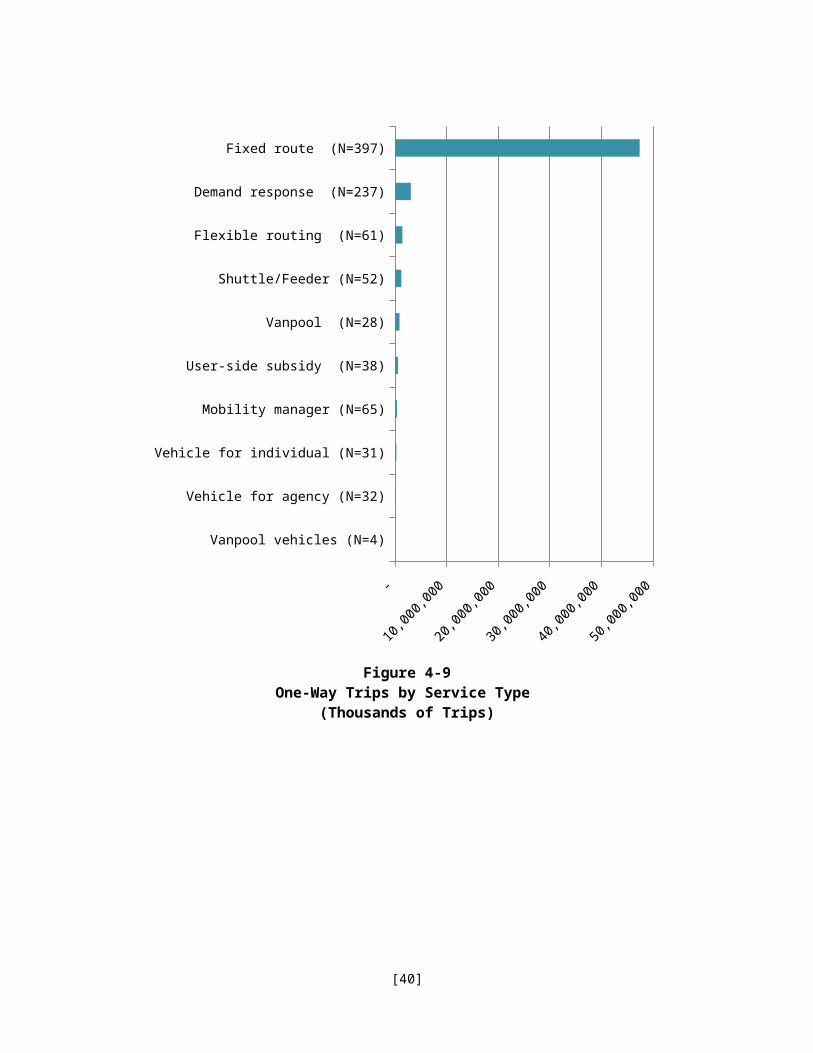
Figure 4-11One-Way Trips by Service Type and Size of Urbanized Area
(Percentage by Column)
[41]
Large urban Small urban Non-urban0%
20000000%
40000000%
60000000%
80000000%
100000000%
120000000%
140000000%
160000000%
40,
982,
360
4,7
48,9
33
1,6
31,7
16
Fixed route (N=397) Demand response (N=237)Shuttle/Feeder (N=52) Vanpool (N=28)User-side subsidy (N=38) Flexible routing (N=61)Vehicle for individual (N=31) Mobility manager (N=65)Vehicle for agency (N=32) Vanpool vehicles (N=4)
Fixed-route trips

Compare Trips and ServicesThe analysis compared the number of trips by service type with the number of programs, focusing on trip-based services. As Table 4-4 and Figure 4-4 illustrate, there is a clear divergence between the number of programs and the number of trips. Specifically: Overall, trip-based services comprised 79% of the services but (by
definition) 99% of the one-way trips. Fixed routes accounted for 39% of the JARC services but 86% of all one-
way trips. Demand response was the second most commonly reported service type,
with 23% of the programs, but carried only 6% of the trips. This pattern likely reflects several factors. First, as described earlier in this chapter, fixed routes are more likely to use larger vehicles than other types of JARC-supported services and to travel through densely developed and high-ridership corridors. Demand response services typically use vans and mini-buses, which carry fewer passengers than full-size buses, and they are more likely to operate in low-density rural communities. Second, for purposes of this analysis, when a grant recipient used JARC funds to purchase a vehicle and place that vehicle in service, the resulting trips were assigned to the service rather than to the capital investment. Similarly, when a mobility manager program also provided service directly, the trips were attributed to the trip-based service and not to the mobility manager. These analytical conventions were intended to reduce double-counting but they also further affected the number of trips reported for information-based programs and capital projects in this analysis.
[42]
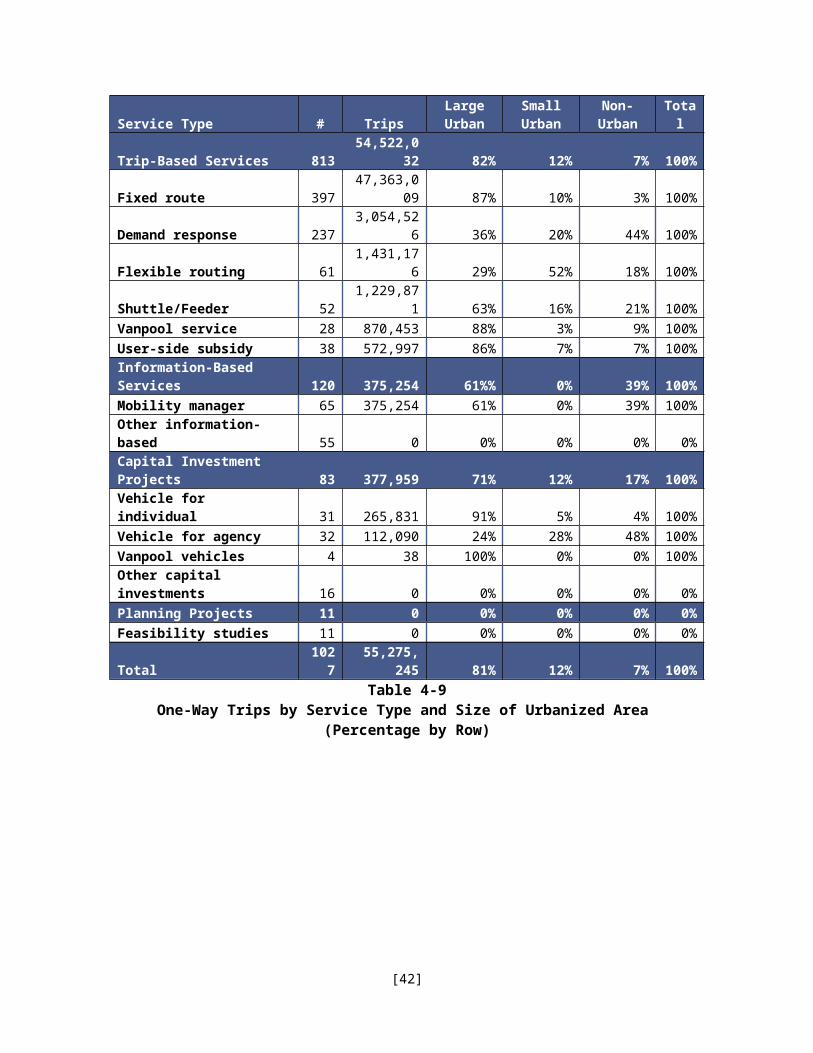
Table 4-11Comparison of Services and One-Way Trips
(Percentage by Column)
Service TypeServices
One-Way Trips
# % # %
Trip-Based Services 81379%
54,522,032
99%
Fixed route 397 39%47,363,0
09 86%
Demand response 237 23%3,054,52
6 6%
Flexible routing 61 6% 1,431,17
6 3%
Shuttle/Feeder 52 5%1,229,87
1 2%Vanpool service 28 3% 870,453 2%User-side subsidy 38 4% 572,997 1%
Information-Based Services 12012% 375,254 1%
Mobility manager 65 6% 375,254 1%One-on-one transit training 15 1% N/A 0%Materials and marketing 13 1% N/A 0%Transportation resource training 10 1% N/A 0%One-stop center 9 1% N/A 0%Trip/itinerary planning 5 0% N/A 0%Internet-based information 3 0% N/A 0%Capital Investment Projects 83 377,959 1%Vehicle for individual 31 3% 265,831 0%Vehicle for agency 32 3% 112,090 0%Vanpool vehicles 4 0% 38 0%ITS investments 12 1% N/A 0%Other capital projects 3 0% N/A 0%Car-sharing 1 0% N/A 0%Planning Projects 11 1% N/A 0%Feasibility studies 11 1% N/A 0%
Total 1027100
%55,275,
245100
%
[43]

Figure 4-12Comparison of Services and One-Way Trips
(Percentage by Column)
[44]
Vanpool vehicles
Vehicle for agency
Vehicle for individual
Mobility manager
User-side subsidy
Vanpool
Shuttle/Feeder
Flexible routing
Demand response
Fixed route
0% 10% 20% 30% 40% 50% 60% 70% 80% 90%
Trips Services

Chapter 5: Jobs AccessedAs indicated in Chapter 1, FTA has established two key performance measures for JARC program: One-way trips provided Jobs accessed
One-way trips, summarized in the previous chapter, are a standard transportation measure that most service providers capture routinely. The number of jobs accessed, on the other hand, is not a conventional measure of transit performance. Because most transportation organizations do not have ready access to employment data, especially information about job locations, JARC recipients were not asked to report jobs accessed directly. Instead, FTA asked the JARC Evaluation Team to develop an approach for collecting information about jobs accessed. The team initially developed a methodology for estimating jobs accessed for the FY 2006 data analysis and refined the approach for subsequent data collection cycles. Rather than asking JARC recipients to report the number of jobs accessed, the team asked grantees to provide information about service coverage and then used external data sources to develop estimates of jobs accessed. This approach yielded three estimates of jobs accessed which, taken together, provide an overview of the success of JARC services in helping people reach jobs: Jobs made accessible – The total number of jobs available within the
service coverage area for JARC-supported services, independent of service level or vehicle capacity.
Low-wage jobs made accessible – The total number of low-wage or entry-level jobs available within the service coverage area for JARC-supported services, independent service level or vehicle capacity.
Jobs likely reached – The number of jobs that riders likely reached via JARC-supported services during the reporting year, taking into account service levels and vehicle capacity.
For FY 2010, JARC-supported services made 53.7 million jobs accessible, which included 26.5 million low-wage jobs. In addition, 15.9 million jobs were likely reached during the service year.
[45]

The elements of the methodology are described briefly below; Appendix B provides more detail. Jobs Estimation Methodology Because of the different characteristics of demand response and fixed route transportation, a combination of approaches was used to develop these estimates. For jobs made accessible by fixed route, flexible, and shuttle/feeder
services, a factor was developed to estimate jobs per linear route mile using external data sources.
For jobs made accessible via demand response services, jobs in the overall service area were counted using external data sources.
Jobs were classified as low-wage if they paid less than $33,075 per year or $15.90 per hour. Estimates were based on national averages for median wages in 2009 using standard industrial classifications.
For jobs likely reached, reported one-way trips were adjusted to reflect work trips using standard industry definitions.
Using these multiple approaches, the evaluation team developed estimates of jobs accessed for JARC trip-based services.
Fixed-route servicesTo estimate the number of jobs made accessible by fixed-route services, the team developed a jobs density factor that measured the average number of jobs located within one-quarter mile of the route in each direction. The FY 2010 analysis used the
following jobs density factors: For all jobs, 3,321 jobs per square mile or 1,661 jobs per linear route mile. For low-wage jobs, 1,595 jobs per square mile, or 798 jobs per linear route
mile.
These factors represent a 7% decrease over the equivalent factors developed for the FY 2009 analysis. The current factor is based on employment information from 2009 and may reflect changing economic conditions between 2009 and 2008 (the year used to support the FY 2009 analysis).
[46]
It is difficult to quantify a feeling of accomplishment, developing a sense of worth, the satisfaction of a job well done, a smile, a person saying "I did it," the pride of earning a paycheck and being able to support yourself or your loved ones.
Cochise County Association for the HandicappedArizona DOT

Grantees reporting fixed routes, flexible routes, or shuttle/feeder services were asked to report unique route miles for each service. Unique route miles were defined as the length of the route in miles, from start to finish without duplication. After totaling the mileage reported for all routes in these categories, the team applied the jobs density factor to estimate total jobs made accessible and low-wage jobs made accessible. Demand response servicesTo measure jobs accessed by demand response services, the team calculated total jobs in the service area. For each demand response service, grantees were asked to identify the county or counties served and to indicate how much of the county the service covered. Using an automated process, the evaluation team extracted jobs information from a Census database for each county with demand response service. Totals for all jobs and low-wage jobs were extracted. The team then adjusted the findings based on percentage of coverage and eliminated duplicates (where multiple services operated within the same county). Summing the records yielded an estimate of all jobs and low-wage jobs made accessible by demand response services. Jobs likely reachedThe approach described above provides an estimate of the number of jobs that JARC programs made accessible based on the geographic coverage of the route or service. This approach is consistent with FTA’s policy decision to measure the performance of most trip-based JARC programs according to the total number of jobs and low-wage jobs in the service region – in other words, the jobs that a customer could in principle reach using the service. This measure highlights the capability of JARC services to make jobs in a particular service region accessible to workers.But while a service might be expected to reach any job in its service area, under normal circumstances, no transit service could be expected to provide transportation to every job in its service region simultaneously. Therefore, the team developed an estimate of jobs likely reached to reflect service availability and capacity constraints. The methodology uses the following steps and assumptions:
[47]
JARC rides are coordinated with other public transit rides, which gives the JARC passengers the opportunity to do things like stop at the library to check out books, stop for a haircut, pick up their own prescriptions, pick up groceries for their families, stop to buy a birthday present for a family member. Without public transportation, the passengers would have to wait until a family member had time to take them to do these things.

Take total one-way trips as reported by recipients for trip-based services with a defined service area (defined as fixed route, demand response, flexible routes, and shuttles).
Divide the number of one-way trips by two to represent individuals. Estimate the percentage of people making commute trips, which will
serve as a proxy for jobs accessed. According to the American Public Transportation Association, 59.2% of transit trips in 2007 were commuting trips (traveling between home and work).2 For ease of calculation, this example uses 60%.
Because this calculation uses trips for its baseline, it cannot be directly compared to measures of potential jobs accessed. Instead, it reflects annual commuting trips without reference to job status or duration (e.g., full-time, part-time, or seasonal). But in the absence of a direct local measure of jobs actually reached for every JARC-funded service, the estimate of jobs likely reached can acknowledge the limitations of vehicle capacity and scheduling constraints. Appendix B shows the detailed calculations. Targeted JobsRecipients had the option to indicate the number of jobs that their JARC-supported services targeted. The question was originally intended for grantees with specialized services, such as routes that served a particular factory or night-owl services that accessed the night shift at a shipping facility. For FY 2010, recipients indicated that about 35% of all programs targeted specific jobs (almost exclusively trip-based), but they provided job estimates for only 22% of programs. These services were designed to reach about 1.5 million jobs. Table 5-1 shows the distribution of targeted jobs by service type and the percentage of services in each category for which information on targeted jobs was reported.As the table shows, recipients reported targeted jobs for one out of five trip-based services. Because it is impossible to know if the services for which targeted trips were reported were representative of the universe of trip-based services, the information cannot be expanded to represent all trip-based services. However, this information provides additional insight into the performance of JARC-supported services based on local knowledge. Jobs Accessed in FY 2010This analysis of jobs made accessible and jobs likely reached yielded the following estimates for FY 2010: 53.7 million jobs made accessible2 2011Public Transportation Fact Book. Available online at: http://apta.com/resources/statistics/Documents/FactBook/APTA_2011_Fact_Book.pdf
[48]
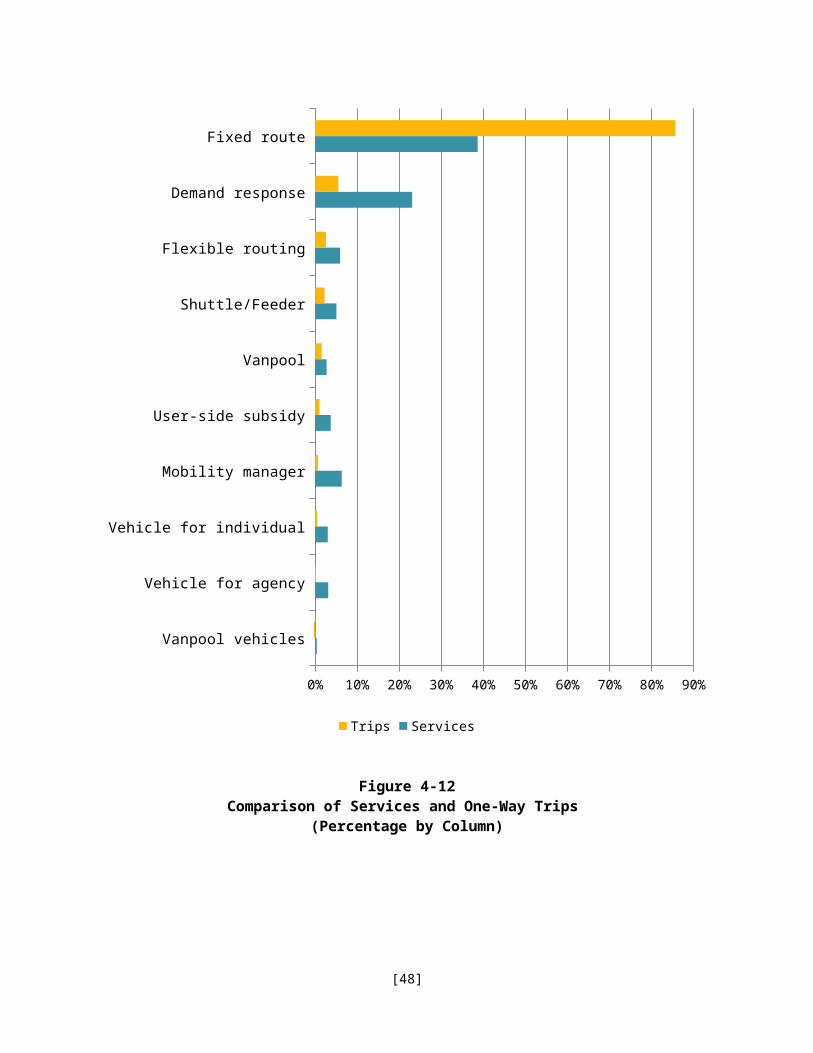
26.5 million low-wage jobs made accessible. 15.9 million jobs likely reached 1.5 million targeted jobs
As Table 5-2 shows, demand response services connected passengers with nearly half of the jobs made accessible in FY 2010 and fixed routes provided access to 44%. Demand response services tend to cover larger geographic areas than fixed routes or shuttles – sometimes entire counties compared to narrow urban corridors – and larger service areas may make more jobs potentially accessible. The estimate of jobs likely reached, which incorporates assumptions about service levels and vehicle capacity, shows a different distribution. The analysis of jobs likely reached suggests that fixed route services provided access to 89% of all jobs reached in FY 2010 and that demand response served 6%. Since the estimated of jobs likely reached is based primarily on one-way trips, the dominance of fixed route services – which carried 86% of all one-way trips – is plausible. The findings reflect the data reported by grantees and do not incorporate any expansion factors or other efforts to interpret missing records.
[49]

Table 5-12Targeted Jobs by Service Type
Service TypeTargeted
Jobs%
ReportingFixed route 1,208,564 23%Demand response 84,342 20%Flexible routing 65,857 39%User-side subsidy 35,273 16%Vanpool service 29,276 18%Shuttle/feeder 28,504 35%Vehicle for individual 48 3%Total 243300 22%
Table 5-13Jobs Accessed Estimate
All Jobs Made
Accessible
Low-Wage Jobs
Made Accessible
Jobs Likely Reached
Service type # % # % # %Demand response
24,825,393 46%
12,631,442 48% 916,358 6%
Fixed route23,821,5
33 44%11,440,9
35 43%14,208,90
3 89%
Flex route3,601,62
5 7%1,729,77
8 7% 429,353 3%
Shuttle feeder1,399,80
2 3% 672,293 3% 368,961 2%
Total jobs53,648,3
52100
%26,474,4
47100
%15,923,5
75100
%
[50]

Chapter 6: Primary GoalsAs described in Chapter 1, the JARC service matrix was developed to provide a user-friendly way to summarize JARC-funded services based on service type and primary goal. The matrix allows FTA to extend its analysis beyond one-way trips and jobs accessed by also capturing program performance outputs from non-traditional services. Program GoalsRecipients were asked to indicate the primary goal for each JARC-supported service. Although many programs have multiple goals, for the purposes of this analysis, recipients were asked to select only one goal. The five goals are: Expanded geographic coverage Extended service hours or days Improved system capacity Improved access/connections Improved customer knowledgeWhen developing the matrix, FTA made certain assumptions about the relationship between service types and project goals, and not every combination was considered reasonable. For example, grantees reporting on mobility manager programs were only allowed to select improved access / connections as a goal; the other choices were not available. Cells that were not available for data entry are grayed out on the matrix tables in this chapter. . The following three tables show JARC-supported services in relation to the five goals. Table 6-1 shows the number of services, Table 6-2 shows the percentage of by service type, and Table 6-3 shows the percentage by goal.For FY 2010, the most commonly selected goals were expanded geographic coverage (30%), improved access/connections (30%), and extended service hours or days (21%). Other major findings include: Fixed route services were most likely to provide expanded geographic
coverage (42%) and extended service hours or days (31%). Demand response programs were almost equally likely to offer expanded
geographic coverage (30%), extended service hours or days (27%), or improved access/connections (24%).
Shuttles were most likely to select expanded geographic coverage as the primary goal (54%).
[51]

This transportation is the only option for low income job seekers and workers. Many have found employment or have been able to retain employment using Village Vans. The impact doubles because of the innovative Job Skills Program component which utilizes eligible volunteers to drive the vans.
Intercity Transit
All programs obtaining vehicles for transit agencies (100%) reported a primary goal of improved system capacity.
About 54% of services with a primary goal of expanded geographic coverage were fixed route and 23% were demand response. Services with a primary goal of extended service hours or days showed a similar pattern. More than half were fixed route (57%) and 29% were demand response.
The mix of programs with a primary goal of improved system capacity included demand response (35%), fixed route (27%), and vehicle for agency (12%).
Programs providing improved access/connections included fixed route (23%), mobility manager (21%), demand response (18%), and vehicles for individuals (10%). Note that this was the only goal available for mobility manager services.
Virtually all of the programs with a primary goal of improved customer knowledge were defined as information-based services, including travel training (26%), marketing materials (22%), group training (17%), and one-stop centers (16%). This was the only goal available to most of the services in the information-based category. Planning studies made up 5% of the services with this primary goal.
Figure 6-1 shows the trend in program goals from FY 2007 through FY 2010. The percentage of programs reporting extended service hours or days decreased from 29% in FY 2007 to 21% in FY 2009, while the shares for improved system capacity and improved access/connections increased. This shift likely reflects the increase in information-based services and capital
investments and the corresponding decrease in trip-based services during this period. The goal extended service hours or days was commonly associated with trip-based services, especially fixed route and demand response programs, so the decrease in services in these categories would likely show up in the distribution of goals. In addition, the number of service hours or days is finite, so systems may have reached their limit with temporal expansion and turned to other types of improvements, such as better connections or more capacity. Similarly, only one goal was associated with mobility managers – improved access/connections – so this change is
[52]

consistent with the expanded representation of information-based programs in FY 2010.
[53]
Figure 6-13JARC Services by Primary Goal
FY 2007 – FY 2010
[54]
FY 2007 FY 2008 FY 2009 FY 20100%
10%
20%
30%
40%
50%
60%
70%
80%
90%
100%
27% 27% 27% 30%
29% 30% 31% 30%
29% 27% 24% 21%
9% 11% 13% 13%
5% 5% 5% 6%
Access/connections Geographic coverage Service hours or daysSystem capacity Customer knowledge
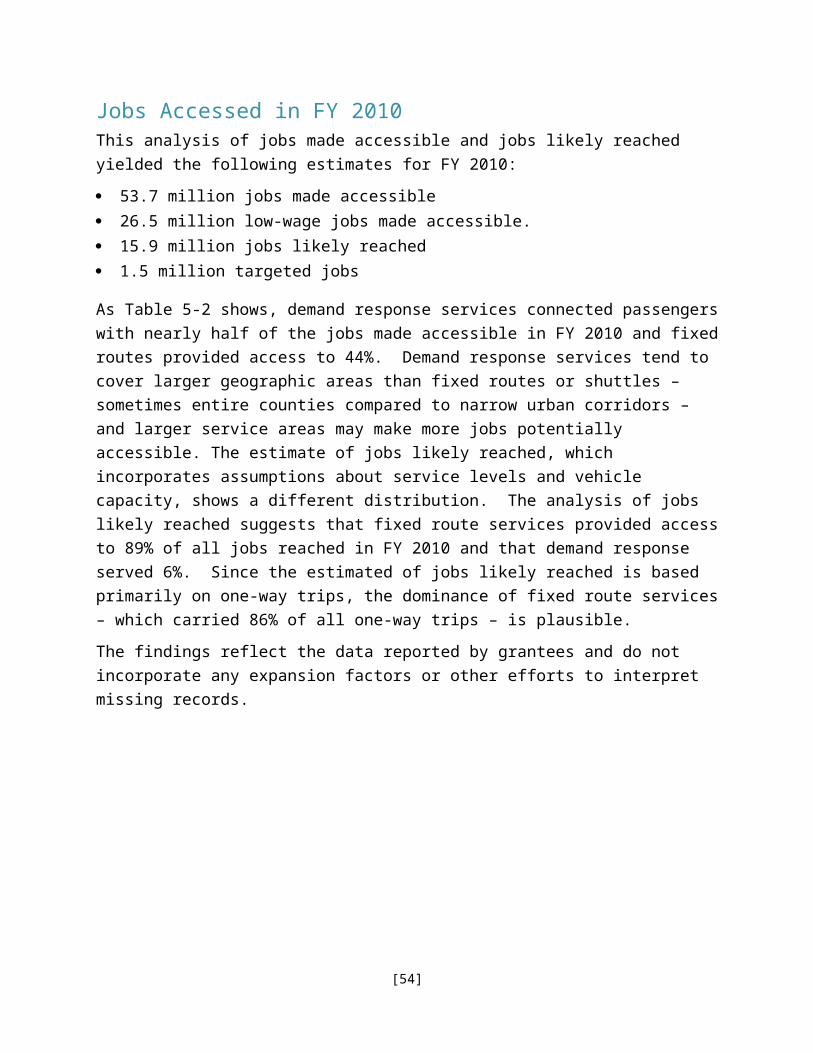
Program OutputsThe JARC service matrix was designed to enable FTA to capture information about the range of benefits that JARC-funded services provide – benefits that extend beyond the traditional measure of one-way trips. Grant recipients were asked to report on the outputs of their JARC-funded services. These measures were developed by FTA, in consultation with the Project Advisory Committee, and included the following: One-way trips – All trip-based services and programs that generated
trips, like mobility managers and vehicle acquisition programs, were asked to report one-way trips.
Customer contacts – Mobility managers, along with other information-based programs that worked with individuals on a one-on-one basis, reported customer contacts.
Customers served – This measure applied to web-based programs and was designed to reflect site visitors or similar analytic measures of Internet activity.
People trained – Programs that provide training, either to individuals or to groups, were asked to estimate the number of individuals who received training.
Materials distributed – Programs that developed marketing brochures or similar products were asked to provide a brief description of their materials.
Vehicles added – This measure applied to programs that acquired vehicles for agencies or individuals.
For programs that were less easy to categorize, like ITS-related hardware or software improvements or feasibility studies, recipients provided a brief description of the program or investment. Table 6-4 shows the distribution of program outputs by service type and primary goals. Highlights are presented in the following sections.Trip-based servicesAs reported in Chapter 4, JARC-supported trip-based services generated 55.3 million one-way trips in FY 2010. Table 6-4 shows the breakdown by service type and goal: One-way trips from fixed-route services dominated the reporting and were
most likely to be associated with programs providing expanded geographic coverage (15 million), improved access/connections (12 million), and improved system capacity (11.8 million).
Demand response services were almost equally likely to provide expanded geographic coverage, improved system capacity, and extended
[55]
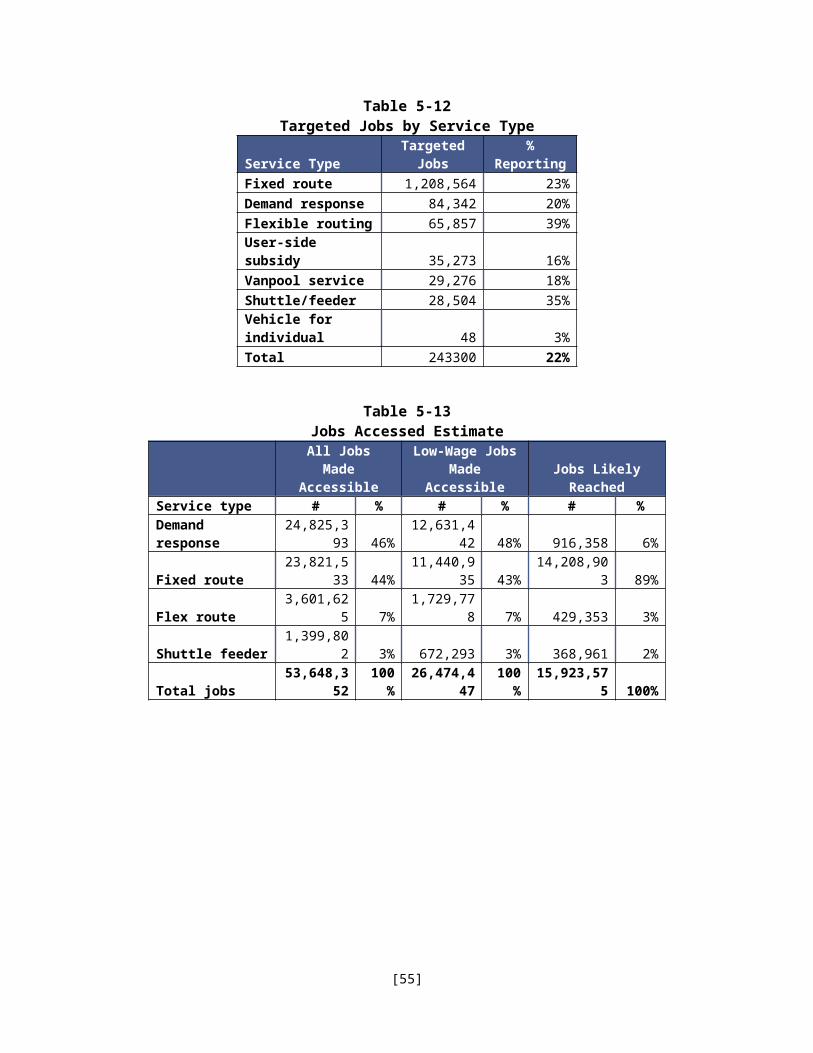
service hours or days. Demand response services generated more than 800,000 trips in each of these categories.
Flexible routes were most likely to provide expanded geographic coverage, with more than 780,000 trips associated with this goal.
Information-based servicesThis category included a broad mix of programs, from mobility managers to Internet-based information. Some of the major findings: Mobility managers generated over 375,000 one-way trips and initiated
more than 350,000 customer contacts. Internet-based programs received more than 125,000 visits. Almost 3,300 people participated in group travel resource training and
3,600 received one-on-one transit training.Grant recipients reporting mobility manager programs had the option to report one-way trips with the service component of their program (e.g., demand response service). Therefore, the trip numbers associated with mobility managers may understate the impacts of those investments. Capital investment programsThis category included programs providing transit vehicles for agencies, vehicles for vanpool programs, autos for individuals, and car-sharing services. Highlights included: Agencies added almost 50 vehicles, which generated more than 112,000
one-way trips. About 70% of the trips were associated with programs designed to improve access / connections.
Grant recipients provided almost 1,700 car loans to individuals, which generated more than 265,000 one-way trips.
ITS-related improvements included call center upgrades, scheduling software, and automated annunciators.
Other capital improvements included bicycle distribution and route sign improvements.
Grant recipients that used JARC funding to purchase agency vehicles had two options for reporting one-way trips. Some categorized the trip information as part of the capital project; others reported the service component separately, for example as a demand-response or fixed route service. Accordingly, the trip numbers associated with capital vehicle purchases understate the impacts of those investments. Planning studiesThis category was added for FY 2010 and grantees reported 11 programs, including community mobility studies and needs assessments.
[56]
[57]
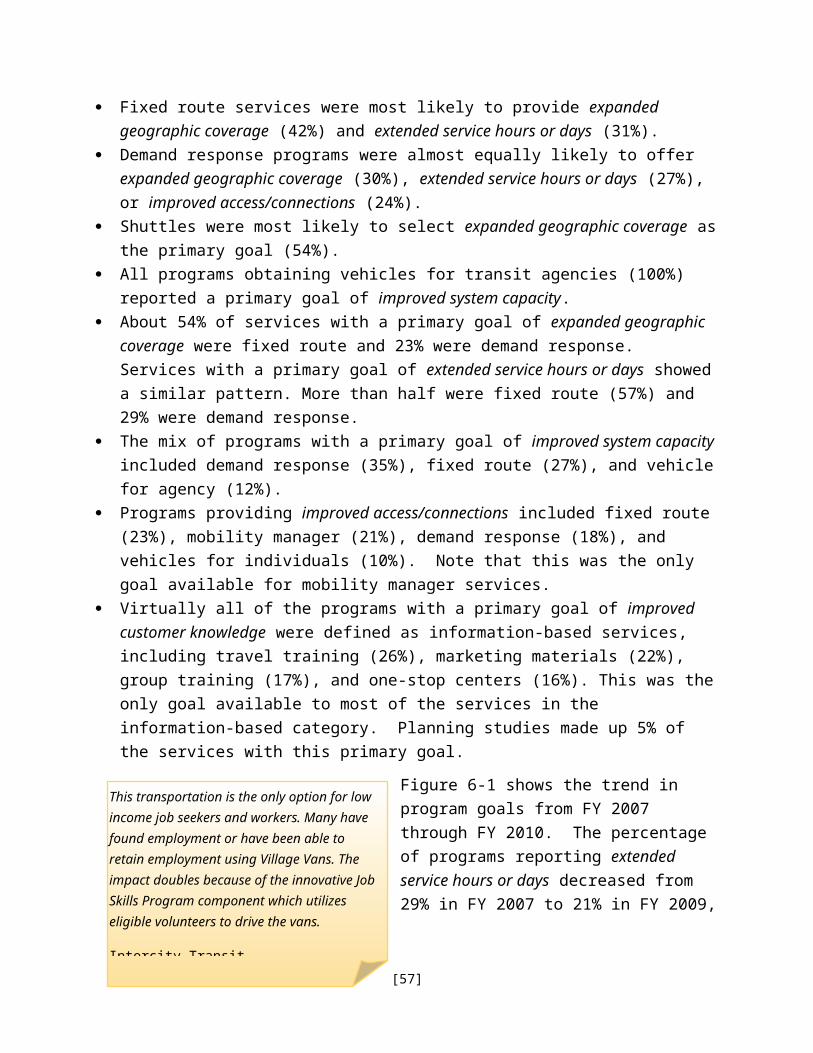
Primary Goal
Service Type
(A)Expanded geographi
c coverage
(B)Extended hours/day
s of service
(C)Improved system capacity
(D)Improved access/
connections
(E)Improved customer knowledg
eI. Trip-Based 292 212 110 199 01. Fixed route 167 124 36 702. Flexible routing 24 19 8 103. Shuttle/Feeders 28 2 6 164. Demand response 71 63 47 565. Vanpool service 8 206. User-side subsidy 2 4 5 27
II. Information-Based 65 551. Mobility manager 652. One-stop center 93. Itinerary planning 54. One-on-one transit
training 155. Internet-based info 36. Materials and
marketing 137. Transportation
resource training 10III. Capital Investment 12 6 23 421. Vehicle for
individual 312. Vehicle for agency 10 6 163. Vanpool vehicles 1 34. Car-sharing 1 05. ITS investments 6 6 06. Other capital
projects 1 0 0 2 0IV. Planning Studies 3 1 0 4 3
1. Feasibility study 3 1 0 4 3Total 307 219 133 310 58
Table 6-14JARC Service Matrix – Distribution of Services by Primary Goal
(Number of services)
Note that grayed-out cells were not available for data entry.
[58]

Table 6-15JARC Service Matrix – Distribution of Services by Primary Goal
(Percentage by row)Primary Goal
Service Type
(A)Expanded geographi
c coverage
(B)Extended hours/day
s of service
(C)Improved system capacity
(D)Improved access/
connections
(E)Improved customer knowledg
eI. Trip-Based 36% 26% 14% 24% 0%1. Fixed route 42% 31% 9% 18%2. Flexible routing 39% 31% 13% 16%3. Shuttle/Feeders 54% 4% 12% 31%4. Demand response 30% 27% 20% 24%5. Vanpool service 29% 71%6. User-side subsidy 5% 11% 13% 71%
II. Information-Based 0% 0% 0% 54% 46%1. Mobility manager 54% 46%2. One-stop center 0%3. Itinerary planning 100%4. One-on-one transit
training 100%5. Internet-based info 100%6. Materials and
marketing 100%7. Transportation
resource training 100%III. Capital Investment 14% 7% 28% 51% 0%1. Vehicle for
individual 100%2. Vehicle for agency 31% 19% 50%3. Vanpool vehicles 25% 75%4. Car-sharing 100% 0%5. ITS investments 50% 50% 0%6. Other capital
projects 33% 0% 0% 67% 0%IV. Planning Studies 27% 9% 0% 36% 27%
1. Feasibility study 27% 9% 0% 36% 27%Total 30% 21% 13% 30% 6%
Note that grayed-out cells were not available for data entry.
Rows add up to 100%.
[59]
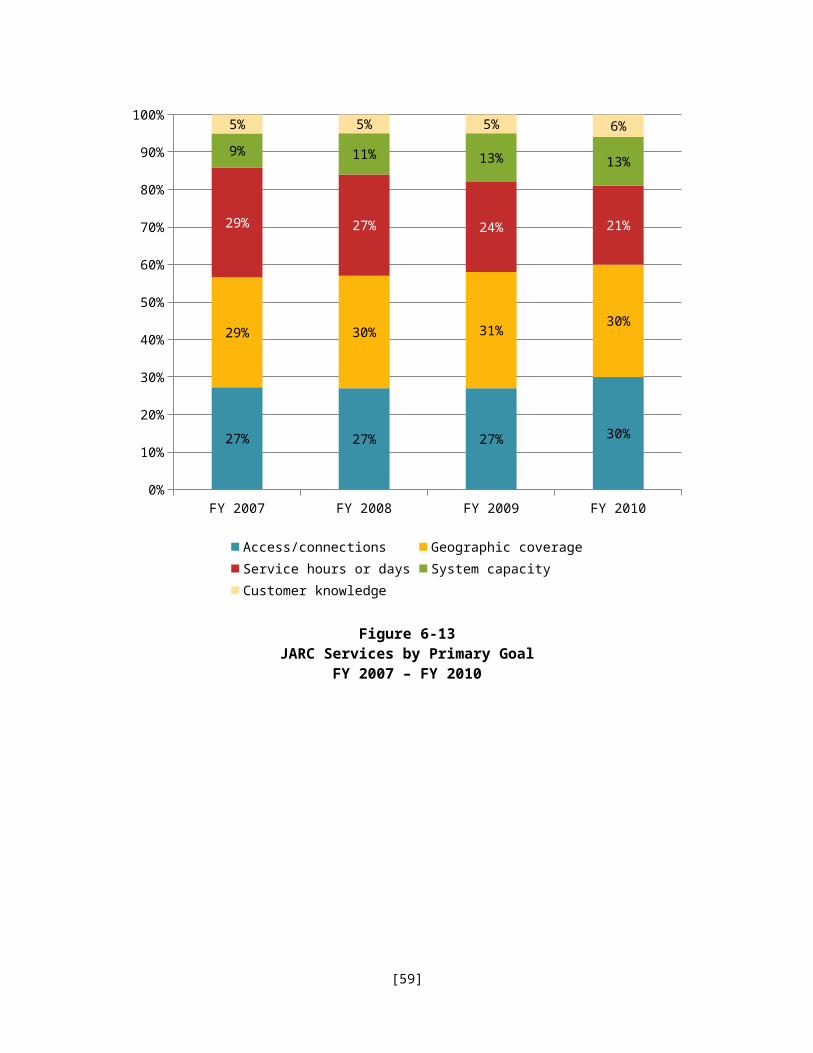
Table 6-16JARC Service Matrix – Distribution of Services by Primary Goal
(Percentage by column)Primary Goal
Service Type
(A)Expanded geographi
c coverage
(B)Extended hours/day
s of service
(C)Improved system capacity
(D)Improved access/
connections
(E)Improved customer knowledg
eI. Trip-Based 95% 97% 83% 64% 0%1. Fixed route 54% 57% 27% 23%2. Flexible routing 8% 9% 6% 3%3. Shuttle/Feeders 9% 1% 5% 5%4. Demand response 23% 29% 35% 18%5. Vanpool service 6% 6%6. User-side subsidy 1% 2% 4% 9%II. Information-Based 0% 0% 0% 21% 95%1. Mobility manager 21%2. One-stop center 16%3. Itinerary planning 9%4. One-on-one transit
training 26%5. Internet-based info 5%6. Materials and
marketing 22%7. Transportation
resource training 17%III. Capital Investment 4% 3% 17% 14% 0%1. Vehicle for
individual 10%2. Vehicle for agency 3% 3% 12%3. Vanpool vehicles 1% 1%4. Car-sharing 0% 0%5. ITS investments 5% 2% 0%6. Other capital
projects 0% 0% 0% 1% 0%IV. Planning Studies 1% 0% 0% 1% 5%
1. Feasibility study 1% 0% 0% 1% 5%Total 100% 100% 100% 100% 100%
Note that grayed-out cells were not available for data entry.
Columns add up to 100%.
[60]
Table 6-17JARC Service Matrix – Service Outputs by Primary Goal
Primary Goal
Service Type
(A)Expanded geographi
c coverage
(B)Extended hours/day
s of service
(C)Improved system capacity
(D)Improved access/
connections
(E)Improved customer knowledg
eI. Trip-Based
1. Fixed route15,047,93
9 trips8,529,849
trips11,787,53
7 trips11,997,68
4 trips
2. Flexible routing780,219
trips466,159
trips55,039 trips
129,759 trips
3. Shuttle/Feeders630,873
trips1,040 trips
312,909 trips
285,049 trips
4. Demand response870,967
trips824,847
trips841,181
trips517,531
trips
5. Vanpool service482,025
trips388,428
trips
6. User-side subsidy 010,493 trips
115,500 trips
447,004 trips
II. Information-Based
1. Mobility manager
375,254 trips
347,484 customer contacts
2. One-stop center
42,033 customer contacts
3. Itinerary planning
3,891 customer contacts
4. One-on-one transit training
3,600 trained
5. Internet-based info
125,181 served
6. Materials and marketing
Various, including
brochures, maps,
advertising,
marketing materials
7. Transportation resource training
3,273 trained
[61]
Primary Goal
Service Type
(A)Expanded geographi
c coverage
(B)Extended hours/day
s of service
(C)Improved system capacity
(D)Improved access/
connections
(E)Improved customer knowledg
eIII. Capital Investment
1. Vehicle for individual
265,831 trips1,684
vehicle loans
2. Vehicle for agency
27,760 trips15
vehicles added
4,458 trips13
vehicles added
79,872 trips20
vehicles added
3. Vanpool vehicles3 vehicles
added6 vehicles
added
4. Car-sharing
1,015 trips250
vehicles added N/A
5. ITS investments
Various upgrades, including
call center,
AVL, schedulin
g
Various, including VOIP, GIS schedulin
g software, automate
d annunciat
ors N/A
6. Other capital projects N/A N/A N/A
Various, including bicycle sharing,
route signs N/A
IV. Planning Studies
1. Feasibility studies
Coordinated
planningFeasibility
study N/AMobility planning
Needs assessme
nt
Trips are one-way trips.
Note that grayed-out cells were not available for data entry.
[62]
Chapter 7: ConclusionsThis report includes the results of the data analysis for the FTA JARC program for the FY 2010 reporting period, which corresponds to the federal fiscal year beginning on October 1, 2009, and ending on September 30, 2010. The program goals correspond to federal performance measurements required by regulations. JARC HighlightsGrantees reported a total of 1,027 active JARC-funded services for FY 2010. JARC-supported services provided 55.3 million one-way trips. JARC-supported services made 53.6 million jobs accessible, which
included 26.5 million low-wage jobs. In addition, 15.9 million jobs were likely reached during the service year.
Out of the active JARC-funded services, most were trip-based (79%). The remaining projects comprised information-based programs (12%), capital investments (8%), and planning studies (1%).
Fixed routes accounted for 39% of the JARC services but 86% of all one-way trips.
Demand response was the second most commonly reported service (23%) but generated only 6% of the trips.
Just under half of JARC-supported services operated in large urbanized areas (47%) and 30% could be found in non-urbanized or rural communities. The balance shifts for one-way trips, however. About 82% of trips generated by JARC-supported services were in large urbanized areas and 7% in rural settings.
Mobility managers generated more than 375,000 one-way trips and initiated 347,000 customer contacts.
Agencies added almost 50 vehicles, which generated more than 112,000 one-way trips. About 70% of the trips were associated with programs designed to improve access / connections.
Grant recipients provided almost 1,700 car loans to individuals, which generated more than 265,000 one-way trips.
[63]
A recent survey of riders indicated that approximately 70% would be unemployed were it not for the transportation service provided to their work place. These individuals simply have no other transportation options available to them.
DuPage CountyRegional Transportation Authority
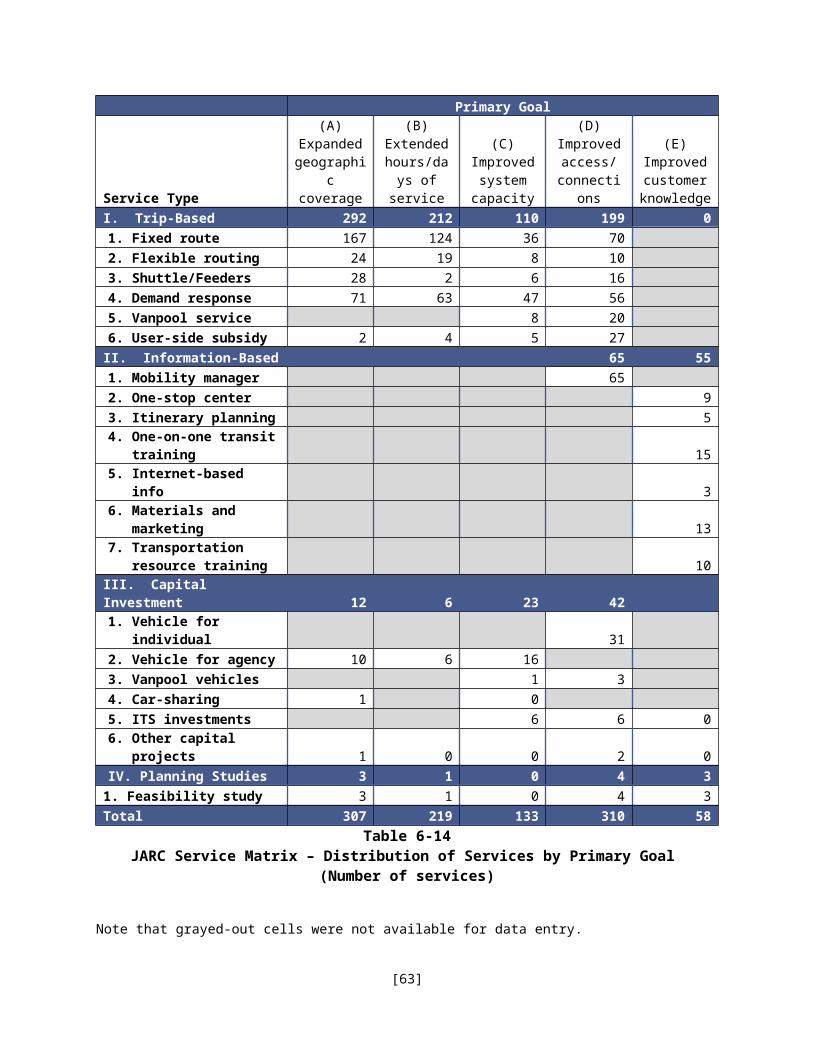
The most commonly selected goals were expanded geographic coverage (30%), improved access/connections (30%), and extended service hours or days (21%).
While the numbers associated with non-trip-based services like mobility managers and vehicle-loan programs are small in relation to one-way trips and jobs accessed, they represent very real mobility benefits at a local level. By using the matrix approach described in this report, FTA can capture this information and ensure that the benefits of these non-traditional programs are not overshadowed by the measures of one-way trips and jobs accessed. Program ProfilesFinally, FTA continued to collect program profiles, or summaries, for each JARC service. While ridership and jobs-accessed statistics allow FTA to provide a national summary of the JARC program, the profiles allow the grantees to represent the human side of these transportation programs. These qualitative descriptions complement the data collection and provide an additional avenue for understanding the impacts and benefits of both grant programs. The profiles provide a rich source of detailed information about the JARC program and are provided in their entirety under separate cover. For convenience, they are organized in 10 separate documents based on the FTA regions. In addition, relevant excerpts have been incorporated throughout this summary report. As the program profiles made abundantly clear, the JARC program allows transportation providers to connect with their riders and customers on a human scale.
[64]

Appendix AJARC Service MatrixThe following information describes in more detail how the JARC service matrix was developed and how JARC grant recipients use it for annual Program Performance Evaluation (PPE) reporting purposes.A JARC service matrix was initially developed through a collaborative effort between the JARC Evaluation Team and the Community Transportation Association of America’s Joblinks Advisory Committee. The matrix was later refined working with the JARC / New Freedom Advisory Committee, formed to assist the evaluation team with refinement of the JARC and later New Freedom reporting process.The intent of the matrix reporting approach was two-fold: Make reporting easier for grant recipients Capture performance information about non-traditional programsFirst, the service matrix was designed to make it easier for grantees to report on services provided. Once they selected the primary goal and service type, grantees were directed to a data entry form that included only those questions relevant to the service type / goal combination. For example, grantees reporting demand response services were asked to report the number of one-way trips provided, while those providing travel training were asked to indicate the number of individuals trained. Second, the matrix structure represents the diversity of JARC-funded programs. The numbers associated with non-trip-based services like mobility managers and vehicle-loan programs are small in relation to one-way trips and jobs accessed, but they represent very real mobility benefits at a local level. The matrix approach allows FTA to capture this information and ensure that the benefits of these non-traditional programs are not overshadowed by the measures of one-way trips and jobs accessed. A copy of the JARC reporting matrix follows. The matrix includes five primary goals (columns A-E) that were identified to be core elements of JARC-funded services. The rows are grouped by the four categories of projects – (I) trip-based services, (II) information-based services, (III) capital investment projects, and (IV) planning studies. Each category includes a list of services or projects that are commonly provided in each category and supported by the JARC program. The cells within the table indicate the primary reporting information to be provided by each type of service, according to the primary
[A-1]

goal related to the service. The JARC matrix was first implemented with the FY 2006 reporting period.Beginning with the FY 2007 / FY 2008 reporting period, with the assistance of the JARC / New Freedom Advisory Committee the JARC matrix reporting approach was expanded to include a companion matrix for the New Freedom program. The NF matrix is similarly organized with the same four categories of projects and the same set of five project goals as the JARC reporting matrix. However, the list of service types was modified to reflect allowable service types for New Freedom funding as outlined in FTA Circular 9045.1 and subsequent guidance. For PPE reporting purposes, the matrix is used to identify the primary goal for each JARC-funded service operated during the reporting year and to report output and outcome information related to the services provided as required to complete the federal Program Performance Evaluation. In addition to the measures shown in the table (i.e., # one-way trips, # customer contacts, # units, # vehicles added, and so on), grantees also are asked to provide additional descriptive information about the service area, length of fixed route, and the number of jobs targeted (if known). The evaluation team uses this information in combination with Census data to develop an aggregated national estimate of jobs made accessible by JARC-supported services. To facilitate completion of the PPE forms, grant recipients were provided specific information via an on-line support site, email and phone support, and webinar training on how to use the reporting tools. Definitions were provided to help guide grantees in their choice of service and goal combinations. For example, trip-based services that are categorized as “flexible routing” include route deviation, point deviation, and other community circulators that may go off route to pick up individuals on a request basis. A “user-side subsidy” refers to individuals whose trip costs are subsidized by JARC funds including taxi vouchers, mileage reimbursements, underwriting the cost of vanpool seats, and so on. In contrast, trips provided through a “demand response” service would involve payment to an agency to subsidize the cost of running the vehicle, and not provide a direct subsidy to the individual user.“Mobility managers” are an emerging service approach with a variety of responsibilities. For example, in some cases, a mobility manager is a clearinghouse of information about transportation services provided locally. Other mobility managers may schedule trips, but have nothing to do with the responsibility of providing (or paying for a trip). In these two cases, it would be most appropriate to report the number of customer contacts as a
[A-2]

performance measure. However, some mobility managers also oversee the actual provision of service either by contracting with a provider or directly operating service themselves. In the latter case, it would be appropriate for the mobility manager service to report both the number of customer contacts enabled by the JARC program, as well as the number of one-way trips provided. It also should be noted that although FTA allows for “mobility managers” to be funded as a capital program, given the nature of the service for JARC reporting purposes they are considered information-based services.Another example that requires additional explanation is “one-on-one training,” included under the category of information-based services. “One-on-one training” could include teaching an individual on how to use fixed route bus service or providing instruction on how to care for and maintain a vehicle. “Trip/itinerary planning” is another specific form of assistance that provides individual assistance. Finally, capital investment projects could range from providing vehicles to individuals through low-interest loan programs, providing a vehicle for an agency to transport its customers, or vanpool vehicles if the cost of the vehicle lease is underwritten. In these cases, grantees would be asked to report the number of units (vehicles) provided and if available the number of one-way trips taken by JARC-supported participants. Other capital investments include amenities, such as adding bus shelters to waiting areas or bicycle racks on buses to allow access to a transit system.
[A-3]

JARC Service MatrixPrimary Goal
Service Type
(A)Expanded geographi
c coverage
(B)Extended hours/day
s of service
(C)Improved system capacity
(D)Improved access/
connections
(E)Improved customer knowledg
eI. Trip-Based
Fixed route# one-way
trips# one-
way trips# one-way
trips# one-
way trips
Flexible routing# one-way
trips# one-
way trips# one-way
trips# one-
way trips
Shuttle/Feeders# one-way
trips# one-
way trips# one-way
trips# one-
way trips
Demand response# one-way
trips# one-
way trips# one-way
trips# one-
way trips
Vanpool service# one-way
trips# one-
way trips
User-side subsidy# one-way
trips# one-
way trips# one-way
trips# one-
way tripsII. Information-Based
Mobility manager
# one-way trips#customer contacts
One-stop center#customer contacts
Itinerary planning#customer contacts
One-on-one transit training # trained
Internet-based info#customer contacts
Materials and marketing
descriptive
Transportation resource training # trainedIII. Capital Investment
Vehicle for individual
# one-way trips#vehicles
Vehicle for agency
# one-way trips
#vehicles
# one-way trips#vehicles
# one-way trips
#vehicles
Vanpool vehicles
# one-way trips
#vehicles
# one-way trips#vehicles
Car-sharing
# one-way trips
#vehicles
# one-way trips
#vehicles
ITS investmentsdescriptiv
edescriptiv
edescriptiv
eOther capital projects descriptiv descriptiv descriptiv descriptiv descriptiv
[A-4]

e e e e eIV. Planning Projects
1. Feasibility studiesdescriptiv
edescriptiv
edescriptiv
edescriptiv
edescriptiv
e
[A-5]
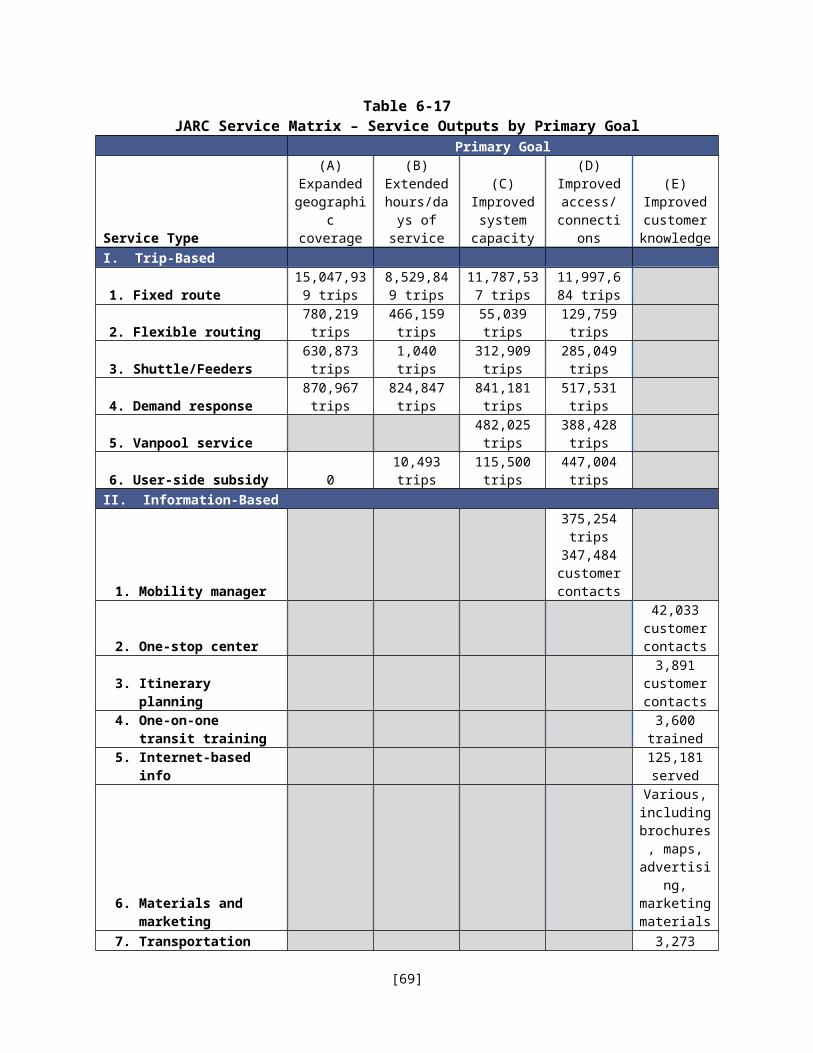
Appendix BJobs-Accessed MethodologyThis appendix provides background information on the elements of the methodology used to estimate jobs accessed for JARC services. AssumptionsSeveral assumptions about employment characteristics and travel patterns were made to support this analysis. These assumptions were initially developed for the FY 2006 analysis and refined or updated as necessary for each subsequent reporting cycle. We counted every job – whether full-time or part-time – as one job. The
distinction between full-time and part-time employment was not considered relevant for the purposes of the JARC evaluation.
For the FY 2010 analysis, jobs were classified as low-wage if they paid less than $33,075 per year or $15.90 per hour. This assumption was consistent with the goals of the JARC program, which was developed to provide transportation targeted for people at or below 150% of the federal poverty guidelines. These guidelines were set at $22,050 a year for a family/household of four in 2009, which was the most recent year available for the analysis.
The Longitudinal Employer-Household Dynamics (LEHD) program was the primary source for jobs data. Developed by the US Census, LEHD combines federal and state administrative data on employers and employees with core Census Bureau censuses and surveys.
Factors were developed for the analysis based on jobs data from 2009. When quarterly data was available, the second quarter of the calendar year was used.
LEHD Program As indicated above, the evaluation team used the data from the LEHD program to estimate jobs data. LEHD was developed by the US Census and combines federal and state administrative data on employers and employees with core Census Bureau censuses and surveys. For some components of the analysis, the team used OnTheMap, which is an on-line interactive application using LEHD data. OnTheMap enables analysts to define a transit service and estimate the jobs available within a defined corridor or service area.
[B-1]

The information in this section is reproduced verbatim from a description provided by the US Census Bureau. This information was originally accessed at the following link, which is no longer active: http://lehd.dsd.census.gov/led/about-us/FAQ.html#lehd What is LEHD?LEHD is an innovative program within the US Census Bureau. We use modern statistical and computing techniques to combine federal and state administrative data on employers and employees with core Census Bureau censuses and surveys while protecting the confidentiality of people and firms that provide the data.
What is LED?Local Employment Dynamics (LED) is a voluntary partnership between state labor market information agencies and the US Census Bureau to develop new information about local labor market conditions at low cost, with no added respondent burden, and with the same confidentiality protections afforded census and survey data. The following graphic illustrates the
difference between LEHD and LED.What are the Quarterly Workforce Indicators?The Quarterly Workforce Indicators (QWI) are a set of economic indicators -- including employment, job creation, wages, and worker turnover -- that can be queried by different levels of geography -- state, county, metro, and
[B-2]

workforce investment area -- as well as by detailed industry, gender, and age of workers. You can query the data directly by using the QWI on-line tool on this site.Why aren't QWI data available for all states?QWI data are available for all states that are LED-state partners; however, not every state is currently a LED-state partner. A list of LED state partners can be found here. New partner states with data currently in production will have data available on the website as soon as production is complete. What types of employment are included in the QWI?The QWI are built upon wage records in the Unemployment Insurance (UI) system and information from state ES-202 data. The universe of QWI data is UI-covered earnings. UI coverage is broad, covering over 90% of total wage and salary civilian jobs. When QWI private industry employment numbers are compared with other employment data, exclusions to UI coverage should be taken into account. Federal government employment is not generally included. Exempted employment varies slightly from state to state due to variations in state unemployment laws, but generally also excludes many farmers and agricultural employees, domestic workers, self-employed non-agricultural workers, members of the Armed Services, some state and local government employees as well as certain types of nonprofit employers and religious organizations (which are given a choice of coverage or non-coverage in a number of states). Estimating Jobs for Fixed Route ServicesTo estimate jobs accessed by fixed route services, the JARC Evaluation Team developed a job density factor, which estimated jobs per mile. Grantees reporting fixed routes, flexible routes, or shuttle/feeder services were asked to report unique route miles for each service. Unique route miles were defined as the length of the route in miles, from start to finish without duplication. The team used the factor to estimate the total number of jobs located within one-half mile (measured as one-quarter mile in each direction) of the route. The factor was first developed for the FY 2006 analysis and updated for subsequent data collection efforts.FY 2006 analysisTo develop the original factor for FY 2006, the team used ArcView Geographic Information Systems (GIS) software in combination with a proprietary database purchased from Dun & Bradstreet. The team acquired GIS files for JARC-supported routes from selected transit agencies; routes were plotted on a GIS base map and the number of jobs within a quarter-mile
[B-3]

buffer was extracted from the Dun & Bradstreet database. Using the weighted average from 96 routes (including a mix of JARC-supported services and general services but only limited geographic coverage), the team developed an estimate of total jobs and low-wage jobs per mile. Low-wage jobs were defined as those jobs paying $14.42 an hour or less; this corresponded to 150% of Federal poverty guidelines or $30,000 per year in 2006, which was the best available data at the time. While this approach yielded usable results, the GIS analysis was extremely labor-intensive, and the team determined that the Dun & Bradstreet dataset was too expensive to acquire for a national-level analysis. FY 2007 / FY 2008 analysisTo make this factor more robust for FY 2007 / FY 2008, the team increased the number of JARC-supported routes in the sample and expanded the sample to include additional parts of the country. To update the fixed route job density factor, the JARC/NF evaluation team selected candidate routes from the FY 2006 JARC database. The team also tested a more cost-effective approach that took advantage of the free job information data available from OnTheMap, an on-line mapping tool from the US Census Bureau. OnTheMap allows analysts to define a geographic area and to extract the number of jobs located within that service area or corridor. Analysts may define the service area in several ways: using standard geography (such as ZIP codes), drawing a line OnTheMap and choosing a buffer (appropriate for fixed route services), by drawing a freeform shape on a map (appropriate for demand response services), or by choosing a center point and a buffer. The application uses LEHD data. Routes were selected for analysis from the FY 2006 JARC database based on the following factors: Geographic diversity Representation in LEHD/OnTheMap Availability of a route map (to facilitate drawing the route for further
analysis)
This selection of routes was considered a “convenience” sample, rather than a random sample. Once the routes were identified, the following methodology was used to develop the job density factor: Draw each route and convert to a GIS shape file using ArcView. (As shape
files, the routes could be saved for future adjustments and modifications.)
[B-4]
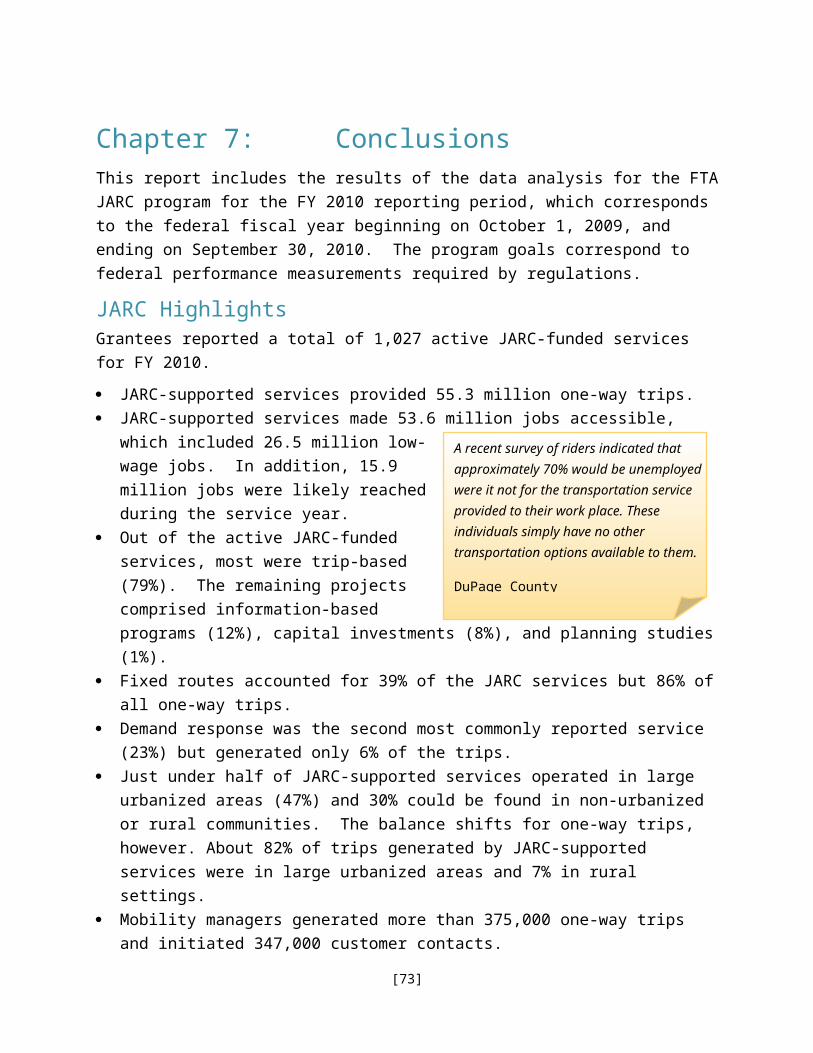
Draw a quarter-mile buffer on both sides of each route. Calculate the square mileage within the buffer. Use OnTheMap to redraw each route with the buffer tool. Calculate the number of jobs within the quarter-mile buffer. Using square mileage and job estimations, calculate jobs per square mile
factor. Adjust to jobs per linear mile.
FY 2009 analysisFor the FY 2009 analysis, the consultant team again updated the job density factor using a more refined methodology. Instead of basing the factor on a convenience sample, as in previous years, the team drew a random sample of fixed routes funded by the JARC program. The first step was to assemble a list of all fixed routes funded by the program. Routes were drawn from the universe of JARC services reported for FY 2007 – FY 2008. In some cases, recipients submitted a single report for similar improvements on multiple routes (e.g., adding Sunday service on three different routes). The team identified these instances based on information in the service profiles or external information, such as a route map, and separated the services into individual routes so that the sample could be drawn without bias toward some grantees. After these route groupings were disaggregated, 432 individual routes were identified. This universe excluded feeders and shuttles because these routes often are designed to serve a single employer or destination rather than a corridor. The goal for the precision of the job-density estimate was plus/minus 10% at the 95% confidence level. In order to estimate the size of the sample needed to achieve this precision, data from previous years were analyzed to calculate the sample variance. While the routes analyzed in previous years were not selected randomly, it was reasoned that the sample variance of those routes would be a reasonable proxy for the sample variance of a randomly-selected set of routes. As a result of this analysis, it was determined that a sample size of 135 routes would yield the desired precision. To choose the sample, each individual route was assigned a unique identification code and then these were matched with serial numbers. Using the random number function in Excel, 135 codes were selected. This required generating more than 135 random numbers, since there were some duplicates among the random numbers. In addition, a set of 45 randomly selected “alternates” was chosen in case it was not possible to obtain routing information for one of the selected routes, or if other data problems surfaced. In the end, 25 of these alternates were used.
[B-5]

Once the sample was selected, the following technical approach was used to develop the job density factor for the FY 2010 analysis.Preparing routes for OnTheMapRoute map/written directions were located for each of the sampled routes (as possible) and drawn in GIS. The routes were buffered by 1,320 feet (one quarter mile) and split into individual shape files to be ready for OnTheMap. In parallel analysis, we identified the number of unique route miles for each route. The measure of unique route miles counts mileage along a bidirectional portion of the route only once. Linear route miles may count this twice (depending how the grantee interprets this). The key is to think about the service area buffer. A bidirectional segment of the route serves the same buffer in both directions, so we can only count those miles once. For a loop route, linear route miles and unique route miles are the same. For a pure "there and back" route that uses just one roadway, then unique route miles would be half of linear route miles.Data processingThe user could draw the route directly into OnTheMap, though it appears that the analysis cannot be repeated easily with the same selection. It is possible to pull the selection area out of the KML or GIS output, but for ease of reuse and for the route length analysis, we decided to draw the routes in GIS. The import process is described in detail below:We entered the OnTheMap mapping interface and left all settings default on the “Search” and “Base Map” tabs. On the “Analysis” tab under “1. Data Settings” we selected Live or Work: Workplace Area; Year: 2008, 2007, 2006; Job Type: All Jobs; Labor Market Segments: All Workers. The route buffers were entered into the Analysis tab of the OnTheMap interface. “2. Study Area” under Selection Tools we selected Import From: Shapefile and loaded all 5 files for a given route. “3. Map Overlay/Report” we filled in the Report Title and selected Work Area Profile Analysis, left the Rollups untouched and Map Precision default on Automatic.Under the “Results” tab we downloaded the XLS file, PDF file, KML file and GIS file. We only planned to use the XLS file in processing but had ability to check out the mapping of the data at a later date with the additional files downloaded.Data post processingThe OnTheMap export file contains the number of jobs by two-digit NAICS code within the selected buffer. The analysis used jobs data from 2008, which was the most recently available when the work was conducted. We
[B-6]

summed those figures to calculate total jobs, and applied the percentage of low-wage jobs by NAICS code factors to the numbers to calculate low-wage jobs. These figures were then entered into the spreadsheet listing all of the routes in the sample.Connecticut and MassachusettsSeveral routes in the sample traveled through Connecticut or Massachusetts. Because these states do not yet participate in the LEHD, Dun & Bradstreet data were purchased for those towns that were served by JARC routes in the sample. Through the use of GIS, the number of jobs within the buffer of each JARC route was calculated. The Dun & Bradstreet data did not include NAICS codes but instead categorized employers using Standard Industrial Classification (SIC) codes. The consultant team translated the SIC codes into NAICS codes using a Census conversion table. Then the estimated low-wage jobs per employer were calculated, and these figures were also used in GIS to produce a figure of low-wage jobs within the buffer of each route.Final resultOnce all of the jobs figures and low-wage jobs figures were entered into a spreadsheet, the job density for each route buffer was calculated by dividing the jobs figures by the square mileage of each route service area. This is defined as the unique linear mileage of a route multiplied by 0.5, corresponding to a half-mile wide buffer (one quarter mile on each side of the street). Then the average job density and low-wage job densities were calculated (as a straight average of the individual routes). The precision of the sample was calculated by dividing the standard deviation of the sample by the square root of the sample size and multiplying by the t-factor for a 95% confidence level. The results came very close to the 10% desired precision, but did not quite achieve it.Job density factorsBased on this analysis, the following job density factors were developed for the FY 2009 analysis: For all jobs, 3,553 jobs per square mile or 1,777 jobs per linear route mile For low-wage jobs, 1,670 jobs per square mile, or 835 jobs per linear route
mile.
This result differs from the factor used for the FY 2007 – FY 2008 analysis. That factor, based on a convenience sample, was 3,878 jobs per square mile, or 1,939 jobs per linear route mile. The low-wage factor was 2,094 jobs per square mile, or 1,047 jobs per linear route mile. The differences do not necessarily reflect changes in the job market between FY 2007 and FY 2010.
[B-7]

Instead, they most likely reflect differences in the sample geography and in the sampling methodology. FY 2010 analysisFor the FY 2010 analysis, the consultant team again updated the job density factor. Based on the approach developed for FY 2009, the team drew a random sample of fixed routes funded by the JARC program. The first step was to assemble a list of all fixed routes funded by the program. Routes were drawn from the universe of JARC services reported for FY 2009 and 719 individual routes were identified. This universe excluded feeders and shuttles because these routes often are designed to serve a single employer or destination rather than a corridor. The goal for the precision of the job-density estimate was plus/minus 10% at the 95% confidence level. In order to estimate the size of the sample needed to achieve this precision, data from previous years were analyzed to calculate the sample variance. For the FY 2009 analysis, 139 routes were analyzed, resulting in a precision of 10.91%. A slightly larger sample of 150 routes was thus chosen to try to obtain 10% precision.
To choose the sample, each individual route was assigned a unique identification code and then these were matched with serial numbers. Using the random number function in Excel, 150 codes were selected. This required generating more than 150 random numbers, since there were some duplicates among the random numbers. In addition, a set of 20 randomly-selected “alternates” was chosen in case it was not possible to obtain routing information for one of the selected routes, or if other data problems surfaced. In the end, 15 of these alternates were used.
Once the sample was selected, the following technical approach was used to develop the job density factor for the FY 2010 analysis.Preparing routes for OnTheMapRoute map and/or written directions were located for each of the sampled routes (as possible) and drawn in GIS. The routes were buffered by 1,320 feet (one quarter mile) and split into individual shape files to be ready for OnTheMap. In parallel analysis, we identified the number of unique route miles for each route. The measure of unique route miles counts mileage along a bidirectional portion of the route only once. Linear route miles may count this twice (depending how the grantee interprets this). The key is to think about the service area buffer. A bidirectional segment of the route serves the same buffer in both directions, so we can only count those miles once. For a loop
[B-8]

route, linear route miles and unique route miles are the same. For a pure "there and back" route that uses just one roadway, then unique route miles would be half of linear route miles.Data processingOnTheMap users are able to draw routes or shapes directly in OnTheMap, though it appears that the analysis cannot be repeated easily with the same selection and that the original shape cannot be saved. It is possible to pull the selection area out of the KML or GIS output, but for data maintenance purposes and for the route length analysis, routes were first digitized in a GIS program, and then imported into OnTheMap for analysis. The import process is described in detail below:Within the OnTheMap mapping interface, all settings were left as default on the “Search” and “Base Map” tabs. On the “Analysis” tab under “1. Data Settings” Live or Work: Workplace Area; Year: 2009, 2008, 2007, 2006; Job Type: All Jobs; Labor Market Segments: All Workers were selected. The route buffers were individually uploaded into the Analysis tab of the OnTheMap interface. For item “2. Study Area” under Selection Tools we selected Import From: Shapefile and loaded all three file components for a given route (A shapefile is generally made up of five separate files, though OnTheMap only required three for processing). “3. Map Overlay/Report” we filled in the Report Title and selected Work Area Profile Analysis, left the Rollups untouched and Map Precision default on Automatic.Under the “Results” tab, four file formats were available for download: XLS, PDF, KML, and SHP file. Though only the XLS file was used in processing, all files types were downloaded to allow for later analysis or data verification, if necessary. Data post processingThe OnTheMap export file contains the number of jobs by 2-digit NAICS code within the selected buffer. We summed those figures to calculate total jobs, and applied the percentage of low-wage jobs by NAICS code factors to the numbers to calculate low-wage jobs. These figures were then entered into the spreadsheet listing all of the routes in the sample. Figures were unavailable for seven routes; thus the final sample includes only 143 routes.Application of Finite Population Correction FactorOne additional step was added to the analysis this year, following further research on the statistical precision of estimates within a small population. Statistical measures of precision are usually applied to samples drawn from large populations, such as tens of thousands or even millions of individual items. The total population of JARC routes, 719 in this year, does not qualify as a large population, and the sample size represents a significant portion of
[B-9]

that population. When this is the case, the sample average is actually more precise than it appears based on the typical statistical formulas. This is true because the possibility for wider variation is lessened when the sample represents a large portion of the total population. To correct for this, one applies the finite population correction factor, which is based on the ratio of the sample size to the total population. The larger this ratio is, the more the confidence interval is reduced (and thus the result is made more precise).The fact that this additional step was not used in prior years means that those job density factors were actually more precise than was previously thought.Final ResultOnce all of the jobs figures and low-wage jobs figures were entered into the main spreadsheet, the job density for each route buffer was calculated by dividing the jobs figures by the square mileage of each route service area. This is defined as the unique linear mileage of a route multiplied by 0.5, corresponding to a half-mile wide buffer (one quarter mile on each side of the street). Then the average job density and low-wage job densities were calculated (as a straight average of the individual routes). The precision of the sample was calculated by dividing the standard deviation of the sample by the square root of the sample size and multiplying by the t-factor for a 95% confidence level and the sample size (a value of 1.9767 in this case). Then the finite population correction factor (0.8957) was applied. In spite of the larger sample size and the finite population correction factor, the precision of this year’s estimate came out somewhat worse than in prior years, with the confidence interval for total jobs being 13.2% and for low-wage jobs being 12.2%. These wider intervals are strictly a result of wider variation in the job densities among the sampled routes. The minimum job density found was 137 jobs per square mile and the maximum found was 15,449 jobs per square mile. For low-wage jobs, the minimum was 68 jobs per square mile and the maximum was 6,956. Last year, the minimums were about the same, but the maximums were much lower, at 11,566 and 4,910, respectively. The higher maximums this year may be a result of sampling more routes in dense urban areas. For FY 2010, the following jobs factors were calculated: For all jobs, 3,321 jobs per square mile or 1,661 jobs per linear route mile. For low-wage jobs, 1,595 jobs per square mile, or 798 jobs per linear route
mile.
[B-10]

These factors represent a 7% decrease over the equivalent factors developed for the FY 2009 analysis. This difference falls within the confidence interval for the job factors but might also reflect changing economic conditions between 2009 and 2008 (the year used to support the FY 2009 analysis). Estimating Jobs for Demand Response ServicesTo measure jobs accessed by demand response services, FTA made a policy decision to include every job in the service area. To calculate this number, for each demand response service, recipients were asked to identify the county or counties served. Starting with the FY 2007 / FY 2008 data collection effort, grantees were asked to indicate the approximate percentage of the county served from a drop-down list with the following choices: 1% - 24% 25% - 49% 50% - 74% 75% - 99% 100%
Using an automated process, described in the next section, the evaluation team accessed jobs information from LEHD for each county with demand response service. This analysis yielded a dataset with the following information for each service: Counties served Total jobs based on FY 2008 data from LEHD Low-wage jobs based on the distribution by NAICS two-digit industry code Percentage of the county included in the service area
The team adjusted the findings based on the percentage of coverage, using the mid-point of each range, and then eliminated duplicates. We then summed the records, which yielded estimates of all jobs and low-wage jobs made accessible by demand response services for FY 2010. The following table shows these estimates.The team adjusted the findings based on the percentage of coverage, using the mid-point of each range, and then eliminated duplicates. We then summed the records by year, which yielded the following estimates of all jobs and low-wage jobs made accessible by demand response services for FY 2010. 24.8 million jobs made available by demand response services 12.6 million low-wage jobs made accessible by demand response services
[B-11]

Automated Process for Accessing County-Based Jobs InformationFor FY 2010, the Census LEHD data aspects of the JARC evaluation were substantially the same as for the work performed for FY 2007 – FY 2009. LEHD provides total employment data by calendar quarter and industry for each covered county. LEHD county-level total employment by industry data is available from a US Census website: http://lehd.did.census.gov/led/datatools/qwiapp.html.Automated Census data retrieval overviewCES staff revised the automated data retrieval system to increase the number of “self-checks” and to permit multiple years of data to be retrieved for each US county that was covered in whole or part by JARC demand response services. We determined that the URL to retrieve a particular county and year of LEHD data could be generated programmatically. For instance: the following URL provides access to Total Employment data for Calhoun County (FIPS code 013) in the state of Florida (abbreviated fl) for the year of 2008.http://lehd.did.census.gov/cgi-bin/lehdpivot/lehd/pvt/pivot_county.hsql?xpivot=Industry&xdata=Total_Employment&xyear=2008&head=ZZZZ&xstate=fl&xstyle=lehd&xfixed=Year&xgeofx=xcounty&xcounty=%3D&xsicdiv=%3C%3E&xsex=%3D&xagegroup=%3D&xowner=%3D&xsort=Year%2CQuarter%2CSic_Division&Xvalue=013A portion of the web page retrieved is shown below:
[B-12]

Each of these QWI County Pivot report pages contains a link, labeled “Download Dataset”, that provides access to the data in spreadsheet format. A sample URL: http://lehd.did.census.gov/lehd/cache/lehd/pvt/pivot_county/fl-c/1e-ae-cn-dt-fy-llehd-pi-v013-xe-y2008-xownere.xls.County FIPS codesCounty FIPS codes were retrieved in 2010 from the Census website: http://www.census.gov/geo/www/fips/fips65/data/national.txt Excerpts of this table are shown below:
State FIPS Code CountyAL 01 001 AutaugaAL 01 003 BaldwinAL 01 005 BarbourAL 01 007 BibbAL 01 009 BlountAL 01 011 BullockAL 01 013 Butler
This table can be used to determine, for instance, that the FIPS code for Bullock County in Alabama is 011.
[B-13]

NA handling in LEHD dataWe discovered that in some cases LEHD contained NAs for particular industries and counties for 2009:02, similar to what is shown below for 2005:02 for Utilities and Management for Vernon County in Wisconsin.
QWI Quickfacts Total Employment
11 Agriculture, Forestry, Fishing and Hunting 13521 Mining 022 Utilities N/A23 Construction 21231-33 Manufacturing 79742 Wholesale Trade 65744-45 Retail Trade 1,09248-49 Transportation and Warehousing 15751 Information 10452 Finance and Insurance 29853 Real Estate and Rental and Leasing 4154 Professional, Scientific, and Technical Services 12855 Management of Companies and Enterprises N/A
NAs were treated as 0 for calculated total employment and JARC employment for each county.Excluded statesAs of July 20, 2009, LEHD did not provide county level total employment data for the following localities: District of Columbia Massachusetts New Hampshire Puerto Rico Virgin Islands
Calculation stepsCES software performed seven steps:1. Identified, based on recipient inputs, counties that were served by
demand response services.2. Filtered out states not included in LEHD, as provided in Census
documentation (see above).
[B-14]

3. Converted county names, as provided by recipients, to three-digit FIPS codes, based on the FIPS code table provided by Census.
4. Generated a URL based on the year and quarter required (e.g. 2009), the state, the FIPS code for the county, and the total employment variable.
5. Extracted the cached spreadsheet URL, and used it to retrieve the data and integrate it into an LEHD county data table.
6. Summed the raw total employment figures for 2006:02 by industry to generate an overall “Total Employment” for the county, and summed the weighted industry figures to generate a low-wage employment figure.
7. Integrated these totals into spreadsheets provided to the analysts.
Using this automated process, 1,388 spreadsheets were retrieved from the LEHD website.Verification and quality controlWe reviewed each county name provided by Recipients to ensure that it could be mapped to a valid FIPS code. We performed edits as appropriate on these data. Generally, edits involved either fixing typographical errors (e.g. “Carroll” for “Carol”, or “Prince George’s” for “Prince Georges”), eliding “County” or “Parish” at the end of the term, or separating multiple counties across multiple lines (e.g. one field containing “Wayne, Oakland” into two rows, one for “Oakland” county and one for “Wayne” county).Estimating Low-Wage JobsA methodology for estimating low-wage jobs was developed to support the approaches for estimating jobs accessed by fixed route and demand response services. Jobs were classified as low-wage if they paid less than $33,075 per year or $15.90 per hour in 2009. This is equivalent to 150% of the federal poverty guidelines for a family of four in 2009. The evaluation team calculated the percentage of jobs that fell below $33,075 using wage data derived from the Occupational Employment Statistics Survey from the US Bureau of Labor Statistics (BLS). Percentages were estimated for about 20 job categories, as defined in the North American Industry Classification System (NAICS) at the two-digit level. Using data from the second quarter of 2009, estimates were based on national quartile data for each two-digit NAICS code and assumed a straight-line distribution of wages within each quartile.For example, NAICS code 72 is assigned to jobs in the accommodations and food services industry. Using BLS data from 2009, the team estimated that approximately 90% of the jobs in this category could be categorized as low-
[B-15]
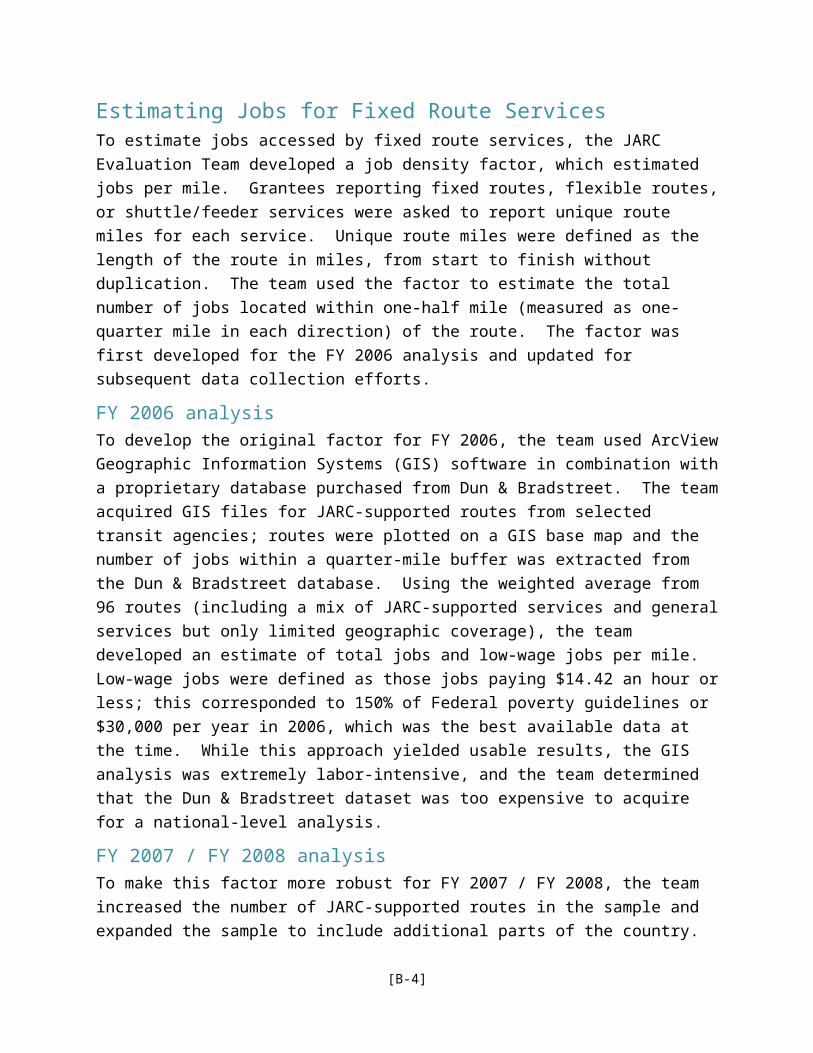
wage. This information was aggregated for all industries and used to estimate low-wage jobs accessed by JARC-supported services.
[B-16]

The following table shows the estimated proportion of low-wage jobs in each NAICS category at the two-digit summary level.
NAICS Description %11 Agriculture, forestry, fishing and hunting 83%21 Mining, quarrying, oil and gas extraction 25%22 Utilities 15%23 Construction 35%31-33 Manufacturing 45%42 Wholesale trade 40%44-45 Retail trade 77%48-49 Transportation and warehousing 35%51 Information 30%52 Finance and insurance 35%53 Real estate and rental and leasing 60%54 Professional, scientific, and technical services 20%55 Management of companies and enterprises 23%56 Administrative and support , waste management and remediation 66%61 Educational services 38%62 Health care and social assistance 50%71 Arts, entertainment, and recreation 65%72 Accommodation and food services 90%81 Other services (except federal, state, and local government) 65%99 Federal, state, and local government 28%
All industries 50%
These weights were used to estimate the proportion of total employment in each industry could be considered low-wage jobs for both the fixed-route and demand-response components of the analysis. Estimating Jobs Likely ReachedThe approaches described above provide an estimate of the number of jobs that JARC services made accessible based on the geographic coverage of fixed route and demand response services. This approach is consistent with FTA’s policy decision to measure the performance of most trip-based JARC programs based on the total number of jobs and low-wage jobs in the service region – in other words, the jobs that a customer could reach using the service on any given day. This measure highlights the capability of JARC services to make jobs in a particular service region accessible to low-income earners.However, while a service might be expected to reach any job in its service area, under normal circumstances, no transit service could be expected to provide transportation to every job in its service region simultaneously. For both fixed route and demand response, the measures of jobs accessed described above can be more accurately defined as measures of potential
[B-17]

accessibility; these measures are independent of transit capacity and instead estimate the maximum number of jobs accessible via JARC-supported services. To complement this calculation, the team added a measure of jobs likely reached. The methodology, originally developed for the FY 2009 analysis, uses the following steps and assumptions: Estimate total one-way trips for all fixed route (including flex routes and
shuttles) and demand response as reported by designated recipients. Divide the number of one-way trips by two to represent individuals. Estimate the percentage of people making commute trips, which will
serve as a proxy for jobs accessed. According to the American Public Transportation Association, 59.2% of transit trips are commuting trips (traveling between home and work).3 For ease of calculation, this example uses 60%.
The following table illustrates these calculations. One-way trips Individuals Jobs accessed %
Fixed route 47,363,009 23,681,505 14,208,903 89%Flexible routing 1,431,176 715,588 429,353 3%Shuttle/Feeder 1,229,871 614,936 368,961 2%Demand response 3,054,526 1,527,263 916,358 6%
Total 53,078,582 26,539,291 15,923,575 100
%
Jobs Accessed in FY 2010For FY 2010, JARC-supported services were estimated to provide access to a maximum of 53.6 million jobs, of which 26.5 million were categorized as low-wage. It is further estimated that JARC services could provide access to approximately 15.9 million jobs based on vehicle capacity constraints. As the following table shows, the unconstrained analysis indicates that demand response services connected passengers with 46% of the jobs accessed in FY 2010 and fixed route services reached another 44%. The constrained analysis paints a different picture, however. Reflecting the capacity difference between fixed route services and other types of JARC-supported services, the analysis of likely access suggests that fixed route services provided access to fully 89% of all jobs reached in FY 2010 and the demand response share fell to 6%.
3 2009 Public Transportation Fact Book Accessed at: http://www.apta.com/gap/policyresearch/Documents/APTA_2009_Fact_Book.pdf
[B-18]
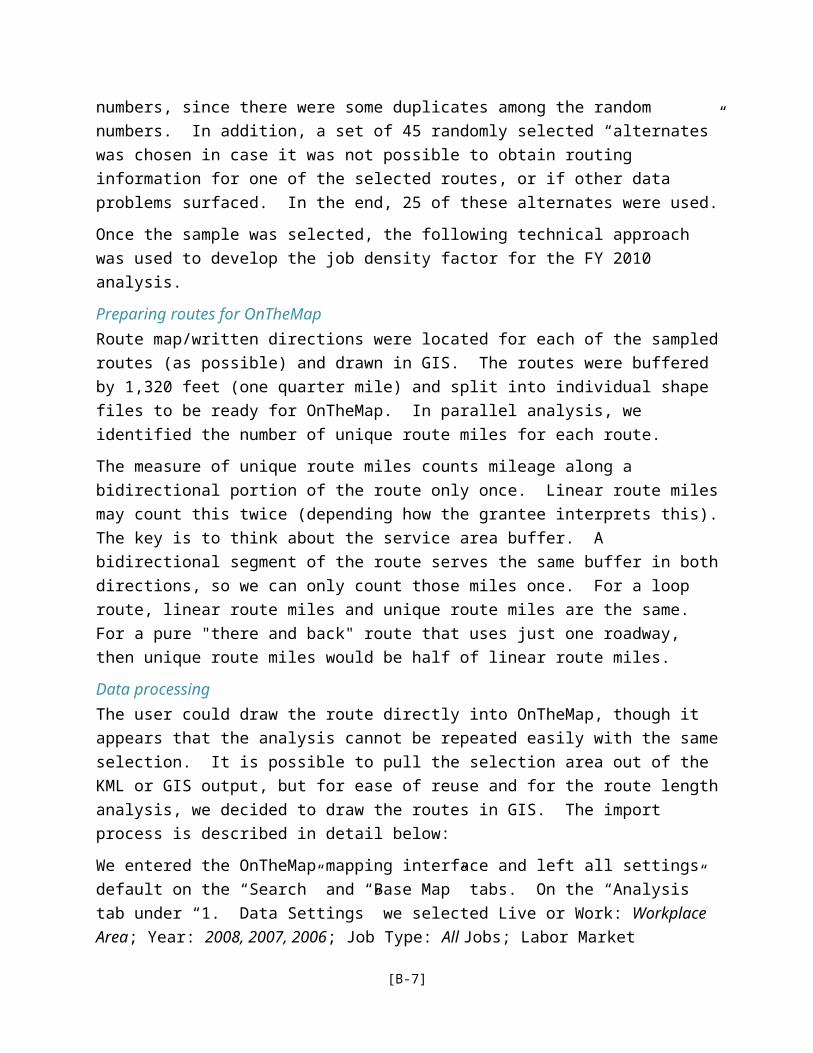
Jobs Accessed Estimate
All Jobs Made
Accessible
Low-Wage Jobs
Made Accessible
Jobs Likely Reached
Service type # % # % # %Demand response
24,825,393 46%
12,631,442 48% 916,358 6%
Fixed route23,821,5
33 44%11,440,9
35 43%14,208,90
3 89%
Flex route3,601,62
5 7%1,729,77
8 7% 429,353 3%
Shuttle feeder1,399,80
2 3% 672,293 3% 368,961 2%
Total jobs53,648,3
52100
%26,474,4
47100
%15,923,5
75100
%
The findings reflect the data reported by grantees and do not incorporate any expansion factors or other efforts to interpret missing records.
[B-19]

Appendix CJARC Service Profiles
Under separate cover.
[C-1]