connecting transcriptional regulation and microbial … thesis...abstract bioprocesses performance...
TRANSCRIPT

Department of Chemical Engineering Imperial College
Connecting Transcriptional Regulation and
Microbial Growth Kinetics in Cultures of
Pseudomonas putida
Argyro Tsipa
1

To my parents
2
Abstract Bioprocesses performance is monitored using microbial growth kinetics models.
However most of them are empirical and unstructured ignoring molecular and transcriptional
interactions thus failing in accurate prediction. Pseudomonas putida mt-2, which harbours the
TOL plasmid, is a strain of great biotechnological potential. M-xylene and toluene are
commonly utilised by TOL pathway while toluene enables chromosomal ortho-cleavage
pathway activation.
Herein, the transcriptional kinetics of TOL and key ortho-cleavage promoters which
control substrate bioconversion resulting in biomass formation was consistently studied.
Thus, revealing the interconnection of the two pathways and promoters’ specific expression
patterns. The experimental observations lead to a dynamic model coupling transcriptional
regulation to microbial growth kinetics by providing upstream quantitative information. This
model enables adequate predicition capability of substrate utilisation and biomass growth
under a wide range of initial conditions.
However in nature it is uncommon for bacteria to degrade a sole substrate. Therefore P.
putida mt-2 cells induction with succinate-toluene, m-xylene-toluene mixtures is studied. The
transcriptional kinetics revealed promoters’ bi-modal expression pattern and carbon
catabolite repression regardless of the growth conditions. Transcriptional regulation upon
entry of m-xylene-toluene mixture was modelled resulting in a mechanistic microbial growth
kinetic model development which accurately predicts substrate(s) utilisation and biomass
growth patterns. The current double substrate microbial growth kinetic model can more
accurately predict the macroscopic phenomena compared to the Monod, Monod-type and
competitive enzymatic interaction models.
3
Acknowledgements I would like to deeply thank my supervisors Sakis Mantalaris and Stratos
Pistikopoulos who gave me the great opportunity to work at Imperial College, in BSEL and
CPSE groups, interact with people of other disciplines and be part of an international
environment. Their guidance, support and advice are invaluable. Michalis Koutinas, my
mentor from Cyprus, was always available in Skype to reply to my questions and I thank him
a lot for all our beneficial scientific discussions. The financial support came from EU FP7
MULTIMOD Project.
I own a big thank you to my current and former BSEL members for all the useful
discussions, the support during the many experimental failures, the company, and all the
funny moments in and outside the lab. Mauricio, Chon, Gizem, Nihal, Osama thank you so
much. I would also like to thank David Yeo who believed in me before I believe in myself,
Jan, Chetan and David (Garcia), my MULTIMOD friends, for the advice and the memories
from our ‘scientific’ trips.
My precious life partner, Dimitris, for always being next to me despite the physical
distance between us, for his tremendous patience and love during my stressful periods, his
support in my many ups and down and his constant caring. I feel extremely lucky to have him
in my life. My parents and my sister whose love and care kept encouraging me to continue
my long journey in the PhD world, without them (and Sakis) I might not have managed to
complete it.
4

List of contents 1. Introduction .......................................................................................................................... 19
2. Literature review .................................................................................................................. 24
2.1 Pseudomonas putida ...................................................................................................... 24
2.1.1 The TOL plasmid metabolic pathway ..................................................................... 25
2.1.2 Chromosome-encoded pathway .............................................................................. 31
2.1.3 Catabolic repression in the TOL plasmid ................................................................ 36
2.2 Genetic networks representation .................................................................................... 39
2.2.1 Principal motifs in biological systems ..................................................................... 40
2.2.2 The TOL plasmid motif ........................................................................................... 42
2.2.3 Genetic circuit .......................................................................................................... 43
2.3 Modelling of gene regulatory networks ......................................................................... 46
2.4 Microbial growth kinetics models .................................................................................. 48
2.4.1 Substrate inhibition growth kinetics models ........................................................... 49
2.4.2 Multiple substrates growth kinetics models ............................................................ 51
2.5 Conclusion ...................................................................................................................... 56
2.6 Thesis aim ...................................................................................................................... 57
2.6.1 Objectives ................................................................................................................ 58
3. Materials and Methods ......................................................................................................... 60
3.1 Microbial Cultures.......................................................................................................... 60
3.2 Substrate and Biomass Analyses .................................................................................... 61
3.3 Preparation and isolation of total RNA, cDNA synthesis, quantitative real-time PCR and gradient PCR ................................................................................................................. 62
3.4 Gel electrophoresis ......................................................................................................... 63
3.5 Statistical analysis .......................................................................................................... 63
3.6 Model Analysis .............................................................................................................. 64
3.6.1 Global Sensitivity Analysis ..................................................................................... 64
3.6.2 Parameter estimation in gPROMS ........................................................................... 65
3.6.3 Statistical analysis between model(s) simulations and experimental results .......... 66
4. Double substrate utilisation by Pseudomonas putida mt-2: Succinate traces impact on toluene induced TOL and ortho-cleavage pathways ............................................................... 67
4.1 Introduction .................................................................................................................... 68
4.2 Results ............................................................................................................................ 71
5

4.2.1 Diauxic biomass growth and sequential substrate utilisation .................................. 71
4.2.2 TOL catabolic Pu, Pm and ortho-cleavage PbenR, PbenA transcriptional kinetics 72
4.3 Discussion ...................................................................................................................... 77
4.4 Conclusion ...................................................................................................................... 82
5. Transcriptional kinetics of the cross-talk between the ortho-cleavage and TOL pathways of toluene biodegradation in Pseudomonas putida mt-2 .............................................................. 83
5.1 Introduction .................................................................................................................... 84
5.2 Results ............................................................................................................................ 87
5.2.1 Evolution of toluene biodegradation and biomass growth kinetics upon induction with different toluene concentrations ............................................................................... 87
5.2.2 TOL and ortho-cleavage promoters’ transcriptional kinetics .................................. 89
5.3 Discussion ...................................................................................................................... 99
6. Modelling of transcriptional regulation using toluene in P. putida mt-2 cell cultures facilitates mechanistic prediction of microbial growth kinetics ............................................ 106
6.1 Introduction .................................................................................................................. 107
6.2 Mathematical modelling ............................................................................................... 109
6.2.1 Mathematical modelling of the TOL and ortho-cleavage genetic circuit. ............ 109
6.2.2 Mathematical modelling of lag/adaptation phase .................................................. 117
6.2.3 Linking growth kinetics to promoters’ expression ................................................ 118
6.3 Results .......................................................................................................................... 118
6.3.1 Rationale of model analysis ................................................................................... 118
6.3.2 Predictive capability of the model ......................................................................... 129
6.4 Discussion .................................................................................................................... 139
6. 5. Conclusion ................................................................................................................. 141
7. Double substrate mechanistic microbial growth kinetics through transcriptional regulation modelling in Pseudomonas putida mt-2 cell cultures ............................................................ 143
7.1 Introduction .................................................................................................................. 144
7.2 Experimental Results.................................................................................................... 147
7.2.1 Evolution of m-xylene-toluene biodegradation and biomass growth kinetics upon induction with different mixture concentrations ............................................................ 147
7.2.2 TOL and ortho-cleavage transcriptional kinetics .................................................. 148
7.2.3 Lag/adaptation phase ............................................................................................. 153
7.3 Mathematical modelling results ................................................................................... 155
7.3.1 Genetic circuit ........................................................................................................ 155
6
7.4 Discussion .................................................................................................................... 171
Conclusions and future work ................................................................................................. 175
8.1 Project overview ........................................................................................................... 175
8.2 Concluding remarks ..................................................................................................... 177
8.3 Future directions ........................................................................................................... 182
8.3.1 Transcription factors and global proteins role ....................................................... 182
8.3.2 Model-based optimisation focusing on promoters’ activity .................................. 183
8.3.3 Predictive capability of microbial growth kinetics for dual substrate ................... 184
8.3.4 Extension of dual substrate framework to succinate and toluene degradation microbial growth kinetics ............................................................................................... 185
9. Bibliography ...................................................................................................................... 187
Appendix A: calibration curves and partition coefficient ...................................................... 201
Appendix B: experimentally estimated parameters of Monod, Mankad, SKIP and competitive enzymatic interactions models ............................................................................................... 202
7

List of Figures Figure 1: The TOL plasmid pWW0 m-xylene biodegradation pathway. The reactions implicated in this effector metabolism, including the stepwise oxidation of one methyl group of the substrate to an alcohol and eventually to a carboxylic acid, yielding m-methyl-benzoate through the action of the enzymes encoded by the upper TOL pathway. M-methylbenzoate is then deoxygenated to yield 3-methylcatechol, which is cleaved in meta and finally channelled into the Krebs cycle by means of the products of the meta operon. The upper operon is transcribed from the σ54 promoter Pu upon activation by the cognate regulator of the pathway (XylR) bound to specific effectors. These include the substrate of the pathway (m-xylene) as well as the two first metabolic intermediates: 3-methylbenzylalcohol and 3-methylbenzylaldehyde. The meta operon is transcribed from the Pm promoter, which is activated by the m-methylbenzoate responsive activator XylS. Pm can be turned on by either XylS or m-methylbenzoate as a co-inducer, or by overproduction of XylS alone. Finally, xylS and xylR are transcribed from the divergent and overlapping promoters Ps and Pr respectively. The regulation of the latter is connected, because the Ps promoter is activated by XylR, which also binds and downregulates its own Pr promoter, (A) TOL regulatory circuit, and (B) its logic implementation. TurA: TurA protein; XylSa: active form of XylS; XylSi: inactive form of XylS; XylSh: hyperproduction of XylS; ......................................................................................................... 28 Figure 2: the encoded enzymes involved in the degradation of aromatic pollutants in the upper and lower pathways (adapted from Aemprapat and Williams (1998)). ....................................................... 31 Figure 3: the catabolic genes and the relevant encoded enzymes in the degradation of protocatechuate and catechol to Krebs cycle intermediates (adapted from Houghton et al. (1995)). ............................. 32 Figure 4: The ortho- and meta- pathways activated in P. putida upon induction with benzoate (adapted from Loh and Chua (2002)). .................................................................................................. 36 Figure 5 : (A) negative feedback loop, (B) feed-forward loop (FFL), (C) example of type-1 FFL (the classical crp co-regulation of the arabinose utilization operon), (D) bi-fan, (E) single-input model, (F) the multiple-input model (MIM) :activation or repression (adapted from Silva-Rocha and de Lorenzo (2010)). ................................................................................................................................... 42 Figure 6: The inner logic of the TOL regulatory network. (A) a canonical type I coherent FFL), (B) Metabolic Amplifier Motif (MAM) found in the TOL network (adapted from Silva-Rocha et al. (2011a)). ................................................................................................................................................ 43 Figure 7: Interlink of the chromosomal and TOL genetic networks upon toluene entry. The overimposed regulation of the promoters is additionally presented. (A) The upper operon encoded enzymes sequentially transform toluene into benzoate which is metabolised into Krebs cycle precursors through the enzymatic steps produced by the meta and ben operons. (B) The biochemical and (C) logic representations of the two pathways. :inactive form of XylR (XylRi); : active form of XylR (XylRa); : inactive form of XylS (XylSi); : active form of XylS (XylSa); : inactive form of BenR (BenRi); : active form of BenR (BenRa); : input; : output; : AND; : OR; : NOT. ............................................................................................................. 70 Figure 8: 0.25mM succinate degradation and biomass growth with A)0.4, B)0.7, C)1.0mM toluene degradation. :succinate, :toluene, :biomass .............................................................................. 72 Figure 9: Pu transcriptional kinetics at A)0.4, B)0.7 and C)1mM toluene concentration with 0.25mM succinate. Three independent experiments were conducted for every tested mixture, ......................... 73
8

Figure 10: PbenR transcriptional kinetics at A)0.4, B)0.7 and C)1mM toluene concentration with 0.25mM succinate. Three independent experiments were conducted for every tested mixture, : toluene. .................................................................................................................................................. 74 Figure 11: Pm transcriptional kinetics at A)0.4mM, B)0.7mM and C)1mM toluene concentration with 0.25mM succinate. Three independent experiments were conducted for every tested mixture, :toluene .................................................................................................................................................. 76 Figure 12: PbenA transcriptional kinetics at A)0.4, B)0.7 and C)1mM toluene concentration with 0.25mM succinate. Three independent experiments were conducted for every tested mixture, :toluene. ................................................................................................................................................. 77 Figure 13: Cross talk of the chromosomal and TOL genetic networks during toluene induction. The overimposed regulation of the promoters is additionally presented. (A) The enzymes encoded in the upper operon sequentially transform toluene into benzoate. The latter is then transformed into acetate and pyruvate through the action of the enzymes synthesised by the meta operon. The meta pathway products are channelled into the Krebs cycle yielding the precursor molecules required to support biomass growth. (B) The biochemical and (C) logic representations of the two pathways. :inactive form of XylR (XylRi); : active form of XylR (XylRa); : inactive form of XylS (XylSi);
: active form of XylS (XylSa); : inactive form of BenR (BenRi); : active form of BenR (BenRa); : input; : output; : AND; : OR; : NOT. .............................................. 87 Figure 14: Concentration of toluene and dry cell weight in the experiments. (A) 0.4, (B) 0.7, (C) 1.0, and (D) 1.2 mM of toluene concentration ............................................................................................. 88 Figure 15: Pr promoter relative mRNA expression in the experiments. (A) 0.4, (B) 0.7, (C) 1.0, and (D) 1.2 mM of toluene concentration, where *: statistical significant difference of relative mRNA expression between different time points, : toluene ........................................................................... 90 Figure 16: Ps promoter relative mRNA expression in the experiments. (A) 0.4, (B) 0.7, (C) 1.0, and (D) 1.2 mM of toluene concentration, :toluene ................................................................................ 91 Figure 17: Pu promoter relative mRNA expression in the experiments. (A) 0.4, (B) 0.7, (C) 1.0, and (D) 1.2 mM of toluene concentration, :toluene. ............................................................................... 93 Figure 18: Pm promoter relative mRNA expression in the experiments. (A) 0.4, (B) 0.7, (C) 1.0, and (D) 1.2 mM of toluene concentration, :toluene. ............................................................................... 95 Figure 19: PbenR promoter relative mRNA expression in the experiments. (A) 0.4, (B) 0.7, (C) 1.0, and (D) 1.2 mM of toluene concentration, :toluene. ....................................................................... 97 Figure 20: PbenA promoter relative mRNA expression in the experiments. (A) 0.4, (B) 0.7, (C) 1.0, and (D) 1.2 mM of toluene concentration, :toluene. ......................................................................... 99 Figure 21: Upon toluene entry the inactive form of XylR (XylRi) oligomerises forming the active molecule XylRa which activates Pu and Ps promoters. Both XylR forms down-regulate their own promoter, Pr. Upon Pu activation the genes of the upper operon encode for the enzymes which catalyse toluene catabolism to benzoate. Ps activation and benzoate lead to overexpression of the xylS gene dimerising the inactive XylS protein to the active protein form. XylS dimerisation activates the Pm promoter. In the chromosomal pathway PbenR controls benR gene transcription, which encodes for the inactive BenR protein form. Benzoate activates BenR which up-regulates Pm promoter of TOL and PbenA of chromosome. PbenA controls ben operon transcription which encodes for the enzymes responsible for transforming benzoate to catechol. In the presence of catechol, PcatR is activated controlling the catR gene expression encoding for CatR protein. Catechol formation results in activating CatR protein by oligomerising the active protein. Catechol is further catabolised to cis-cis-muconate and finally to Krebs cycle intermediates by cat operon which is controlled by PcatB promoter. : input; : output; : AND; : OR; : NOT. .......................................... 109
9

Figure 22: The logic representation where the gene regulation model is based. ............................... 111 Figure 23: The proposed scenario describing oscillatory behaviour of Pm via a negative feedback loop. I: intermediate protein, R: regulatory protein of Pm, .............................................................. 116 Figure 24: SIs for A) Pr, B) Ps, C) Pu, D) Pm, E) PbenR, F) PbenA, G) toluene concentration, H) biomass concentration. ........................................................................................................................ 122 Figure 25: model’s prediction of the transcriptional kinetics in a batch culture of A) Pr, B) Ps, C) Pu, D) PbenR, E) Pm with oscillations, F) Pm without oscillations, G) PbenA upon entry of 1mM toluene ............................................................................................................................................................ 123 Figure 26: prediction of the rate limiting enzymes A) XylU and B) XylM, BenB C) XylM without taking into account the oscillatory behaviour, of Pm responsible for substrate utilisation and biomass growth, respectively upon entry of 1mM toluene. :BenB ........................................................... 125 Figure 27: prediction of the growth kinetics based on the prediction of rate-limiting enzymes by the genetic circuit model upon entry of 1mM of toluene. A:toluene utilisation, B: biomass growth. ...... 125 Figure 28: model’s prediction of the transcriptional kinetics in a batch culture of A) Pr, B) Ps, C) Pu, D) PbenR, E) Pm, F) PbenA upon entry of 0.4mM toluene ................................................................ 130 Figure 29: model’s prediction of the transcriptional kinetics in a batch culture of A) Pr, B) Ps, C) Pu, D) PbenR, E) Pm, F) PbenA upon entry of 0.7mM toluene ................................................................ 131 Figure 30: model’s prediction of the transcriptional kinetics in a batch culture of A) Pr, B) Ps, C) Pu, D) PbenR, E) Pm with oscillations, F) Pm without oscillations, G) PbenA upon entry of 1.2mM toluene ................................................................................................................................................. 133 Figure 31: synthesis of active and inactive forms of the proteins XylR, XylS, BenR, A)XylRi, B)XylRa, C)XylSi, D)XylSa, E)BenRi, F)BenRa ................................................................................. 135 Figure 32: prediction of the rate limiting enzymes A) XylU and B) XylM, C) BenB, D) XylM without accounting for Pm oscillations, responsible for substrate utilisation and biomass growth, respectively. :0.4mM of toluene, :0.7mM, :1.2mM. ............................................................................ 136 Figure 33: prediction of the toluene utilisation and biomass formation patterns based on the prediction of rate-limiting enzymes by the genetic circuit model upon entry of 0.4 (A, B), 0.7 (C, D), 1.2 (E, F) mM of toluene. ................................................................................................................... 138 Figure 34: The interlinked chromosomal ortho-cleavage and TOL genetic networks during m-xylene and toluene induction. The overimposed regulation of the promoters is additionally presented. Upon mixture entry the inactive form of XylR (XylRi) oligomerises forming the active molecule XylRa which activates Pu and Ps promoters. Both XylR forms down-regulate their own promoter, Pr. Upon Pu activation the upper operon encodes for the enzymes which catalyse m-xylene and toluene catabolism into m-methyl-benzoate and benzoate, respectively. Ps activation and these two intermediates lead to overexpression of the xylS gene dimerising the inactive XylS protein to the active protein form. XylS dimerisation activates Pm. Pm controls meta operon which produces the enzyme further catalysing m-methyl-benzoate and benzoate to Krebs cycle metabolites. In the chromosomal ortho-cleavage pathway PbenR controls benR gene transcription, which encodes for BenR protein. Benzoate activates BenR which up-regulates TOL Pm of TOL and ortho-cleavage PbenA. PbenA controls ben operon transcription which encodes for the enzymes responsible for further benzoate transformation to Krebs cycle intermediates. (A) The enzymes encoded in the upper operon sequentially transform m-xylene and toluene into m-methyl-benzoate and benzoate, respectively. M-methyl-benzoate is transformed into Krebs cycle intermediates through the action of the enzymes synthesised by the meta operon and benzoate is degraded to Krebs cycle metabolites through both meta and ortho enzymes activity. (B) Logic representation of the two pathways, : input; : output; : AND; : OR; : NOT .................................................................... 146
10

Figure 35: M-xylene and toluene degradation in parallel with biomass growth at substrate mixtures of A)0.4mM m-xylene and 0.4mM toluene, B)0.6mM m-xylene and 0.4mM toluene, C)0.7mM m-xylene and 0.7mM toluene, :toluene, :m-xylene, :biomass .............................................................. 147 Figure 36: Pr expression pattern upon P. putida mt-2 exposure to A)0.4mM m-xylene-0.4mM toluene, B)0.6mM m-xylene-0.4mM toluene, C)0.7mM m-xylene-0.7mM toluene, ......................... 148 Figure 37: Ps expression pattern upon P. putida mt-2 exposure to A)0.4mM m-xylene-0.4mM toluene, B)0.6mM m-xylene-0.4mM toluene, C)0.7mM m-xylene-0.7mM toluene, ......................... 149 Figure 38: Pu expression pattern upon P. putida mt-2 exposure to A)0.4mM m-xylene-0.4mM toluene, B)0.6mM m-xylene-0.4mM toluene, C)0.7mM m-xylene-0.7mM toluene, ......................... 150 Figure 39: Pm expression pattern upon P. putida mt-2 exposure to A)0.4mM m-xylene-0.4mM toluene, B)0.6mM m-xylene-0.4mM toluene, C)0.7mM m-xylene-0.7mM toluene, ......................... 151 Figure 40: PbenR expression pattern upon P. putida mt-2 exposure to A)0.4mM m-xylene-0.4mM toluene, B)0.6mM m-xylene-0.4mM toluene, C)0.7mM m-xylene-0.7mM toluene., ........................ 152 Figure 41: PbenA expression pattern upon P. putida mt-2 exposure to A)0.4mM m-xylene-0.4mM toluene, B)0.6mM m-xylene-0.4mM toluene, C)0.7mM m-xylene-0.7mM toluene, ......................... 153 Figure 42: GSA results: the effect of model parameters on transcriptional regulation. The sensitivity indices of each parameter is presented on :A)Pr, B)Ps, C)Pu, D)Pm, E)PbenR, F)PbenA, G)m-xylene, H)toluene, I)biomass, :70, :100, :130, :180, :350, :430 min. .......................................... 162 Figure 43: model’s prediction of the transcriptional kinetics in a batch culture of A) Pr, B) Ps, C) Pu, D) PbenR, E) Pm with oscillations, F) PbenA upon entry of 0.7mM m-xylene and 0.7mM toluene . 163 Figure 44: synthesis of active (a) and inactive (i) forms of the proteins XylR, XylS, BenR upon entry of 0.7mM m-xylene and 0.7mM toluene, A)XylRi, B)XylRa, C)XylSi, D)XylSa, E)BenRi, F)BenRa 165 Figure 45: prediction of the rate limiting enzymes A) XylU and B) XylM, C)BenB responsible for substrate utilization and biomass growth, respectively upon entry of 0.7mM m-xylene and 0.7mM toluene. ................................................................................................................................................ 166 Figure 46: prediction of the growth kinetics based on the prediction of rate-limiting enzymes by the genetic circuit model upon simultaneous entry of 0.7mM m-xylene and toluene: A) m-xylene degradation, B) toluene degradation, C) biomass growth, and comparison of the current model with commonly used microbial growth kinetics model for: D) m-xylene degradation, E) toluene degradation, F) biomass growth, ......................................................................................................... 168 Figure 47: The biosystem studied in the thesis. : input; : output; : AND; : OR; : NOT. ................................................................................................................................................. 177 Figure 48: A) Feeding strategy profile for toluene in fed-batch mode, B) model-based controlled Pr expression, C) model-based toluene consumption in fed-batch mode, D) experimental validation based on the feeding strategy plan. ..................................................................................................... 184 Figure 49: A) The concentration of m-xylene and toluene in gas phase, B) the correlation of gas-liquid phase concentration, C) Dry cell weight calibration curve ....................................................... 201
11

List of Tables Table 1: m-xylene and toluene degradation to Krebs cycle intermediates, the enzymes in each metabolic step and the genes which encode each enzyme .................................................................... 30 Table 2 : The compounds of each metabolic step in benzoate degradation to catechol, the enzymes and the genes encoding the enzymes (Cowles et al., 2000; Harwood and Parales, 1996; Houghton et al., 1995) ............................................................................................................................................... 34 Table 3: The enzymes produced in each metabolic step when the first compound is protocatechuate, the enzymes and the genes encoding the enzymes................................................................................ 35 Table 4: Widely used models for substrate inhibition growth kinetics(adapted from Edwards (1970)) .............................................................................................................................................................. 50 Table 5: Primers used in quantitative real time-PCR. .......................................................................... 63 Table 6: The time points at which Pu, Ps, Pm, PbenR and PbenA promoters present their maximal relative mRNA expression. ................................................................................................................... 99 Table 7: The Koutinas et al. (2011) model of the hybrid growth kinetic-transcriptional regulation of the TOL plasmid (upon toluene entry in P. Putida mt-2). .................................................................. 111 Table 8: The parameters of GSA and the most significant ones for each variable (output) ............... 119 Table 9: Symbol, description, estimated values and units of the parameters of the model ................ 125 Table 10 : Symbol, description, initial values and units of the variables of the model ...................... 127 Table 11: The equations employed in the model................................................................................ 128 Table 12: Coefficient of determination (R2) of the vector: Pr, Ps, Pu, Pm, PbenR, PbenA between the experimental and model predicted data at each time point with 0.4, 0.7, 1, 1.2 mM initial toluene concentration. ...................................................................................................................................... 134 Table 13: coefficient of determination between the experimental and model predicted data for toluene utilisation and biomass formation patterns ......................................................................................... 138 Table 14: Equations of the association constant of XylR, XylS and BenR proteins and PbenA based on the switch point of 0.2mM m-xylene threshold. ............................................................................ 156 Table 15: Model equations for TOL and ortho-cleavage promoters and proteins ............................. 156 Table 16: Microbial growth kinetics equations for biomass growth rate, specific growth rate, m-xylene and toluene utilisation rate. ..................................................................................................... 157 Table 17: Coefficient of determination (R2) of the vector: Pr, Ps, Pu, Pm, PbenR, PbenA between the experimental and model predicted data at each time point with 0.7mM initial m-xylene and 0.7mM initial toluene concentration. ............................................................................................................... 164 Table 18: Correlation coefficients between experimental and modelling results of each model ....... 169 Table 19: Symbol, description, estimated values and units of the parameters of the model .............. 169 Table 20: Symbol, description, initial values and units of the variables of the model ....................... 170 Table 21: estimated parameters of double Monod, Mankad and Bungay, SKIP, sum kinetics with competitive enzymatic interactions models ........................................................................................ 202
12
List of Publications Journal Publications
-Tsipa A., Koutinas M, Pistikopoulos E.N., Mantalaris A. (2015). Transcriptional kinetics of
the cross-talk between the ortho-cleavage and TOL pathways of toluene biodegradation in
Pseudomonas putida mt-2, Journal of Biotechnology (submitted)
-Tsipa A., Misener R., Koutinas M., Pistikopoulos E.N., Mantalaris A. Modelling of
transcriptional regulation of metabolic pathways facilitates mechanistic prediction of
microbial growth kinetics (Manuscript)
-Tsipa A., Koutinas M., Vernardis S.I., Pistikopoulos E.N., Mantalaris A. Succinate traces
impact on toluene induced TOL and ortho-cleavage pathways of Pseudomonas putida mt-2
(Manuscript)
- Tsipa A., Pistikopoulos E.N., Mantalaris A. Double substrate mechanistic microbial growth
kinetics (In preparation)
Conferences and poster presentations
-Tsipa A., Pistikopoulos E.N., Mantalaris A. (2012). Gene expression dynamic modelling of
Pseudomonas putida towards linking with growth kinetics models, Young Researchers
Meeting, IChemE, Manchester, UK
13
-Tsipa A., Pistikopoulos E.N., Mantalaris A. (2014). Genetic dynamic modelling of
Pseudomonas putida mt-2 towards linking with growth kinetic models, ESBES-IFIBiop,
Lille, France
- Tsipa A., Pistikopoulos E.N., Mantalaris A. (2014) Transcriptional kinetics in Pseudomonas
Putida mt-2 cell cultures, PhD symposium, Department of Chemical Engineering, Imperial
College
- Tsipa A., Koutinas A., Pistikopoulos E.N., Mantalaris A. (2014). Development of a new
paradigm in biochemical engineering: predicting the genetic regulation of aromatic pollutants
degradation, AICHE annual meeting, Atlanta, Georgia, US
- Tsipa A., Vernardis S.I., Koutinas M., Pistikopoulos E.N., Mantalaris A. (2015). The effect
of succinate traces on TOL plasmid and chromosomal metabolic pathways of Pseudomonas
Putida mt-2 growing on toluene, Recent Technologies in Microbiology, Birmingham, UK
-Tsipa A., Koutinas A., Pistikopoulos E.N., Mantalaris A. (2015). Prediction of double
substrate microbial growth kinetics through transcriptional regulation: an integrated
experimental/modelling approach on Pseudomonas putida mt-2, AICHE annual meeting, Salt
Lake city, Utah, US
14
Nomenclature Αcronyms Description
P. putida mt-2 Pseudomonas putida mt-2 CCR carbon catabolite repression SKIP Sum kinetics with interaction parameters Q-RT-PCR quantitative-real time-polymerase chain reaction GSA global sensitivity analysis BTEX benzene-toluene-ethylbenzene-(the three isomers of) xylene XO xylene oxygenase BADH benzyl alcohol dehydrogenase BZDH benzaldehyde dehydrogenase DHCDH 1,2-dihydroxycyclohexa-3,5-1-caroxylate 2,3-dehydrogenase C2,3O catechol 2,3-dioxygenase HMSD 2-hydroxymuconic semialdehyde dehydrogenase 4OT 4-oxalocrotonate tautomerase 4OD 4-oxalocrotune decaroxylase OEH 2-hydroxypent-2,4 dienoate hydratase HOA 4-hydroxy-2-oxovalerate aldolase 4-HBA 4-hydroxybenzoate C1,2O catechol 1,2-dioxygenase MLE cis-cis-muconate lactonizing enzyme MI muconolactone isomerase ELH β-ketoadipate enol-lactone hydrolase TR β-ketoadipate succinyl CoA transferase TH β-ketoadipate CoA thiolase P3,4O protocatechuate 3,4-dioxygenase CMLE carboxymucomate lactonizing enzyme CMB γ-carboxymuconolactone decarboxylase CRC carbon repression control CCA carbon catabolite activation FFL feed-forward loop TF transcription factor SIM single-input module MIM multiple-input module MAM metabolic amplifier motif COBRA constraint-based reconstruction and analysis FBA flux balance analysis ODEs ordinary differential equations GC Gas chromatography GC-MS Gas chromatography-Mass spectrometry OD optical density MSTFA N-methyl-trimethylsilyl-trifluoroacetamide 3MBA 3-methyl-benzyl alcohol XMO xylene monooxygenase HU histone-like protein IHF integration host factor LB luria broth CI confidence interval SI sensitivity index
15

Symbols Description Units
S substrate mM KS Substrate saturation constant mM Ki Inhibition constant mM μmax Maximum specific biomass growth rate h-1 a Concentration dependent parameter for XylR polymerisation mM h-1 b Concentration dependent parameter for XylS polymerisation mM h-1 lTOL time at which Pu expression peaks min lchrom time at which PbenR expression peaks min λ Lag/adaptation phase min MWtoluene Molecular weight of toluene g mol-1
tolINI initial toluene concentration mM m-xylINI initial toluene concentration mM MWm-xylene Molecular weight of m-xylene g mol-1 bXylRi maximum Pr promoter mRNA translation rate mM h-1 rXylR oligomerisation constant of XylR h-1 rR,XylR dissociation constant of XylR h-1 aXylRi XylRi degradation and dilution due to cellular volume increase h-1 bPr maximal expression level of Pr h-1 KXylRi repression coefficient of Pr mM kXylRa dissociation of XylRa to XylRi h-1 aPr mRNA degradation rate of Pr h-1 bPu maximal expression level of Pu h-1 KXylRa,Pu activation coefficient of Pu by XylRa mM aPu mRNA degradation rate of Pu h-1 bPs maximal expression level of Ps h-1 KXylRa,Ps activation coefficient of Pu by XylRa mM aPs mRNA degradation rate of Ps h-1 bXylSi translation rate based on Ps mRNA mM h-1 rXylS oligomerisation constant of XylS h-1 rR,XylS dissociation constant of XylS h-1 aXylSi XylSi degradation and dilution due to cellular volume increase h-1 bPm maximal expression level of Pm h-1 KXylSi activation coefficient of Pm by XylSi mM aPm mRNA degradation rate of Pm h-1 KBenRa,Pm activation coefficient of Pm by BenR mM bPbenR maximum PbenR promoter mRNA expression h-1 KBenRa,PbenR activation coefficient of Pu by XylRa mM aPbenR mRNA degradation rate of PbenR h-1 bBenRi maximal translation rate of BenRi mM h-1 aBenRi BenRi degradation and dilution due to cellular volume increase h-1 rBenR oligomerisation constant of BenR h-1 rR,BenR dissociation constant of BenR h-1 kBenRa dissociation of BenRa to BenRi h-1
16
bPbenA maximum PbenA promoter mRNA expression h-1 KBenRa,PbenA activation coefficient of PbenA by BenRa mM aPbenA mRNA degradation rate of PbenA h-1 bBenB translation rate based on PbenA mRNA mM h-1 aBenB BenB degradation and dilution due to cellular volume increase h-1 aXylU XylU degradation and dilution due to cellular volume increase h-1 bXylU translation rate based on Pu mRNA mM h-1
bXylU,toluene maximum toluene metabolic quotient based on XylU gtol gbiomass h-1 bXylU,m-xylene maximum m-xylene metabolic quotient based on XylU gm-xyl gbiomass h-1 KXylU,toluene saturation constant for XylU producted due to toluene mM KXylU,m-xylene saturation constant for XylU producted due to m-xylene mM dmax maximum decay rate h-1
Kd decay saturation constant mM aXylM XylM degradation and dilution due to cellular volume increase h-1 bXylM translation rate based on Pm mRNA mM h-1
bb maximum specific growth rate of biomass based on XylM h-1 KXylM,b saturation constant of XylM mM KBenB,b saturation constant of BenB mM rI oligomerisation constant of Ii h-1 rI,R dissociation constant of Iα h-1 rR oligomerisation constant of Ri h-1 rR,R dissociation constant of Rα h-1 n hill coefficient n/a α1 constant rate of activation of Pm by the new intermediate pathway mM h-1 α2 constant rate of activation of I by Pm mM h-1 α3 constant rate of activation of R by I mM h-1 b1 maximal translation rate based of Rα mM h-1 b2 maximal translation rate based of Iin mM h-1 b3 maximal translation rate based of Rin mM h-1 K1 activation coefficient of Rα mM Κ2 activation coefficient of Pm mM Κ3 activation coefficient of Iα mM XylRi inactive form of XylR protein mM XylRa Active form of XylR protein mM Pr Pr promoter mM Pu Pu promoter mM XylU Rate-limiting enzyme of upper-operon mM Ps Ps promoter mM XylSi inactive form of XylS mM XylSa active form of XylS mM Pm Pm promoter mM XylM Rate-limiting enzyme of meta-operon mM PbenR PbenR promoter mM BenRa active form of BenR protein mM
17

BenRi Inactive form of BenR protein mM PbenA PbenA promoter mM BenB Rate-limiting enzyme of ben operon mM tol toluene concentration mM xyl m-xylene concentration mM μ specific growth rate h-1 X Biomass growth mgL-1
d Decay rate mM Rin inactive form of protein R mM Rα active form of protein R mM Iin inactive form of protein I mM Iα active form of protein I mM
Y Yield coeffient
Itoluene degree of inhibition exerted by toluene to m-xylene Im-xylene degree of inhibition exerted by m-xylene to toluene
18

Chapter 1 1. Introduction
Microbial degradation has extensively been utilised for many aromatic compounds
removal from contaminated sites (Diaz et al., 2013). Furthermore, in microbial fermentation
industry naturally producing microorganisms are used as cell factories for bio-fuels and
chemicals production or as metabolic engineering platforms for targeted chemicals
production (Almquist et al., 2014); thus rendering microbial growth, substrate utilisation and
product formation patterns essential in environmental bioprocesses and industrial
biotechnology. Microbial growth kinetics models are used to monitor and predict the
performance of a bioprocess and could lead to bioprocess control and optimisation (Koutinas
et al., 2012). The Monod and Monod-type kinetic models are widely accepted and
traditionally employed. But these models are macroscopic, ignoring the molecular
interactions and transcriptional regulation existing in each microorganism (Kovarova-Kovara
and Egli, 1998; Rogers and Reardon, 2000), thus often leading to failure in predicting the
kinetics of the bioprocess. Moreover these models are empirical and their application
succeeds only to a narrow range of conditions.
Transcriptional regulation is a key step, especially in the biodegradation process, acting
as a controller regulating the appropriate metabolic cascades in response to the availability of
specific substrate(s) (Díaz and Prieto, 2000). The current state of the art proves the
importance of transcriptional regulation to predict the performance of bioprocesses. The
significance of linking the intracellular gene transcript levels to the biotransformation
performance of a substrate in a gas-phase biofilter was highlighted by Gunsch et al. (2007),
while Douma et al. (2010) constructed and coupled a dynamic gene regulation model of the
fungus Penicillium chrysogenum for the prediction of the pattern of penicillin production.
19

Despite the limited validation of the model due to measurement of enzyme activity only and
not the transcriptional levels of the genes, prediction of penicillin production was remarkably
more precise compared to the one predicted by conventional models. Furthermore the
performance of the biodegradation of chlorinated ethenes by Dehalococcoides spp. bacterial
consortium was modelled based on modelling the mRNA expression of the key genes which
encode the enzymes responsible for substrate catabolism. Thus, the activity of the enzymes
was predicted and utilised to determine the pollutants consumption patterns (Bælum et al.,
2013).
Pseudomonas putida mt-2, which harbours the TOL plasmid and is a metabolically
versatile soil bacterium, has been utilised to predict m-xylene utilisation and biomass
formation patterns by Koutinas et al. (2011). These patterns were determined through the
development of a coupled regulated promoter expression and growth kinetics dynamic model
unravelling the significant prediction capability of the model compared to that of the Monod
and Yano and Koga (1969) under a wide range of conditions.
M-xylene is an aromatic compound which belongs to the BTEX group of pollutants.
Aromatic compounds are generally considered to be major environmental pollutants due to
their toxicity and persistence in the environment. Although these compounds are usually
toxic to a wide range of microorganisms, various bacterial strains are capable of utilising
them as a source of energy and carbon due to their metabolic versatility and genetic plasticity
(Díaz and Prieto, 2000). The catabolism of a pollutant occurs through specific bacterial
metabolic pathways which are activated as soon as the compound(s) enter the cell. Therefore,
the successful activation of a specific metabolic pathway relies mainly on two significant
factors: i) the catabolic enzymes catalysing the degradation of the compound, and ii) the
cellular elements involved in regulation (de Lorenzo and Perez-Martin, 1996). These
20

elements comprise the promoters of genes and operons subject to regulation by specific
transcription factors.
The TOL plasmid is a paradigm of global and specific regulation consisting of four
transcriptional units: xylR, xylS, upper and meta operon, which are controlled by Pr, Ps, Pu
and Pm promoters, respectively. Induction with m-xylene activates a cascade of metabolic
events engaging the involvement of several DNA-bending proteins, transcriptional and sigma
factors; thus resulting in effector’s mineralisation to Krebs cycle metabolites which are
necessary for biomass growth. Toluene entry in P. putida mt-2, which is the model substrate
of the specific microorganism, is able to activate except for the TOL metabolic pathway, the
chromosomal ortho-cleavage metabolic pathway.
Upper operon encoded enzymes activity catalyse toluene oxidative catabolism to
benzoate, which boosts ortho-cleavage BenR protein activity. BenR is the key biosystem
regulator because it triggers expression of ortho-cleavage PbenA promoter as well as TOL
Pm. BenR is encoded by benR gene controlled by PbenR promoter. Furthermore, PbenA is
the control unit of ben operon which encodes for the enzymes catalysing benzoate to catechol
leading to further benzoate catabolism to Krebs cycle intermediates by the ortho-cleavage
pathway. Therefore monitoring the expression pattern of both ortho- promoters PbenR and
PbenA is crucial for the biodegradation process. PbenA activity has been measured before
however PbenR expression, despite its importance to the biosystem, has never been
demonstrated. Profiling of transcriptional kinetics is not only essential in biodegradation, but
it is also necessary in every bioprocess in order to understand metabolic pathways responses
upon growth on different substrates towards the development of cell factories platforms for
industrial applications or in a metabolically engineered microogranism. Toluene utilisation
and biomass formation patterns could be predicted by employing the hybrid microbial growth
kinetic model byKoutinas et al. (2011). However the model has to be re-developed and
21

upgraded in order to take into account the biodegradation of toluene intermediate, benzoate,
by the ortho-cleavage pathway.
The specific catabolic pathways have been generally examined in lab-scale level in
which the effector is the sole growth-supporting substrate. However, in nature a mixture of
potential growth substrates is present. Upon cells exposure to a mixture of compounds the
most favourable compound will firstly be consumed by the cells silencing or repressing the
activation of the catabolic genes of the other compounds degradation pathway(s). This
phenomenon is called carbon catabolite repression (CCR). In Pseudomonas, CCR is activated
by glucose presence, which has been proven to be a repressory compound for the TOL
plasmid regulatory network regardless of the growth conditions. The presence of organic
acids, such as succinate, in the mixture, is repressory for the TOL plasmid genes in
continuous cultures supplemented either with complete or M9 minimal salts medium. In
batch cultures the presence of succinate and complete medium lead to repression of the TOL
plasmid. Furthermore benR and benA genes of ortho-cleavage pathway are repressed. The
succinate concentration levels used to test CCR effect exceed 10mM. However the effect of
M9 minimal salts medium supplementation in batch cultures is controversial and although it
has been mentioned as non-repressive for the specific pathways, the impact of succinate is
not clear.
In a compound mixture the most preferable by the cells compounds are organic acids,
followed by glucose and then hydrocarbons and aromatic compounds. The mixture of
succinate and toluene is studied to test the effect of succinate on TOL and ortho-cleavage
metabolic pathways. Nevertheless a mixture with high interest related to these two pathways
is one which could activate both pathways and be meaningful in biodegradation schemes. M-
xylene and toluene are both mineralised by the TOL plasmid metabolic pathway and belong
to the BTEX group of pollutants which are highly toxic in the environment. These
22

compounds mixture could be found in petroleum derivatives. However their transcriptional
kinetics upon entry of both effectors have never been monitored before. Duetz et al. (1998)
found that m-xylenes are strongly preferred compared to toluene proving CCR of m-xylene to
toluene.
The prediction of m-xylene and toluene mineralisation based on transcriptional
regulation will be a breakthrough in biochemical engineering. Although extremely important,
the dual substrate microbial growth kinetics are limited to Monod-type models and their
prediction capability, similarly to one growth-supporting substrate, fails when applied to a
broad range of conditions. Furthermore, mixture of compounds is used in microbial
fermentation processes for enhancing production of chemicals and bio-fuels and modelling
of mixtures consumption in substrates could be useful for scaling-up fermentation processes
and bioremediation schemes.
The mathematical modelling of gene regulatory systems is the result of time-series gene
expression data (Bar-Joseph et al., 2012) in conjunction to laborious macroscopic
measurements of substrate and biomass. Nevertheless in vivo collection of experimental data
is expensive, time consuming resulting in a data abundance which is difficult to handle and
to interpret correctly. The endless experimentation could be avoided by applying a closed
loop approach between in silico and in vivo to model biological systems. Therefore, the
development of a mathematical model describing the biological phenomena is followed by
model analysis, and the most significant parameters of the process are estimated. Once the
model is completed, its prediction capability is tested with independent experimental data.
Thus, leading to an accurate mathematical representation of a bioprocess which has an
adequate prediction capability (Almquist et al., 2014; Kiparissides et al., 2011a; Kontoravdi
et al., 2010).
23

Chapter 2
2. Literature review
In this Chapter an overview of the literature regarding to the importance of the
microorganism Pseudomonas putida mt-2 and its metabolic pathways responsible for
substrate utilisation and biomass formation will be presented. Furthermore, as the key role of
transcriptional regulation in bioprocesses has been underlined, gene network representation
models and modelling approaches of gene networks are reviewed. Monitoring of substrate
utilisation and biomass formation is achieved through microbial growth kinetics models;
therefore the most commonly used models in bioprocesses are assessed.
2.1 Pseudomonas putida
Pseudomonas are ubiquitous bacteria which can endure under various environmental
conditions such as water ecosystems, soil or plants, human and animal tissues (Palleroni and
Moore, 2004). A common characteristic of this species is their remarkable metabolic
versatility which allows them to mineralise numerous compounds. Some species such as P.
aeruginosa are able to serve as severe opportunistic pathogens. Other species such as P.
fluorescens and P. putida could be useful for plants and live in the plant rhizosphere (dos
Santos et al., 2004; Lugtenberg and Dekkers, 1999; Molina et al., 2000). P. putida thrives in
different habitats and competes successfully with other organisms (Pieper et al., 2004). A
large number of P. putida is used in biotechnology, due to their suitability as cell factories in
metabolic engineering (Ewering et al., 2006) and as a platform of microbial production of a
variety of fine and bulk chemicals. This bacterium is able to utilise toluene, m- and p- xylene,
pseudocumene, and m-ethyl-toluene as sole energy and carbon sources (Duetz et al., 1994).
24

The majority of these compounds belongs to the BTEX (benzene, toluene, ethylbenzene and
the three isomers of xylene) group of pollutants (Jindrova et al., 2002). Therefore P. putida
efficiently contributes to bioremediation. Furthermore, Nicolaou et al. (2010) characterise
this bacterium as the most solvent-tolerant, rendering Pseudomonas putida as a model
bacterium in industrial biotechnology; thus leading to a great interest in investigating specific
metabolic pathways at the gene regulation and expression level (Ballerstedt et al., 2007). P.
putida KT2440 was firstly used as a host-vector in order to clone genes and express
heterologous genes with safety (Nogales et al., 2008a). P. Putida mt-2, which is derived by
P. putida KT2440, harbours TOL plasmid and is featured as the best bacterium for toluene
degradation (Timmis, 2002). Environmental pollutants degradation is achieved through both
TOL plasmid and chromosomal pathways.
2.1.1 The TOL plasmid metabolic pathway
The TOL plasmid is a paradigm of specific and global regulation because of its
complex interactive system of gene regulators, sigma factors and DNA bending proteins
(Aranda-Olmedo et al., 2005). TOL pathway specifies metabolic pathways for toluene and m-
xylene (Timmis, 2002) degradation and it is organised in four units: xylR, xylS, upper and
meta operons. This biochemical structure is a reflection of the genetic control of the catabolic
operons. The genetic regulation is achieved through genetic loops. More specifically, two
regulatory loops exist in the TOL plasmid: the meta and the cascade loop. The meta loop
involves meta operon expression resulting in meta pathway activation. However upon
induction with effectors activating all four units the cascade loop is activated. The cascade
loop is a complex system which operates in P. putida cells and guarantees the coordinate
expression of both the upper and meta pathways.
25

2.1.1.1 TOL cascade loop
In Figure 1, the degradation of m-xylene through the cascade loop is presented. In
Figure 1A a reconstruction of the genetic regulatory system of the TOL plasmid showing all
the molecular components which interact in the system is presented and in Figure 1B the
system is described through logic gates, similar to biochemical inverters (Weiss, 2001). As a
result, similarly to the analogy of an electronic circuitry, the system is ‘electronically’
represented.
The xylR and xylS genes control the transcription of the upper and meta operons. The
promoters of xylR and xylS genes and upper and meta operons, are called Pr, Ps, Pu and Pm,
respectively (Ramos et al., 1997). Ramos et al. (1997) explained the function of TOL
cascade loop which is briefly presented below. The xylR gene is the master regulator of the
TOL catabolic pathway and it is constitutively expressed encoding for XylR protein. This
gene is expressed by two tandem promoters which depend on σ70 factor, Pr1, Pr2. XylR
protein is an auto-repressor. An advantage of TOL metabolic pathway is that upon presence
of an upper pathway effector such as m-xylene, both upper and meta pathways are
simultaneously activated (Burlage et al., 1989).
Upon effectors absence, XylR protein, which belongs to NtrC family, is non-active
forming a dimer molecule. Effectors presence leads to XylR protein activation by binding
with ATP. Subsequently XylR oligomerises forming a hexamer molecule and undergoes
some conformational changes in order to be transcriptionally competent (Bertoni et al.,
1998). The active form of XylR is the up-regulator of both Ps and Pu promoters which
control xylS and upper operon, respectively.
The xylS gene is controlled by Ps promoter which consists of Ps1 and Ps2 promoters.
The expression of xylS gene is continuous due to the σ70-dependent promoter Ps2. Therefore
XylS protein of AraC family is constantly produced at low levels. Effectors presence results
26

in Ps1 up-regulation by the active XylR triggering its transcription with the assistance of HU
(histone-like) protein which bends and binds on Ps-DNA sequence with the mediation of σ54
factor which contains RNA polymerase. This procedure leads to the correct architecture of
the promoter (Perez-Martin and deLorenzo, 1995). The activation of XylS protein is achieved
by interaction with alkylbenzoates and benzoates. Subsequently the active form of XylS is
responsible for the stimulation of Pm promoter transcription by the factors σ38 or σ32 which
contains RNA polymerase (the meta loop). Therefore, a hyperproduction of XylS protein is
noticed because xylS gene is hyperexpressed (Ramos et al., 1997).
Active XylR stimulates Pu transcription with the assistance of the integration host
factor (IHF) protein, which is a DNA-bending protein, and σ54 factor which contains RNA
polymerase. Both the σ54 factor which contains RNA polymerase and the IHF are required by
this process (Ramos et al., 1997). More specifically, IHF bending in Pu facilitates the
interaction of σ54-RNA polymerase and XylR protein. IHF is a small (20kDa) basic and
heterodimeric protein which belongs to the family of prokaryotic nucleoid-associated proteins
(Valls et al., 2002).
Pu activation triggers the expression of the catabolic upper operon xylUWCAMBN
which degrade toluene/xylenes to benzoate/alkylbenzoates. Pm stimulation leads to activation
of the catabolic meta-operon xylXYZLTEGFJQKIH, encoding enzymes which facilitate the
conversion of benzoate/alkylbenzoates into Krebs cycle intermediates. This operon consists
of 13 genes with extension over 11kb and it is one of the largest operons in prokaryotes. The
upper operon encoded enzymes lead to effector’s oxidative catabolism to
ethylbenzoates/benzoates and the meta-loop encoded enzymes participate in the aromatic ring
break down leading to Krebs cycle intermediates. All the enzymes produced in the TOL
plasmid metabolic pathway which catalyse the environmental pollutants are explained below.
27

Figure 1: The TOL plasmid pWW0 m-xylene biodegradation pathway. The reactions implicated in this effector metabolism, including the stepwise oxidation of one methyl group of the substrate to an alcohol and eventually to a carboxylic acid, yielding m-methyl-benzoate through the action of the enzymes encoded by the upper TOL pathway. M-methylbenzoate is then deoxygenated to yield 3-methylcatechol, which is cleaved in meta and finally channelled into the Krebs cycle by means of the products of the meta operon. The upper operon is transcribed from the σ54 promoter Pu upon activation by the cognate regulator of the pathway (XylR) bound to specific effectors. These include the substrate of the pathway (m-xylene) as well as the two first metabolic intermediates: 3-methylbenzylalcohol and 3-methylbenzylaldehyde. The meta operon is transcribed from the Pm promoter, which is activated by the m-methylbenzoate responsive activator XylS. Pm can be turned on by either XylS or m-methylbenzoate as a co-inducer, or by overproduction of XylS alone. Finally, xylS and xylR are transcribed from the divergent and overlapping promoters Ps and Pr respectively. The regulation of the latter is connected, because the Ps promoter is activated by XylR, which also binds and downregulates its own Pr promoter, (A) TOL regulatory circuit, and (B) its logic implementation. TurA: TurA protein; XylSa: active form of XylS; XylSi: inactive form of XylS; XylSh: hyperproduction of XylS; : Input; output; AND; OR; NOT; (adapted from Koutinas et al. (2010) )
28

2.1.1.2 TOL meta loop
The operation of meta loop occurs upon cells growth on benzoates and
methylbenzoates. When TOL effectors are absent or cells grow on glycerol or glucose, the
σ70-dependent promoter Ps2 expresses the xylS gene at a low level, therefore the XylS protein
is produced in small quantities in an inactive form (XylSi). The addition of
methylbenzoate/benzoate effectors in the medium activates XylS protein upon interaction of
the inactive form with the effector. The activated protein stimulates Pm promoter and, hence,
the meta operon transcription. Stimulation of Pm is mediated by σ38 or σ32 factors with RNA
polymerase (Ramos et al., 1997). The activity of each σ factor depends on the biomass
growth phase (Marques et al., 1999). Subsequently the aromatic ring is cleaved by the
enzymes encoded in the TOL meta-pathway and the precursors are catabolised to Krebs cycle
intermediates (Ramos et al., 1997)
2.1.1.3 The TOL plasmid effectors degradation
Two of the major aromatic pollutants used widely in the studies of P. putida are m-
xylene and toluene (Timmis, 2002). Based on the observations of Harayama and Rekik
(1990) and Williams and Sayers (1994) each metabolic step of both upper and meta pathway
of the TOL plasmid upon the oxidative catabolism of m-xylene/toluene is shown in Table 1.
The products of the genes xylU, xylW, and xylN are not essential when the bacteria grow on
toluene/xylene (Ramos et al., 1997). The same conclusion about the enzymes encoded by the
genes xylU and xylW, was extracted in the study of Williams et al. (1997). HMSF enzyme
encoded by xylF gene catalyses the conversion of 5-methyl-2-oxohexa-4-ene-1, 6-dioate/2-
oxohex-4-ene-1, 6-dioate to formate in m-xylene/toluene degradation, respectively. However
HMSF does not participate in the main metabolic pathway of the TOL plasmid (Ramos et al.,
29
1997). In Figure 2, the enzymes involved in each metabolic step of upper and meta pathway
are shown graphically.
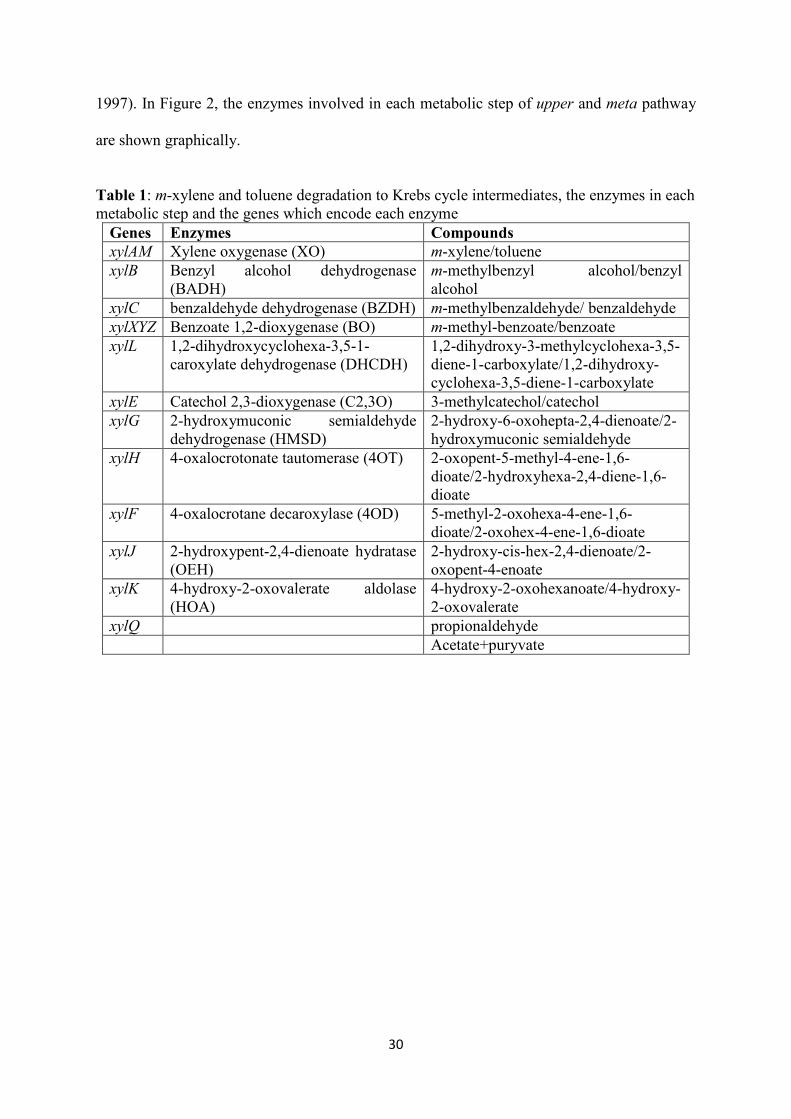
Table 1: m-xylene and toluene degradation to Krebs cycle intermediates, the enzymes in each metabolic step and the genes which encode each enzyme
Genes Enzymes Compounds xylAM Xylene oxygenase (XO) m-xylene/toluene xylB Benzyl alcohol dehydrogenase
(BADH) m-methylbenzyl alcohol/benzyl alcohol
xylC benzaldehyde dehydrogenase (BZDH) m-methylbenzaldehyde/ benzaldehyde xylXYZ Benzoate 1,2-dioxygenase (BO) m-methyl-benzoate/benzoate xylL 1,2-dihydroxycyclohexa-3,5-1-
caroxylate dehydrogenase (DHCDH) 1,2-dihydroxy-3-methylcyclohexa-3,5-diene-1-carboxylate/1,2-dihydroxy-cyclohexa-3,5-diene-1-carboxylate
xylE Catechol 2,3-dioxygenase (C2,3O) 3-methylcatechol/catechol xylG 2-hydroxymuconic semialdehyde
dehydrogenase (HMSD) 2-hydroxy-6-oxohepta-2,4-dienoate/2-hydroxymuconic semialdehyde
xylH 4-oxalocrotonate tautomerase (4OT) 2-oxopent-5-methyl-4-ene-1,6-dioate/2-hydroxyhexa-2,4-diene-1,6-dioate
xylF 4-oxalocrotane decaroxylase (4OD) 5-methyl-2-oxohexa-4-ene-1,6-dioate/2-oxohex-4-ene-1,6-dioate
xylJ 2-hydroxypent-2,4-dienoate hydratase (OEH)
2-hydroxy-cis-hex-2,4-dienoate/2-oxopent-4-enoate
xylK 4-hydroxy-2-oxovalerate aldolase (HOA)
4-hydroxy-2-oxohexanoate/4-hydroxy-2-oxovalerate
xylQ propionaldehyde Acetate+puryvate
30
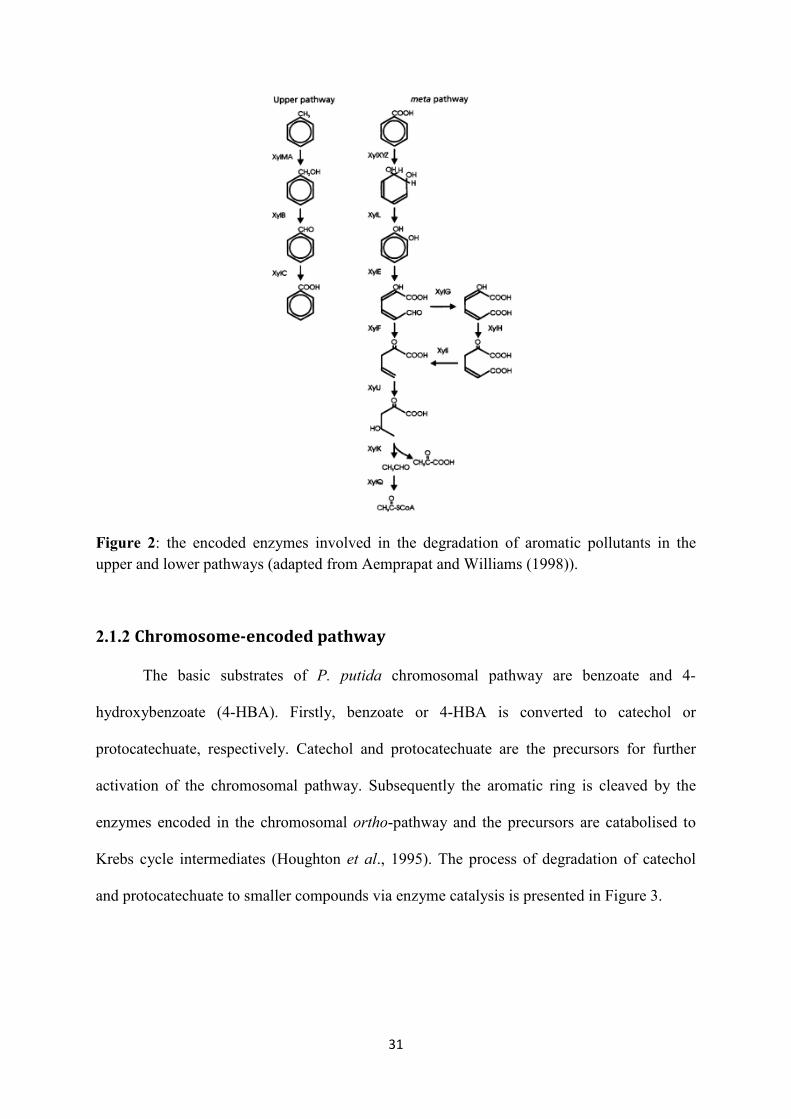
Figure 2: the encoded enzymes involved in the degradation of aromatic pollutants in the upper and lower pathways (adapted from Aemprapat and Williams (1998)).
2.1.2 Chromosome-encoded pathway
The basic substrates of P. putida chromosomal pathway are benzoate and 4-
hydroxybenzoate (4-HBA). Firstly, benzoate or 4-HBA is converted to catechol or
protocatechuate, respectively. Catechol and protocatechuate are the precursors for further
activation of the chromosomal pathway. Subsequently the aromatic ring is cleaved by the
enzymes encoded in the chromosomal ortho-pathway and the precursors are catabolised to
Krebs cycle intermediates (Houghton et al., 1995). The process of degradation of catechol
and protocatechuate to smaller compounds via enzyme catalysis is presented in Figure 3.
31

Figure 3: the catabolic genes and the relevant encoded enzymes in the degradation of protocatechuate and catechol to Krebs cycle intermediates (adapted from Houghton et al. (1995)).
2.1.2.1 Ortho-cleavage pathway
The ortho-cleavage pathway is, almost always, encoded in the chromosome of
proteobacteria, eubacteria and fungi. It has a central role in the degradation of natural lignin
aromatics, aromatic compounds of other plant components and environmental pollutants.
Usually, it simultaneously exists with the meta- pathway which is encoded in the TOL
plasmid contained in Pseudomonas. Other names of the ortho-pathway are β-ketoadipate and
intradiol pathway. The name β-ketoadipate is common because a key intermediate in the
pathway is the compound β-ketoadipate and the name intradiol derives from the kind of ring
cleavage which takes place between the hydroxyl groups. In prokaryotes and more
32
specifically in Pseudomonas, nine enzymes of the ortho-pathway catalyse either catechol or
protocatechuate degradation to Krebs cycle intermediates (Harwood and Parales, 1996).
The ortho-cleavage pathway is almost exclusively found in soil microorganisms. The
bacterial groups which encode this specific pathway are associated with plants because
during growth, plants synthesise a lot of phenolic compounds. These phenolic compounds are
released in the rhizosphere of plants serving as chemical signals able to activate interactions
among the microbes of soil.
Lignin is a major wood component and a polymer consisting of phenolic aromatic
compounds. The decay of plant-material results in lignin-related monomers by-products
detected in soil in micromolar quantities. Monomers which are converted to protocatechuate
before degradation via the ortho- pathway are coniferyl alcohol, ferulate, vanillate, and 4-
coumarate. Moreover, two hydroaromatic compounds which are released from the decay of
plant-material, quinate and shikimate are also coverted to protocatechuate. Compounds which
are unsubstituted and related to lignin such as cinnamate are converted to catechol before
entry into the ortho-cleavage pathway. The natural aromatics mandelate, anthranilate, and
tryptophan are also converted to catechol and further degraded in ortho-cleavage pathway.
Other compounds which are degraded through the ortho-pathway are toxic substances
such as aromatic hydrocarbons, aminoaromatics, and chlorinated aromatic compounds.
Furthermore aniline, benzene, naphthalene, p-cresol and 4-chlorobenzoate are cleaved though
this pathway (Harwood and Parales, 1996).
2.1.2.2 Benzoate degradation pathway
The benBCDKEF gene operon encodes for the enzymes catalysing benzoate
degradation to catechol (Cowles et al., 2000). The regulator of this operon is BenR protein,
encoded by benR gene, which activates the promoter of the operon PbenA or as it is
33

commonly called Pb (Silva-Rocha and de Lorenzo, 2012a). This promoter controls ben
operon. Benzoate is transformed to catechol with two enzymatic steps through the enzymes
produced by benBC and benD genes (Cowles et al., 2000). The enzyme encoded by benK is a
benzoate transporter, the role of the enzyme encoded by benE gene is not known yet, while
the protein encoded by benF gene is a porin (Cowles et al., 2000). Catechol presence triggers
activation of the catABCDIJF gene operon. CatR protein activated by catR gene is the
regulator of this operon (Houghton et al., 1995). In Table 3 the compounds of each metabolic
step of benzoate degradation, the enzymes catalysing the conversion to this step and the gene
which encodes for the relevant enzyme are presented.
Table 2 : The compounds of each metabolic step in benzoate degradation to catechol, the enzymes and the genes encoding the enzymes (Cowles et al., 2000; Harwood and Parales, 1996; Houghton et al., 1995) Genes Enzymes Compounds benBC Benzoate 1,2- dioxygenase benzoate benD cis-Diol dehydrogenase 1,2-dihydroxy-cyclohexa-
3,5-diene-1-carboxylate catA Catechol 1,2-dioxygenase (C1,2O) catechol catB Cis,cis-muconate lactonizing enzyme(MLE) cis,cis- muconate catC Muconolactone isomerase (MI) Muconolactone catD β-ketoadipate enol-lactone hydrolase (ELH) β-ketoadipate enol-lactone catIJ β-ketoadipate succinyl CoA transferase (TR) β-ketoadipate catF β-ketoadipyl CoA thiolase (TH) β—ketoadipyl-CoA Succinyl-CoA+Acetyl-CoA
2.1.2.3 4-Hydroxybenzoate (4HBA) degradation pathway
The gene which encodes for the enzyme catalysing the degradation of 4-HBA to
protocatechuate is pobA and the enzyme which is produced is called PoA (Cowles et al.,
2000). 4-HBA is transformed to protocatechuate with only one enzymatic step. In this
process pcaK gene is also present which encodes for the enzyme 4-HBA permease which is
responsible for the transportation of 4-HBA and does not participate into the conversion of 4-
HBA to protocatechuate (Cowles et al., 2000). The pcaBCDIJF gene operon is responsible
34

for the conversion of protocatechuate to Krebs cycle intermediates. This operon is regulated
by PcaR protein which is encoded by pcaR gene (Nichols and Harwood, 1995). In Table 3 the
compounds of each metabolic step, the enzymes catalyses the conversion to this step and the
genes which encode for the relevant enzymes are presented, in the case of protocatechuate
biodegradation (Harwood and Parales, 1996; Hosokawa and Stanier, 1966; Houghton et al.,
1995).
Table 3: The enzymes produced in each metabolic step when the first compound is protocatechuate, the enzymes and the genes encoding the enzymes.
Genes Enzymes Compounds poA 4-hydroxybenzoate hydroxylase 4-HBA
pcaHG protocatechuate 3,4-dioxygenase (P3,4O) protocatechuate
pcaB carboxymuconate lactonizing enzyme (CMLE)
β-carboxymuconate
pcaC γ-carboxymuconolactone decarboxylase (CMB)
γ- carboxymucolactone
pcaD β-ketoadipate enol-lactone hydrolase (ELH) β-ketoadipate enol-lactone
pcaIJ β-ketoadipate succinyl CoA transferase (TR) β-ketoadipate
pcaF β-ketoadipyl CoA thiolase (TH) β—ketoadipyl-CoA
- Succinyl-CoA+Acetyl-CoA
2.1.2.4 Ortho- and meta- loop in Pseudomonas putida mt-2
The enzymes encoded by both ortho and meta loops catalyse the aromatic ring
cleavage of the relevant effectors however meta- pathway enzymes can also participate in
methylated catecholic compounds degradation. Thus, the meta-pathway is studied broadly
because they can degrade methylated aromatic hydrocarbons such as xylenes (Harwood and
Parales, 1996).
Cuskey and Sprenkle (1988) identified the regulatory chromosomal gene benR which
encodes for BenR protein. BenR triggers the activation of the chromosomal ben operon
which produces the enzymes involved in the degradation of benzoate to catechol in P. putida.
35
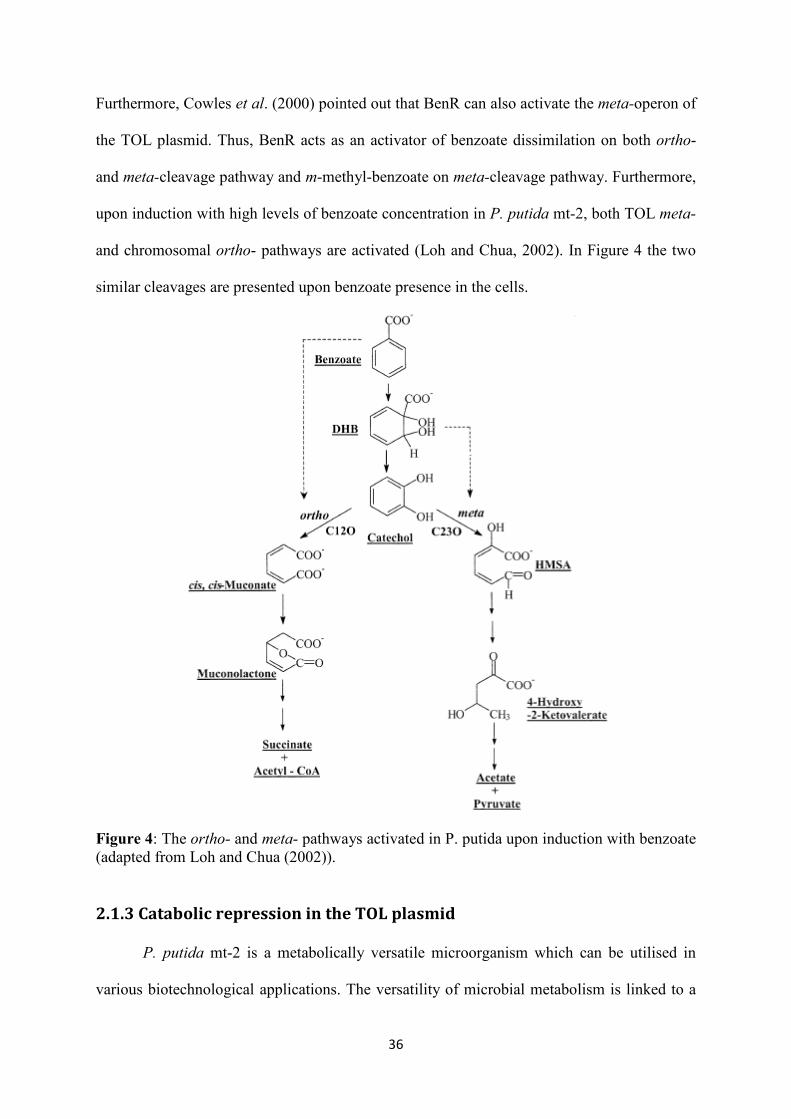
Furthermore, Cowles et al. (2000) pointed out that BenR can also activate the meta-operon of
the TOL plasmid. Thus, BenR acts as an activator of benzoate dissimilation on both ortho-
and meta-cleavage pathway and m-methyl-benzoate on meta-cleavage pathway. Furthermore,
upon induction with high levels of benzoate concentration in P. putida mt-2, both TOL meta-
and chromosomal ortho- pathways are activated (Loh and Chua, 2002). In Figure 4 the two
similar cleavages are presented upon benzoate presence in the cells.
Figure 4: The ortho- and meta- pathways activated in P. putida upon induction with benzoate (adapted from Loh and Chua (2002)).
2.1.3 Catabolic repression in the TOL plasmid
P. putida mt-2 is a metabolically versatile microorganism which can be utilised in
various biotechnological applications. The versatility of microbial metabolism is linked to a
36
specific control of transcriptional and post-transcriptional regulation of metabolic pathways
upon multiple environmental signals in order to optimise the efficiency of the bioprocess and
ecological fitness (Rojo, 2010). Several distinct global regulation networks participate in the
coordination of gene expression programmes under different situations (Cases and de
Lorenzo, 2005).
Upon availability of multiple carbon sources at sub-lethal concentration levels,
metabolism coordination involves the activation of global regulatory systems either by co-
metabolising the different carbon sources or catabolising preferentially one specific
compound which can more efficiently support biomass growth over the other(s), repressing
simultaneously the expression of the genes which are necessary for the degradation of the
other(s) compound(s). The latter regulatory mechanism of microbial metabolism is called
carbon catabolite repression (CCR) or catabolite repression control (CRC). When the
repression includes the activation of several genes non-related to the specific pathways of
preferred and non-preferred compound(s) for catabolism leading to important metabolic
reorganisation, carbon catabolite repression is called carbon catabolite activation (CCA).
Although glucose is a commonly used substrate for bacterial growth, the preferred carbon
sources for Pseudomonas species are amino acids and some organic acids. The sequential
hierarchy of preferred compounds in Pseudomonas used as carbon sources is (1) organic and
amino acids, (2) glucose, (3) hydrocarbons (Rojo, 2010).
CCR mechanism is the regulation of the cell physiological behaviour regarding to
the use of one preferential carbon source among a mixture of carbon sources. The repression
is observed in the other carbon sources catabolism in the mixture (Díaz and Prieto, 2000).
When environmental signals are induced to bacterial cell, the most favourable catabolic
functions of the cell are activated and the rest of them remain silenced. This means that the
promoters of the metabolic pathways undergo several physiological controls adjusting their
37

transcription initiation to the general environmental conditions of the bacterial cell (Cases et
al., 1999).
In Pseudomonas strains, when an organic acid is present, such as a lactate, or in the
presence of a Krebs cycle intermediate, such as citrate or succinate, the metabolic pathways
of catabolism of aromatic pollutants are subject to cAMP-independent CCR occurring at the
transcriptional phase (Santos et al., 2000). An example of CCR is the presence of fumarate,
which inhibits the activation of clc operon transcription. Fumarate is a key molecule in the
Krebs cycle which acts as a signal for sensing the metabolic state of the cycle. The clc
operon encodes enzymes responsible for the degradation of chloroaromatics in P. putida. The
inhibition is due to the competition between the fumarate and the inducer of the pathway, 2-
chloromuconate, in order to bind to the ClcR activator which is encoded by clc (McFall et al.,
1998).
Upon multiple substrates presence TOL plasmid Pu expression has been extensively
studied. The activity of Pu promoter which depends on σ54 factor is inhibited by substrates
such as glucose, gluconate and a-ketogluconate. This regulation occurs probably due to the
inhibition of ptsN gene transcription encoding for a phosphotransferase which catalyse sugar
assimilation (Cases et al., 1999). In addition to this, the activity of Pu is repressed in
exponential phase, when the bacterial cultures grow in rich-medium. However, in stationary
phase, Pu is activated. This phenomenon is called exponential silencing or stationary-phase
dependency (Cases et al., 1996).
Pu promoter seems to be subject to physiological control by several factors which are
the FtsH protein, the ppGpp alarmone, the TurA protein and PprA protein. More specifically,
FtsH is a protease needed to form the complex of XylR and ATP for the XylR activation,
therefore when is absent, the activation of XylR protein is impossible. The alarmone ppGpp
helps in the increase of the concentration of σ54-RNA polymerase in the cell, assisting σ54-
38

dependent promoters’ transcription. TurA protein is a repressor in the activity of Pu promoter
in suboptimal conditions, while PprA protein is a Pu activity repressor because it competes
for binding to DNA of Pu with the activator of Pu, the XylR protein (Moreno et al., 2010)
Another important protein activated upon presence of multiple substrates is Crc. This
protein is a global regulator of the TOL plasmid and as a result plays a key role in CCR when
rich medium is used. XylR, XylS and BenR translation is inhibited by this protein because it
hinders the activation of the translation complex of the xylR, xylS and benR genes which are
necessary structural genes of the TOL plasmid and chromosome (Moreno et al., 2010;
Moreno and Rojo, 2008b). The translation inhibition of XylS and XylR could lead to
repression or inhibition of the promoters which are up-regulated by these proteins i.e. Pu, Ps
and Pm.
2.2 Genetic networks representation
Genetic networks representation is essential towards understanding of gene regulatory
systems complexity and to explain how the network characteristics originated. Pazos et al.
(2003) presented a ‘global biodegradation network’, where the microbial hosts are not taken
into account and it is designed by the known chemical reactions which participate in
biodegradation. This process results in a united metabolic network, which has similar
properties to the ones which describe the metabolic network in a single organism. Moreover,
a ‘global biodegradation network’ representation can predict whether or not the
environmental pollutants can be biodegraded (Pieper et al., 2004)
For the characterization of specific networks three approaches are frequently used:
subgraphs, motifs and motif clusters (Barabási and Oltvai, 2004). According to Barabási and
Oltvai (2004) by knowing the bacterial genomes, a ‘parts list’ of a ‘cellular’ machine can be
generated. What is essential is the understanding of the genes and proteins function within a
39

microorganism, because even small changes in sequence can lead to major functional
differences and differences to the overall cell metabolism.
A connected subgraph is the representation of a nodes subset connected to each other
with a specific way in a wiring diagram. The amount of distinct subgraphs is in an
exponential relationship with the amount of nodes. The subgraphs in a complex network can
be triangles, squares, pentagons and so on. There are some subgraphs which are over-
represented in comparison to a more randomized version of the same network. These
subgraphs are called motifs. The motifs and subgraphs which take place in a network are
dependent on each other. In addition to that, motif clustering is a general characteristic of all
real networks (Barabási and Oltvai, 2004).
2.2.1 Principal motifs in biological systems
Motifs are the most common subgraphs which are used in the transcription-regulatory
networks. In Figure 5 the principal motifs which are found in biological systems are
presented. Silva-Rocha and de Lorenzo (2010) explained in detail the most common motifs
which are briefly presented below.
In the feedback loop the activity of the regulator is modulated by the final target of the
network. The negative feedback is a typical example of this motif and buffers the final output
of the biological system (Figure 5A). The negative feedback loop varies depending on the
type of interaction between the components. This loop could generate or participate in
different dynamic behaviours such as bistability, toggle switches or oscillations.
The feed-forward loop (FFL) is an over-represented motif in microorganisms such as
yeast and bacteria (Figure 5B). The FFLs consist of a master transcription factor (TF)
controlling a second TF and the final target gene is regulated by both TFs. These three
interactions are positive or negative leading to eight possible architectures which could be
40

positive or negative. However, only two can be applied in biological systems, the type-1
coherent (Figure 5C) and type-1 incoherent.
In type-1 coherent FFL X which is a master regulator is responsible for the direct and
indirect activation of the target Z. The second TF Y when it is activated its target in turn is Z
as well. The signals SX and SY trigger the activity of X and Y, respectively. An example of
type-1 coherent FFL is the ara operon since its expression depends on the regulating TFs
CRP and AraC. The SX and SY inducers are the cAMP and arabinose, respectively (Silva-
Rocha et al., 2011a).
Another biological motif is the bifan, which represents two TFs regulating the same
two targets (Figure 5D). The single-input module (SIM) is a motif of one TF regulating more
than one operon (Figure 5E). This TF is usually a master regulator for many genes of the
same pathway. Otherwise, the master regulator can trigger the response of many diverse
operons with different functions, e.g., the SOS system. The multiple-input module (MIM)
motif represents several different TFs regulating a group of operons/genes (Figure 5F). The
MIM is a single integration motif. The connection of two or even more layers of MIMs can
result in dense genes overlapping with each other (Silva-Rocha and de Lorenzo, 2010).
41
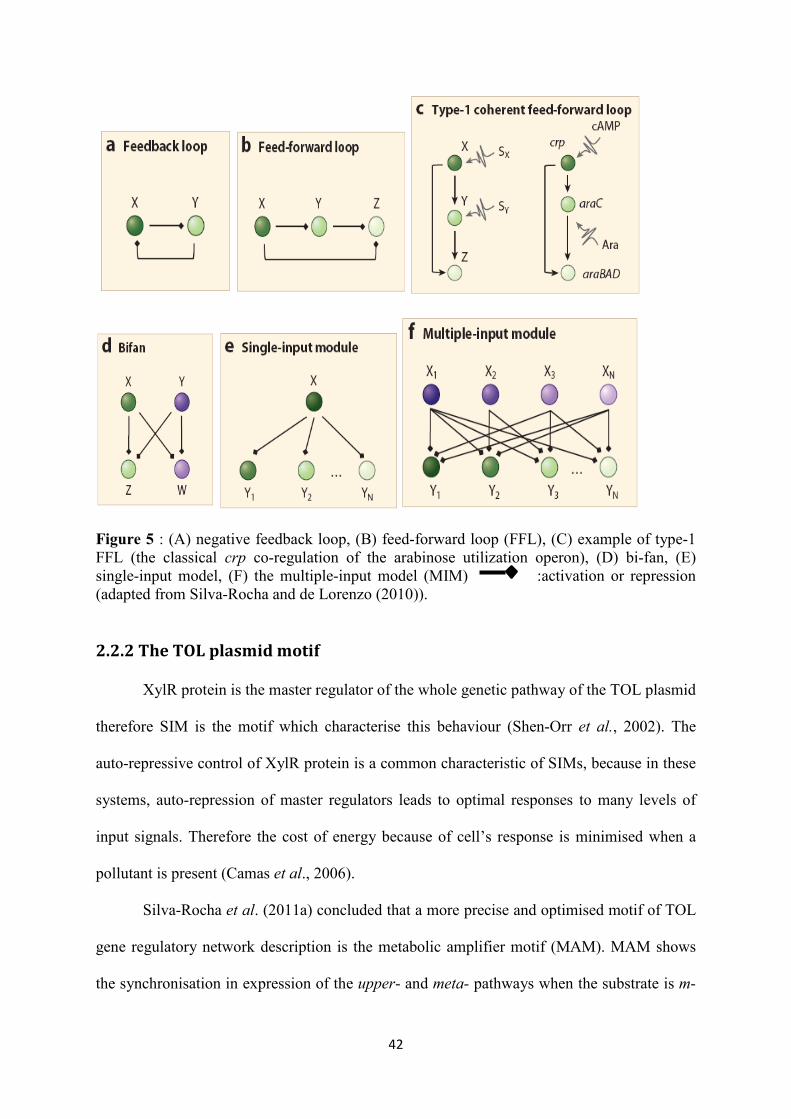
Figure 5 : (A) negative feedback loop, (B) feed-forward loop (FFL), (C) example of type-1 FFL (the classical crp co-regulation of the arabinose utilization operon), (D) bi-fan, (E) single-input model, (F) the multiple-input model (MIM) :activation or repression (adapted from Silva-Rocha and de Lorenzo (2010)).
2.2.2 The TOL plasmid motif
XylR protein is the master regulator of the whole genetic pathway of the TOL plasmid
therefore SIM is the motif which characterise this behaviour (Shen-Orr et al., 2002). The
auto-repressive control of XylR protein is a common characteristic of SIMs, because in these
systems, auto-repression of master regulators leads to optimal responses to many levels of
input signals. Therefore the cost of energy because of cell’s response is minimised when a
pollutant is present (Camas et al., 2006).
Silva-Rocha et al. (2011a) concluded that a more precise and optimised motif of TOL
gene regulatory network description is the metabolic amplifier motif (MAM). MAM shows
the synchronisation in expression of the upper- and meta- pathways when the substrate is m-
42

xylene. In addition to this, MAM can help in avoiding biochemical conflicts between the
pathways encoded by the plasmid and the pathways encoded by the chromosome of the
bacterium.
In Figure 6A, B there is a comparison between the type-1 coherent FFL and the
MAM. In MAM although Z continues to be indirectly regulated by the node X→Y, the X→Y
direct regulation includes a detour involving a metabolic action. Particularly, the master
regulator X is responsible for the activation of an enzyme production (or metabolic pathway)
W, converting the SX signal to SY. In the TOL regulatory system XylR is represented by X,
XylS by Y, while SX is the m-xylene which is converted to SY being m-methylbenzoate
when the upper pathway is activated (Silva-Rocha et al., 2011a) .
Figure 6: The inner logic of the TOL regulatory network. (A) a canonical type I coherent FFL), (B) Metabolic Amplifier Motif (MAM) found in the TOL network (adapted from Silva-Rocha et al. (2011a)).
2.2.3 Genetic circuit
Another efficient way of gene regulatory networks representation is genetic circuits
which consist of a combination of logic gates where, unlike electrical circuits, the signals are
transmitted between different molecular components resulting in the generation of an output,
which is usually gene expression. Genetic circuits are groups of elements which interact
producing a specific behaviour (Weiss, 2003). The design of genetic circuits offers the
43

possibility to focus on both modelling and experimentation to demonstrate the behaviour of
specific subsystems isolated from natural organisms. Genetic circuit design facilitates DNA
monitoring and microorganisms’ subsystems manipulation thus enabling genetically modified
engineering leading to a targeted behaviour. In order to be able to produce a specific cellular
behaviour, genetic circuit blocks have to be developed using:
i) DNA regions where RNA polymerase molecules bind enabling transcription initiation of
DNA into mRNA;
ii) DNA regions where mRNA transcription is terminated;
iii) mRNA sequences which enables rRNA binding and translation initiation into proteins;
iv) Proteins which acts as transcription factors regulating the activity and production of other
proteins;
v) Motifs which determines protein and mRNA stability.
A fundamental principle for genetic circuit design is to model the circuit function
prior to its synthesis in order to have quantitative predictions of circuit behaviour (McAdams
and Arkin, 1998; Weiss et al., 2003). However, the major difficulty is faced when
constructing genetic circuits from wild-type modules because they have already undergone
optimisation by nature and may malfunction or not function when connected artificially
(Andrianantoandro et al., 2006).
Various simulation tools can be used to predict the steady state and dynamic
behaviour of the designed genetic circuits. Three approaches have been employed for genetic
circuits design and optimisation to produce genetic circuits with targeted characteristics
(Feng et al., 2004). The first approach is the rational design of circuits which comprises both
modelling of genetic circuits and modification of their elements based on simulations (Weiss,
2001). The second approach is the random reconstructing of the connectivity of a genetic
network aiming to obtain different circuits with distinct logic functions (Guet et al., 2002).
44
The third approach involves cells genetic engineering to randomly mutate their own DNA
sequences, to yield the desired circuit properties, either in vivo (Yokobayashi et al., 2002) or
in silico (Francois and Hakim, 2004). However according to Weiss et al. (2003) the most
sufficient approach for genetic circuits optimisation is a combination of rational design with
specific genetically engineered cells characteristic and combinatorial synthesis.
2.2.3.1 Applications of genetic circuits
Genetic circuits design facilitates programming the behaviour of the entire population
by incorporating cell-cell communications, thus passing specific messages from one cell to
another (Basu et al., 2005; Basu et al., 2003; Basu et al., 2004; Yokobayashi et al., 2003).
You et al. (2004) proved that by coupling gene expression to cell growth and death
employing cell-cell communication, it enables dynamics programming of the whole
population regardless of the discrepancies in individual cells behaviour. Thus, it is possible to
program populations of genetically modified cells in order to accomplish tasks in a
predictable way. The design of artificial genetic circuits for cell-cell communications could
elucidate the function of their natural counterparts to adapt to various environmental
conditions in a robust and stable way.
Genetic circuits have also been used to detect small changes in transcriptional
kinetics, which cannot be detected in vivo and may significantly affect the phenotype.
Towards this direction, Karig and Weiss (2005) presented a detection method for weak
transcriptional responses using signal-amplifying genetic circuits. Furthermore, Basu et al.
(2003) proposed a genetic signal processing circuit to identify tuneable ranges of ligand
molecules chemical concentrations which can freely diffuse into the cell. The output of the
designed circuit can be combined with other genetic circuits and used to explore protein-
ligand interactions that impact on gene regulation and serve as a modular component for
45

different signal processing tasks (e.g. cell-cell communications, detection of chemical
gradients).
2.3 Modelling of gene regulatory networks
de Jong (2002) claimed that the incorporated detail in the description of a
mathematical model in a biological system is a function of several factors such as the
biological information which are available, the availability and feasibility of the experimental
data and the aim of the model. Various mathematical methodologies can help in
understanding the properties of biological systems such as: i) the structure of the system, ii)
the system dynamics, iii) methods to control the system, and iv) methods to design and
modify the system (Kitano, 2002).
A useful mathematical description of a gene regulatory network is the one based
on dynamic behaviour. One approach is the constraint-based reconstruction and analysis
(COBRA). COBRA is a modelling system which uses the information of stoichiometry for
transformations in biochemical level occurring in a target organism (Nogales et al., 2008a).
More specifically, COBRA can be used for the building and analysis of metabolic and
genome-scale reconstructions in silico for microorganisms such as archea (e.g.
Methanosarcina barkeri (Feist et al., 2006), bacteria (e.g. Escherichia coli (Feist et al.,
2007), Bacillus subtilis (Oh et al., 2007), Helicobacter pylori (Thiele et al., 2005),
Mycobacterium tuberculosis (Beste et al., 2007)) and eukarya (e.g. human (Duarte et al.,
2007)).
A mathematical matrix is constructed. This matrix is called S where S stands for the
stoichiometric elements, the network metabolites are represented by the rows of the matrix
while the reactions are represented by the columns. This approach was followed by Nogales
et al. (2008a) in P. putida for genome-scale reconstruction of P. putida KT2440. The name of
46

this genome-scale reconstruction is iJN746, where i is for in silico, JN are the constructor’s
initials and 746 is the number of the genes in the metabolic pathway. Another example of
constraint-based analysis is the flux balance analysis (FBA) of P.putida KT2440 presented by
Puchalka et al. (2008). FBA and reconstruction of the network can define the structure of the
metabolic network, identify the knowledge gaps, and pin-point the essential metabolic
functions, thus facilitating the gene annotations’ refinement. The name of this genome-scale
reconstruction is iJP815, where i stands for in silico, JP is the constructor’s initials and 815 is
the number of the genes in the metabolic pathway.
Karlebach and Shamir (2008) separated the models into logical, continuous and
single-molecule level. A commonly used logical model is Boolean networks where an entity
is able to have two different states: active (1) or inactive (0), such as a protein, which can be
activated when a specific substrate is induced or inactivated under other circumstances. The
Boolean formalisms are employed in case of P. putida and more specifically in describing the
TOL plasmid gene network by Silva-Rocha et al. (2011b). The authors presented the
regulatory network as Boolean network using the binary logic to describe the regulated
gene(s) and the regulatory activator(s) and repressor(s) functions.
A typical continuous model is the ordinary differential equations (ODEs) which can
describe even the instantaneous change in every entity as a function of the state of some
entities of the network. Hill and Michaelis-Menten functions are examples of use of ODEs in
description of gene networks. ODEs are used for cell cycle regulation in Caulobacter
crescentus by Li et al. (2008). Furthermore Yeo et al. (2013) used Hill functions to express
gene activity towards improvement of embryonic stem cells expansion in a perfusion
bioreactor. Koutinas et al. (2011) hybrid microbial growth kinetics model also utilises Hill
functions to describe gene expression of the P. putida TOL plasmid gene network and then
the gene expression was linked to substrate degradation and biomass growth patterns.
47

Flux balance analysis (FBA) is also a continuous model and it belongs to the COBRA
models. A single-molecule level model is the stochastic simulation algorithm developed by
Gillespie (Gillespie, 1976) which after using the initial number of molecules of some species,
such as mRNAs and proteins, as inputs and constants of reaction-probability, simulates the
system’s dynamics, reaction by reaction.
2.4 Microbial growth kinetics models
Microbial growth kinetics modelling is used to monitor the performance of a
bioprocess. The first kinetic principle for microbial growth was developed by Penfold and
Norris (1912) who stated that the relationship between the specific growth rate and the
substrate concentration is properly described by a ‘saturation’ curve where the maximum
biomass growth rate is achieved at high substrate concentration. The dominated utilised
model is the empirical and unstructured Monod (1942) (Eq. 1). Monod introduced the
concept of bacterial growth due to one growth-supporting substrate.
SKS
S += maxmm
(1)
Where μ is the specific biomass growth rate, μmax is the maximum specific biomass growth
rate, S is the substrate concentration, KS is the substrate saturation constant (which represents
the substrate concentration at half μmax). In this model, the growth rate depends on the
concentration of a single growth-supporting substrate through the parameters μmax and Ks.
The versatility of the Monod equation lies on its ability to describe substrate
consumption rates which follow zero- to first-order kinetics with respect to the concentration
of the biomass. Therefore, the Monod model describes the dependence of substrate
consumption rate on biomass growth.
48
Although the Monod model is based on Penfold and Norris (1912) principle,
discrepancies of the specific growth rate prediction are observed specially at low substrate
concentrations ((Kovarova-Kovara and Egli, 1998). These limitations of the Monod model
led to the development of numerous structured and unstructured kinetic models to describe
the ‘saturation’ hyperbolic curve of specific growth rate.
The majority of proposed growth models are unstructured. Three approaches were
used to develop the equations for growth kinetics of cell cultures:
(1) Description of physicochemical factors influence on Monod growth parameters (Gibson
et al., 1987; Kovarova et al., 1996; Ratkowsky et al., 1983).
(2) Addition of more parameters into the original Monod model to take into account substrate
or product inhibition, substrate diffusion, maintenance or effects of cell density on μmax
(Andrews, 1968; Boethling and Alexander, 1979; Contois, 1959; Dabes et al., 1973;
Mulchandani and Luong, 1989; Rittmann and McCarty, 1980; Schmidt et al., 1985b; Simkins
and Alexander, 1985; Tros et al., 1996).
(3) Proposal of different kinetic theories, which result in both empirical (Heijnen and
Romein, 1995; Tan et al., 1996) and mechanistic (Kooijman et al., 1991; Nielsen and
Villadsen, 1992) models.
2.4.1 Substrate inhibition growth kinetics models
When a substrate inhibits its own consumption, the Monod model cannot predict the
substrate utilisation pattern. Therefore, Monod-type models which provide parameters for
substrate inhibition (by incorporating the inhibition constant Ki) can be utilised to describe
the growth kinetics. Among the substrate inhibition models, the Andrew’s equation
(Andrews, 1968) (Eqs 5) is widely used.
49

iS K
SSK
S2max
++= mm
(5)
Some widely used models describing specific biomass growth are presented in Table 4
(adapted from Edwards (1970)). These models have extensively been used for phenolic waste
degradation such as phenol, p and o-cresol, because these compounds are excessively toxic
(Goudar et al., 2000; Maeda et al., 2005; Singh et al., 2008; Sokol, 1987; Tang and Liang-
Shih, 1987).
Table 4: Widely used models for substrate inhibition growth kinetics(adapted from Edwards (1970))
no Author Specific growth rate (μ)
1 Haldane
i
SS
i KKSK
KSS
S
+++= 2
maxmm
2 Webb
iS
S
KSKS
KSS
2
max 1
++
+
=m
m
3 Yano
+
++=
Si
S
KSK
SKS
S
1
2maxmm
4 Tessier-type
−−
−=
Si KS
KSS expexpmaxmm
50

2.4.2 Multiple substrates growth kinetics models
In nature, mixture of compounds are usually met. Mixtures can be ‘homologous’ or
‘heterologous’ which are compounds serving the same or different role, respectively, in the
cell as carbon and energy sources (Harder et al., 1982). Homologous substrates are most
common. The effects of homologous mixtures addition in microbial cultures can be positive
and negative. A positive effect in the biodegradation of multiple compounds is biomass
growth increase at low substrate concentrations (Klecka and Maier, 1988; McCarty et al.,
1994; Schmidt et al., 1985b) or production of all required degradative enzymes (Alvarez and
Vogel, 1991). However negative interactions are usually reported such as reduced
biodegradation rates due to competitive inhibition (Bielefeldt and Stensel, 1999; Chang et al.,
1993; Oh et al., 1994), and increased toxicity or toxic intermediates formation due to non-
specific enzyme actions (Bartels et al., 1984; Haigler et al., 1994; Klecka and Gibson, 1981).
Unlike the addition of homologous mixtures in the cultures, the heterologous concept
assumes simultaneous utilisation of substrates which affect specific growth rate (Okpokwasili
and Nweke, 2005), because these substrate are consumed by different metabolic pathways in
the cells. Heterologous mixtures utilisation leads to enhanced removal efficiencies as
compared to growth on individual compounds. This enhancement has been attributed to
higher growth rates and levels of biomass (Klecka and Maier, 1988).
Despite several proposed mathematical models of multiple homologous and
heterologous substrate consumption and microbial growth (Klecka and Maier, 1988;
Kompala et al., 1986; Lendenmann et al., 1996; Nikolajsen et al., 1991; Tsao and Hanson,
1975; Yoon et al., 1977) this body of literature is much smaller than that for the modelling of
single substrate growth kinetics. The most common models used for multiple substrates
degradation are presented below:
51

For heterologous mixtures a “Double Monod” model (Eq. 8) was proposed by
McGee et al. (1972) to describe the phenomenon of simultaneous substrates degradation.
22
2
11
1max SK
SSK
S++
= mm(8)
where 1 and 2 represent the different substrates of the mixture. But, this multiplicative model
has narrow range of utility (Bader, 1978; Bader, 1982). Therefore Mankad and Bungay
(1988) described specific growth rates under double substrate growth support in terms of
weighted average of rates under individual nutrient limitations (Eq. 9) to overcome this
limitation.
( ) ( )22
22
11
1
max
1SK
SWSK
SW+
++
=mm
(9)
where W (i) is the weight assigned to substrate i expressed as:
2
2
1
1
1
1
1
SK
SK
SK
W+
=
(10) 2
2
1
1
2
2
2
SK
SK
SK
W+
=
(11)
The substrates sequential utilisation in homologous mixtures where only one substrate
is growth supporting at a time could be caused due to catabolite inhibition or repression.
Growth on homologous substrates is commonly described by a model in which the specific
growth rate, μ, is the sum of the specific growth rates on each effector. The simplest model to
describe this, the sum kinetics model, assumes that the presence of one substrate does not
affect the manner in which additional substrates are consumed and uses Monod equation for
each specific growth rate, μi. The form of this model for growth on two substrates is:
22
22max,
11
11max,21 ),(
SKS
SKS
SS+
++
=mm
m(12)
52

Furthermore for homologous mixtures sum kinetic models incorporating purely
competitive, uncompetitive and non-competitive enzyme kinetics have been proposed and
presented below.
2.4.2.1 Sum kinetics with competitive enzymatic interactions model
A sum kinetics model incorporating purely competitive substrate kinetics was
developed by Yoon et al. (1977) as:
( )1
2
122
22max,
21
211
11max,21 ,
SKKSK
S
SKKSK
SSS
+++
++=
mmm
(13)
The coefficients of Eq.13 suggest that each substrate exhibits a competitive inhibition impact
on the consumption of the other substrate. The model describes a competitive inhibition
impact of one substrate on another, perfectly substitutable and it can be utilised to describe
simultaneous and sequential substrate degradation of mixtures.
2.4.2.2 Sum Kinetics with non-competitive enzymatic interactions model
The non-competitive substrates interaction is characterised by the formation of a
complex between both substrates and the catabolic enzyme, which is non-reactive (Segel,
1975). The specific growth rate is described in Eq.14
( ) ( )
++
+
++
=
1,
122,
22max,
2,
211,
11max,
11S
SS
S KSSK
S
KSSK
S mmm
(14)
53
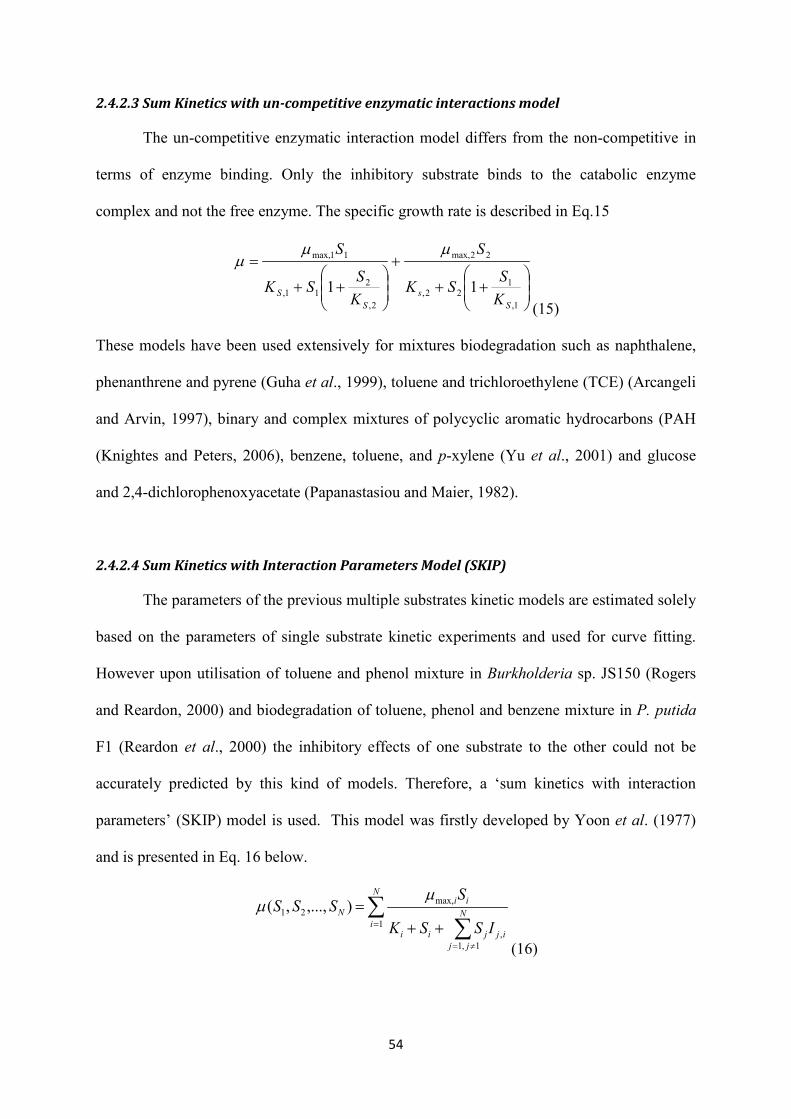
2.4.2.3 Sum Kinetics with un-competitive enzymatic interactions model
The un-competitive enzymatic interaction model differs from the non-competitive in
terms of enzyme binding. Only the inhibitory substrate binds to the catabolic enzyme
complex and not the free enzyme. The specific growth rate is described in Eq.15
++
+
++
=
1,
122,
22max,
2,
211,
11max,
11S
sS
S KSSK
S
KSSK
S mmm
(15)
These models have been used extensively for mixtures biodegradation such as naphthalene,
phenanthrene and pyrene (Guha et al., 1999), toluene and trichloroethylene (TCE) (Arcangeli
and Arvin, 1997), binary and complex mixtures of polycyclic aromatic hydrocarbons (PAH
(Knightes and Peters, 2006), benzene, toluene, and p-xylene (Yu et al., 2001) and glucose
and 2,4-dichlorophenoxyacetate (Papanastasiou and Maier, 1982).
2.4.2.4 Sum Kinetics with Interaction Parameters Model (SKIP)
The parameters of the previous multiple substrates kinetic models are estimated solely
based on the parameters of single substrate kinetic experiments and used for curve fitting.
However upon utilisation of toluene and phenol mixture in Burkholderia sp. JS150 (Rogers
and Reardon, 2000) and biodegradation of toluene, phenol and benzene mixture in P. putida
F1 (Reardon et al., 2000) the inhibitory effects of one substrate to the other could not be
accurately predicted by this kind of models. Therefore, a ‘sum kinetics with interaction
parameters’ (SKIP) model is used. This model was firstly developed by Yoon et al. (1977)
and is presented in Eq. 16 below.
∑∑=
≠=
++=
N
iN
jjijjii
iiN
ISSK
SSSS
1
1,1,
max,21 ),...,,(
mm
(16)
54
In this model, the impact of one substrate on the degradation pattern of another is given by
the SjIj,i terms. The values of the interaction coefficients, Ij,i, describe the degree of inhibition
exerted by substrate j to substrate i. In a two-substrate system, sequential substrate utilisation
is expressed by a large value of I1,2 and a small value of I2,1. Simultaneous degradation is
suggested by interaction parameter values of similar magnitude. In general, the greater the
inhibitory effect of one substrate on another, the greater the interaction parameter value.
2.4.2.5 Structured multiple substrates microbial growth kinetics models
The first structured model accounting for sequential substrate degradation was
proposed by Van Dedem and Moo-Young (1975) who assumed that a key enzyme(s) was
responsible for controlling the substrate assimilation. Following this approach a cybernetic
perspective has been developed by Ramkrishna (1982) to approach the complexity of cell
metabolism and describe microbial growth. This approach assumes that by controlling
enzyme synthesis and activity, better control is achieved on the metabolic pathways
responsible for substrate mineralisation and biomass growth. This model assumes a priori
that the enzyme synthesis which controls biodegradation of the preferred substrate is constant
whereas that of the less favourable substrate starts upon induction with the substrates they act
on.
A cybernetic variable controls the enzyme according to the matching law (Herrnstein,
1974), in which the optimal resources allocation for substrate consumption is proportional to
the amount of returns obtained from that substrate. These models have been further
developed to account for sequential and simultaneous substrates mineralisation (Doshi et al.,
1997; Narang et al., 1997). Furthermore they characterise the microorganism of the
bioprocess as an ‘optimal strategist’, which chooses which substrate will be firstly consumed
in order to maximize the possibility of survival and propagation of its own species. The
55

cybernetic models have been successfully applied for growth and substrate assimilation
patterns prediction of E. coli (Doshi et al., 1997; Doshi and Venkatesh, 1998; Lendenmann
and Egli, 1998; Narang et al., 1997; Ramakrishna et al., 1997; Venkatesh et al., 1997),
Lactobacillus rhamnosus (Bajpai-Dikshit et al., 2003), and Chelatobacter heintzii (Bally and
Egli, 1996).
2.5 Conclusion
The TOL upper, meta and chromosomal ortho-cleavage pathways are activated upon
BTEX compounds degradation, such as m-xylene and toluene, in P. putida mt-2 cell cultures.
The promoters of these pathways are the controllers of the effectors biotransformation to
biomass. A graphical representation of these gene regulatory networks in motifs or genetic
circuits underlines the interactions between the promoters and their transcription factors. The
properties of gene networks could be described by applying mathematical models which
result in the reduction of trial-and-error experimentation.
P. putida mt-2 is a microorganism of great biotechnological potential due to its
metabolic versatility. Monitoring of the performance of substrate utilisation and/or
biomass/product formation could lead to optimal biotechnological processes. Microbial
growth kinetics models, such as the Monod or Andrews’s, are used to predict these patterns
upon induction with a single substrate. But these models are empirical and unstructured
leading to inaccurate bio-performance prediction.
In lab-scale experiments usually one substrate kinetics are studied. However, in nature
it is extremely rare for bacteria to come across with a single substrate as a carbon and/or
energy source. The existence of multiple substrates results in different metabolic responses of
P. putida mt-2 activating CCR. Moreover multiple substrates use could increase the aromatic
pollutants degradation rate or the productivity in a bioprocess. The usual multiple substrates
56
microbial growth kinetics models, such as double Monod and sum kinetics with enzymatic
interactions, similarly to one substrate, are macroscopic. These models completely ignore
transcriptional regulation, molecular interactions and cell metabolism.
Structured modelling takes into consideration cell metabolism. A structured modelling
approach often used is the cybernetic models. But the structured models are based on steady
state culture conditions ignoring the upstream dynamic behaviour.
The importance of transcriptional regulation of specific pathways activated upon entry
of one substrate has been mentioned in the study of Gunsch et al. (2007), whereas Douma et
al. (2010) demonstrated how gene expression improves microbial growth kinetics prediction
of product formation. Koutinas et al. (2011) built a transcriptional regulation model of the
TOL plasmid metabolic pathway contained in P. putida mt-2 cells. Based on this model they
managed to adequately predict one substrate degradation and biomass growth patterns under
a broad range of initial conditions. But transcriptional regulation modelling upon induction
with double substrate and connection to microbial growth kinetics hasn’t been explored yet.
Towards this direction in the present thesis the transcriptional kinetics of P. putida
mt-2 is presented under different initial conditions, the transcriptional regulation is modelled
and one and double substrate microbial growth kinetics models are successfully developed
and assessed. The ultimate goal and the objectives of the current project are presented below.
2.6 Thesis aim
The ultimate goal of this project is to develop a novel combined transcriptional
regulation-growth kinetic model using double substrate in Pseudomonas putida mt-2 cell
cultures. M-xylene and toluene is the model mixture. Induction with the mixture activates the
TOL plasmid and ortho-cleavage regulatory networks of the specific strain. In order to
achieve our goal more insight of the catabolic pathways transcriptional regulation is
necessary, therefore the following specific objectives are explored:
57

2.6.1 Objectives
In the present thesis the objectives are to:
1. Optimise the microbial cultivation method in order to assure that the targeted pathways of
P. putida mt-2 cultures are solely activated by the induced aromatic pollutant(s). During this
process co-existence of succinate traces and toluene in the specific strain cultures is studied.
Therefore the CCR effect of very low succinate amounts on toluene induced TOL and ortho-
cleavage pathways upon supplementation with M9 minimal salts medium in batch cultures is
tested. Whether M9 is a medium affecting repression and if the amount of succinate added is
a factor of repression or not is clarified. (Chapter 4)
2. Explore the transcriptional kinetics of TOL Pr, Ps, Pu, Pm and ortho- PbenR and PbenA
upon induction of P. putida mt-2 cultures with toluene until effector’s depletion. Different
introductory toluene concentrations are tested in order to understand the impact of toluene in
transcriptional activity. In parallel, toluene utilisation and biomass formation patterns are
recorded until toluene depletion. (Chapter 5)
3. Further develop and up-grade the Koutinas et al. (2011) gene regulation dynamic model in
P. putida mt-2 for one substrate in order to take into account the chromosomal ortho-cleavage
activity. The new transcriptional regulation model results in a new hybrid-growth kinetic
model. Model analysis follows and the predictive capability of the model is proven. (Chapter
6)
4. Study and explore the transcriptional kinetics of TOL Pr, Ps, Pu, Pm and ortho- PbenR
and PbenA upon simultaneous induction with TOL effectors m-xylene and toluene. Different
concentrations of the inducers are added in the bacterial cultures to record promoters’
58

stimulation in a broad range of conditions. Based on double substrate transcriptional kinetics
and on the hybrid microbial growth kinetics model, a double substrate microbial growth
kinetic model is developed. The model is analysed and the parameters are experimentally
estimated. (Chapter 7)
59
Chapter 3 3. Materials and Methods
The materials and methods used in the present project are explained below.
3.1 Microbial Cultures
In Chapter 4, subcultures of P. putida mt-2 (c) were pre-grown for 26h at 30oC in M9
minimal salts medium (Sambrook et al., 1989) supplemented with 15mM of succinate. In the
end of 26h, three independent cultures were prepared by diluting the overnight culture in
minimal medium to an initial optical density of 0.1 at 600 nm (UV-2101PC, Shimadzu, UK),
for every condition tested. The minimal medium was supplemented with toluene at a different
concentration level in each experiment. Another culture without toluene addition was used as
a control. Cultures were performed using conical Erlenmeyer flasks with 2.35 L total volume
(0.4 L culture volume), which were continuously stirred at 1000 rpm via a Heidolph
MR3001K (Heidolph, UK) magnetic stirrer. The flasks were filled with medium to one-sixth
of their volume, to ensure that sufficient oxygen is available, and closed gas-tight with Teflon
coated lids to avoid volatile organic compound losses. Temperature was maintained constant
at 30 oC. All chemicals used were obtained from Sigma-Aldrich Company Ltd and were of
ANALAR grade.
Following optimisation of this experimental technique, in Chapter 5, subcultures of P.
putida mt-2 (c) were pre-grown for 23 h at 30 oC in M9 minimal medium supplemented with
10 mM of succinate. The conditions were optimised to assure that succinate is depleted as
soon as the bacterial cultures are induced with the aromatic pollutant(s). The minimal
medium was supplemented with toluene at a different concentration level in each experiment.
60

In Chapter 6 the optimised microbial cultivation technique was used. Two cultures
were prepared by diluting the overnight culture. The minimal medium was supplemented
with m-xylene and toluene to varying concentration levels.
3.2 Substrate and Biomass Analyses
Gas Chromatograph (GC) analysis was employed for determination of toluene
concentration in the gaseous and aqueous samples using an Agilent 6850 Series II Gas
Chromatograph with a FID detector and a ‘J&W Scientific’ (Agilent Technologies UK
Limited, UK) column with HP-1 stationary phase (30 m × 0.32 mm × 0.25 mm). Gaseous
samples of 25 μL were injected into the GC and the temperature program run at 70 oC for 3
min and then increased to 80 oC at a rate of 5 oC min-1. Biomedium toluene concentration was
determined experimentally as previously described (Koutinas et al., 2010). The coefficient of
variation for 4 samples was 4.6 % at a concentration level of 0.2 mM toluene. Biomass
concentration was determined by absorbance at 600 nm on a UV-1800 scanning
spectrophotometer (Shimadzu, UK) interpolating from a previously established dry weight
calibration curve. The coefficient of variation for 3 samples was 3.4 % at a concentration
level of 1233 mgbiomass L-1.
Gas chromatography-mass spectrometry (GC-MS) analysis was employed for
succinate concentration determination. Culture samples of 3 to 4.5ml (depending on cell
density which should be <109cells/sample) were diluted on methanol based on the
methanol/water protocol described in (Kanani and Klapa, 2007), supplemented with 75μg
ribitol and150μg [U–13C] glucose added as internal standards. The extracts were derivatised
to their (MeOx) TMS-derivatives through reaction with 200μL of 20mg/mL methoxyamine
hydro-chloride solution in pyridine for 90min, followed by reaction with 400μL N-methyl-
trimethylsilyl-trifluoroacetamide (MSTFA) for at least 6h at room temperature, as justified in
61

(Kanani et al., 2008; Kanani and Klapa, 2007). Succinate concentration was determined
interpolating from a previously established calibration curve. Each sample was measured at
least twice, using a GC-MS single quadrapole, QP2010 ultra (Shimadzu, UK).
3.3 Preparation and isolation of total RNA, cDNA synthesis, quantitative
real-time PCR and gradient PCR
Culture samples of 3 to 4.5 ml (depending on cell density) were placed in cryogenic
vials (Sigma-Aldrich Company Ltd, UK) and cell pellet was harvested by centrifugation at
15000 rpm for 10 min at 4oC. The supernatant was discarded and the vials were immersed in
liquid nitrogen for 1 min and stored at - 80°C until use. Quantitative Real-Time Polymerase
Chain Reaction (Q-RT-PCR) was performed to determine the expression of xylR (Pr
promoter), xylS (Ps promoter), xylU (Pu promoter), xylX (Pm promoter) and rpoN
(housekeeping) genes during the course of the experiments. The Q-PCR method as well as
the calculation of the relative mRNA expression based on threshold cycle (CT) values was
conducted as previously described (Koutinas et al., 2011; Koutinas et al., 2010). Q-PCR
analysis of promoters’ kinetics was conducted in triplicate measurements for each time point.
Gradient PCR was performed to select the best primer pair for PbenR and PbenA promoters
(primers listed on Table 1) and the best cDNA annealing temperature for amplification. The
method for isolation of total RNA and cDNA synthesis has been previously described by
(Koutinas et al., 2010). The PCR reaction was carried out in an Eppendorf thermocycler
(Fisher Scientific, UK). The denaturation temperature was set at 95 oC for 3 min, followed by
of 95 oC (20 s). In the next step different annealing temperatures were employed in each
column of the thermocycler. The annealing temperatures ranged from 50 to 65 oC for 30 s,
and 72 oC for 30s. This temperature range was tested in order to detect the temperature at
which the primers anneal to the single-stranded DNA fragments. The amplification last for 50
62

cycles. The best annealing temperature for PbenR and PbenA promoters was 60 and 66 oC,
respectively.
Table 5: Primers used in quantitative real time-PCR. Pair of primers Description Source
xylR 5’-AACTGTTTGGTGTCGATAAGG-3’ (Koutinas et al., 2011) 3’-ATCACCTCATCAAGAAAGATGG-5’ (Koutinas et al., 2011)
xylS 5’-GGATTAGAGACCTGTTATCATCTG-3’ (Koutinas et al., 2011) 3’-GATTGAGCAGCAATAGTTCG-5’ (Koutinas et al., 2011)
xylU 5’-GCAGTTATCGGCTTCATCTC-3’ (Koutinas et al., 2011) 3’-CATATAGTCGGTTGAGGTTAGC-5’ (Koutinas et al., 2011)
xylX 5’-TGAAGAAGATGAGAACGAGG-3’ (Koutinas et al., 2011) 3’-AGATAAATCCAGTTGCCCTC-5’ (Koutinas et al., 2011)
benR 5’-TCATTACCGGCTGGATGAGC-3’ This study 3’-CTGGCGACAATCTGGCTGTA-5’ This study
benA 5’-CTCGAGGACGACCGTGAAAA3’ This study 5’CAGTTTGCCGCTGTTGTTGA-3’ This study
rpoN 5’-TAACGAAACCCTGATGAAGG-3’ (Koutinas et al., 2011) 3’-AATGTCATGCAGTACCAACG-5’ (Koutinas et al., 2011)
3.4 Gel electrophoresis
Gel electrophoresis was conducted for the PCR products to identify which pair of
primers (Table 5) for the benR (PbenR promoter) and benABCD (PbenA promoter) genes
was capable of elongating the DNA synthesized. The sequence of benR constitutes
approximately of 1200 Kbp. Thus, a mixture of 1% agarose (BD) in 1×TE buffer (Ambion,
UK) supplemented with EtBr (15μl/250ml) was prepared.
3.5 Statistical analysis
One way ANOVA (SigmaStat version 3.5, Systat Software UK Ltd, UK) was
conducted for elucidation of the relative mRNA expression profiles of all promoters. P-values
were calculated through comparison of the mean relative mRNA expression between two
given time points of the three independent cultures performed. The P-value is a statistic
function of the experimental data that is used in order to test a null hypothesis (i.e. the results
63
at each time point are equal). The level of significance was accepted at P-values lower than
0.05. If the null hypothesis is true, then P-value>0.05, otherwise P-value<0.05.
At each toluene concentration level, three independent experiments were performed.
For each experiment at every time point, promoters’ expression was measured in triplicates.
For each promoter, the average expression and standard deviation was calculated. The error
bars derived by dividing the standard deviation with the square root of nine because the
promoter expression at each time point was coming from three experiments x three RT-PCR
measurements.
3.6 Model Analysis
Model simulations and parameter estimation experiments were implemented in the
process modelling environment gPROMS® (Process Systems Enterprise, 2014) and were
computed on an Intel Core i7-2600 PC with 8GB RAM running Windows 7.
3.6.1 Global Sensitivity Analysis
Global Sensitivity Analysis (GSA) identifies the most significant model parameters
and initialises parameter estimation. The variables of the model are: Pr, Ps, Pu, and Pm,
PbenR, PbenA and substrate(s), biomass. It was examined how and if the behaviour of these
variables will ‘sense’ a simultaneous change of all the parameters of the model(s). Nominal
values from the Koutinas et al. (2011) model initialised GSA. For the nominal BenR
synthesis parameters of the ortho–cleavage regulatory network the Koutinas et al. (2011)
values of XylS synthesis was used; the nominal PbenR and PbenA expression was set to
nominal Pm values since PbenR and PbenA are regulated by BenR analogously to Pm by
XylS. Transition parameters kxylRa and kBenRa were obtained by trial and error (nominal value:
10). Random-sampling high dimensional model representation was used for GSA (Li et al.,
64

2003); the method was implemented in Matlab and connected to gPROMS via goMATLAB.
Parameter importance was calculated using sensitivity indices (SI) ranging from 0 (low
significance) to 1 (high significance); it is assumed that SIs higher than 0.1 are significant
(Sidoli et al., 2005).
In one substrate model, the random samples used were 50000 and the nominal values
were ranged ±20%. The time intervals examined were selected before and after the 60 and 90
min where the different behaviour of the promoters Ps, Pu and PbenR (see below) was
observed and at a later time point. Specifically these time points were 50, 70, 100 and 400
min.
In the double substrate model, the random samples used were 5000 and the nominal
values were ranged ±10%. The time intervals examined were selected before and after the
120 and 420min where the different behaviour of the promoters was observed. Specifically
these time points were 70, 100, 130, 180, 350, 430min.
3.6.2 Parameter estimation in gPROMS
Parameter estimation in gPROMS is based on the Maximum Likelihood formulation
which provides simultaneous estimation of parameters in both the physical model of the
process as well as the variance model of the measuring instruments. gPROMS attempts to
determine values for the uncertain physical and variance model parameters, θ, that maximise
the probability that the mathematical model will predict the measurement values obtained
from the experiments. Assuming independent, normally distributed measurement errors, eijk,
with zero means and standard deviations, σijk, this maximum likelihood goal can be captured
through the following objective function:
( )
−
+ΣΣΣ+Ν
=Φ=== 2
2_
2
111
)()ln(min
212ln
2 ihk
ijkijk
ihk
NMij
k
NVi
j
NE
i
zzσ
σπ θ
65
where N stands for total number of measurements taken during all the experiments, θ is the
set of model parameters to be estimated, NE is the number of experiments performed, NVi is
the number of variables measured in the ith experiment and NMij is the number of
measurements of the jth variable in the ith experiment. The variance of the kth measurement
of variable j in experiment i is denoted as σijk2, while zijk is the kth measured value of variable
j in experiment i and zijk is the kth (model-) predicted value of variable j in experiment i. The
above formulation can be reduced to a recursive least squares parameter estimation if no
variance model for the sensor is selected. Following GSA, the parameters are estimated in
gPROMS. The most important parameters as suggested by the GSA method vary ±20% from
the nominal values. The constant variance of the experimental results at each time point was
set to 0.1.
3.6.3 Statistical analysis between model(s) simulations and experimental
results
The R2 correlation calculated the goodness of fit for the experimentally determined
promoter activity, toluene utilisation and biomass formation patterns; R2 represents the
percent of the predicted data approximated by the experimental results. The promoters are
elements of a complex transcriptional regulatory network whose activation, upon an
environmental signal, triggers a cascade of regulatory and metabolic events. Therefore, a
more precise estimation about the goodness of fit of the genetic circuit model was given by
evaluated the correlation of determination (R2) as a vector of the six promoters at each time
point due to the dependence of the expression of each promoter on the previous one and its
transcription factors. For example at the time point 30 min the R2 was evaluated between the
experimental and predicted expression of Pr, Ps, Pu, Pm, PbenR and PbenA.
66

Chapter 4
4. Double substrate utilisation by Pseudomonas putida mt-2: Succinate
traces impact on toluene induced TOL and ortho-cleavage pathways
During the process of optimising the method of microbial cultivation, it was realised that the
experimental conditions are adequate for investigating BTEX degradation. Therefore, the P.
putida mt-2 cultures with succinate traces were induced with different toluene concentrations
in an attempt to examine the CCR effect. The transcriptional kinetics of TOL plasmid Pu,
Pm and chromosomal ortho-cleavage PbenA catabolic promoters upon exposure to a mixture
of just 0.25mM succinate and various toluene concentrations in batch cultures supplemented
with M9 minimal salts medium was studied. Moreover the ortho-cleavage PbenR kinetics
was monitored under similar conditions. PbenR controls the activation of the key for the
biosystem BenR protein which up-regulates both TOL Pm and ortho-cleavage PbenA. The
biomass growth was diauxic and cells preferentially consumed succinate. It was demonstrated
that Pu, Pm, PbenA catabolic promoters and PbenR are subject to carbon catabolite
repression (CCR) and succinate presence always represses expression of these promoters
regardless of the growth conditions. Upon cells exposure to the mixture Pu, Pm and PbenA
undergo a bi-modal expression pattern being repressed due to succinate presence and
activated to higher levels upon following exposure to toluene. Ortho-cleavage PbenA follows
a similar to TOL promoters’ expression pattern suggesting co-up-regulation by a TOL
transcription factor. PbenR is not expressed and a clear down-regulation was observed for the
mixtures containing 0.4 and 1mM toluene; succinate depletion results in PbenR activation.
BenR auto-regulation is possible. Furthermore in the mixtures containing 1mM toluene,
67

following succinate depletion, Pm undergoes oscillations demonstrating a novel regulatory
function of the specific promoter.
4.1 Introduction
Bacterial cells activate global regulatory responses upon availability of multiple carbon
sources resulting in co-metabolism or selective catabolism of the more readily degradable
compound and repression of catabolic genes involved in the other(s) compound(s) up-take
and assimilation (Rojo, 2010). The latter response is called carbon catabolite repression
(CCR). The sequential hierarchy of preferred compounds in Pseudomonas is (1) organic and
amino acids, (2) glucose and (3) hydrocarbons including aromatic compounds (Hester et al.,
2000; Morales et al., 2004; Moreno et al., 2009a). The metabolic versatility of P. putida mt-2
strain, which harbours the TOL plasmid, facilitates CCR.
The TOL regulatory network is able to efficiently degrade aromatics such as m-, p-
xylene and toluene (Duetz et al., 1994). Toluene entry in P. putida mt-2, leads to benzoate
formation, through the catalytic activity of the upper enzymes, inducing ortho-cleavage
pathway of chromosome. PbenR promoter of ortho-cleavage regulatory network controls
benR gene which encodes for BenR protein. This protein up-regulates TOL Pm and ortho-
cleavage PbenA promoters resulting in an interconnection of the two pathways (Cowles et al.,
2000). TOL upper, meta and ortho-cleavage ben operons encodes for the enzymes which
catalyse toluene catabolism to Krebs cycle intermediates. In Figure 7 the enzymes activity
(A), biochemical (B) and logic (C) representation of the biosystem is presented. Monitoring
the transcriptional activity of the relevant controlling promoters Pu, Pm and PbenA provides
insight of the catabolic process considering the significance of accounting of transcriptional
regulation in biodegradation. BenR plays a key role connecting the two pathways rendering
PbenR expression recording necessary.
68

The CCR effect on TOL promoters has extensively been studied upon glucose
presence. Glucose clearly inhibits Pu and Pm expression (Aranda-Olmedo et al., 2005; Holtel
et al., 1994; Hugouvieux-Cotte-Pattat et al., 1990) regardless of the growth conditions. But
CCR on TOL and ortho-cleavage pathways due to organic acids presence such as succinate
has not been fully demonstrated yet. CCR impact is evident in continuous cultures regardless
of the medium used (Aranda-Olmedo et al., 2006; Duetz et al., 1994; Duetz et al., 1996;
Duetz et al., 1997). But in batch cultures it seems that the effect of succinate presence
depends on medium content. Batch succinate cultures with complete medium result in TOL
upper and meta operons (Moreno et al., 2010) and ortho-cleavage benR and benA (Morales et
al., 2004) genes repression. Under similar conditions BenR protein is strongly repressed
(Moreno and Rojo, 2008a). Upon supply with M9 medium in batch cultures, Holtel et al.
(1994) compared each TOL promoter expression induced with succinate to the relevant
expression upon glucose entry, by measuring the corresponding enzyme activity. They
suggested that the combination of 10mM succinate and M9 medium in batch cultures absorbs
CCR effect on TOL regulatory network. But no TOL inducer control culture was used to
ensure that succinate is not a repressory compound for TOL. In M9 batch cultures of P.
putida KT2440, the wild-type strain of mt-2, succinate is referred to as non-repressing
(Moreno et al., 2012), however Rojo and Dinamarca (2004) reported the inhibitory effect of
excessive succinate levels. Under every condition of all relevant literature the induced
succinate concentration exceeds 10min
In this chapter, the impact of succinate traces on TOL and ortho-cleavage regulatory
networks by monitoring the transcriptional kinetics of Pu, Pm, PbenR and PbenA was
studied. Continuous (every 30min) Q-RT-PCR measurements were taken upon exposure to
just 0.25mM (40 times less than commonly used) succinate combined with various toluene
concentrations (0.4, 0.7, 1mM) until both substrates depletion in batch cultures supplemented
69

with the controversial M9 minimal salts medium. Furthermore, succinate and toluene
consumption and biomass growth are measured. A diauxic biomass growth pattern was
observed. The cells preferentially consume succinate compared to toluene. Succinate
presence, although in traces, repressed Pu, Pm and PbenA expression and inhibited PbenR
activation.
Figure 7: Interlink of the chromosomal and TOL genetic networks upon toluene entry. The overimposed regulation of the promoters is additionally presented. (A) The upper operon encoded enzymes sequentially transform toluene into benzoate which is metabolised into Krebs cycle precursors through the enzymatic steps produced by the meta and ben operons. (B) The biochemical and (C) logic representations of the two pathways. :inactive form of XylR (XylRi); : active form of XylR (XylRa); : inactive form of XylS (XylSi); : active form of XylS (XylSa); : inactive form of BenR (BenRi); : active form of BenR (BenRa); : input; : output; : AND; : OR; : NOT.
70
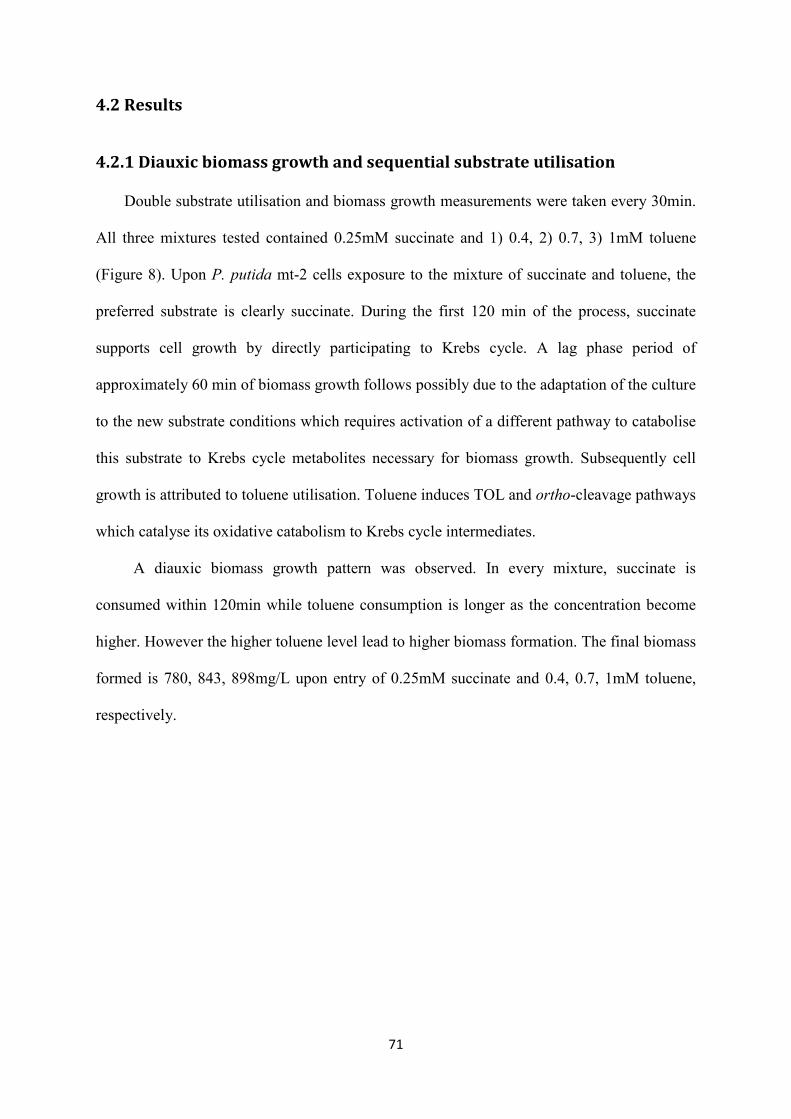
4.2 Results
4.2.1 Diauxic biomass growth and sequential substrate utilisation
Double substrate utilisation and biomass growth measurements were taken every 30min.
All three mixtures tested contained 0.25mM succinate and 1) 0.4, 2) 0.7, 3) 1mM toluene
(Figure 8). Upon P. putida mt-2 cells exposure to the mixture of succinate and toluene, the
preferred substrate is clearly succinate. During the first 120 min of the process, succinate
supports cell growth by directly participating to Krebs cycle. A lag phase period of
approximately 60 min of biomass growth follows possibly due to the adaptation of the culture
to the new substrate conditions which requires activation of a different pathway to catabolise
this substrate to Krebs cycle metabolites necessary for biomass growth. Subsequently cell
growth is attributed to toluene utilisation. Toluene induces TOL and ortho-cleavage pathways
which catalyse its oxidative catabolism to Krebs cycle intermediates.
A diauxic biomass growth pattern was observed. In every mixture, succinate is
consumed within 120min while toluene consumption is longer as the concentration become
higher. However the higher toluene level lead to higher biomass formation. The final biomass
formed is 780, 843, 898mg/L upon entry of 0.25mM succinate and 0.4, 0.7, 1mM toluene,
respectively.
71

4.2.2 TOL catabolic Pu, Pm and ortho-cleavage PbenR, PbenA transcriptional
kinetics
4.2.2.1 Pu promoter
A
C
B
72
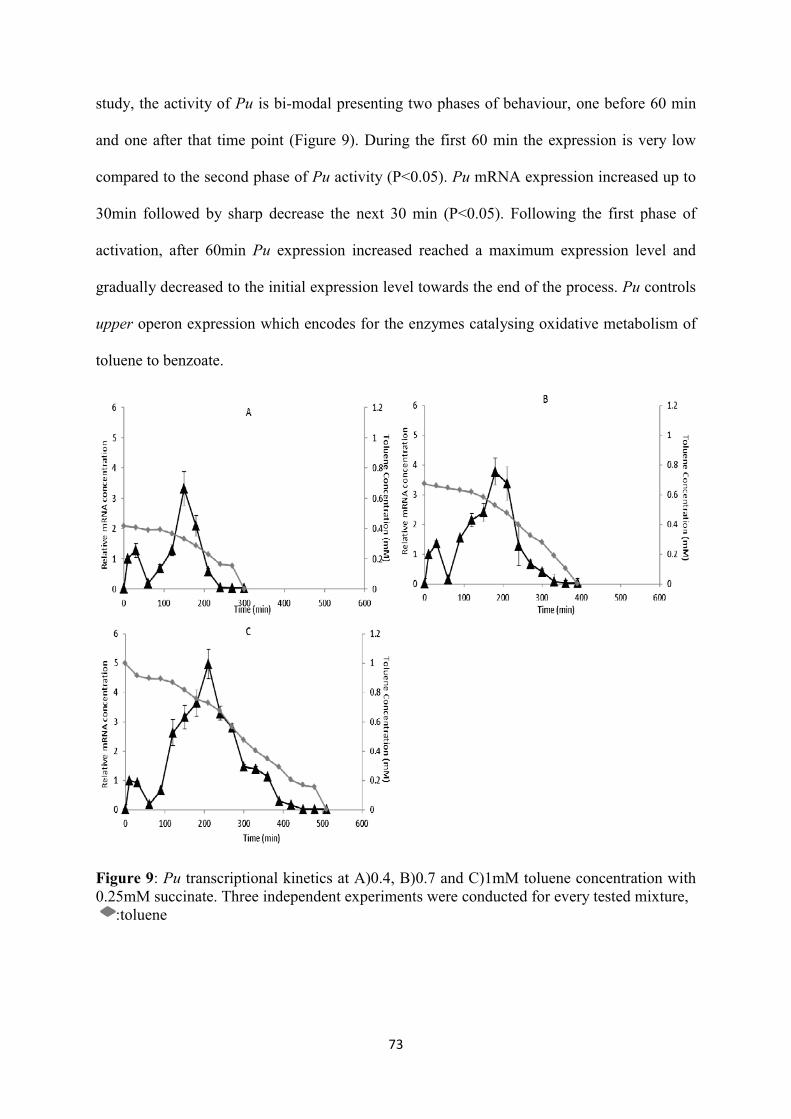
73

4.2.2.2 PbenR promoter
74

4.2.2.3 Pm promoter
Benzoate formation results in both XylS protein activation by oligomerisation and BenR
activation which in turn trigger Pm expression. The activation of Pm is facilitated by RNA
polymerase with σ32 or σ38 factors depending on the growth phase (Marques et al., 1999). In
the mixtures containing lower toluene concentrations (0.4, 0.7mM) the expression pattern of
Pm is similar to Pu establishing 60min as the switch point of expression pattern (Figure 11).
Pm activation follows Pu activation on TOL pathway which is up-regulated by TOL master
regulator XylR. In the mixture containing similar succinate concentration and the higher
toluene concentration (1mM) although the expression pattern of Pu and Pm was similar the
switch expression pattern time point is 90min. During this period down-regulation of PbenR
was observed which lead to low levels of BenR production. Therefore at mixtures containing
higher than 1mM toluene BenR repression strongly affects Pm activation. Moreover in
concentration level of 1mM following the 90min an oscillatory behaviour of the promoter
was observed. Pm expression remains high until the late exponential phase probably due to
the activity of the meta operon which encodes for 9 catabolic enzymes (Ramos et al., 1997)
further catalysing benzoate to Krebs cycle metabolites.
75

4.2.2.4 PbenA promoter
76
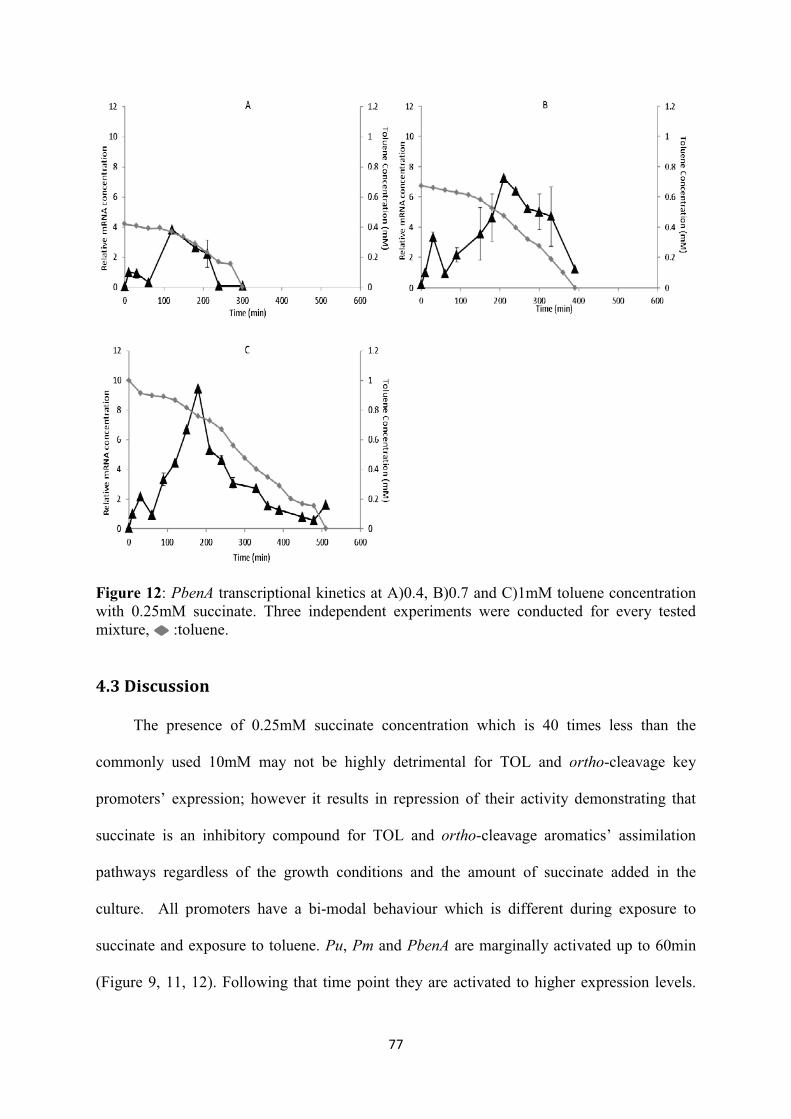
4.3 Discussion
77

The kinetic pattern that TOL promoters followed in both phases upon substrates entry is
increase, peak and gradual decrease to the basal expression level. This expression pattern was
observed by Bar-Joseph et al. (2012), suggesting that the transcription factors up-regulate
promoters expression during a certain period followed by subsequent degradation/polymers’
dissociation. PbenR behaviour undergoes no expression at the mixture of 0.7mM of toluene
and down-regulation at the mixture containing 0.4 and 1mM of toluene up to 90min followed
by increase upon cells exposure to toluene until a maximum level and gradual decrease to the
primary expression level. The effect of succinate presence is stronger on PbenR compared to
the catabolic enrolled promoters (Figure 10).
The known PbenA up-regulator is BenR, however PbenA follows similar expression
pattern to TOL catabolic promoters suggesting its up-regulation by XylS. The up-regulation
of PbenA by XylS in P. putida strain has been indicated before (Cowles et al., 2000;
Dominguez-Cuevas et al., 2006; Jeffrey et al., 1992). Pm is activated by both XylS and BenR
which are activated due to benzoate presence. BenR regulation is stronger at mixtures
containing higher toluene concentrations (1mM) as the switch expression pattern point of Pm
at this level is 90min. Therefore the transcriptional kinetics indicates that promoters’
behaviour reflects succinate impact on transcription factors regulation during the mid-
exponential phase of the first biomass phase increase when cells are exposed to succinate (60-
90min).
Indeed the global regulatory mechanisms which are activated due to CCR involve the
activation of global regulatory proteins hindering transcription factor role and their
production. Upon succinate presence in excessive concentration of more than 10mM, PtsN
enzyme and Crc protein play a key role to the repression of the promoters which control TOL
and ortho-cleavage pathways while the influence of Cyo terminal oxidase is little (Aranda-
Olmedo et al., 2005; Rojo, 2010).
78

Crc protein inhibits activation of the translation initiation complex by binding to target
mRNAs when it recognises a specific region located adjacent to the AUG translation
initiation codon (Moreno et al., 2009b). Crc is present in all fluorescent Pseudomonas and
other related bacteria (Moreno et al., 2012). The small non-coding RNAs (sRNAs) CrcZ and
CrcY co-ordinate to control the levels of free Crc; under repressing conditions both sRNAs
are in low levels while Crc is highly produced (Moreno et al., 2012). Crc role in P. putida
could be to control the energy state and to direct cells to launch an appropriate response upon
multiple substrates availability (Aranda-Olmedo et al., 2005). In the TOL, Crc inhibits the
translation of structural genes which participate in the first steps of toluene oxidative
catabolism to ensure a rapid regulatory response when other more readily degradable
compounds are available (Moreno et al., 2010).
The inhibitory effect of Crc on BenR when succinate is present using complete medium
is known (Linares et al., 2010; Morales et al., 2004; Moreno et al., 2009a). According to
Ruiz-Manzano et al. (2005) and Moreno and Rojo (2008a) in batch cultures supplemented
with M9 minimal salts medium the role of Crc is not repressive. However in Ruiz-Manzano
et al. (2005) study in M9 minimal medium batch cultures of a P. putida strain engineered to
chromosomally express catabolic genes of alkane degradation, crc mRNA reached high
expression levels up to mid-exponential biomass growth when cells are exposed to succinate.
Towards the end of the exponential phase caused by succinate consumption crc levels are
low. This study presented the levels of crc using three different media: complete, M9 and
spent complete. Complete medium resulted in the highest crc levels followed by M9, thus
pointing out the increased activity of the relevant Crc, which cannot be ignored. Using the
same comparison method Yuste and Rojo (2001) observed high activity of Crc in the
exponential growth phase due to succinate in batch cultures when M9 medium is used in P.
79

Putida GpO1 alkane degradation pathway. Therefore, it is concluded that in P. putida strain
grown in succinate with M9 minimal medium, Crc protein is activated.
BenR is a chromosomally encoded P. putida protein therefore Crc activation upon
succinate presence in M9 minimal salts medium represses BenR production. Moreno and
Rojo (2008a) have also suggested that BenR inhibition by Crc is a general strategy. Therefore
it is suggested that Crc inhibits BenR activity leading to less expression of the genes which
are affected by BenR. BenR is the up-regulator of Pm and PbenA. The lower level of
expression of PbenR results in a constitutive and in 2 out of 3 mixtures reduced BenR
production thus leading to lower level of expression of Pm and PbenA upon succinate
presence during the exponential growth phase. The strong effect of BenR repression to these
promoters is also clear at the second stage of expression where the levels of Pm and PbenA
solely triggered by toluene are not very high. The present study suggests BenR auto-
regulation because Crc inhibits BenR production and PbenR is the only down-regulated
promoter. Moreover, similarly to Pm and PbenA its expression level following succinate
depletion is not very high.
Crc protein also binds to the translation initiation site of XylR and XylS (Moreno et al.,
2010) upon supply with complete medium in batch cultures. However, as suggested above,
Crc is possibly produced in high levels in M9 medium batch cultures as well. Therefore the
increased crc levels in P. putida results in XyR and XylS repression and thus lower level of
expression of the relevant regulated promoters Pu, Pm and PbenA.
Another global regulator related to the catabolite repression of Pu exerted by succinate
in continuous cultures containing M9 minimal medium is PtsN enzyme (Aranda-Olmedo et
al., 2006) whereas Crc is not repressive (Aranda-Olmedo et al., 2006; Dinamarca et al.,
2003). Nevertheless, in batch cultures growing in M9 minimal medium, o-xylene and yeast
extract the repression effect on Pu was clearly caused by both PtsN and Crc (Aranda-Olmedo
80

et al., 2005). PtsN enzyme interferes with the ability of XylR to trigger transcription from Pu
promoter possibly by impeding – directly or indirectly – the binding of XylR to Pu DNA or
XylR interaction with σ54-RNA polymerase (Aranda-Olmedo et al., 2005). Although in batch
cultures supplemented with M9 minimal medium the non-inhibitory effect of excessive
succinate presence on Pu has been mentioned by (Cases et al., 1996; Holtel et al., 1994;
Velazquez et al., 2004) herein it is proven that succinate traces repressed Pu activity.
Additionally, as seen in Figure 8, toluene has already been taken up in the beginning of
the process. This is due to the activation of the TOL and ortho-cleavage pathways resulting in
triggering relevant promoters’ expression. However CCR is present leading to low promoters
expression, thus low production of the necessary enzymes catalysing toluene
biotransformation which cannot result to biomass growth. Following succinate depletion,
biomass growth enters a lag phase. This could be due to the adaptation of the cells to the new
status where toluene is the environmental signal, which belongs to the least preferable by the
P. putida cells compound category acting as the energy and carbon source. Moreover, the
process of toluene transformation to Krebs cycle intermediates requires the activation of the
TOL upper, meta and chromosomal ben, cat operon enzymes which are twenty in total
(Tables 1,2, Chapter 2) and is the result of the coordinate action of the two pathways which
could be time-consuming leading to a delay in biomass formation.
P. putida is a bacterium with a vast application in industrial biotechnology and
synthetic biology. Understanding CCR may facilitate bacterium ability to degrade pollutants
and improve biodegradation rates. Furthermore CCR decoding will enable further expansion
of P. putida utility in biotechnology and bioremediation (Moreno et al., 2010). Using
succinate traces which are not detrimental for promoters’ expression the biomass growth is
higher compared to that produced upon sole substrates induction as Alvarez and Vogel
(1991) have also realised and the pollutant removal efficiency increases (Klecka and Maier,
81

1988). Therefore optimal production of useful products by Pseudomonas is possible because
the biomass grows immediately with smaller lag phases in the transition of one to the other
substrate; thus possibly leading to faster and on higher concentrations products formation
since the compounds production depends on biomass growth. Muconic acid is a useful
product of P. putida toluene degradation (Xie et al., 2014).
Pm undergoes oscillations following succinate depletion and upon exposure to sole
toluene in the mixture containing 1mM toluene. The most common reason causing
oscillations is negative feedback loops (Alon, 2006) and further research should be focused
on determining the transcription factors participating on the loop.
It was also observed that as toluene concentration in the mixture increases the activity
of the catabolic Pu, Pm and PbenA promoters following succinate depletion reaches higher
maximal expression levels and amplitude displaying their dependency on the initial toluene
concentration added.
4.4 Conclusion
In the present study by demonstrating the transcriptional kinetics of the catabolic
promoters upon exposure to succinate traces and different toluene concentrations, the way
towards capturing the molecular mechanisms causing these promoters repression is paved.
The molecular mechanisms underlying the catabolite repression remains mainly unknown
(Morales et al., 2004). However this study by providing an insight on the transcriptional
kinetics of key promoters of the toluene catabolic process indicates possible mechanisms of
repression of promoters’ transcription factors XylR, XylS and BenR which are directly
affected by succinate presence. The present suggestions could be experimentally tested in the
future.
82

Chapter 5
5. Transcriptional kinetics of the cross-talk between the ortho-
cleavage and TOL pathways of toluene biodegradation in
Pseudomonas putida mt-2
The promoters of the TOL plasmid are activated by toluene leading gene expression
responsible for degradation of the environmental signal. Benzoate is formed as an
intermediate, activating the BenR protein of the chromosomal ortho-cleavage pathway that
up-regulates the chromosomal PbenA promoter and the TOL Pm promoter resulting in cross-
talk between the two networks. Herein, the transcriptional kinetics of the PbenR and PbenA
promoters in conjunction with TOL promoters was monitored by real-time PCR during
toluene biodegradation of different concentrations in batch cultures. The cross-talk between
the two pathways was indicated by the simultaneous maximal expression level of the Pm and
PbenR promoters, as well as transcriptional activation from PbenA occurring prior to PbenR
indicating potential up-regulation of PbenA by the XylS protein of TOL. The repressory
effect of toluene on Pr was evident for concentrations higher than 0.3 mM suggesting a
threshold value for restoring the promoter’s activity, while all the other promoters follow a
specific expression pattern, regardless of the initial inducer concentration. Similarly to
Chapter 4, induction of the system with higher toluene concentrations revealed an oscillatory
behaviour of Pm, the expression of which remained at high levels until the late exponential
phase, demonstrating a novel function of this network.
83

5.1 Introduction
The activation of a specific metabolic pathway in the presence of an aromatic
compound relies mainly on two factors: i) the catabolic enzymes catalysing the degradation
of the compound, and ii) the promoters of genes and operons subject to regulation by specific
transcription factors (de Lorenzo and Perez-Martin, 1996). Transcriptional regulation is a
key step in the biodegradation process of an aromatic compound acting as a controller
regulating the appropriate metabolic cascades in response to the availability of specific
substrate(s) (Díaz and Prieto, 2000).
P. putida is a metabolically versatile soil bacterium capable of thriving in diverse
habitats (Timmis, 2002) as well as an industrially significant strain producing a series of fine
and bulk chemicals, which has resulted in a growing interest in understanding its specific
metabolic pathways (Ballerstedt et al., 2007). Among the several P. putida strains, mt-2
contains the TOL plasmid (pWW0), which specifies metabolic pathways for toluene and m-
xylene degradation(Timmis, 2002). The latter compounds belong to the BTEX (benzene,
toluene, ethylbenzene and the three isomers of xylene) group of pollutants; their
biodegradation leads to Krebs cycle intermediates, which are essential for biomass growth
(Jindrova et al., 2002). TOL is considered as a paradigm of global and specific gene
regulation due to the interactions that occur between DNA-bending proteins, a set of sigma
factors and the regulators encoded in the system (Aranda-Olmedo et al., 2006). The
transcriptional regulatory network of TOL has been described in detail by (Ramos et al.,
1997) and constists of four transcriptional units (xylR, xylS, upper and meta operon)
controlled by four promoters (Pr, Ps, Pu and Pm), respectively. Entry of an aromatic
compound in TOL provokes a cascade of regulatory events, as presented in Figure 13 and
described briefly below.
84

The Pr controls the expression of the xylR gene, which encodes for the XylR protein.
In the absence of an environmental signal the XylR protein is produced in an inactive form
(XylRi), while the entry of an aromatic compound results in oligomerisation of 3 inactive
XyR dimers forming an active molecule of XylR (XylRa). XylRa activates Pu and Ps
promoters. Upon Pu activation the genes of the upper operon are expressed resulting in the
production of the corresponding enzymes catalysing the oxidative catabolism of toluene to
benzoate. The activation of Ps, as well as the presence of benzoate, results in overexpression
of the xylS gene, which is constitutively expressed, leading to the dimerisation of the inactive
XylS protein to the active protein form. The presence of benzoate is known to boost mRNA
expression from the meta operon, which encodes for the corresponding enzymes catalysing
the catabolism of benzoate to Krebs cycle intermediates (Ramos et al., 1997). Furthermore,
benzoate activates BenR protein of the ortho-cleavage pathway which is encoded by benR
gene (Cowles et al., 2000; Cuskey and Sprenkle, 1988).
The activation of BenR triggers ben operon expression (Cowles et al., 2000)of the
ortho-cleavage pathway followed by a cascade of metabolic events in chromosome which
further catabolise benzoate to Krebs cycle intermediates, such as succinyl-coA and acetyl-
CoA (Chugani et al., 1997). Furthermore, BenR protein acts as an up-regulator of TOL Pm
(Cowles et al., 2000). The benR gene and ben operon are controlled by PbenR and PbenA
promoters. Although, PbenR and PbenA are essential in the catabolic process of toluene their
activity until substrate depletion has not been monitored and demonstrated yet. The
transformation of toluene to Krebs cycle intermediates through the enzymes produced by the
genetic elements of the system is presented in Figure 7A. The information of Figure 7B was
used to construct a logic representation of the interactions between the genetic elements
(Figure 7C), using a direct analogy to electrical circuits (Weiss et al., 2003).
85

The effect of gene regulation and transcriptional response on toluene catabolism
through activation of TOL and chromosomal ben operon genes has been previously studied in
batch cultures (Dominguez-Cuevas et al., 2006; Gerischer, 2002). The TOL transcriptional
kinetics has been evaluated in batch cultures using m-xylene (Koutinas et al., 2011; Koutinas
et al., 2010) and (3-) benzyl-alcohol (Marques et al., 1994) as the inducer of the pathway. But
the transcriptional kinetics of TOL and ortho-cleavage key promoters upon induction with
toluene has not been evaluated yet. Monitoring of transcriptional kinetics in P. putida
provides valuable information about the activity of catabolic genes enhancing the knowledge
of the interplay between the two pathways during toluene degradation.
The objective of this Chapter was to investigate the expression levels of the promoters
involved in toluene catabolism (Pr, Ps, Pu, Pm, PbenR and PbenA) by P. putida mt-2 over
time through the cross-talk of the chromosomal and TOL metabolic pathways. The
transcriptional kinetic profiles of the promoters involved are presented in measurements
obtained in 30 min time intervals, in conjunction with the dynamic profiles of toluene
consumption and biomass growth until effector’s depletion. Four toluene concentrations were
tested in batch cultures by performing three independent experiments at each concentration to
clarify the effect of the environmental signal on the transcriptional regulation as well as to
reveal the behaviour of the promoters in a wide range of conditions. This study justified the
effect of toluene concentration on promoters’ activity unravelling specific expression
patterns, and explored the regulatory mechanisms governing them.
86

Figure 13: Cross talk of the chromosomal and TOL genetic networks during toluene induction. The overimposed regulation of the promoters is additionally presented. (A) The enzymes encoded in the upper operon sequentially transform toluene into benzoate. The latter is then transformed into acetate and pyruvate through the action of the enzymes synthesised by the meta operon. The meta pathway products are channelled into the Krebs cycle yielding the precursor molecules required to support biomass growth. (B) The biochemical and (C) logic representations of the two pathways. :inactive form of XylR (XylRi); : active form of XylR (XylRa); : inactive form of XylS (XylSi); : active form of XylS (XylSa);
: inactive form of BenR (BenRi); : active form of BenR (BenRa); : input; : output; : AND; : OR; : NOT.
5.2 Results
5.2.1 Evolution of toluene biodegradation and biomass growth kinetics
upon induction with different toluene concentrations
Cells were pre-grown overnight in succinate to ensure that TOL and ortho-cleavage
pathways were not expressed prior to toluene induction. The consumption of toluene, which
was added in concentrations that ranged between 0.4-1.2 mM, was investigated in batch
87

cultures of mt-2 (Figure 14). The batch cultures were repeated three times at each
concentration level. The results demonstrated that for lower aromatic compound
concentrations the mt-2 metabolised the substrate faster. Specifically, in 0.4 mM (Figure
14A), which was the lowest inducer concentration tested, 90% of toluene was degraded
within 290 min, while degradation of the same amount of inducer was achieved within 330
min when 1.2 mM were fed (Figure 14D). Additionally, for higher inducer concentrations the
duration of the lag–phase, which was observed in all experiments performed, was
substantially increased. For instance, the lag phase was 90 min and 180 min for 0.4 mM
(Figure 14A) and 1.2 mM (Figure 14D) toluene concentrations, respectively. Furthermore,
the total biomass formed by each mixture is 2, 4.5, 8% lower for 0.4, 0.7, 1mM toluene,
respectively compared, to that produced by toluene and succinate utilisation (Chapter 4).
Figure 14: Concentration of toluene and dry cell weight in the experiments. (A) 0.4, (B) 0.7, (C) 1.0, and (D) 1.2 mM of toluene concentration
88

5.2.2 TOL and ortho-cleavage promoters’ transcriptional kinetics
The transcriptional kinetics of TOL Pr, Ps, Pu, Pm and ortho-cleavage PbenR, PbenA
are presented in Sections 5.2.2.1, 2, 3, 4 and 5, 6, respectively.
5.2.2.1 Pr promoter
Herein, the two σ70-dependent tandem Pr promoters (Marques et al., 1998) have been
integrated into a single promoter. The active and inactive forms of the XylR protein repress
Pr (Gonzalez-Perez et al., 2004; Marques et al., 1998). This effect was also observed in this
study where the activity of Pr decreased significantly (P<0.05) following induction of the
culture with toluene (Figure 15). A low level of Pr expression was maintained for the rest of
the experiment until the concentration of toluene was reduced to approximately 0.3 mM.
However, when the concentration of toluene was reduced below 0.3 mM, the repression of Pr
was alleviated and its activity was increased reaching a similar level of expression as prior to
the induction with the environmental signal (P<0.05). Furthermore, the difference between
the mean relative mRNA expression at 0 min and the last time point was not statistically
significant demonstrating that a similar level of expression existed at both time points
(P>0.05). The recovery of Pr activity could be due to the end of auto-repression of XylR
occurring at lower pollutant concentrations, while a toluene concentration of 0.3 mM could
serve as a threshold level initiating this response.
89

5.2.2.2 Ps promoter
90
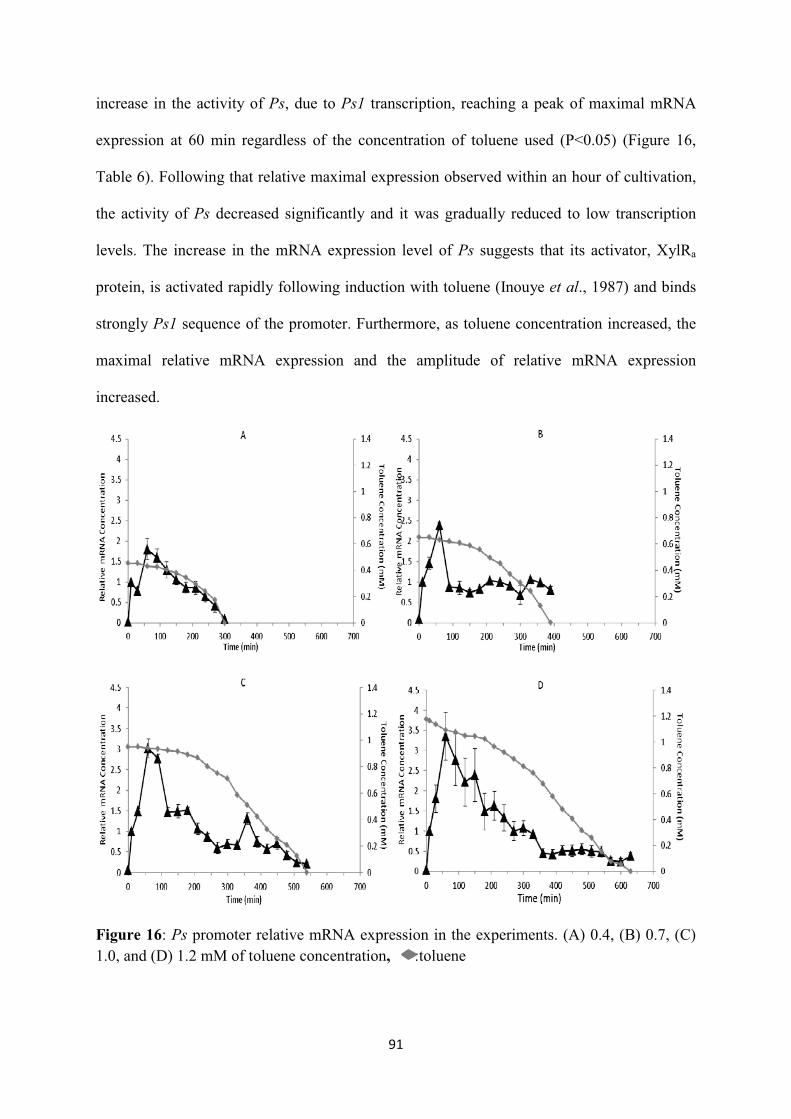
91
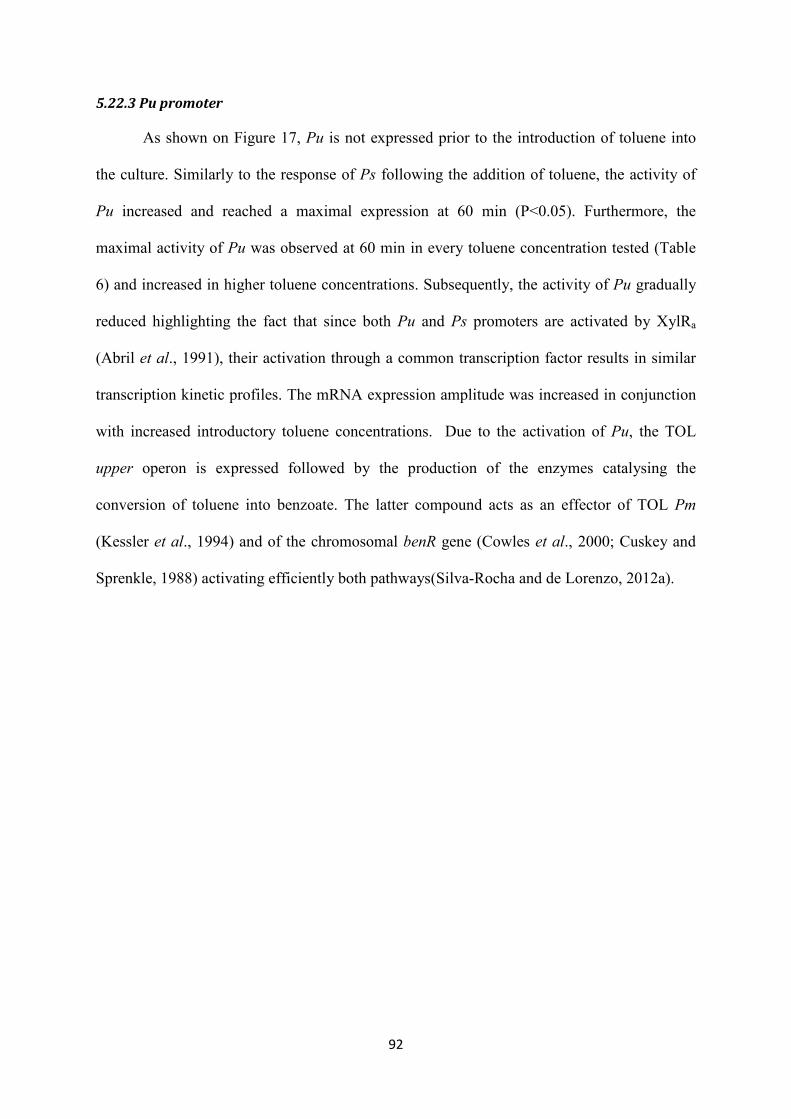
5.22.3 Pu promoter
As shown on Figure 17, Pu is not expressed prior to the introduction of toluene into
the culture. Similarly to the response of Ps following the addition of toluene, the activity of
Pu increased and reached a maximal expression at 60 min (P<0.05). Furthermore, the
maximal activity of Pu was observed at 60 min in every toluene concentration tested (Table
6) and increased in higher toluene concentrations. Subsequently, the activity of Pu gradually
reduced highlighting the fact that since both Pu and Ps promoters are activated by XylRa
(Abril et al., 1991), their activation through a common transcription factor results in similar
transcription kinetic profiles. The mRNA expression amplitude was increased in conjunction
with increased introductory toluene concentrations. Due to the activation of Pu, the TOL
upper operon is expressed followed by the production of the enzymes catalysing the
conversion of toluene into benzoate. The latter compound acts as an effector of TOL Pm
(Kessler et al., 1994) and of the chromosomal benR gene (Cowles et al., 2000; Cuskey and
Sprenkle, 1988) activating efficiently both pathways(Silva-Rocha and de Lorenzo, 2012a).
92

5.2.2.4 Pm promoter
93

exponential growth phase. Prior to the stationary phase the activity of Pm was sharply
reduced to its basal level. Interestingly the response of Pm to the two higher concentrations of
toluene tested (Figures 18C, D) was oscillating in a narrow range close to the maximum
value. The activity of Pm oscillated with a regular frequency of approximately 150 min when
exposed to 1 mM of toluene, while the frequency varied when the concentration of the
inducer was increased to 1.2 mM. The oscillatory expression of Pm was clearly observed in
the higher toluene concentrations tested (1.0, 1.2 mM) (Figure 18C, D) and occurred
following activation of the ortho-cleavage pathway encoded in the chromosome. Both the
systematic experimental work (triplicate experiments at each concentration level) and the
statistical analysis (P<0.05) between the oscillatory points) ensured that this behaviour is not
an artifact. The oscillatory behaviour of Pm at 1mM toluene concentration was similar on
Chapter 4 when the biosystem is affected by succinate and toluene.
Transcription from Pm was slightly delayed compared to Pu and Ps, since benzoate
should be produced and XylS activated to drive increasing activation of Pm. The XylS
protein production triggered through Ps1 activation is sufficient for Pm stimulation upon
toluene induction (Dominguez-Cuevas et al., 2008). Despite the minor delay of 10 min, the
highest expression of Pm was observed at 60 min similarly to Ps and Pu remaining at the
same level up to 90 min. Transcription from Pm was maintained at high levels after 90 min
(P>0.05) (Figure 18), a time point were PbenR reached its maximal expression (see below).
Furthermore, the level of transcription from Pm was substantially higher compared to Pu and
Ps in agreement with fluorescence measurements by (Silva-Rocha and de Lorenzo, 2012b).
The remarkably high maximal Pm expression levels compared to Pu and Ps could be
attributed to the activation of XylS protein due to benzoate formation which leads to over-
production of this protein stimulating Pm at high level of expression. Pm expression level
remained high possibly due to the requirement for further transformation of benzoate into
94

5.2.2.5 PbenR promoter
95

promoter was not immediately activated following the addition of toluene remaining at low
expression levels for a period that ranged between 10-30 min after induction with the
substrate (Figure 19). The statistical difference of the data obtained at 0, 10 and 30 min was
not significant (P > 0.05). The presence of benzoate activates BenR protein (Cowles et al.,
2000). According to the results the first 10-30 min the constant PbenR expression leads to a
constitutive level of benR expression and, thus, BenR production. BenR is expected to be
activated following activation of Pu, which drives the transcription of the upper operon
encoding for the enzymes that convert toluene to benzoate.
However, following that period the expression of PbenR increased reaching its peak
level within 90 min of pollutant addition, which was evident for all experiments performed
(P<0.05) (Table 6). After 90 min, mRNA expression decreased and gradually reached the
initial basal level (P>0.05) remaining almost at a stable level (P>0.05) until the complete
depletion of the substrate. This expression pattern of PbenR indicated that there is a
transcription factor up-regulating its activity with great efficiency until 90 min and then the
decrease of the mRNA expression could be attributed to the decrease of the activity of the
transcription factor.
The results obtained for Ps, Pu and PbenR indicated that the three promoters had similar
behaviour and that there was approximately a 30 min delay between transcription initiation
and the maximum expression levels observed in the TOL and chromosomal pathway
promoters. Thus, although the two promoters subject to XylR regulation were activated
immediately following the addition of the inducer, expression from PbenR was delayed by 30
min due to the requirement for benzoate formation, which is possible through transcription
from Pu that controls the function of the upper pathway and catalyses the conversion of
toluene to benzoate. This time delay indicated that following the activation of a given
96

97
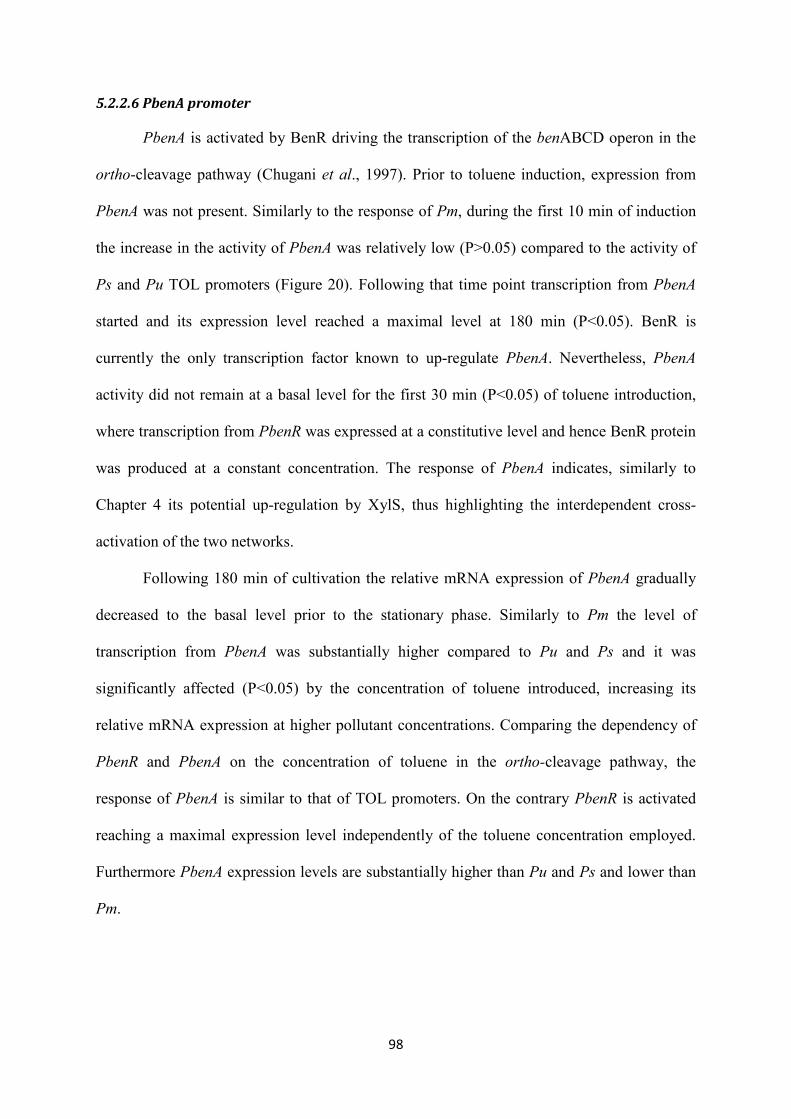
5.2.2.6 PbenA promoter
PbenA is activated by BenR driving the transcription of the benABCD operon in the
ortho-cleavage pathway (Chugani et al., 1997). Prior to toluene induction, expression from
PbenA was not present. Similarly to the response of Pm, during the first 10 min of induction
the increase in the activity of PbenA was relatively low (P>0.05) compared to the activity of
Ps and Pu TOL promoters (Figure 20). Following that time point transcription from PbenA
started and its expression level reached a maximal level at 180 min (P<0.05). BenR is
currently the only transcription factor known to up-regulate PbenA. Nevertheless, PbenA
activity did not remain at a basal level for the first 30 min (P<0.05) of toluene introduction,
where transcription from PbenR was expressed at a constitutive level and hence BenR protein
was produced at a constant concentration. The response of PbenA indicates, similarly to
Chapter 4 its potential up-regulation by XylS, thus highlighting the interdependent cross-
activation of the two networks.
Following 180 min of cultivation the relative mRNA expression of PbenA gradually
decreased to the basal level prior to the stationary phase. Similarly to Pm the level of
transcription from PbenA was substantially higher compared to Pu and Ps and it was
significantly affected (P<0.05) by the concentration of toluene introduced, increasing its
relative mRNA expression at higher pollutant concentrations. Comparing the dependency of
PbenR and PbenA on the concentration of toluene in the ortho-cleavage pathway, the
response of PbenA is similar to that of TOL promoters. On the contrary PbenR is activated
reaching a maximal expression level independently of the toluene concentration employed.
Furthermore PbenA expression levels are substantially higher than Pu and Ps and lower than
Pm.
98
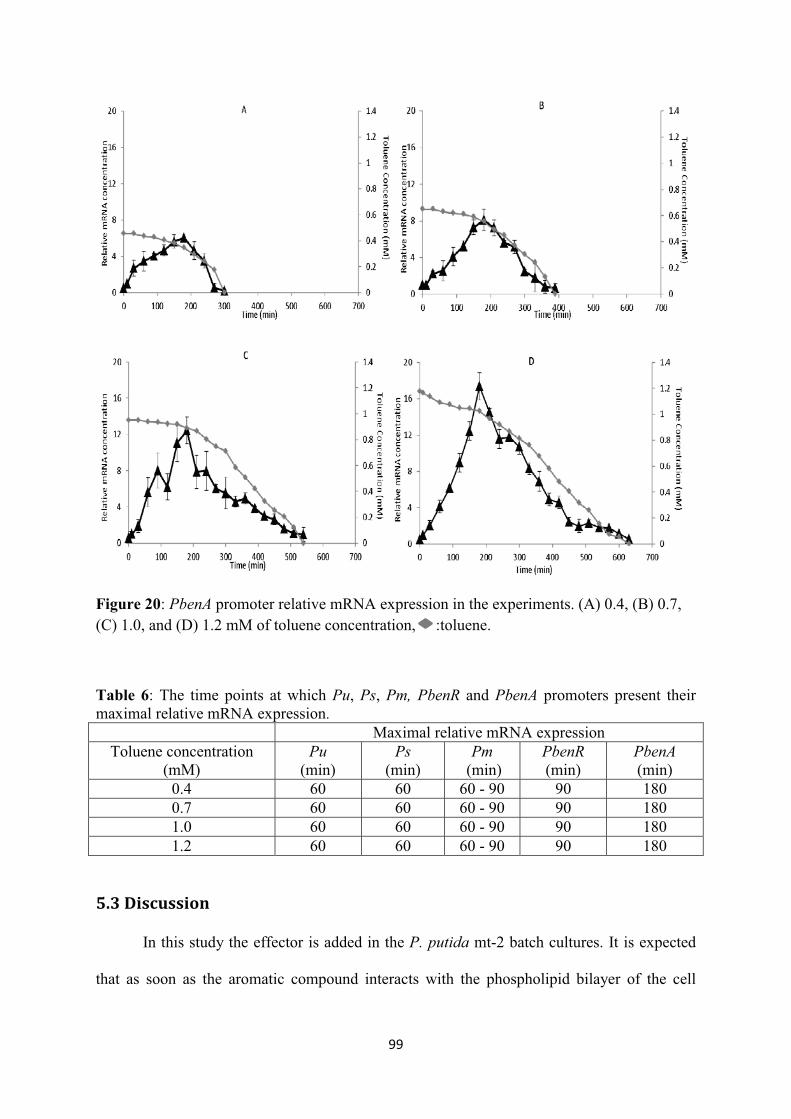
5.3 Discussion
99

membrane, a stress response is produced since the pollutant is known to disturb the
cytoplasmic membrane structure (Dominguez-Cuevas et al., 2006; Sikkema et al., 1995).
Xylene monooxygenease (XMO) is a membrane-bound enzyme found in P. putida mt-2
(Tizzard and Lloyd-Jones, 2007) responsible for the initiation of pollutant’s catabolism,
which following the disturbance in the membrane structure its synthesis stops for a certain
time period (Buhler et al., 2006). The lag-phase could also be caused due to the inhibition of
protein synthesis occurring when the culture is exposed to toluene. A comparison between the
consumption of toluene and 3-methyl-benzoate by P. putida mt-2 cells revealed the effect of
toluene concentration on protein synthesis (Vercellone-Smith and Herson, 1997). The
complete inhibition of protein synthesis for the first 20 min of cultivation for cells exposed to
sub-lethal toluene concentrations was evident. Thereafter, protein synthesis resumed and
completely recovered after 1.5 to 3 h of cultivation.
The complex genetic circuit of TOL and ortho-cleavage pathways interplay along
with the overimposed regulation is presented in Figures 13B,C. The integration host factor
(IHF) has been also indicated as a regulator of Pr and Ps activity upon induction with a
chemical signal. In cultures using LB medium the binding sites of IHF were not relevant to
the transcriptional control of both promoters (Holtel et al., 1992). However a clear repressory
effect on Ps was observed, under the presence of an inducer with M9 minimal and low-LB
medium, respectively (Holtel et al., 1995; Marques et al., 1998). On the contrary, this effect
weakly occurred in the work of (de Lorenzo et al., 1991; Gomada et al., 1994) rendering Ps
activation independent of IHF regulation. Therefore, more in vitro and in vivo studies are
required to elicit the explicit regulatory effect of IHF on Ps. It was presented Toluene
consumption (Figure 14) in conjunction with continuous quantitative information, obtained
by real-time PCR, of the promoters pertinent to this genetic circuit (Figures 15-20).
100

The first promoter activated upon toluene entry into the cells is Pr which is down-
regulated due to XylR auto-repression. Vercellone-Smith and Herson (1997) revealed that
protein synthesis by 3-methyl benzoate, which activates directly Ps and indirectly Pm
through the activation of XylS, is high since the start of the culture. However, when toluene
was used as the inducer, Pr and Pu promoters were activated prior to Ps and Pm.
Furthermore, transcription from Ps and Pm occurred at a later stage and protein synthesis
reached comparable levels to the experiments performed with 3-methyl benzoate 4-6 h after
induction. This delay was attributed to the XylR protein activity, the master regulator of the
system, which is required for initiation of toluene degradation acting as both the direct and
indirect activator of Pu, Ps and Pm, as well as an auto-repressor (Pr) (Silva-Rocha et al.,
2011a). Therefore XylR plays a key role in TOL regulatory network.
The activated form of XylR activates both σ54-dependent Ps and Pu promoters
(Figures 16, 17). The transcriptional kinetics of these promoters has been presented by
(Marques et al., 1994) in cultures pre-grown overnight in glucose and cultivated in M9
minimal medium supplemented with 8 mM of 3-methylbenzyl alcohol with an initial OD660
of 0.3. Maximal mRNA expression was achieved following 10 min of induction, while
similar results were obtained upon benzyl-alcohol induction. Herein, mt-2 was pre-grown in
succinate and diluted to an OD600 of 0.1 in M9 supplemented with toluene. Since 3-
methylbenzyl alcohol and benzyl-alcohol are the first intermediates upon m-xylene and
toluene oxidative catabolism in TOL respectively, their presence is expected to lead to faster
induction of Ps and Pu compared to the addition of m-xylene and toluene. Furthermore,
observing the transcriptional kinetics of Ps and Pu under 3-methylbenzyl alcohol and benzyl-
alcohol induction, similarly to the results presented here the maximal expression level was
followed by sharp decrease in promoters’ activity. The expression pattern of Ps and Pu
indicates a significant reduction in the efficiency of XylRa to up-regulate the promoters
101
following their maximal activity level. The specific expression pattern has been previously
reported by (Bar-Joseph et al., 2012) where the increase of promoter activity reached a
plateau followed by a consequent activity reduction. Another common characteristic between
the two studies is the higher maximal level of relative mRNA concentration of Pu compared
to Ps, suggesting that Pu is expressed at a higher level regardless of the growth conditions.
Following that, Pm expression is triggered. It was reported for the first time that Pm
may undergo an oscillatory expression when induced at high toluene concentrations (Figures
18C, D). Both the systematic experimental work (triplicate experiments at each concentration
level) and the statistical analysis (P<0.05 between the oscillatory points) ensured that this
behaviour is not an artifact. The predominant mechanism causing oscillatory behaviour in
genetic circuits is the presence of a composite negative feedback loop regulating both the
transcription and protein levels (Alon, 2006). Oscillations often arise when the composite
negative feedback loop exists in systems also containing a positive feedback loop that
operates at a slower timescale. A well-studied oscillatory expression caused by a composite-
negative feedback loop is presented in the Notch pathway through the signalling effector
Hes1 (Hirata et al., 2002; Kiparissides et al., 2011b), where de novo synthesis and
degradation of this protein is required for hes1 mRNA oscillation to occur. Interlinked
positive-negative feedback loops may act as effectors of oscillatory behaviour in the cell
cycle, such as the Xenopus embryonic cell cycle, where the reporting system is the cyclin B
dependent kinase 1 (CDK1) (Ferrell et al., 2009; Ferrell et al., 2011) or the Ca2+ spikes in the
GS-NS0 mammalian cell cycle (García Münzer et al., 2013). Furthermore, the oscillations
can be either overrun or damned, while the more un-damned an oscillation the stronger the
regulation (Alon, 2006).
Therefore, it is possible that in concentrations of toluene higher than 1 mM a
regulator could be activated down-regulating the meta-operon and resulting in the formation
102

of a composite feedback loop together with the two up-regulators of Pm. This is the first time
that Pm has demonstrated oscillatory behaviour and thus research in the future should focus
on characterisation of the biological mechanism causing this effect through experimental and
modelling approaches.
Pu controls upper operon expression encoding for the catalytic enzymes of toluene to
benzoate transformation. Benzoate induces BenR protein activity (Cowles et al., 2000). The
benR gene has been reported to be activated by the presence of benzoate (Cuskey and
Sprenkle, 1988) and it was demonstrated that the PbenR expression pattern (Figure 19)
triggered by benzoate and up-regulated by a yet unknown transcription factor. According to
the present study and that of (Marques et al., 1994) regardless of the pathway inducer and
pre-culture conditions employed Ps and Pu, which are up-regulated by the same transcription
factor (XylRa), reached a maximal level of expression at the same time point. This fact
suggests that promoters activated by the same transcription factor may achieve maximal
activity simultaneously. Therefore, Pm and PbenR that reached their maximal level of
expression at 90 min in all concentration levels of toluene tested could be up-regulated by the
same transcription factor. Since BenR is the chromosomally encoded transcription factor of
Pm (Cowles et al., 2000), the results of the present study suggest that BenR could serve as the
transcription factor of PbenR indicating the interplay of the two pathways at the
transcriptional level as well as PbenR auto-regulation.
PbenR activation results to BenR protein production which is the known transcription
factor of PbenA. But PbenA activation occurred prior to PbenR increasing activity suggesting
the up-regulation by TOL XylS protein (Figure 14). The cross-talk of PbenA and XylS in P.
putida PRS2000 strain has been suggested before (Cowles et al., 2000; Jeffrey et al., 1992).
Additionally, the up-regulation of PbenA by XylS has been previously reported for P. putida
mt-2 with the application of a plasmid harbouring a Pben-lacZ fusion (Dominguez-Cuevas et
103
al., 2006). However, the particular interaction has not been entirely validated yet. Herein, it
is suggested that PbenA would be activated even in the absence of BenR driving to further
activation of ortho-cleavage pathway and its utilisation for benzoate degradation. Therefore,
the presence of toluene could activate both catabolic pathways in P. putida mt-2.
It was also observed that PbenA reached higher levels of expression compared to Ps
and Pu. Additionally, Pm and PbenA expression levels which are solely triggered by toluene
are higher compared to the levels when toluene and succinate were the energy and carbon
source of the culture (Chapter 4) suggesting that CCR affects the expression levels of the
promoters. Taking into consideration activation of PbenA by XylS protein, high maximal
expression levels of PbenA may be triggered by the activated and over-produced XylS due to
benzoate formation. A previous study (Dominguez-Cuevas et al., 2006) showed the fold
change of mRNA expression of chromosomal ben- and TOL meta- operon genes after 15min
of toluene induction observing lower folding change of benA than xylX gene controlled by
PbenA and Pm promoter, respectively. A possible reason for the remarkably higher mRNA
expression levels of the chromosomally encoded promoters compared to TOL promoters
could be the low-copy of the TOL plasmid in the bacterial culture.
During m-xylene catabolism in TOL the transcriptional response from PbenA, which
controls ben operon, due to the final product (3-methyl-benzoate) of the upper pathway was
tested by (Perez-Pantoja et al., 2015). It was shown that 3-methyl-benzoate cannot serve as a
substrate of the chromosomal pathway, since PbenA is only marginally activated resulting in
the formation of a product causing cell death (Schmidt et al., 1985a). Thus, toluene, which is
currently considered as the predominant substrate for degradation by P. putida (Nicolaou et
al., 2010), is up to now the only inducer of the complete TOL regulatory mechanism
triggering the expression of the chromosomal pathway.
104

The operons benABCD and xylXYZL encoded in the ortho- and meta-cleavage pathways
respectively, are simultaneously activated by benzoate (Perez-Pantoja et al., 2015)
stimulating the transformation of benzoate to catechol which is further catabolised into Krebs
cycle intermediates (Burlage et al., 1989; Harwood and Parales, 2000). Transcription from
benABCD results in the formation of the BenD enzyme, which catabolises the transformation
of catechol into cis-cis-muconate enabling the activation of subsequent ortho-pathway genes
(Jeffrey et al., 1992).
Activation of the ortho-cleavage pathway due to toluene leads to the production of
muconic acid (Xie et al., 2014), which is a value-added product with a wide range of
applications highlighting the industrial importance of toluene catabolism through TOL and
chromosomal pathways. Furthermore, acquiring the capacity to understand the properties of
specific and global regulation in this genetic network paves the way towards de novo (Diaz et
al., 2013) and in silico (Koutinas et al., 2011) engineering of aromatic degradation pathways
by employing a combination of computational and synthetic biology approaches. The
activation of the ortho-cleavage pathway upon toluene entry in P. putida mt-2 has been
studied by (Silva-Rocha and de Lorenzo, 2013) to engineer cell-to-cell metabolic wiring of P.
putida mt-2 and KT2440 strains. While modelling of the transcriptional regulation in TOL
and ortho-cleavage pathways could lead to in silico prediction of toluene consumption and
biomass growth patterns similarly to (Koutinas et al., 2011) upon m-xylene entry to TOL
pathway. Transcriptional regulation could be the controller of macroscopic phenomena since
the promoters of upper, meta and ben catabolic operons Pu, Pm and PbenA, respectively
were sensitive to the concentration of the inducer used.
105

Chapter 6
6. Modelling of transcriptional regulation using toluene in P. putida
mt-2 cell cultures facilitates mechanistic prediction of microbial
growth kinetics
Bioprocess performance may be monitored via microbial growth kinetics models, but
traditional mathematical microorganism models, which ignore transcriptional regulation, may
fail to capture substrate utilisation, biomass and product formation patterns under a range of
initial conditions. The Koutinas et al. (2011) experimental and modelling framework
coupling downstream microbial growth kinetics with upstream transcriptional regulation on
Pseudomonas putida mt-2 containing the TOL plasmid was upgraded. The Koutinas et al.
(2011) framework uses the m-xylene substrate; this study replaces m-xylene with toluene, the
usual model substrate of the TOL plasmid pathway. The proposed method of initialising
model parameters through global sensitivity analysis and experimentally fixing their values
reveals the importance of updating the model to include the ortho-cleavage gene regulatory
network The bacterial lag phase was also modelled and predicted; this is the first link
between lag and transcription. The proposed mechanistic model efficiently predicts, under
varying initial toluene concentrations: promoter expression patterns; substrate degradation;
rate-limiting enzyme production; lag and exponential phase of biomass formation.
106

6.1 Introduction
Bioprocess performance is estimated through microbial growth kinetics models such
as the traditional Michaelis-Menten and Monod models. But these bulk measurement
approximation models, ignore molecular interactions and transcriptional regulation in each
microorganism and may inaccurately predict bioprocess kinetics (Kovarova-Kovara and Egli,
1998; Rogers and Reardon, 2000). Koutinas et al. (2011) developed a new predictive
framework coupling microbial growth kinetics to gene expression (i.e., transcriptional
regulation) in Pseudomonas putida mt-2 harbouring the TOL plasmid; the model estimates
m-xylene substrate utilisation and biomass formation patterns. The Koutinas et al. (2011)
model predictive capability is a step change with respect to the empirical, unstructured
Monod and Yano and Koga (1969) models under a range of conditions; the upstream events
are used to predict macroscopic phenomena. Koutinas et al. (2011) model dynamic
transcriptional regulation based on m-xylene entry experiments to P. putida mt-2; the TOL
plasmid regulatory network is activated at a range of m-xylene concentrations. The
transcriptional regulatory TOL network consists of 4 promoters (Pr, Ps, Pu, Pm) controlling
4 transcriptional units (xylR, xylS, upper and meta operon) which encode the catabolic
enzymes (Ramos et al., 1997) (Figure 21).
To extend the Koutinas et al. (2011) mathematical modelling framework, this study
predicts microbial growth kinetics using the carbon source toluene. Toluene is the primary P.
putida mt-2 substrate (Timmis, 2002), so the m-xylene-based Koutinas et al. (2011) model
may inaccurately capture Pr and Pm promoter behaviour upon toluene entry. This study also
updates the Koutinas et al. (2011) model to include the results that toluene efficiently
activates the ortho-cleavage pathway (Chapter 5). Specifically, benzoate formed via enzyme
activity encoded by the upper TOL pathway, activates BenR protein (Cowles et al., 2000;
Moreno and Rojo, 2008b) and triggers the metabolic cascade of ortho-cleavage pathway into
107

Krebs cycle metabolites (Burlage et al., 1989) which are essential for biomass growth.
Koutinas et al. (2011) predict the TOL plasmid regulatory logic; in this Chapter more
transcriptional regulation information is incorporated to predict at different initial toluene
concentrations: microbial growth kinetics on toluene, substrate consumption, biomass
formation patterns.
The regulatory ortho-cleavage network pathway contains the transcriptional units:
benR, ben operon, catR and cat operon controlled by promoters PbenR, PbenA, PcatR and
PcatB, respectively (Chugani et al., 1997; Harwood and Parales, 1996). BenR triggers ben
operon expression in the ortho-cleavage regulatory network (Li et al., 2010); the ortho-
cleavage pathway further enables benzoate catabolism. Consequently, the benR gene (Cuskey
and Sprenkle, 1988) and ben operon are essential in catabolising toluene and forming
biomass. Figure 15 represents the TOL and ortho-cleavage regulatory network as a set of
genetic circuit logic gates signals transmitted between different molecular components; the
output is gene expression (Andrianantoandro et al., 2006; Purnick and Weiss, 2009; Weiss et
al., 2003).
The mathematical representation of the regulatory TOL promoter logic is re-
developed based on biologically-justified expression patterns and a description of PbenR and
PbenA expression. Modelling PbenA expression allows characterisation of the rate-limiting
enzyme of ben operon responsible for transforming benzoate to metabolites inducing biomass
growth through the ortho-cleavage pathway. This Chapter therefore describes growth kinetics
to account for biomass growth by both pathways. A simple mathematical characterisation
connecting (for the first time) transcriptional regulation machinery to bacterial lag phase was
also introduced. Model analysis techniques proposed by Kontoravdi et al. (2010) determine
how parameter values affect model outputs (i.e., promoters, concentration of the pollutant,
biomass). Independent experiments for a range of initial toluene concentrations tests the
108

predictive ability of the model; the model accurately predicts toluene consumption and both
the lag and exponential phases of biomass formation.
Figure 21: Upon toluene entry the inactive form of XylR (XylRi) oligomerises forming the active molecule XylRa which activates Pu and Ps promoters. Both XylR forms down-regulate their own promoter, Pr. Upon Pu activation the genes of the upper operon encode for the enzymes which catalyse toluene catabolism to benzoate. Ps activation and benzoate lead to overexpression of the xylS gene dimerising the inactive XylS protein to the active protein form. XylS dimerisation activates the Pm promoter. In the chromosomal pathway PbenR controls benR gene transcription, which encodes for the inactive BenR protein form. Benzoate activates BenR which up-regulates Pm promoter of TOL and PbenA of chromosome. PbenA controls ben operon transcription which encodes for the enzymes responsible for transforming benzoate to catechol. In the presence of catechol, PcatR is activated controlling the catR gene expression encoding for CatR protein. Catechol formation results in activating CatR protein by oligomerising the active protein. Catechol is further catabolised to cis-cis-muconate and finally to Krebs cycle intermediates by cat operon which is controlled by PcatB promoter. : input; : output; : AND; : OR; : NOT.
6.2 Mathematical modelling
6.2.1 Mathematical modelling of the TOL and ortho-cleavage genetic circuit.
Koutinas et al. (2011) built a dynamic model of transcriptional regulation of TOL
promoters Pr, Ps, Pu, Pm based on m-xylene introduction to TOL pathway and existing
biological knowledge (Moreno et al., 2010; Ramos et al., 1997) (Table 7). This study
constructs a more detailed model including biological indication for specific expression
patterns of: TOL promoters, PbenR and PbenA and the rate-limiting ben operon enzyme of
109

the ortho-cleavage pathway which uses toluene as the environmental signal. The rate-limiting
ben operon enzyme is responsible for biomass growth through the chromosomal pathway. A
lag phase model exploiting the transcriptional kinetics was also proposed.
Two tandem promoters Pr1 and Pr2, and Ps1 and Ps2 control the xylR and xylS genes,
respectively (Marques et al., 1998) but we propose a simplifying assumption that xylR and
xylS are controlled by one united promoter each. Furthermore, upon effector entry in a
bacterial culture, the σ70 factor is kept at constant housekeeping level (Ishihama, 2000), the
σ54 factor is constitutively produced (Jishage et al., 1996) and the HU protein is abundantly
present (Ishihama, 1999). In LB medium, IHF protein concentration is highest at early
stationary phase (Valls et al. (2002). IHF also represses Ps activation (Marques et al., 1998),
but this effect is not significant due to the strong XylRa binding to Ps (Holtel et al., 1992)
rendering Ps activity independent of IHF concentration. The σ32 and σ38 factors mediate Pm
activation depending on the growth phase (Marques et al., 1999). It is therefore assumed that
the overimposed regulation is not limiting. The proposed model uses the Figure 16 logic; the
input promoter functions are Hill functions (Alon, 2006) and the proteins are described using
mass balance equations (Lee and Bailey (1984). The dissociation of proteins is described
using Gonze and Kaufman (2013) equation. Tables 9 and 10 describe the model parameters
and variables, respectively and Table 11 the complete model.
110
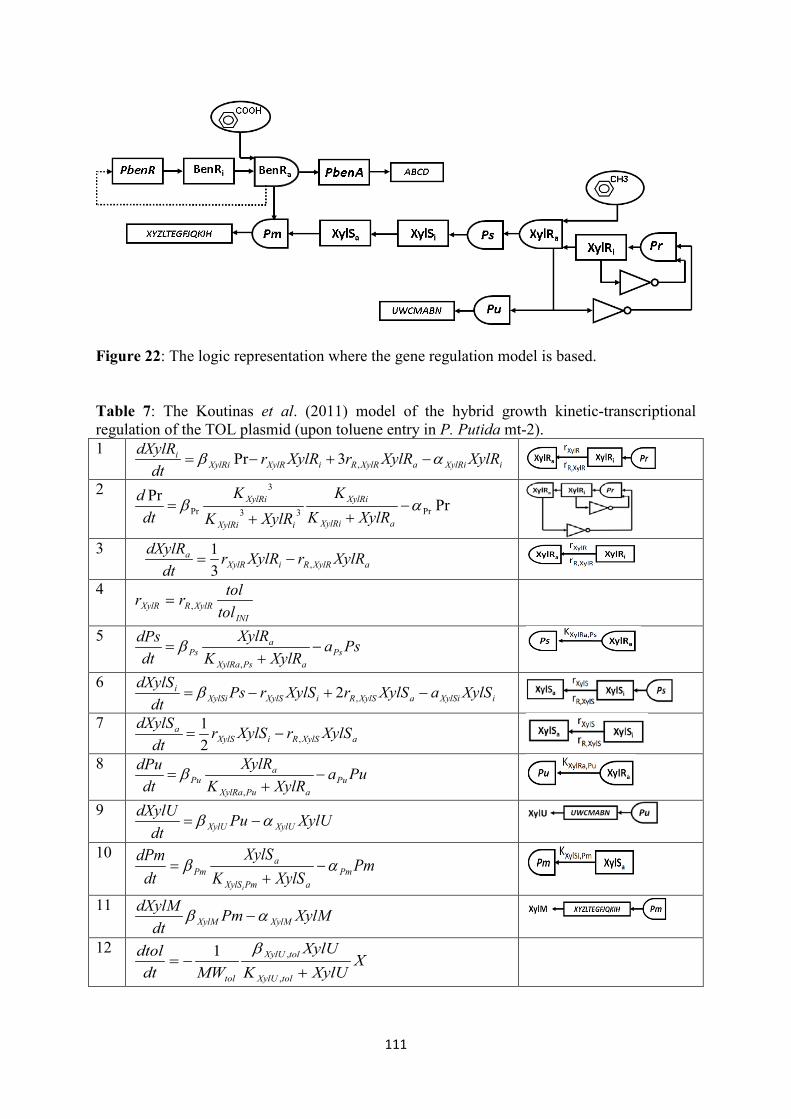
Figure 22: The logic representation where the gene regulation model is based.
Table 7: The Koutinas et al. (2011) model of the hybrid growth kinetic-transcriptional regulation of the TOL plasmid (upon toluene entry in P. Putida mt-2). 1
iXylRiaXylRRiXylRXylRii XylRXylRrXylRr
dtdXylR
aβ −+−= ,3Pr
2 PrPr
Pr33
3
Pr aβ −++
=aXylRi
XylRi
iXylRi
XylRi
XylRKK
XylRKK
dtd
3
aXylRRiXylRa XylRrXylRr
dtdXylR
,31
−= 4
5 Psa
XylRKXylR
dtdPs
PsaPsXylRa
aPs −
+=
,
β
6 iXylSiaXylSRiXylSXylSi
i XylSaXylSrXylSrPsdt
dXylS−+−= ,2β
7
aXylSRiXylSa XylSrXylSr
dtdXylS
,21
−=
8 Pua
XylRKXylR
dtdPu
PuaPuXylRa
aPu −
+=
,
β
9
10
11
12
INIXylRRXylR tol
tolrr ,=
XylUPudt
dXylUXylUXylU aβ −=
PmXylSK
XylSdt
dPmPm
aPmXylS
aPm
i
aβ −+
=
XylMPmdt
dXylMXylMXylM aβ −
XXylUK
XylUMWdt
dtol
tolXylU
tolXylU
tol +−=
,
,1 β
111
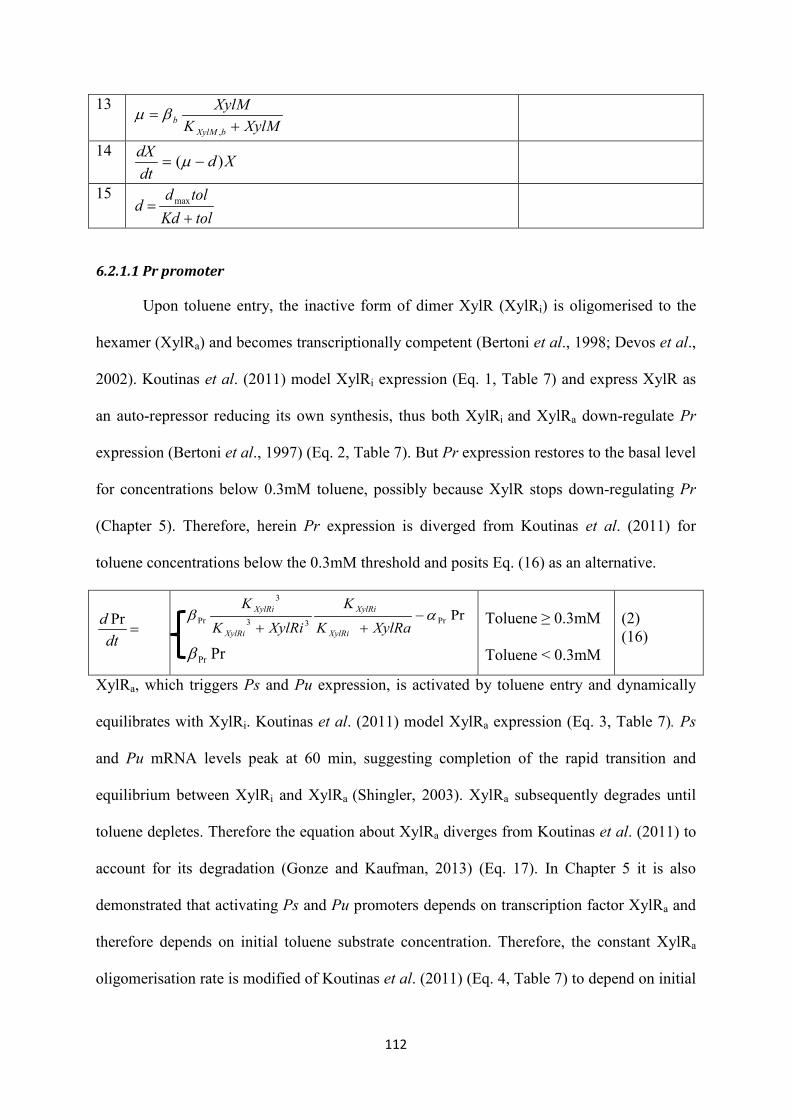
13
14
15
6.2.1.1 Pr promoter
Upon toluene entry, the inactive form of dimer XylR (XylRi) is oligomerised to the
hexamer (XylRa) and becomes transcriptionally competent (Bertoni et al., 1998; Devos et al.,
2002). Koutinas et al. (2011) model XylRi expression (Eq. 1, Table 7) and express XylR as
an auto-repressor reducing its own synthesis, thus both XylRi and XylRa down-regulate Pr
expression (Bertoni et al., 1997) (Eq. 2, Table 7). But Pr expression restores to the basal level
for concentrations below 0.3mM toluene, possibly because XylR stops down-regulating Pr
(Chapter 5). Therefore, herein Pr expression is diverged from Koutinas et al. (2011) for
toluene concentrations below the 0.3mM threshold and posits Eq. (16) as an alternative.
=dt
d Pr PrPrβ
Toluene ≥ 0.3mM Toluene < 0.3mM
(2) (16)
XylRa, which triggers Ps and Pu expression, is activated by toluene entry and dynamically
equilibrates with XylRi. Koutinas et al. (2011) model XylRa expression (Eq. 3, Table 7). Ps
and Pu mRNA levels peak at 60 min, suggesting completion of the rapid transition and
equilibrium between XylRi and XylRa (Shingler, 2003). XylRa subsequently degrades until
toluene depletes. Therefore the equation about XylRa diverges from Koutinas et al. (2011) to
account for its degradation (Gonze and Kaufman, 2013) (Eq. 17). In Chapter 5 it is also
demonstrated that activating Ps and Pu promoters depends on transcription factor XylRa and
therefore depends on initial toluene substrate concentration. Therefore, the constant XylRa
oligomerisation rate is modified of Koutinas et al. (2011) (Eq. 4, Table 7) to depend on initial
XylMKXylM
bXylMb +
=,
βm
XddtdX )( −= m
tolKdtold
d+
= max
PrPr33
3
Pr aβ −++ XylRaK
K
XylRiK
K
XylRi
XylRi
XylRi
XylRi
112

toluene concentration (Eq. 18). XylRa and the association rate constant, rXylR of XylRi to
XylRa are now described:
=dt
dXylRa
time < 60min
time ≥ 60min
(3)
(17)
INIXylR tolar *=
(18)
6.2.1.2 Ps promoter
The proposed model expresses Ps activity by Ps1 promoter using Eq. 5 (Table 7) of
Koutinas et al. (2011); this activation is sufficient for stimulating Pm upon toluene entry
(Dominguez-Cuevas et al., 2008). The XylS protein dimerises to become transcriptionally
active; Koutinas et al. (2011) model its active and inactive forms (Eq. 6, 7, Table 7). In this
Chapter, the expression of the dynamic equilibrium between XylSi and XylSa diverges from
Koutinas et al. (2011) due to the Pm promoter dependence on initial toluene concentration
(Chapter 5). Therefore the association constant rate between XylSi and XylSa is:
INIXylS tolbr *= (19)
6.2.1.3 Pu promoter
Pu is the upper operon (xylUWCMABN) controller encoding for the upper pathway
enzymes transforming toluene to benzoate (Koutinas et al. (2011) Eq. 8, Table 7). Although
all the enzymes encoded in the upper operon are produced, one enzyme is rate-limiting and
thereby dominates controlling the pathway flux (Douma et al., 2010). Koutinas et al. (2011)
model the rate-limiting enzyme, naming it XylU, of the upper pathway flux (Eq. 9, Table 7).
XylRarXylRir RXylRXylR −31
XylRakXylRa−
113
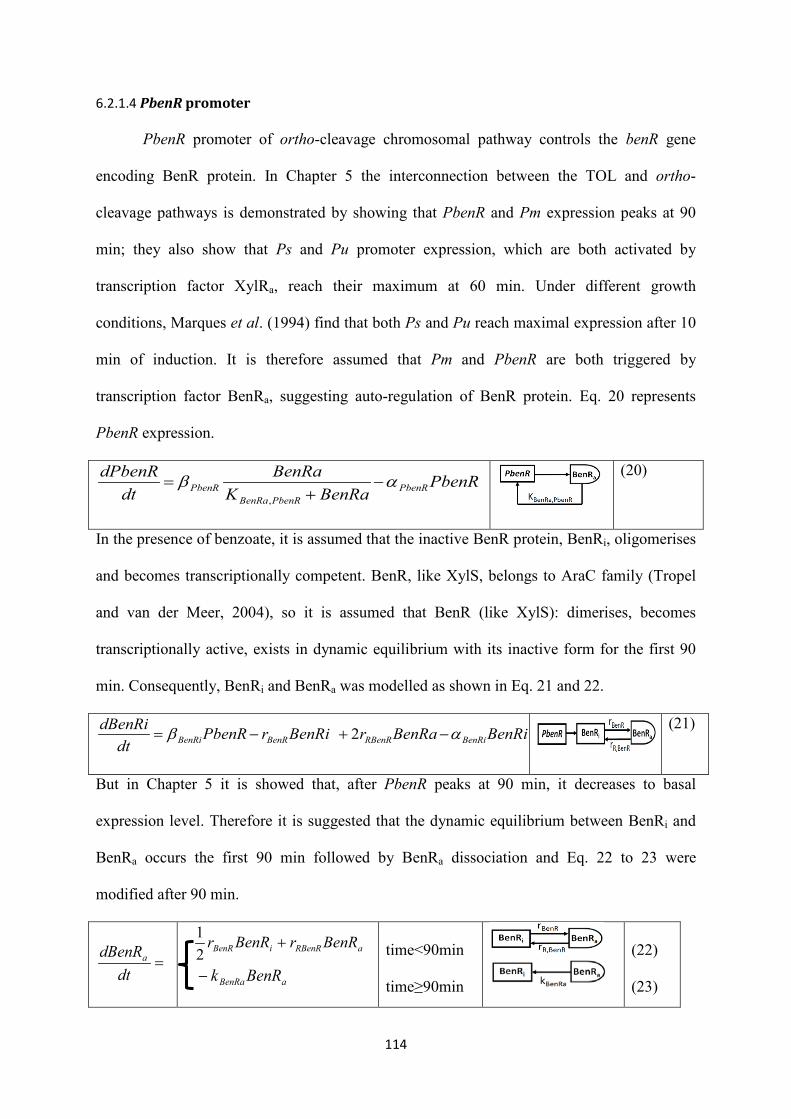
6.2.1.4 PbenR promoter
PbenR promoter of ortho-cleavage chromosomal pathway controls the benR gene
encoding BenR protein. In Chapter 5 the interconnection between the TOL and ortho-
cleavage pathways is demonstrated by showing that PbenR and Pm expression peaks at 90
min; they also show that Ps and Pu promoter expression, which are both activated by
transcription factor XylRa, reach their maximum at 60 min. Under different growth
conditions, Marques et al. (1994) find that both Ps and Pu reach maximal expression after 10
min of induction. It is therefore assumed that Pm and PbenR are both triggered by
transcription factor BenRa, suggesting auto-regulation of BenR protein. Eq. 20 represents
PbenR expression.
(20)
In the presence of benzoate, it is assumed that the inactive BenR protein, BenRi, oligomerises
and becomes transcriptionally competent. BenR, like XylS, belongs to AraC family (Tropel
and van der Meer, 2004), so it is assumed that BenR (like XylS): dimerises, becomes
transcriptionally active, exists in dynamic equilibrium with its inactive form for the first 90
min. Consequently, BenRi and BenRa was modelled as shown in Eq. 21 and 22.
(21)
But in Chapter 5 it is showed that, after PbenR peaks at 90 min, it decreases to basal
expression level. Therefore it is suggested that the dynamic equilibrium between BenRi and
BenRa occurs the first 90 min followed by BenRa dissociation and Eq. 22 to 23 were
modified after 90 min.
time<90min time≥90min
(22) (23)
PbenRBenRaK
BenRadt
dPbenRPbenR
PbenRBenRaPbenR aβ −
+=
,
BenRiBenRarBenRirPbenRdt
dBenRiBenRiRBenRBenRBenRi aβ −+−= 2
=dt
dBenRaaRBenRiBenR BenRrBenRr +
21
aBenRa BenRk−
114

6.2.1.5 Pm promoter
Pm promoter controls TOL meta-operon expression. As modelled by Koutinas et al.
(2011) (Eq. 10, Table 7), the TOL up-regulator of Pm, XylS, becomes active upon toluene
entry and binds Pm (Dominguez-Cuevas et al., 2008). To extend the Koutinas et al. (2011)
model, toluene entry induces benzoate formation; benzoate transforms BenR into the active
BenRa, BenRa up-regulates the meta-operon and therefore Pm. So the Koutinas et al. (2011)
Pm function was modified to capture both BenRa and XylSa proteins. In Chapter 5 it is
observed an oscillatory behaviour for toluene concentrations higher than 0.9mM; in this
Chapter it is proposed a descriptive scenario and an associated model. The Pm expression is
described in Eqs. 24 and 25; the oscillatory behaviour is explained in Section 4.3.1.5.1.
t<90 min and toluene<0.9mM t≥90 min and toluene≥0.9mM
(24) (25)
Meta-operon encodes for enzymes catabolizing benzoate into Krebs cycle metabolites
through the TOL pathway. Similarly to upper operon enzymes, it is assumed that an enzyme
synthesised by the meta-operon is rate-limiting, naming it XylM (Eq. 11, Table 7).
6.2.1.5.1 Oscillatory Pm behaviour
There is no existing biological explanation for specific Pm oscillatory activity in the
literature, so the consequences of a scenario where Pm participates in a negative feedback
loop (Alon, 2006) with 2 transcription factors (R and I) of another pathway(s) is proposed
and explored. In a scenario based on Ferrell et al. (2011): transcription factor R down-
regulates Pm expression; I is between Pm and R. Pm up-regulates I gene expression, leading
dtdPm
PmBenRK
BenRXylSK
XylSPm
aPmBenR
a
aPmXylS
aPm
i
aβ −++ ,
nna
na
KRRPma
111 +
− β
115
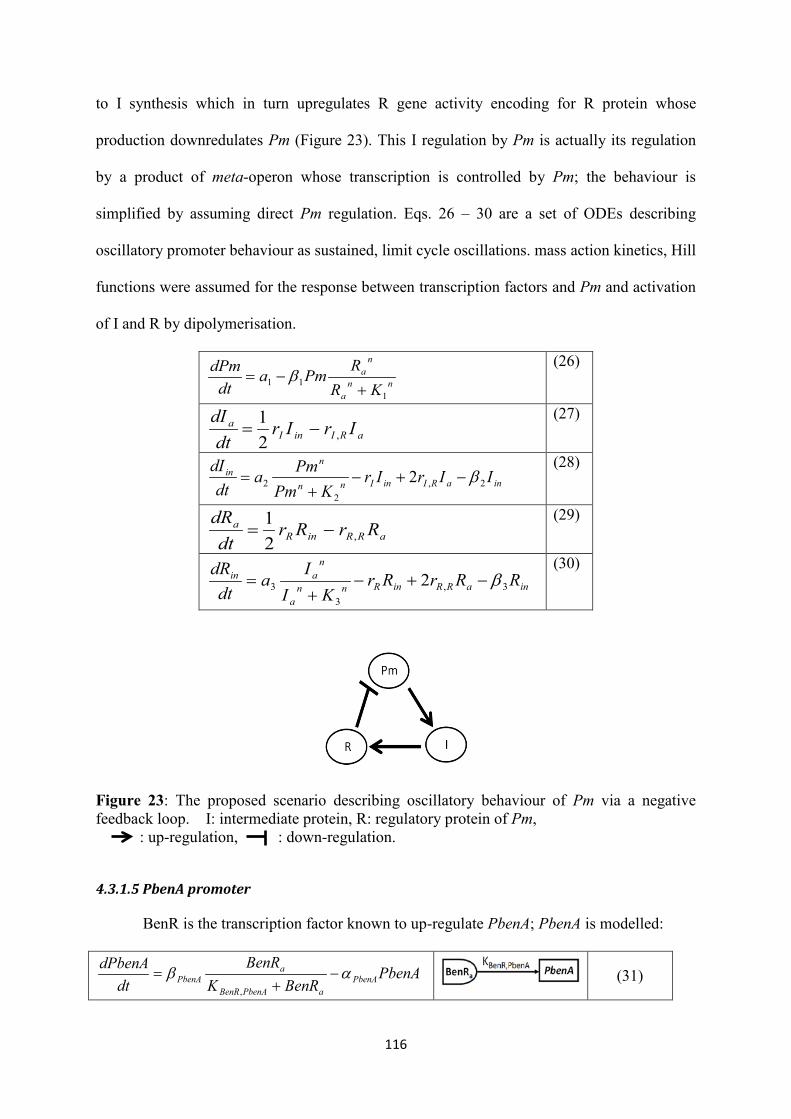
to I synthesis which in turn upregulates R gene activity encoding for R protein whose
production downredulates Pm (Figure 23). This I regulation by Pm is actually its regulation
by a product of meta-operon whose transcription is controlled by Pm; the behaviour is
simplified by assuming direct Pm regulation. Eqs. 26 – 30 are a set of ODEs describing
oscillatory promoter behaviour as sustained, limit cycle oscillations. mass action kinetics, Hill
functions were assumed for the response between transcription factors and Pm and activation
of I and R by dipolymerisation.
(26)
(27)
(28)
(29)
(30)
Figure 23: The proposed scenario describing oscillatory behaviour of Pm via a negative feedback loop. I: intermediate protein, R: regulatory protein of Pm, : up-regulation, : down-regulation.
4.3.1.5 PbenA promoter
BenR is the transcription factor known to up-regulate PbenA; PbenA is modelled:
(31)
nna
na
KRRPma
dtdPm
111
+−= β
aRIinIa IrIr
dtdI
,21
−=
inaRIinInn
nin IIrIr
KPmPma
dtdI
2,2
2 2 β−+−+
=
aRRinRa RrRr
dtdR
,21
−=
inaRRinRnna
nain RRrRr
KIIa
dtdR
3,3
3 2 β−+−+
=
PbenABenRK
BenRdt
dPbenAPbenA
aPbenABenR
aPbenA aβ −
+=
,
116

PbenA activation controls ben operon expression (benABCDKX) (Silva-Rocha and de
Lorenzo, 2012a); the ben operon encodes for ben pathway enzymes which catalyse benzoate
transformation to catechol on the ortho-cleavage pathway. Catechol formation triggers cat
genes activation of the ortho-cleavage pathway and thereby further catabolises benzoate and
results in Krebs cycle intermediates by the ortho-cleavage pathway (Parsek et al., 1994).
Therefore, it is assumed that a ben operon enzyme is rate-limiting of the pathway flux, calling
it BenB. BenB is mathematically represented as shown in Eq. 32:
BenBaPbenAdt
dBenBBenBBenB −= β (32)
6.2.2 Mathematical modelling of lag/adaptation phase
Limited physiological knowledge renders developing biologically relevant lag phase
model equations challenging. Most mathematical definitions for lag phase are mathematic or
geometric (Baranyi, 2002; McKellar, 1997); it is proposed a simple but effective adaptation
phase duration representation based on maximum expression of the promoters controlling
toluene bioconversion (Chapter 5):
(33)
where mTOL is the time point (60 min) where the Pu promoter of TOL peaks, mchrom is the
time point (90 min) where the PbenR promoter of ortho-cleavage pathway of chromosome,
which interacts with TOL, peaks and tolINI is the initial toluene concentration in total count.
Linear Eq. 33 indicates, at least for this system, that lag phase duration can be estimated
using the time point where key promoters are maximally expressed, demonstrating the critical
role of promoters’ kinetics to the bioprocess.
INIchromTOL tolmm *+=λ
117

6.2.3 Linking growth kinetics to promoters’ expression
Starting with the Koutinas et al. (2011) model linking genetic and macroscopic
events, the ortho-cleavage pathway was integrated and changed the model as noted in Section
4.3.1. The genetic circuit model predicts the rate-limiting enzyme synthesis of upper, meta-
and ben- pathways. The upper pathway converts toluene to benzoate and further catabolises
benzoate; therefore toluene degradation rate is expressed as a function of rate-limiting
enzyme XylU whose synthesis is driven by the upper operon promoter, Pu (Eq. 12, Table 7).
Furthermore, benzoate formation activates meta- and ortho-pathways that synthesise the
necessary enzymes to further catabolise benzoate into Krebs cycle intermediates utilised for
biomass growth. Thus, the Koutinas et al. (2011) specific growth rate expression has been
modified (Eq. 13, Table 7) to consider the rate limiting enzymes coded by both meta and ben
operon (Eq. 34). The specific growth rate predicts the rate of biomass growth modelled by
Koutinas et al. (2011) (Eq. 14, Table 7) including the decay rate (Eq. 15, Table 7).
(34)
6.3 Results
6.3.1 Rationale of model analysis The parameter estimation method is presented in 3.6.2 section. The experiments
used are: Pr, Ps, Pu, Pm, PbenR, PbenA expression, toluene degradation and biomass growth
at 1mM initial toluene concentration until toluene depletion.
The model prediction efficacy was demonstrated by applying the Table 9 parameter
values to the model with initial toluene concentrations 0.4mM, 0.7mM and 1.2mM,
BenBKBenB
XylMKXylM
bBenBbXylMb ++
=,,
βm
118

6.3.1.1 Global sensitivity analysis
The GSA results demonstrate that, for Pr, Ps, Pu and PbenR and PbenA promoters,
the most significant parameters are the ones associated with their expression and the
parameters related to XylR and BenR synthesis for TOL and chromosomal parameters,
respectively. The BenR synthesis parameters are the most important for accurately expressing
Pm, toluene and biomass concentration; this corroborates the importance of ortho-cleavage
pathway to model the transcriptional regulation and microbial growth kinetics. GSA
initialises the parameter estimation; the most significant are prioritised as defined by GSA.
The 37 parameters examined, following GSA the average of the SIs higher than 0.1 is
calculated and the most significant parameters are presented graphically in Table 8, the
analytical results are presented in Figure 24. In Table 8 the SIs close to and higher than 0.1
are pointed out with grey. Following GSA the parameters are estimated based on 1mM initial
toluene concentration experiments.
Table 8: The parameters of GSA and the most significant ones for each variable (output) outputs inputs Pr Ps Pu Pm PbenR PbenA toluene biomass βXylRi 0.088 0.088 rR,XylR 0.079 0.079 αXylRi 0.066 0.066 KXylRa βPr 0.796 KXylRi αPr 0.150 βPu 0.448 KXylRa,Pu 0.107 αPu 0.174 βXylU αXylU βPs 0.448 KXylRa,Ps 0.107 αPs 0.174 βXylSi rR,XylS
119
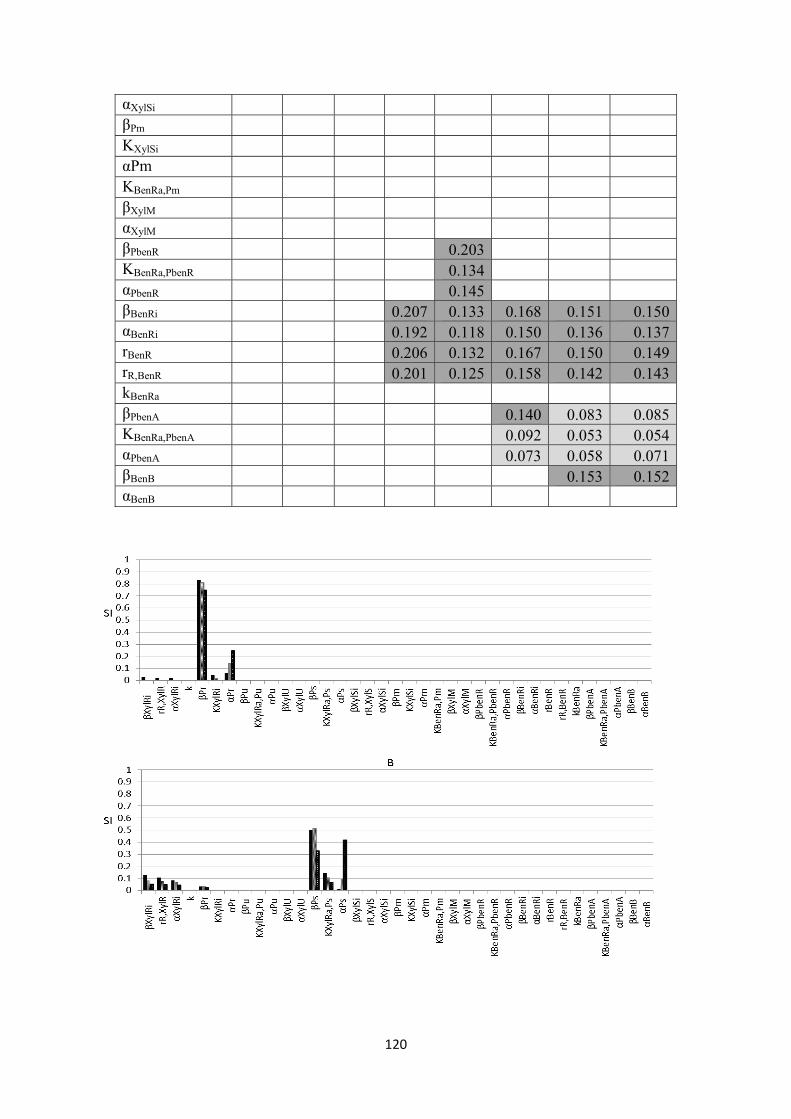
120

121

6.3.1.2 Parameter estimation
6.3.1.2.1 Genetic circuit model
122
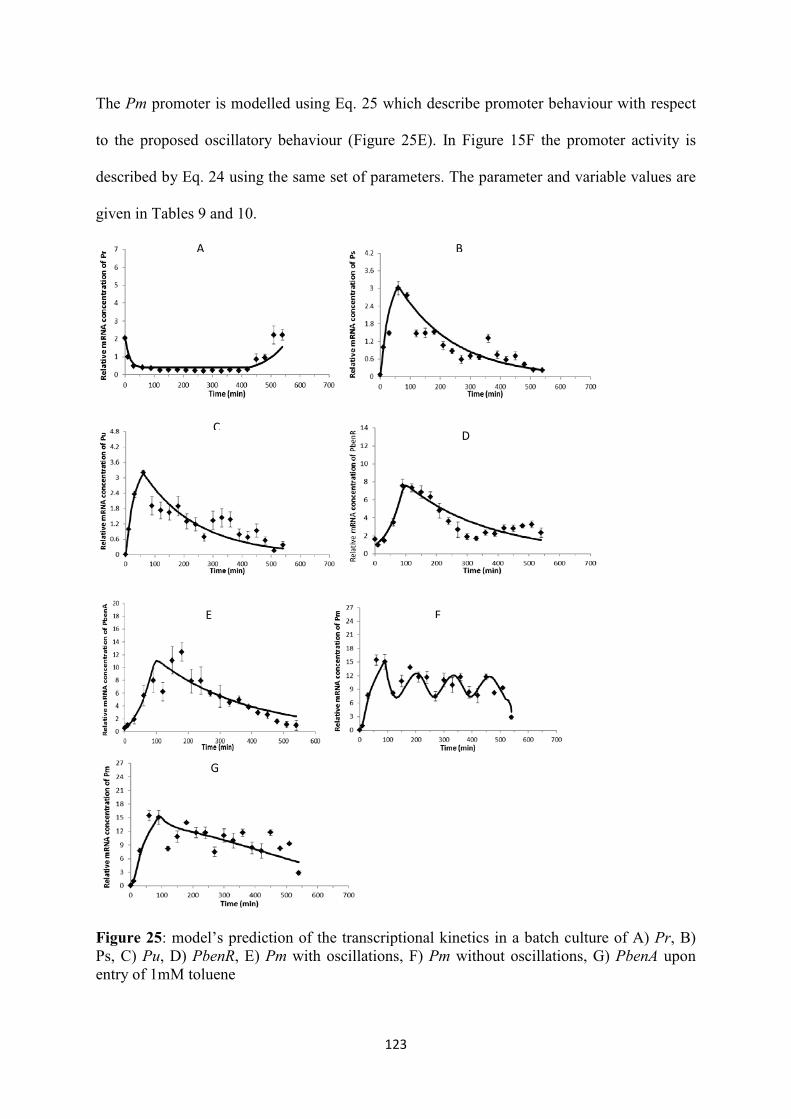
A
G
FE
D C
B
123

6.3.1.2.2 Rate limiting enzymes
B A
124

6.3.1.2.3 Growth kinetics
A B
C
125
lTOL time at which Pu expression peaks 60 min lchrom time at which PbenR expression peaks 90 min
λ Lag/adaptation phase min MWtoluene Molecular weight of toluene 92.14 g mol-1
bXylRi maximum Pr promoter mRNA translation rate 9.504 mM h-1 rXylR oligomerisation constant of XylR h-1
rR,XylR dissociation constant of XylR 6.998 h-1
aXylRi XylRi degradation and dilution due to cellular
volume increase 1 h-1
bPr maximal expression level of Pr 0.012 h-1 KXylRi repression coefficient of Pr 11.035 mM kXylRa dissociation of XylRa to XylRi 11.778 h-1
aPr mRNA degradation rate of Pr 0.062 h-1 bPu maximal expression level of Pu 0.504 h-1
KXylRa,Pu activation coefficient of Pu by XylRa 17.251 mM aPu mRNA degradation rate of Pu 0.005 h-1 bPs maximal expression level of Ps 0.488 h-1
KXylRa,Ps activation coefficient of Pu by XylRa 17.251 mM aPs mRNA degradation rate of Ps 0.005 h-1
bXylSi translation rate based on Ps mRNA 44.532 mM h-1 rXylS oligomerisation constant of XylS h-1
rR,XylS dissociation constant of XylS 0.631 h-1
aXylSi XylSi degradation and dilution due to cellular
volume increase 0.5 h-1
bPm maximal expression level of Pm 0.65 h-1 KXylSi activation coefficient of Pm by XylSi 33.102 mM aPm mRNA degradation rate of Pm 0.042 h-1
KBenRa,Pm activation coefficient of Pm by BenR 22.649 mM bPbenR maximum PbenR promoter mRNA expression 0.742 h-1
KBenRa,PbenR activation coefficient of Pu by XylRa 10.175 mM aPbenR mRNA degradation rate of PbenR 0.004 h-1 bBenRi maximal translation rate of BenRi 4.83 mM h-1
aBenRi BenRi degradation and dilution due to cellular
volume increase 1 h-1
rBenR oligomerisation constant of BenR h-1 rR,BenR dissociation constant of BenR 0.891 h-1 kBenRa dissociation of BenRa to BenRi 0.203 h-1 bPbenA maximum PbenA promoter mRNA expression 0.791 h-1
KBenRa,PbenA activation coefficient of PbenA by BenRa 6.551 mM aPbenA mRNA degradation rate of PbenA 0.003 h-1 bBenB translation rate based on PbenA mRNA 0.828 mM h-1
aBenB BenB degradation and dilution due to cellular volume increase 0.002 h-1
aXylU XylU degradation and dilution due to cellular volume increase 0.0009 h-1
bXylU translation rate based on Pu mRNA 1.921 mM h-1
bXylU,toluene maximum toluene metabolic quotient based 0.0003 gtol gbiomass h-1
126

on XylU
KXylU,toluene saturation constant for XylU 3.863 mM dmax maximum decay rate 0.009 h-1
Kd decay saturation constant 12.95 mM
aXylM XylM degradation and dilution due to cellular volume increase 0.005 h-1
bXylM translation rate based on Pm mRNA 3.356 mM h-1
bb maximum specific growth rate of biomass
based on XylM 0.0005 h-1
KXylM,b saturation constant of XylM 25.103 mM KBenB,b saturation constant of BenB 21.715 mM
rI oligomerisation constant of Ii 7.845 h-1 rI,R dissociation constant of Iα 0.112 h-1 rR oligomerisation constant of Ri 8.294 h-1
rR,R dissociation constant of Rα 0.063 h-1 n hill coefficient 8 n/a
α1 constant rate of activation of Pm by the new
intermediate pathway 0.144 mM h-1
α2 constant rate of activation of I by Pm 1.511 mM h-1 α3 constant rate of activation of R by I 1.62 mM h-1 b1 maximal translation rate based of Rα 48 mM h-1 b2 maximal translation rate based of Iin 8.47 mM h-1 b3 maximal translation rate based of Rin 5.12 mM h-1 K1 activation coefficient of Rα 0.131 mM Κ2 activation coefficient of Pm 5.645 mM Κ3 activation coefficient of Iα 13.011 mM
Table 10 : Symbol, description, initial values and units of the variables of the model XylRi inactive form of XylR protein 1 mM XylRa Active form of XylR protein 0 mM
Pr Pr promoter 2.03 mM Pu Pu promoter 0.006 mM
XylU Rate-limiting enzyme of upper-operon 0 mM Ps Ps promoter 0.013 mM
XylSi inactive form of XylS 1 mM XylSa active form of XylS 0 mM
Pm Pm promoter 0.035 mM XylM Rate-limiting enzyme of meta-operon 0 mM PbenR PbenR promoter 0.999 mM BenRa active form of BenR protein 0 mM BenRi Inactive form of BenR protein 1 mM PbenA PbenA promoter 0.546 mM BenB Rate-limiting enzyme of ben operon mM
tol toluene concentration 0.95 mM m Specific growth rate h-1
127
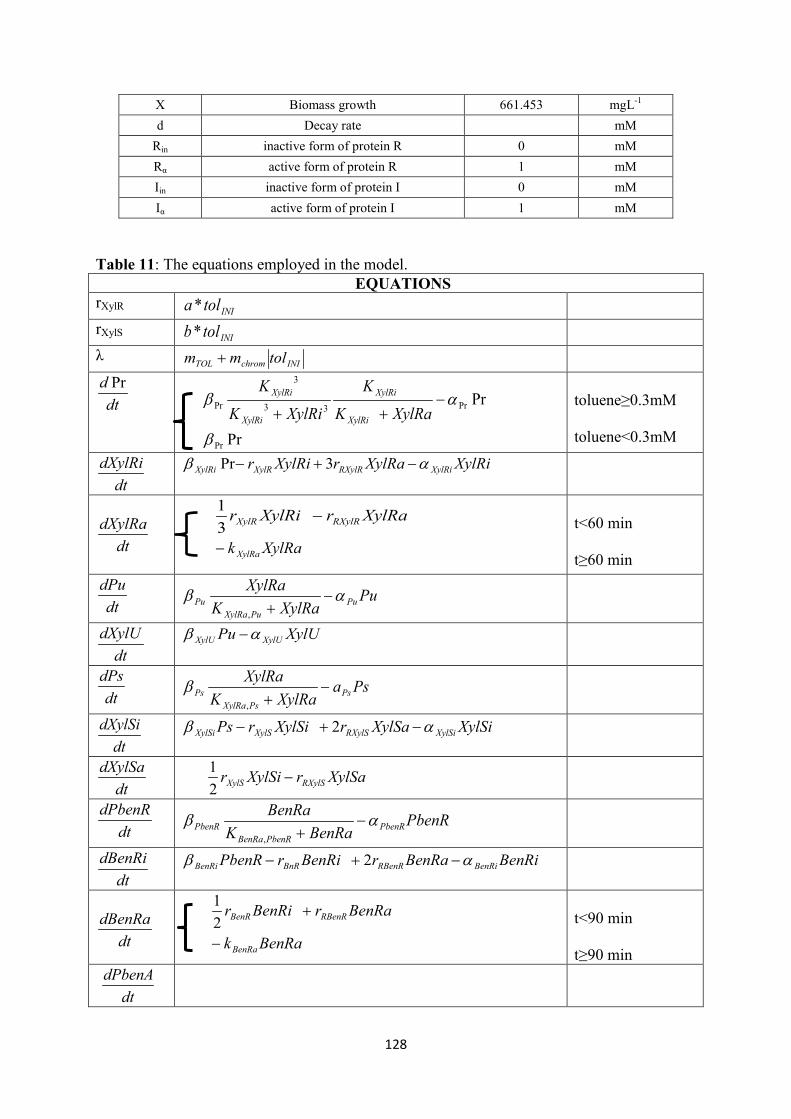
X Biomass growth 661.453 mgL-1
d Decay rate mM Rin inactive form of protein R 0 mM Rα active form of protein R 1 mM Iin inactive form of protein I 0 mM Iα active form of protein I 1 mM
Table 11: The equations employed in the model. EQUATIONS rXylR INItola *
rXylS INItolb*
λ INIchromTOL tolmm +
PrPrβ
toluene≥0.3mM toluene<0.3mM
t<60 min t≥60 min
t<90 min t≥90 min
dtd Pr
PrPr33
3
Pr aβ −++ XylRaK
K
XylRiK
K
XylRi
XylRi
XylRi
XylRi
dtdXylRi XylRiXylRarXylRir XylRiRXylRXylRXylRi aβ −+− 3Pr
dtdXylRa XylRarXylRir RXylRXylR −
31
XylRak XylRa−
dtdPu
PuXylRaK
XylRaPu
PuXylRaPu aβ −
+,
dtdXylU XylUPu XylUXylU aβ −
dtdPs
PsaXylRaK
XylRaPs
PsXylRaPs −
+,
β
dtdXylSi XylSiXylSarXylSirPs XylSiRXylSXylSXylSi aβ −+− 2
dtdXylSa XylSarXylSir RXylSXylS −
21
dtdPbenR
PbenRBenRaK
BenRaPbenR
PbenRBenRaPbenR aβ −
+,
dtdBenRi BenRiBenRarBenRirPbenR BenRiRBenRBnRBenRi aβ −+− 2
dtdBenRa BenRarBenRir RBenRBenR +
21
BenRakBenRa−
dtdPbenA
128

t<90 min and toluene<0.9mM t≥90 min and toluene≥0.9mM
6.3.2 Predictive capability of the model
The predictive ability of the model was considered for initial toluene concentrations
0.4 mM, 0.7 mM, 1.2 mM. Section 6.3.2.1 presents the genetic circuit model results, Section
6.3.2.2,3 discusses the model protein prediction and rate-limiting enzymes, Section 6.3.2.4
predicts toluene utilisation and biomass formation patterns.
6.3.2.1 Genetic circuit model
For every initial toluene concentration, the genetic circuit model reproduces the
magnitude and trend of all six promoters and recognises the different initial conditions. The
statistical R2 analysis (Table 12) demonstrates the goodness of fit of the model except for the
last points. A lower R2 was observed at the last 2, 3 and 1 points out of 12, 15 and 23 upon
0.4, 0.7 and 1.2mM toluene entry to the cells, respectively.
PbenAXylSK
XylSBenRK
BenRPbenA
aPbenAXylSa
a
aPbenABenR
aPbenA
a
aβ −++ ,,
dtdBenB BenBPbenA BenBBenB aβ −
dtdPm Pm
BenRKBenR
XylSKXylS
PmaPmBenR
a
aPmXylS
aPm
i
aβ −++ ,
nna
na
KRRPma
111 +
− β
dtdXylM XylMPm XylMXylM aβ −
dtdtol
XXylUK
XylUMW tolXylU
tolXylU
tol +−
,
,1 β
m BenBKBenB
XylMKXylM
bBenBbXylMb ++ ,,
β
dtdX Xd )( −m
d tolKdtold+
max
129

6.3.2.1.1 Entry of 0.4mM toluene
A
FE
D C
B
130

6.3.2.1.2 Entry of 0.7mM of toluene
A
FE
D C
B
131
6.3.2.1.3 Entry of 1.2mM toluene
Pr, Ps and Pu activity was predicted within the 95% CI except for the last 3 (out of
23) points of Pr where the predicted data was 26% lower than the lower limit of 95% CI of
experimental data (Figure 30A, B, C). PbenR predicted behaviour is within the 95% CI at the
beginning and the end of the process, however the mid points are 42% higher than the highest
limit of 95% CI of experimental data (Figure 30D). Although the model could predict the
oscillatory behaviour of Pm (Figure 30E) the unstable amplitude of the experimental
oscillations resulted in 45% discrepency between the lower 95% experimental data CI and the
model towards the end of the bioprocess. Not taking into account the oscillatory behaviour
(Figure 30F), the behaviour of Pm could be predicted more accurately at the beginning of the
process compared to the last points which were 35% under the lower limit of 95% CI of
experimental data. In both cases, the maximal level of expression was predicted 34% higher
than the 95% CI. The PbenA activity was reproduced within the 95% CI however there is a
difference between the predicted and experimental peak (Figure 30G).
132

A
D C
B
133

Table 12: Coefficient of determination (R2) of the vector: Pr, Ps, Pu, Pm, PbenR, PbenA between the experimental and model predicted data at each time point with 0.4, 0.7, 1, 1.2 mM initial toluene concentration.
Time (min)
0.4mM 0.7mM 1mM oscillations no oscillations
1.2mM oscillation no oscillations
0 1.000 1.000 1.000 1.000 1.000 1.000 10 1.000 1.000 1.000 1.000 1.000 1.000 30 0.907 0.913 0.980 0.980 0.974 0.968 60 0.857 0.907 0.991 0.991 0.876 0.883 90 0.836 0.884 0.976 0.976 0.891 0.892 120 0.962 0.956 0.815 0.881 0.642 0.971 150 0.998 0.897 0.977 0.948 0.656 0.931 180 0.963 0.771 0.967 0.959 0.752 0.704 210 0.990 0.879 0.996 0.999 0.872 0.854 240 0.968 0.916 0.995 0.995 0.827 0.833 270 0.598 0.762 0.998 0.952 0.752 0.809 300 0.006 0.959 0.994 0.994 0.728 0.855 330 0.011 0.992 0.987 0.832 0.810 360 0.304 0.992 0.979 0.906 0.823 390 0.340 0.989 0.996 0.871 0.846 420 0.995 0.988 0.717 0.831 450 0.990 0.909 0.800 0.724 480 0.977 0.909 0.928 0.763 510 0.910 0.820 0.926 0.769 540 0.592 0.562 0.844 0.772 570 0.910 0.757 600 0.958 0.752 630 0.244 0.252
134

6.3.2.2 Prediction of proteins
A
F E
D C
B
135

6.3.2.3 Prediction of rate-limiting enzymes
C
B A
D
136

6.3.2.4 Predicting Growth kinetics
At 0.4mM initial toluene concentration, Pu under-prediction, which is the controller
of the upper pathway rate-limiting enzyme responsible for toluene transformation, resulted in
30% underestimation of toluene consumption pattern (Figure 33A). The biomass growth was
predicted accurately within 95% CI of experimental data (Figure 33B). Upon 0.7mM initial
concentration the pattern of toluene utilisation and biomass growth are predicted accurately
(Figure 33C, D). The entry of 1.2mM toluene lead to adequately predicting the toluene
utilisation pattern (Figure 33E). The biomass growth was predicted 3% lower than the lower
95% CI of experimental data, due to the mis-prediction of Pm and PbenA, which are the
driven promoters of the meta and ben pathways rate-limiting enzymes responsible for
biomass formation (Figure 33F). The under-prediction of toluene consumption pattern at
0.4mM and biomass growth pattern at 1.2mM due to mis-prediction of the relevant promoters
highlights the link between the genetic information and the bioprocess. The R2 between the
experimental and predicted patterns was higher than 0.92 in all cases (Table 13)
demonstrating the efficient predictive ability of the hybrid model. The lag phase duration was
accurately predicted at all initial toluene concentrations.
137
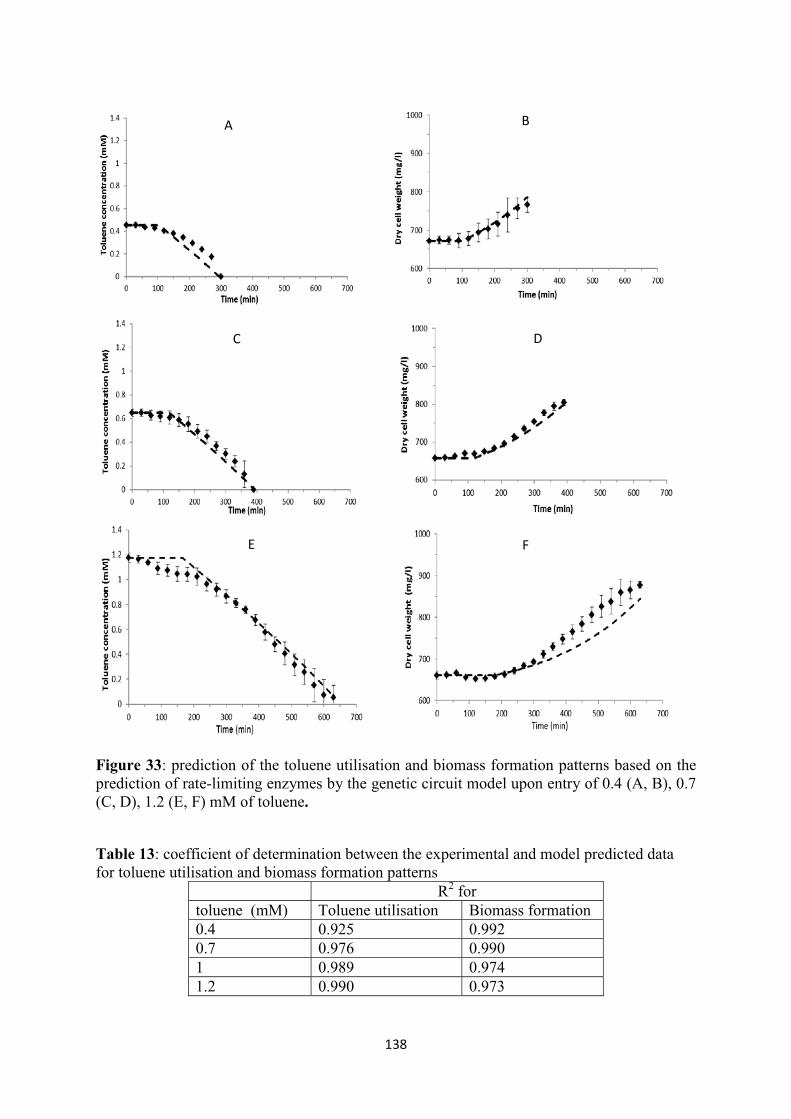
A
F E
D C
B
138
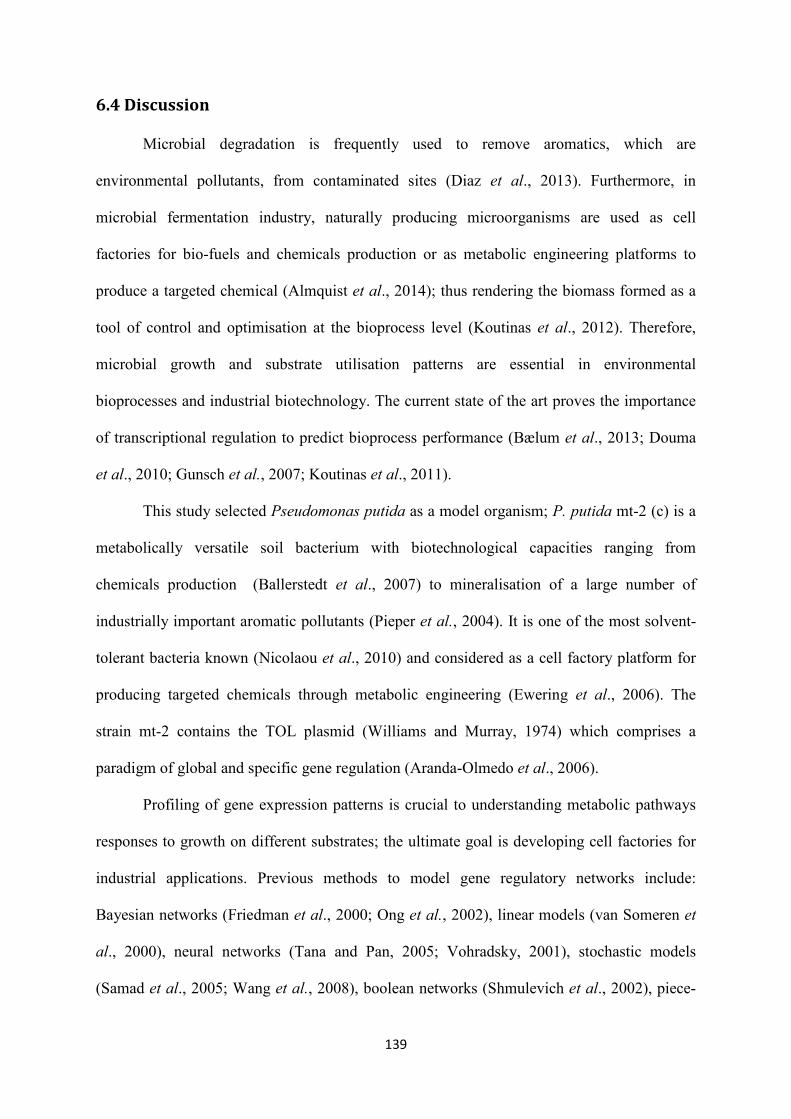
6.4 Discussion
Microbial degradation is frequently used to remove aromatics, which are
environmental pollutants, from contaminated sites (Diaz et al., 2013). Furthermore, in
microbial fermentation industry, naturally producing microorganisms are used as cell
factories for bio-fuels and chemicals production or as metabolic engineering platforms to
produce a targeted chemical (Almquist et al., 2014); thus rendering the biomass formed as a
tool of control and optimisation at the bioprocess level (Koutinas et al., 2012). Therefore,
microbial growth and substrate utilisation patterns are essential in environmental
bioprocesses and industrial biotechnology. The current state of the art proves the importance
of transcriptional regulation to predict bioprocess performance (Bælum et al., 2013; Douma
et al., 2010; Gunsch et al., 2007; Koutinas et al., 2011).
This study selected Pseudomonas putida as a model organism; P. putida mt-2 (c) is a
metabolically versatile soil bacterium with biotechnological capacities ranging from
chemicals production (Ballerstedt et al., 2007) to mineralisation of a large number of
industrially important aromatic pollutants (Pieper et al., 2004). It is one of the most solvent-
tolerant bacteria known (Nicolaou et al., 2010) and considered as a cell factory platform for
producing targeted chemicals through metabolic engineering (Ewering et al., 2006). The
strain mt-2 contains the TOL plasmid (Williams and Murray, 1974) which comprises a
paradigm of global and specific gene regulation (Aranda-Olmedo et al., 2006).
Profiling of gene expression patterns is crucial to understanding metabolic pathways
responses to growth on different substrates; the ultimate goal is developing cell factories for
industrial applications. Previous methods to model gene regulatory networks include:
Bayesian networks (Friedman et al., 2000; Ong et al., 2002), linear models (van Someren et
al., 2000), neural networks (Tana and Pan, 2005; Vohradsky, 2001), stochastic models
(Samad et al., 2005; Wang et al., 2008), boolean networks (Shmulevich et al., 2002), piece-
139

wise linear (Gebert et al., 2007; Mestl et al., 1995) and ordinary differential equations (Alon,
2006; Santillan, 2008). Depicting large metabolic networks, such as a microorganism genome
is achieved using mainly flux balance analysis (FBA) focusing on genetic reactions
stoichiometry (Österlund et al., 2012). Genome-scale modelling was employed to P. putida
(Nogales et al., 2008b; Puchałka et al., 2008) due to the vast biotechnological potential of the
bacterium in bioremediation and fine and bulk chemicals production.
The TOL regulatory network of P. putida mt-2 has been previously modelled using
Boolean formalisms (Silva-Rocha et al., 2011b). Boolean theory (Kauffman, 1993) yields
insights into gene network activity, elucidating fundamental behaviour principles
(Shmulevich et al., 2002). But a Boolean approach excludes quantitative biochemical details
such as: varying transcription rates of different genes, variability in mRNA stability (Carrier
and Keasling, 1997) and degradation of mRNA (Hatzimanikatis and Lee, 1999).
In this Chapter, using the same strain, a continuous approach was followed employing
ordinary differential equations (ODEs) to model (Koutinas et al., 2010) the interdependent
gene regulatory network of TOL and ortho-cleavage pathways, thus enabling the description
of instantaneous gene expression changes (Karlebach and Shamir, 2008). ODEs are utilised
in small metabolic systems mainly due to the partial knowledge of parameters, not fully
identification of molecular mechanisms, and intricacy in the analysis of nonlinear differential
equations (Koutinas et al., 2011).
The consistent study of promoters’ behaviour upon P. putida mt-2 induction with
toluene at a broad range of concentrations revealed the dependence of the promoters
expression level to the effector amount added in the bacterial culture (Chapter 5). This
demonstrated dependence was expressed in the model in Eqs 18, 19. The current model was
constructed from first principles. However through experimental observation (Chapter 5),
despite the different initial toluene level at each experiment, the behaviour of the promoters
140

presented a specific pattern and a switch in the expression at a specific time point. The switch
of the promoters’ behaviour was pointed out in Eqs 16, 17, 23, 25. However the current
modelling strategy, although efficiently predicting promoters behaviour at various initial
conditions, it cannot be used for other biological systems limiting the broad use of the model.
Another model limitation is the parameter estimation method in which it is assumed
independent, normally distributed measurement errors with zero means and constant variance
set at 0.1. However the variance could be calculated based on the experimental results of
Chapter 5. Consequently the estimated parameter values are based on assumptions and maybe
a different parameter estimation method could lead to different values.
Mathematical modelling gene regulatory systems is the result of time-series gene
expression data (Bar-Joseph et al., 2012) in conjunction with laborious macroscopic
measurements of substrate and biomass. Collecting experimental data in vivo is combined
with in silico approaches to model biological systems resulting in a closed loop approach
between in silico and in vivo. In a closed loop, developing a mathematical model describing
biological phenomena is followed by sensitivity analysis and parameter estimation. Once the
model is completed, its prediction capability is tested with independent experimental data.
This leads to a mathematical bioprocess representation with an adequate prediction capability
(Almquist et al., 2014; Kiparissides et al., 2011a; Kontoravdi et al., 2010).
6. 5 Conclusion
Understanding of the transcriptional regulation of the specific biosystem led to an
accurate coupled gene expression-microbial growth kinetic model. The hybrid model has
managed to reproduce promoters’ expression which controls the genes of the regulatory
networks, yielding to the prediction of the lag and exponential phase of biomass growth and
toluene utilisation patterns. The predictive ability of the model was tested and succeeded
141

under a broad range of initial conditions. Therefore accounting for quantitative information of
transcriptional regulation of targeted metabolic pathways to model microbial growth kinetics
is imperative to monitor the performance of bioprocesses enabling not only optimisation and
control of the bioprocess level but optimal production of bio-based chemicals through
metabolic engineering.
142

Chapter 7
7. Double substrate mechanistic microbial growth kinetics through
transcriptional regulation modelling in Pseudomonas putida mt-2 cell
cultures
The use of multiple substrates is beneficial in bioprocesses due to increased biomass growth
efficiency and productivity. However microbial growth kinetics models which monitor the
performance of the bioprocesses often fail in accurate prediction. The present growth kinetics
modelling approach focuses on transcriptional regulation understanding in order to describe
the substrates utilisation and biomass growth. The model pollutants mixture is m-xylene and
toluene which is degraded through the TOL plasmid and ortho-cleavage pathways of P.
putida mt-2. Various mixture concentrations are tested and the transcriptional kinetics of
TOL Pr, Ps, Pu, Pm and key ortho-cleavage PbenR, PbenA promoters are explored. In this
study, m-xylene is preferred by the cells, however below 0.2mM of this effector both
substrates are simultaneously utilised. Ps, Pu and Pm behaviour is bi-modal firstly activated
due to m-xylene. PbenR and PbenA are stimulated following Pu triggering which controls m-
xylene and toluene catabolism to m-methyl-benzoate and benzoate, respectively. Herein, it is
proven that m-methyl-benzoate is not an environmental stimulus for ortho- cleavage pathway
and PbenR is affected by carbon catabolite repression (CCR) mechanisms. Transcriptional
regulation is modelled resulting in a mechanistic microbial growth kinetics model verified by
global sensitivity analysis of the parameters which are experimentally determined. The model
is compared to commonly used Monod, Monod-type and enzyme interactions models for
double substrate utilisation underlying its superiority and the importance of taking into
account transcriptional regulation.
143

7.1 Introduction
Microbial utilisation of substrate mixtures is significant in biotechnology applications
such as fuels production from biomass and secondary metabolites production in
pharmaceutical applications (Lendenmann, 1994) and in bioremediation and wastewater
treatment of pollutants (Reardon et al., 2000) due to enhanced removal efficiency. Microbial
degradation of one compound in a mixture can strongly be affected by other substituents of
the mixture (Klecka and Maier, 1988; Saez and Rittmann, 1993). Understanding mixture
effects implies taking into consideration the metabolic role of each compound in the
microorganisms. However currently, little quantitative information is available regarding to
the cell metabolism upon substrate mixtures microbial utilisation (Rogers and Reardon,
2000).
Microbial degradation is a common research area due to pollutants impact on the
environment. However lab-scale biodegradation is usually studied focusing on single
substrate consumption although environmental contamination by a sole substrate is
uncommon. The patterns of multiple substrates degradation are complex and insight on these
kinetic interactions is necessary to allow a rational design of bioremediation schemes and
genetically engineered systems operation (Chang et al., 1993). The current state of the art for
microbial growth kinetics with multiple growth-supporting substrates is limited to simple
enzyme interactions or Monod and Monod-type models. However these models are empirical
and unstructured without accounting for substrates interactions. The models that account for
this type of interactions often contain terms describing the inhibition or enhancement of one
substrate’s consumption rate due to the presence of another (Yoon et al., 1977). But still, the
molecular interplays and transcriptional regulation caused by the presence of one substrate to
the other substrate biodegradation metabolic pathway as well as the substrate effect on its
own metabolic pathway are ignored and not addressed (Lee et al., 1993) and a mechanistic
144

insight is absent. Towards this direction single substrate growth kinetics were developed
accounting for enzyme activity by Douma et al. (2010) in fungus Penicillium chrysogenum.
Koutinas et al. (2011) modelled transcriptional regulation and built a microbial growth
kinetic model with sufficient predictive capability in Pseudomonas putida mt-2. The
Koutinas et al. (2011) model was extended and up-graded by adding more transcriptional
information and the model is capable of predicting pollutant biodegradation in P. putida mt-2
cell cultures under a broad range of initial conditions (Chapter 6).
P. putida mt-2 contains the TOL plasmid whose metabolic pathway degrades
aromatic compounds such as toluene, m- and p- xylene, pseudocumene, and m-ethyl-toluene
(Duetz et al., 1994). M-xylene and toluene are frequently used by the specific strain (Timmis,
2002). Upon simultaneous induction of an organic acid/glucose and a hydrocarbon in P.
putida mt-2 cultures the CCR mechanism is activated repressing TOL promoters expression
(Rojo, 2010). But activation of the TOL regulatory network when two preferred aromatic
compounds are present has not been studied yet. Both m-xylene and toluene entry results in
strongly cell preference of m-xylene than toluene (Duetz et al., 1998). Furthermore when
toluene is present ortho-cleavage pathway is activated due to benzoate formation by TOL
enzyme activity (Figure 34).
Herein the behaviour of all TOL (Pr, Ps, Pu, Pm) and the two key ortho-cleavage PbenR
and PbenA promoters upon activation due to both m-xylene and toluene entry is studied.
Based on the transcriptional kinetics, transcriptional regulation is modelled resulting in
microbial growth kinetics description for double substrate utilisation. The transcription
regulation-microbial growth kinetics model is analysed through global sensitivity analysis
and experimentally estimation of parameters. M-xylene is firstly consumed, TOL Ps, Pu, Pm
are activated upon m-xylene presence and re-activated when toluene catabolism starts while
PbenA environmental signal is only benzoate, a key intermediate formed upon toluene
145

degradation. The current microbial growth kinetics model more accurately predicts substrates
utilisation and biomass formation patterns compared to Monod, Monod-type and sum kinetics
competitive enzymatic interactions model.
Figure 34: The interlinked chromosomal ortho-cleavage and TOL genetic networks during m-xylene and toluene induction. The overimposed regulation of the promoters is additionally presented. Upon mixture entry the inactive form of XylR (XylRi) oligomerises forming the active molecule XylRa which activates Pu and Ps promoters. Both XylR forms down-regulate their own promoter, Pr. Upon Pu activation the upper operon encodes for the enzymes which catalyse m-xylene and toluene catabolism into m-methyl-benzoate and benzoate, respectively. Ps activation and these two intermediates lead to overexpression of the xylS gene dimerising the inactive XylS protein to the active protein form. XylS dimerisation activates Pm. Pm controls meta operon which produces the enzyme further catalysing m-methyl-benzoate and benzoate to Krebs cycle metabolites. In the chromosomal ortho-cleavage pathway PbenR controls benR gene transcription, which encodes for BenR protein. Benzoate activates BenR which up-regulates TOL Pm of TOL and ortho-cleavage PbenA. PbenA controls ben operon transcription which encodes for the enzymes responsible for further benzoate transformation to Krebs cycle intermediates. (A) The enzymes encoded in the upper operon sequentially transform m-xylene and toluene into m-methyl-benzoate and benzoate, respectively. M-methyl-benzoate is transformed into Krebs cycle intermediates through the action of the enzymes synthesised by the meta operon and benzoate is degraded to Krebs cycle metabolites through both meta and ortho enzymes activity. (B) Logic representation of the two pathways,
: input; : output; : AND; : OR; : NOT
146

7.2 Experimental Results
7.2.1 Evolution of m-xylene-toluene biodegradation and biomass growth
kinetics upon induction with different mixture concentrations
147
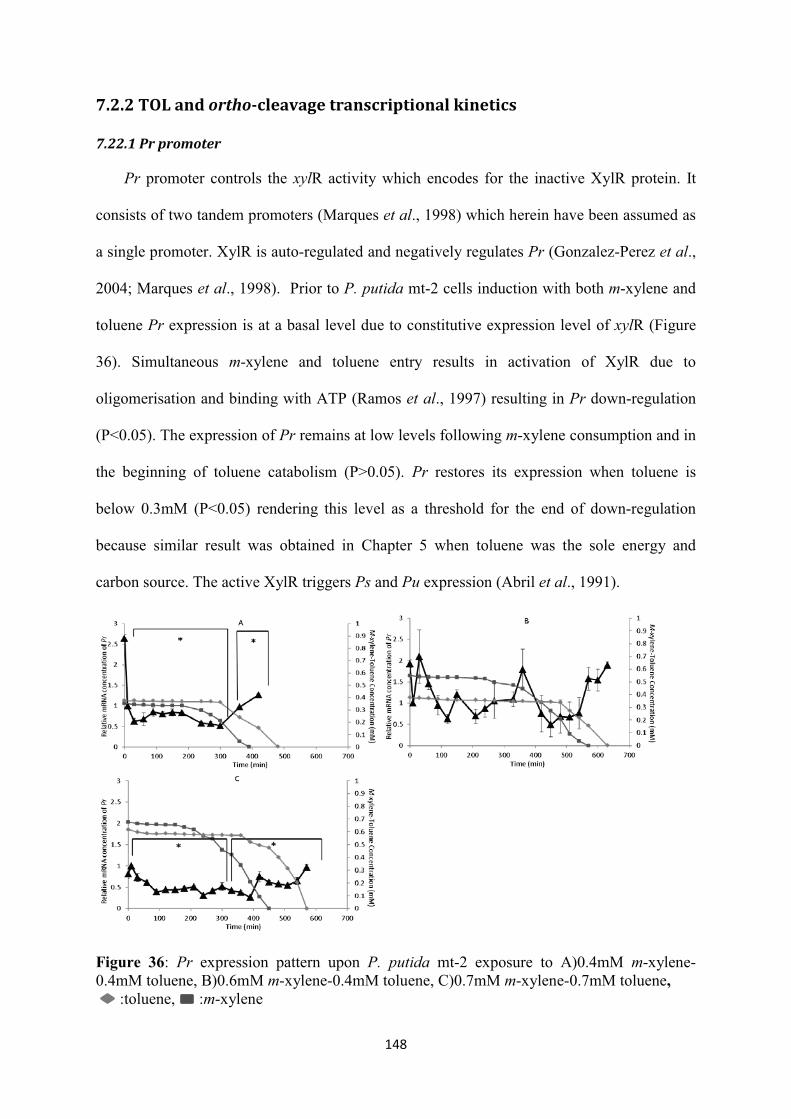
7.2.2 TOL and ortho-cleavage transcriptional kinetics
7.22.1 Pr promoter
148
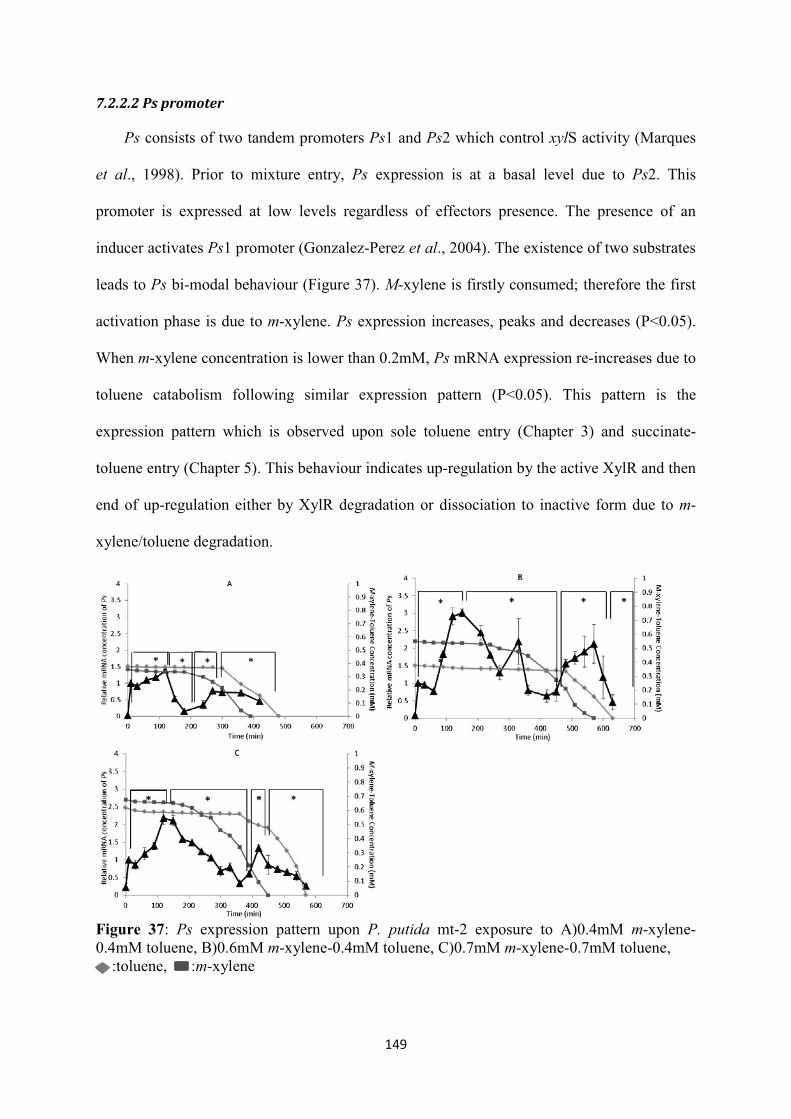
7.2.2.2 Ps promoter
149

7.2.2.3 Pu promoter
7.2.2.4 Pm promoter
150
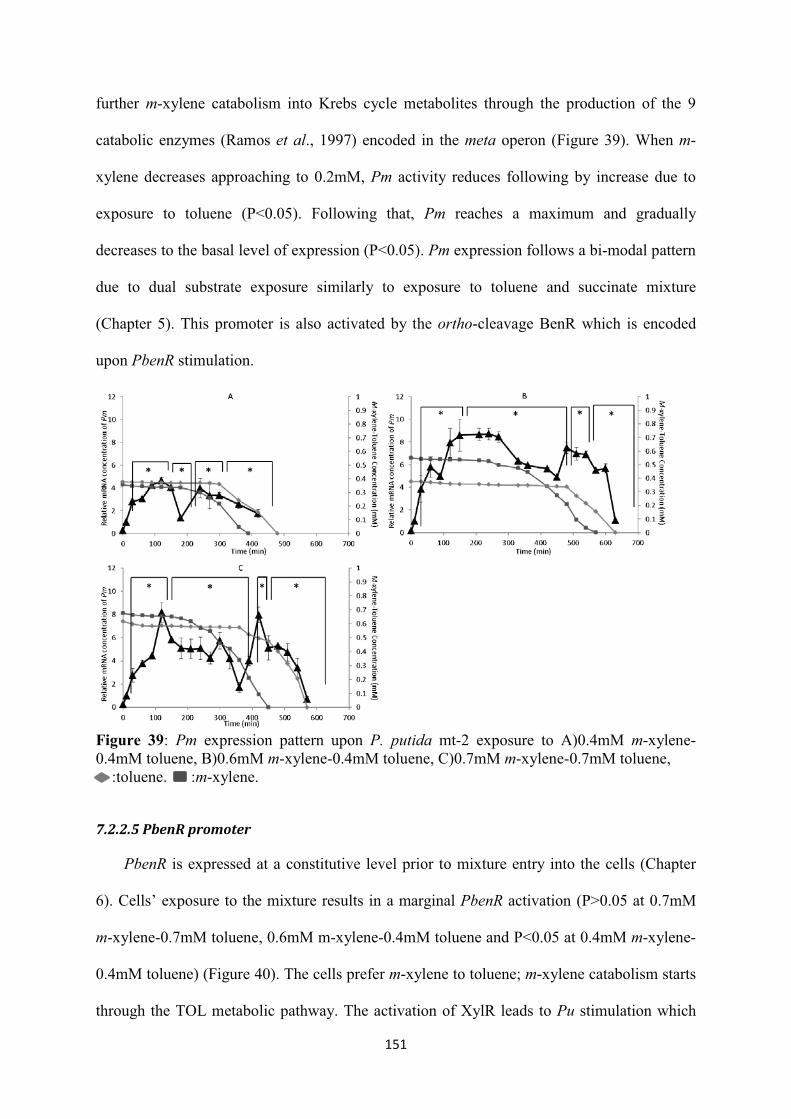
7.2.2.5 PbenR promoter
151

7.2.2.6 PbenA promoter
152

7.2.3 Lag/adaptation phase
153

cell membrane, disturbing the cytoplasmic membrane structure (Dominguez-Cuevas et al.,
2006; Sikkema et al., 1995). Subsequently xylene monooxygenease (XMO), a membrane-
bound enzyme found in P. putida mt-2 (Tizzard and Lloyd-Jones, 2007), which is responsible
for the initiation of pollutant’s catabolism, cannot be synthesised for a certain time period
(Buhler et al., 2006). The lag phase could also be caused due to the inhibition of protein
synthesis occurring when the culture is exposed to effectors which leads to protein synthesis
resumption and complete recovery after 1.5 to 3h of cultivation (Vercellone-Smith and
Herson, 1997).
However lag phase could also be caused due to over addition of bacteria in the
beginning of the pre-culture. Although, the growth conditions are similar for all three mixture
concentrations tested, at 0.4mM m-xylene-0.4mM toluene and 0.6mM m-xylene-0.4mM
toluene batch cultures, the lag phase was longer than 0.7mM m-xylene-0.7mM toluene;
exactly the opposite was expected. Therefore the quantity of bacteria added could be an
important factor causing delay in effectors degradation and biomass growth because
following 23h of pre-culturing the cells of the inoculum are already in stationary or even
death phase; thus in the fresh culture upon m-xylene and toluene entry longer time period is
needed for cells re-generation.
In Chapter 6 the close relationship between lag phase and transcriptional kinetics was
pointed out. Upon sole toluene entry Pu which controls substrate bioconversion reaches a
maximal expression level at a specific time point regardless of the initial toluene
concentration induced. Following that time point lag phase was ended faster at lower inducer
concentration taking into account the PbenR maximal expression time point which is strongly
activated due to benzoate formation. Subsequently lag phase can accurately be predicted
based on a linear mathematical relationship dependent on the time duration at which key
promoters’ peaks and the initial effector concentration (Chapter 6, Eq.33). In this study,
154

simultaneous m-xylene and toluene entry firstly results in m-xylene degradation; Pu reaches a
maximum at 120min regardless of the initial m-xylene concentration. Upper enzymes
activity, controlled by Pu, leads to m-methyl-benzoate which cannot strongly activate PbenR;
therefore Pu activity is more influential for lag phase duration. In every mixture tested lag
phase end followed the 120min. However the over-addition of bacteria in the pre-culture did
not allow the accurate prediction of lag phase. Despite that, one can realise that
transcriptional kinetics recoding and sufficient prediction of transcriptional regulation
patterns can contribute to lag phase estimation and a more mechanistic and biologically
relevant lag phase mathematical representation.
7.3 Mathematical modelling results
7.3.1 Genetic circuit
The model equations are similar to one substrate model (Table 15) except from the
switch point where the promoters change behaviour. In particular, from the beginning of the
process until m-xylene decrease to 0.2mM, promoters’ activity is stimulated due to m-xylene
effect. Following that threshold level promoters’ activity is triggered by toluene signalling.
Biomass growth is not influenced by this switch. This switch point influences the association
constants of the transcription factors XylR, XylS and BenR (Table 14) which in the current
model are calculated according to Koutinas et al. (2011) model (Chapter 6, Table 7). The
parameters and variables are described in Table 19, 20, respectively. Due to PbenA marginal
activation coming from m-xylene stimulus, the statistical insignificance of this trigger and the
fact that this activation results in a dead-end product PbenA expression is assumed stable at
the first stage of the bioprocess (Table 14). The transcriptional regulation equations lead to
the expression of the rate-limiting enzymes of TOL and ortho-cleavage pathways (Table 15)
which are responsible for biomass formation and substrates degradation pattern.
155

Table 14: Equations of the association constant of XylR, XylS and BenR proteins and PbenA based on the switch point of 0.2mM m-xylene threshold. m-xylene ≥ 0.3mM m-xylene < 0.3mM =XylRr
INIXylRR xyl
xylr , INI
XylRR toltolr ,
=XylSr INIXylSRXylS xylrr ,= INIXylSRXylS tolrr ,= =BenRr
INIBenRRBenR xyl
xylrr ,= INI
BenRRBenR toltolrr ,=
=dt
dPbenA 0 PbenABenRK
BenRdt
dPbenAPbenA
aPbenABenR
aPbenA aβ −
+=
,
Table 15: Model equations for TOL and ortho-cleavage promoters and proteins Pr
=dt
d Pr
PrPr33
3
Pr aβ −++ aXylRi
XylRi
iXylRi
XylRi
XylRKK
XylRKK
PrPrβ
Toluene ≥ 0.3mM Toluene < 0.3mM
XylRi iXylRiaRXylRiXylRXylRi
i XylRXylRrXylRrdt
dXylRaβ −+−= 3Pr
XylRa aRXylRiXylR
a XylRrXylRrdt
dXylR−=
31
Ps Psa
XylRKXylR
dtdPs
PsaPsXylRa
aPs −
+=
,
β
XylSi iXylSiaRXylSiXylSXylSi
i XylSXylSrXylSrPsdt
dXylSaβ −+−= 2
XylSa aRXylSiXylS
a XylSrXylSrdt
dXylS−=
21
Pu Pu
XylRKXylR
dtdPu
PuaPuXylRa
aPu aβ −
+=
,
XylU XylUPu
dtdXylU
XylUXylU aβ −=
Pm Pm
BenRKBenR
XylSKXylS
dtdPm
PmaPmBenR
a
aPmXylS
aPm
i
aβ −++
=,
XylM XylMPm
dtdXylM
XylMXylM aβ −=
PbenR PbenR
BenRaKBenRa
dtdPbenR
PbenRPbenRBenRa
PbenR aβ −+
=,
BenRa aRBenRiBenR
a BenRrBenRrdt
dBenR+=
21
156
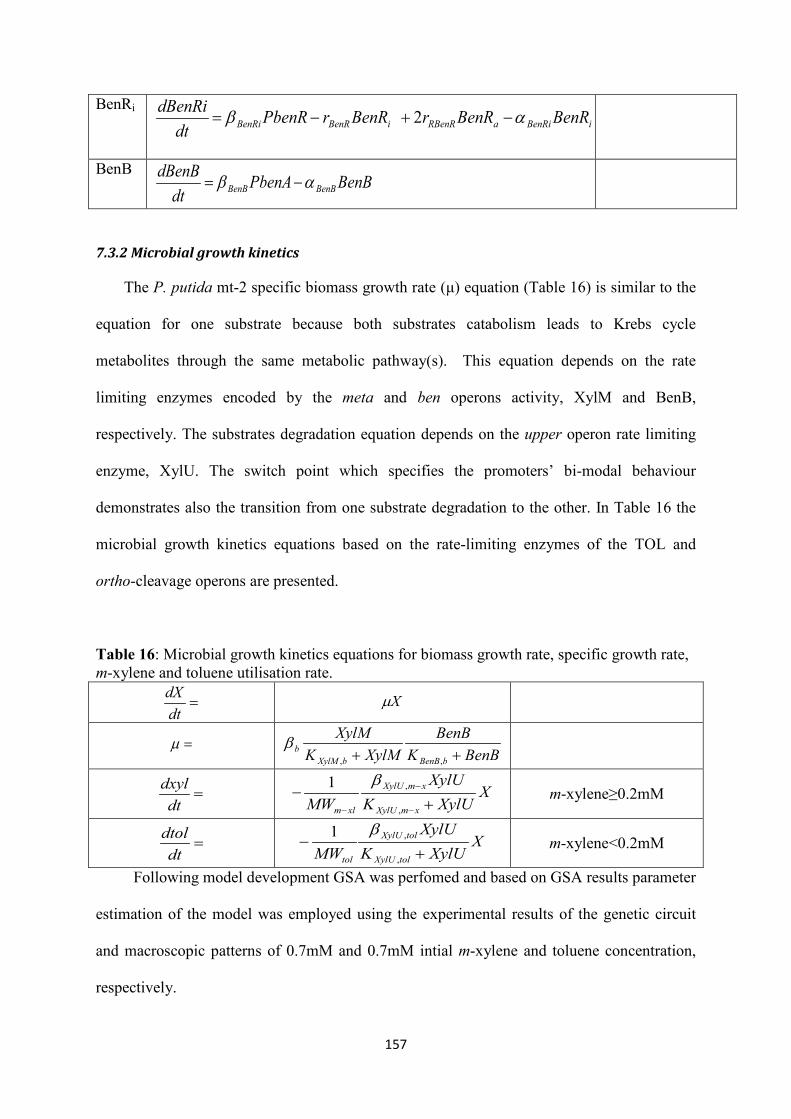
BenRi iBenRiaRBenRiBenRBenRi BenRBenRrBenRrPbenR
dtdBenRi aβ −+−= 2
BenB BenBPbenA
dtdBenB
BenBBenB aβ −=
7.3.2 Microbial growth kinetics
The P. putida mt-2 specific biomass growth rate (μ) equation (Table 16) is similar to the
equation for one substrate because both substrates catabolism leads to Krebs cycle
metabolites through the same metabolic pathway(s). This equation depends on the rate
limiting enzymes encoded by the meta and ben operons activity, XylM and BenB,
respectively. The substrates degradation equation depends on the upper operon rate limiting
enzyme, XylU. The switch point which specifies the promoters’ bi-modal behaviour
demonstrates also the transition from one substrate degradation to the other. In Table 16 the
microbial growth kinetics equations based on the rate-limiting enzymes of the TOL and
ortho-cleavage operons are presented.
Table 16: Microbial growth kinetics equations for biomass growth rate, specific growth rate, m-xylene and toluene utilisation rate.
=dtdX Xm
=m BenBK
BenBXylMK
XylM
bBenBbXylMb ++ ,,
β
=dt
dxyl XXylUK
XylUMW xmXylU
xmXylU
xlm +−
−
−
− ,
,1 β m-xylene≥0.2mM
=dt
dtol XXylUK
XylUMW tolXylU
tolXylU
tol +−
,
,1 β m-xylene<0.2mM
Following model development GSA was perfomed and based on GSA results parameter
estimation of the model was employed using the experimental results of the genetic circuit
and macroscopic patterns of 0.7mM and 0.7mM intial m-xylene and toluene concentration,
respectively.
157

7.3.3 Global sensitivity analysis
158

159

160

161

7.3.4 Parameter estimation
7.3.4.1 Genetic circuit model
162

163

Table 17: Coefficient of determination (R2) of the vector: Pr, Ps, Pu, Pm, PbenR, PbenA between the experimental and model predicted data at each time point with 0.7mM initial m-xylene and 0.7mM initial toluene concentration.
Time (min) Vector (R2) 0 1.00 10 0.42 30 0.83 60 0.92 90 0.98 120 0.97 150 0.96 180 0.95 210 0.97 240 0.96 270 0.98 300 0.90 330 0.92 360 0.43 390 0.37 420 0.17 450 0.57 480 0.85 510 0.51 540 0.06 570 0.03
7.3.4.2 Active and inactive proteins
The predicted behaviour of the inactive (i) and active (a) XylR, XylS and BenR is
presented in Figure 44. These proteins in both forms are important transcription factors of
TOL and ortho-cleavage pathways. The predicted trend is the expected. Towards the end of
the process XylRi synthesis (Figure 44A) is increased because Pr activity which control XylR
synthesis is increased. During the period of Pr down-regulated activity XylRi is produced in
low amounts. The bi-modal behaviour of XylRa (Figure 44B), XylSi (Figure 44C), XylSa
(Figure 44D), BenRi (Figure 44E) and BenRa (Figure 44F) is caused due to m-xylene (at the
first phase) and toluene (at the second phase). BenRi and BenRa synthesis at the second phase
is much lower compared to the others proteins second production phase because CCR
phenomenon is possibly activated.
164

165

7.3.4.3 Rate limiting enzymes
166

7.3.4.4 Growth kinetics
M-xylene and toluene utilisation and specific growth rates are modelled as a function of
the relevant rate-limiting enzymes, XylU for substrate(s) utilisation, XylM and BenB for
biomass formation, as explained in Chapter 6. The estimation of the specific growth rate
leads to the modelling of the biomass formation. The results are presented in Figure 46A, B,
C. The macroscopic patterns prediction is accurate demonstrating the imperative role of
transcriptional regulation to macroscopic processes. Furthermore a comparison with the most
commonly used microbial growth kinetics model is presented. Models of Chapter 2 (Double
Monod, Mankad and Bungay (1988), SKIP (Yoon et al., 1977), sum kinetics with
competitive enzymatic interactions) are used accounting for sequential and simultaneous
substrates degradation because at the beginning of the bioprocess a sequential substrate
consumption pattern was observed, however below 0.2mM m-xylene, the substrates were
utilised simultaneously by the cells. The parameters of these models are presented in Table
21 of the Appendix B. These parameters are estimated in gPROMS with the same method as
described in 3.6.2 section using the experimental results of 0.7mM m-xylene-0.7mM toluene.
In Figure 46D, E, F the predicted patterns of substrates degradation and biomass growth of all
models is presented. The correlation coefficient (R2) between the experimental results and all
models predicted results are presented in Table 18.
167

168

Table 18: Correlation coefficients between experimental and modelling results of each model
m-xylene degradation kinetics
toluene degradation kinetics
biomass growth kinetics
Double Monod 0.86 0.64 0.65 Mankad and Bugay 0.81 0.51 0.64 Competitive enzyme
interactions 0.91 0.72 0.80
SKIP 0.76 0.70 0.73 Current model 0.96 0.91 0.98
Table 19: Symbol, description, estimated values and units of the parameters of the model
Symbols Description Estimated value Units
MWm-xylene Molecular weight of toluene 106.2 g mol-1
MWtoluene Molecular weight of toluene 92.14 g mol-1
bXylRi maximal translation rate of Pr
promoter's mRNA 9.504 mM h-1
rXylR oligomerisation constant of XylR h-1 rR,XylR dissociation constant of XylR 6.998 h-1
aXylRi XylRi degradation and dilution due to
cellular volume increase 1 h-1
bPr maximal expression level of Pr 0.007 h-1 KXylRi repression coefficient of Pr 11.035 mM
aPr mRNA degradation rate of Pr 0.054 h-1 bPu maximal expression level of Pu 0.799 h-1
KXylRa,Pu activation coefficient of Pu by XylRa 5.151 mM aPu mRNA degradation rate of Pu 0.032 h-1 bPs maximal expression level of Ps 0.726 h-1
KXylRa,Ps activation coefficient of Pu by XylRa 11.041 mM aPs mRNA degradation rate of Ps 0.028 h-1
bXylSi translation rate based on Ps mRNA 53.438 mM h-1 rXylS oligomerisation constant of XylS h-1
rR,XylS dissociation constant of XylS 0.631 h-1
aXylSi XylSi degradation and dilution due to
cellular volume increase 0.5 h-1
bPm maximal expression level of Pm 0.711 h-1 KXylSi activation coefficient of Pm by XylSi 33.102 mM aPm mRNA degradation rate of Pm 0.104 h-1
KBenRa,Pm activation coefficient of Pm by BenR 41.450 mM
bPbenR maximal mRNA expression of PbenR promoter 0.175 h-1
KBenRa,PbenR activation coefficient of Pu by XylRa 14.001 mM aPbenR mRNA degradation rate of PbenR 0.042 h-1 bBenRi maximal translation rate of BenRi 9.376 mM h-1
aBenRi BenRi degradation and dilution due to
cellular volume increase 1 h-1
rR,BenR dissociation constant of BenR 0.891 h-1
169

bPbenA maximal mRNA expression of PbenA promoter 0.943 h-1
KBenRa,PbenA activation coefficient of PbenA by BenRa 1.22 mM
aPbenA mRNA degradation rate of PbenA 0.060 h-1 bBenB translation rate based on PbenA mRNA 0.195 mM h-1
aBenB BenB degradation and dilution due to cellular volume increase 4.10954e-006 h-1
aXylU XylU degradation and dilution due to cellular volume increase 0.0009 h-1
bXylU translation rate based on Pu mRNA 23.791 mM h-1
aXylM XylM degradation and dilution due to cellular volume increase 8.92519e-008 h-1
bXylM translation rate based on Pm mRNA 2.56088e-005 mM h-1
bXylU,m-xylene maximum m-xylene metabolic quotient
based on XylU 0.0003 gtol gbiomass h-1
bXylU,toluene maximum toluene metabolic quotient
based on XylU 0.0003 gtol gbiomass h-1
KXylU,m-xylene saturation constant for XylU due to m-
xylene 3.863 mM
KXylU,toluene saturation constant for XylU due to
toluene 3.863 mM
bb maximum specific growth rate of
biomass based on XylM 0.609 h-1
KXylM,b saturation constant of XylM 25.103 mM KBenB,b saturation constant of BenB 21.715 mM
Table 20: Symbol, description, initial values and units of the variables of the model XylRi inactive form of XylR protein 1 mM
XylRa Active form of XylR protein 0 mM
Pr Pr promoter 0.805 mM
Pu Pu promoter 0.191 mM
XylU Rate-limiting enzyme of upper-operon 0 mM
Ps Ps promoter 0.23 mM
XylSi inactive form of XylS 1 mM
XylSa active form of XylS 0 mM
Pm Pm promoter 0.236 mM
XylM Rate-limiting enzyme of meta-operon 0 mM
PbenR PbenR promoter 0.799 mM
BenRa active form of BenR protein 0 mM
BenRi Inactive form of BenR protein 1 mM
PbenA PbenA promoter 0.362 mM
BenB Rate-limiting enzyme of ben operon 0 mM
m-xyl m-xylene concentration 0.676 mM
tol toluene concentration 0.617 mM
170

μ Specific growth rate 0 h-1
X Biomass growth 661.453 mgL-1
7.4 Discussion
In this Chapter the transcriptional kinetics of TOL Pr, Ps, Pu, Pm and ortho-cleavage
PbenR and PbenA upon P. putida mt-2 cells exposure to different mixtures of m-xylene and
toluene, the most commonly used effectors of these strain, was studied. Promoters’
expression was dependent on the amount of substrates added in the culture. The higher the
concentration of the effector added in the bacterial culture, the higher the amplitude and
maximal expression of the promoters, similarly to one substrate addition (Chapter 5). M-
xylene is the first compound which starts to be degraded. At 0.2mM of m-xylene toluene
consumption begins and simultaneous degradation takes place. The promoters were firstly
activated due to m-xylene followed by toluene impact on their activity.
Upon double substrate presence as explained in Chapter 4 CCR mechanism is activated
leading to Crc protein activation. Crc is a global protein which is activated upon presence of
multiple substrates in the cells guiding the cells to the most energy favourable state (Aranda-
Olmedo et al., 2005). The active form of this protein down-regulates BenR, XylR and XylS
synthesis (Moreno et al., 2010). Crc repression occurs by inhibiting the translation initiation
of benR, xylR and xylS, respectively. Therefore upon induction with m-xylene-toluene
mixture, Crc is activated inhibiting these proteins synthesis. Among the three it is suggested
that BenR production is affected at higher degree compared to the others. Since BenR is the
proposed transcription factor of PbenR, PbenR is also inhibited. This impact is observed
below 0.2mM m-xylene when toluene starts to be consumed. The expected PbenR behaviour
would be increased due to benzoate formation, however PbenR is not activated. Therefore, as
171

Moreno and Rojo (2008b) have proposed, Crc repression to BenR is a general strategy in P.
putida strains.
As explained in Chapter 4, following depletion of the most degradable compound the
levels of PbenR activity compared to those when toluene is the sole energy and carbon source
(Chapter 5) are lower. Similarly here, the effect of CCR could be strong enough that PbenR
could not retrieve its expression following m-xylene depletion. Similarly, cells exposure to
toluene did not highly trigger Pm and PbenA, which are up-regulated by BenR. The
expression levels of these promoters following m-xylene depletion are lower compared to
those upon cells sole exposure to toluene underlying the role of CCR mechanism.
Frequently, simultaneous and sequential substrate utilisation in a mixture results in
enhanced removal efficiencies as compared to growth upon induction with a sole compound.
This improvement has been attributed to the production of higher growth rates and levels of
biomass (Klecka and Maier, 1988). Thus multiple substrates are particularly useful in
designing bioremediation schemes. Furthermore the use of more than one substrate enhances
the production of biofuels and other valuable compounds such as ethanol fermentation in
Zymomonas mobilis ATCC 10988 (Lee and Huang, 2000) and amino acids production in
Corynebacterium glutamicum using glucose and fructose (Dominguez et al., 1997).
Therefore, microbial growth kinetics is essential to monitor the performance of a bioprocess
and predict the kinetics under a broad range of conditions leading to optimal bioprocesses.
The most common microbial growth kinetics models used are unstructured and
empirical. The substrates interactions are absent. Reardon et al. (2000) and Rogers and
Reardon (2000) observing this gap calculated the kinetics of multiple substrates utilisation
and biomass growth of P. putida F1 and Burkholderia sp. JS150, respectively, using SKIP
model (Yoon et al., 1977). This model has one parameter accounting for the effect of one
172
substrate to the other (s). However the substrates interactions may be explained through cell
metabolism understanding.
Towards this direction our approach on microbial growth kinetics is structured where the
cell metabolism, the molecular interactions and transcriptional regulation are taken into
account in the model. Nielsen et al. (1991a); (Nielsen et al., 1991b; Nikolajsen et al., 1991)
have worked on structured modelling of multiple substrates considering the intracellular
elements affecting substrate utilisation and biomass and product formation. Ramkrishna
(1982) has developed a cybernetic approach involving the rate-limiting enzymes catalysis
significance. But these models are based on steady state conditions ignoring the dynamic
behaviour of both genes and enzymes and the upstream molecular interactions affecting
enzymes behaviour. Herein, a transcriptional regulation model has been built which describes
the rate limiting enzymes responsible for substrates degradation and biomass formation from
first principles through transcriptional regulation modelling.
The consistent study of promoters’ behaviour upon induction of P. putida mt-2
cultures with toluene, and toluene with another substrate such as succinate (Chapter 4) or m-
xylene (present Chapter) at different concentration level, demonstrates that promoters’
expression level and amplitude increases upon higher effector amounts addition in the
culture. This dependence was modelled to express the interconnection between the
environmental signals and the targeted pathway (Table 14). In addition, through experimental
observation, a threshold of 0.2mM m-xylene was set to distinguish between the two
substrates consumption. At this level of m-xylene, toluene degradation starts. As this is the
first attempt to connect and model double substrate degradation to transcriptional regulation
and this experimental observation was consistent despite the different initial conditions
(Section 7.2), it was mathematically modelled to clarify the switch point of promoters’ bi-
173
modal behaviour. Similarly to Chapter 6, the interconnection between the environmental
signal and the upstream events is suggested.
Another model limitation, as discussed in Chapter 6, is the parameter estimation
method where the variance is manually set despite the experiments performed in which the
variance of data could be calculated. Therefore, the modelling results could potentially be
different when another parameter estimation method is used. Despite this limitation, the
structure of the model has a biological meaning and it can capture the real promoters’
behaviour leading to adequate growth kinetics prediction
The current model adequately predicts microbial growth kinetics patterns and it is
superior than the traditional ones. Thus, the present approach of accounting for the
transcriptional regulation of targeted pathways which are activated by the induced
environmental signals is proven as essential towards the direction of developing multiple
substrates microbial growth kinetics models whicth could result in broad applicability.
Furthermore, unlike the parameters of the unstructured and empirical models which are
estimated based on bulk measurements and are general terms of interactions between the
substrates involved, the current parameters are related to specific upstream interactions and
they are experimentally validated coming from quantitative upstream information. This
approach could be the key to monitor the performance of a bioprocess.
Following these promising results, the predictive capability of the current state-of-the-
art is expected better than the others’ models and it should be examined in the future by
performing independent experiments in extreme substrates concentration levels.
174

Chapter 8
Conclusions and future work
8.1 Project overview
Transcriptional regulation is crucial in bioprocesses. Upon substrate entry into the cells,
the promoters are activated with the assistance of transcription factors, sigma factors and
DNA- bending proteins. The promoters control genes/operons activation resulting in the
relevant enzymes encoding. These enzymes are the catalytic units of substrate mineralisation
and biomass/product formation. Therefore the promoters could be the controllers of growth,
product and substrate kinetics. Subsequently, these studies are focused on this direction
proving the imperative role of transcriptional kinetics in bioprocesses. The microorganism
studied was Pseudomonas putida mt-2, which harbours the TOL plasmid. Upon effectors
entry, the TOL plasmid gene network is activated including its promoters Pr, Ps, Pu and Pm.
Toluene entry activates the ortho-cleavage gene network including the promoters PbenR and
PbenA.
The transcriptional kinetics of TOL Pr, Ps, Pu, Pm and ortho-cleavage PbenR, PbenA
(Figure 47) was studied to reveal interlinking of the two pathways and expression patterns
upon toluene entry at different concentration levels. This systematic work of performing three
independent experiments for each condition tested, measuring mRNA expression before
induction with the effector, 10min after effector entry in the cells and every 30 min thereafter
and triplicate test for each time point revealed useful conclusions regarding to TOL and
ortho- PbenR and PbenA promoters.
Koutinas et al. (2011) have developed a framework to predict m-xylene degradation and
biomass growth of P. putida mt-2. This framework was upgraded and extended to account for
175

toluene degradation. The mathematical expression of the promoters was re-developed based
on the consistent experimental results and the ortho-cleavage pathway was added in order to
precisely express biomass growth. The necessity of ortho-cleavage addition was revealed in
the model analysis (GSA). The model predictive capability was evaluated and proved
adequate enough as the model could predict substrate utilisation and biomass formation
patterns of a wide range of initial conditions.
However in nature not only one substrate is present in the environment. Upon multiple
substrates presence P. putida mt-2 is selective preferentially consuming some compounds
compared to others. The most favourable compounds are the organic acids, followed by
glucose and then hydrocarbons. Therefore multiple substrates effect on TOL Pr, Ps, Pu, Pm
and ortho-cleavage PbenR, PbenA is necessary to mimic environmental conditions. Glucose
effect, especially on TOL regulatory network, is well studied. Upon succinate entry, in batch
and continuous cultures supplemented with rich medium, TOL and ortho- promoters are
subject to repression. But the supply with M9 medium was controversial. The impact of
succinate traces was studied in batch cultures revealing CCR of succinate presence to TOL
catabolic promoters and ortho PbenR and PbenA and demonstrating the existence of this
phenomenon regardless of the growth conditions.
M-xylene and toluene constitute the most commonly used P. putida mt-2 substrates
(Timmis, 2002). Furthermore, they belong to the BTEX group of compounds and they are
petroleum derivatives. Despite that, upon induction with both substrates the TOL and ortho-
cleavage promoters’ reaction is not known. Therefore, the transcriptional kinetics of these
promoters was studied under various mixture concentrations revealing that promoters’
expression is bi-modal due to the entry of the two substrates. Moreover, the presence of m-
xylene to toluene activates CCR mechanisms strongly repressing PbenR promoter. The
experimental observations led to re-tune the model that was already developed accounting for
176

one substrate utilisation in order to be able to predict both substrates degradation and biomass
growth. Model development was followed by model analysis (GSA) which was utilised for
experimental parameter estimation. The results are extremely promising underlying the
necessity of transcriptional regulation in bioprocesses.
The most useful concluding remarks of this project are presented below and based on
these remarks, future directions are demonstrated.
Figure 47: The biosystem studied in the thesis. : input; : output; : AND; : OR; : NOT.
8.2 Concluding remarks
Under similar conditions and upon similar bacteria quantity added in the culture lag
phase is similar. The increase in toluene amount added lead to lag phase increase.
Furthermore similar growth conditions lead to promoters maximal relative mRNA
concentration levels at the same time regardless of toluene amount added.
The promoters which are regulated directly or indirectly by the same transcription
factor have the expression peak at the same time point upon effector entry into the
cells. Therefore Ps, Pu and Pm promoters have their activity peak at the same time
177

point (60 min). These promoters’ direct (for Ps and Pu) or indirect (for Pm) regulator
is XylR which is the master regulator of TOL pathway. PbenR reaches a maximum
expression level at 90 min, at which Pm is still kept at the same high mRNA
concentration level as at 60 min. The fact that both PbenR and Pm reach a peak at 90
min suggests that both are regulating by the same transcription factor, BenR; thus, the
promoters’ up-regulation is seen at transcriptional level. The BenR auto-regulation
suggestion is enhanced when PbenR transcriptional kinetics are studied in the
presence of succinate and toluene mixture. BenR is a severely affected protein due to
CCR mechanism activation and global Crc protein stimulation which inhibits BenR
production. Upon induction with the mixture, succinate presence lead to no activation
and in two out of three tested condition to PbenR down-regulation. PbenR is the only
promoter affected to such an extent by succinate compared to PbenA and TOL
catabolic promoters Pu and Pm. Furthermore in m-xylene and toluene mixture when
PbenR expression was expected to increase the activity was decreased.
TOL Pr down-regulation is well understood and explored in the literature. However it
was demonstrated that 0.3mM toluene is a threshold for Pr relative mRNA expression
upon induction with sole toluene or m-xylene and toluene mixture. Below this
concentration level Pr mRNA activity increases reaching the initial Pr expression
level, as it was prior to toluene induction, at the end of the process. This expression
pattern is similar regardless to initial toluene concentration added. This behaviour
indicates the end of down-regulation by the active form and suggests that the active
form is either de-polymerised or dissociated.
178

Pm undergoes oscillations in P. putida mt-2 induction with toluene concentration
above 1mM. This oscillatory behaviour is consistent upon studying Pm activation due
to sole toluene entry and succinate and toluene entry at toluene added higher than
1mM. The oscillatory behaviour is usually caused by negative feedback loops with
more than two transcription factors participating in.
PbenR promoter is activated upon benzoate presence. When the substrate was toluene
it was clearly observed that PbenR activity increases. The increase was due to
benzoate because when studying the transcriptional kinetics upon toluene entry, the
first 10-30min PbenR was not activated because the time upon effector entry until
enzymes production enabling catalysis of toluene degradation is approximately
30min. Therefore following upper operon enzymes encoding which catalyse toluene
oxidative catabolism to benzoate, PbenR is activated. In the mixture of succinate and
toluene, upon succinate presence PbenR was either not activated or repressed. Upon
succinate depletion PbenR mRNA expression started to increase marking benzoate
presence in cells. Furthermore, in m-xylene and toluene mixture, m-xylene is firstly
consumed; the upper enzymes activity lead to m-methyl-benzoate formation which is
not sufficient for PbenR activation proving that benzoate is PbenR environmental
stimulus.
BenR protein role in the TOL and ortho-cleavage pathways is imperative and should
not be ignored. It is known that BenR up-regulates TOL Pm and ortho-cleavage
PbenA. Experimentally, upon mixture presence, either succinate-toluene or m-xylene-
toluene CCR phenomenon is activated. BenR protein is repressed by the global Crc
protein and this effect resulted in repression of Pm, PbenA and PbenR (taking into
179

account the suggested BenR auto-regulation). The significance of BenR in this
biosystem was also proven by performing model analysis, in particular GSA, in
transcriptional regulation-microbial growth kinetics models accounting for one and
double substrate. Subsequently, GSA is a crucial step for in silico approaches which
simulates in vivo processes.
It is suggested that CCR phenomenon is activated regardless of the growth conditions.
Upon induction of two or more compounds in P. putida mt-2 cells global proteins,
such as Crc are activated repressing the production of transcription factors which up-
regulate TOL and ortho-cleavage promoters activity; thus resulting in less mRNA
expression or inhibition compared to their expression when P. putida mt-2 effector is
only one.
Upon the presence of a mixture, the up-regulated promoters follow a bi-modal pattern.
In the first expression phase the promoter is up-regulated at low levels compared to
the levels reached upon exposure to toluene as the sole energy and carbon source. The
increase is followed by a decrease to the basal expression level. The second phase of
expression is similar to the first one.
The known PbenA up-regulator is BenR, however PbenA cannot only be activated
due to BenR stimulation because its behaviour either in one or double substrates entry
follows the behaviour of a TOL up-regulated promoter indicating up-regulation of a
TOL transcription factor. The most possible candidate is XylS protein.
180

PbenA and PbenR are marginally activated upon m-methyl-benzoate presence.
Therefore benzoate is the best, up to know, substrate for ortho-cleavage pathway and
toluene the best compound fully activating both TOL and ortho-cleavage pathways.
The systematic study of transcriptional kinetics revealed that the lag phase is close
related to the promoters’ expression. Upon studying transcriptional kinetics on
toluene entry, the up-regulated promoters Ps, Pu and Pm reach a maximal level of
mRNA expression at a specific time point (60 min), following that time point a
minimum of 30 min is required for enzymes production to achieve toluene oxidative
catabolism. Following that, toluene starts to be consumed by the cells allowing
biomass growth. The higher the toluene added, the longer the lag phase. Based on
these observations a mathematical representation of lag phase for this biosystem was
built. Upon both m-xylene and toluene entry the maximal mRNA expression of these
promoters was observed at 120 min. However the amount of bacteria added in the
pre-culture was not stable, thus the lag phase of the culture was more than expected.
As explained above, the quantity of added bacteria is crucial in lag phase period. In
every initial mixture concentrations though, substrates degradation and biomass
growth started following the time point at which catabolic promoters’ expression
peaks.
The transcriptional kinetics modelling based on transcriptional regulation upon one
substrate entry leads to an adequate prediction of toluene consumption and biomass
growth kinetics on a broad range of conditions. Furthermore, the transcriptional
kinetics of both m-xylene and toluene consumption lead to a much improved
prediction of these substrates degradation and P. putida mt-2 growth patterns
181

compared to sum kinetics with competitive enzymatic interactions, the Monod and
Monod-type models prediction of growth kinetics; thus demonstrating the significant
role of transcriptional regulation in bioprocesses leading to optimal bioprocess design
and control.
8.3 Future directions
8.3.1 Transcription factors and global proteins role
In this project by systematically studying of the TOL Pr, Ps, Pu, Pm and ortho-cleavage
PbenR and PbenA transcriptional kinetics upon sole toluene, toluene-succinate and toluene-
m-xylene mixtures, new candidate regulatory mechanisms are proposed. These suggestions
should be experimentally explored in order to understand and realise better the transcriptional
regulation mechanisms. The exploitation of these suggestions will further assist in biomass
growth and substrate degradation patterns accurate prediction.
Chromatin immunoprecipitation (ChIP) experimental technique (Nelson et al., 2006)
could be used in order to test if BenR protein is the transcription factor of ortho-cleavage
PbenR and if XylS protein is the co-transcription factor of ortho-cleavage PbenA. This
experimental technique examines specific protein-DNA regions of genome to identify
transcription factors of genes. The use of an antibody for the specific proteins will reveal
whether or not these regulatory mechanisms exist.
The transcriptional kinetics of these promoters upon induction with double substrate,
either succinate-toluene or m-xylene-toluene, unravels that global proteins are activated
which eventually inhibit promoters expression and the relevant enzymes production which
catalyse toluene catabolism. The suggestion that the global Crc protein is activated should be
examined. Therefore the Crc levels on succinate-toluene and m-xylene-toluene mixture and
sole toluene should be tested and the results should be compared. One way for this is to
182
examine the crc gene expression upon induction with the substrate (s). Entry of double
substrate is expected to result in crc activity increase. The identification of crc could be
performed through PCR technique using primer pair candidates of the specific gene followed
by gel electrophoresis. The best candidate will be selected and though RT-PCR the crc fold
difference upon double and sole substrate presence will reveal if the encoded protein, Crc, is
produced in higher levels or not.
8.3.2 Model-based optimisation focusing on promoters’ activity
The increasing activity of Pr below 0.3mM toluene could lead to process optimisation.
Batch cultures are usually used in lab-scale for research purposes; however in bioremediation
schemes in order to achieve higher pollutants degradation rates fed-batch approaches are
most common. Therefore by optimising Pr promoter activity and focusing at the genetic
level, a feeding strategy could be scheduled and a fed-batch process designed in order more
effector such as toluene, which is a major environmental pollutant, to be degraded.
Optimisation of promoter’s activity could occur either by keeping the promoter to a constant
expression level or maximising its expression to the basal expression level following effector
entry.
Model-based optimisation and feeding strategy schedule common goal is to achieve
higher production rates of specific products such as monoclonal antibodies (Kiparissides et
al., 2015) or in fermentation processes (Mozumdera et al., 2014) to increase the production.
The function which is optimised is derived from bulk measurement ignoring cell metabolism.
However, Pr function is the core of P. putida mt-2 TOL and ortho-cleavage metabolic
pathways because toluene entry first activates this promoter whose activation triggers the
following promoters expression which encodes for toluene, benzoate catabolism, and lead to
Krebs cycle metabolites. Subsequently, by optimising Pr and pointing out the feeding
183
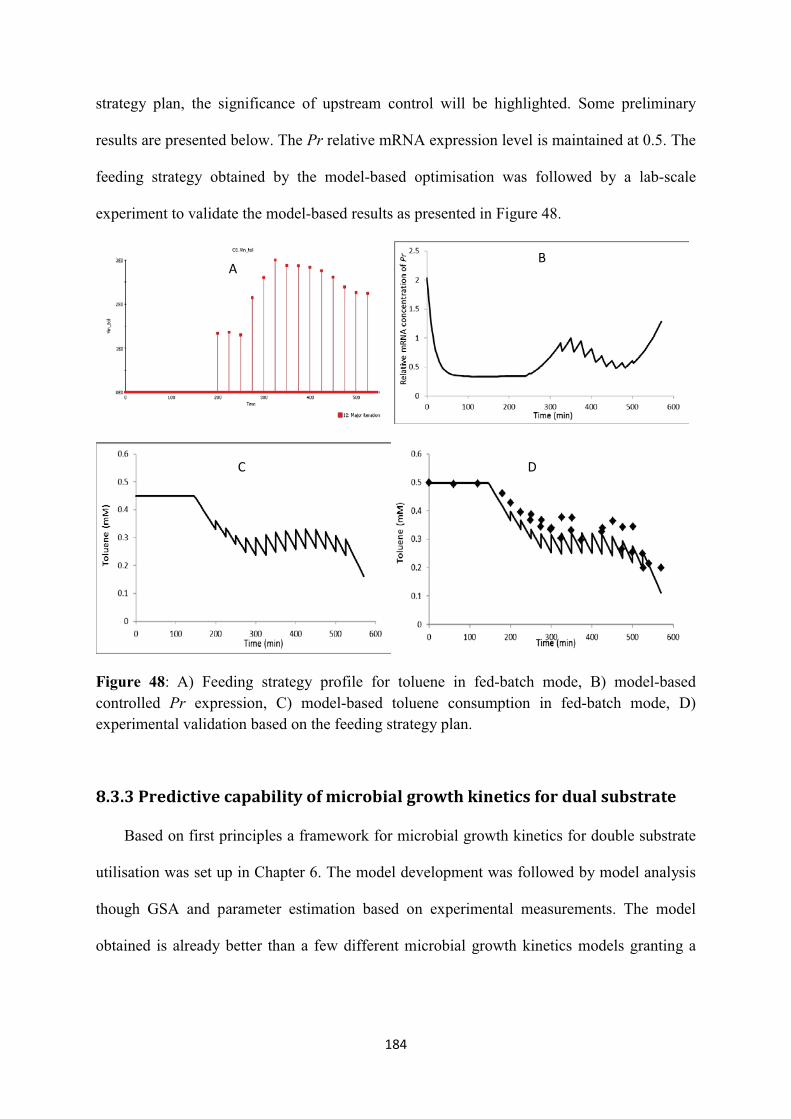
8.3.3 Predictive capability of microbial growth kinetics for dual substrate
D C
B A
184
promising perspective towards accounting for transcriptional regulation in multiple substrates
kinetics and biomass growth prediction.
However the model should be tested for its predictive capability under a broad range of
conditions. This is possible by applying the model to different initial m-xylene and toluene
concentrations. The model can be applied to the mixture concentrations that have already
experimentally measured (0.4mM m-xylene and 0.4mM toluene, 0.6mM m-xylene and
0.4mM toluene) and the relevant transcriptional kinetics of the TOL Pr, Ps, Pu, Pm and
ortho-cleavage PbenR and PbenA. But the identification of the impact of transcription factor
BenR and XylS on PbenR and PbenA, respectively, and Crc protein role will assist in model
development which should be re-examined following this experimental research.
8.3.4 Extension of dual substrate framework to succinate and toluene
degradation microbial growth kinetics
The framework of transcriptional regulation modelling in order to predict microbial
growth kinetics should be applied to other systems in order to become more robust. In
Chapter 5 the transcriptional kinetics of the TOL catabolic promoters Pu, Pm and the key
ortho-cleavage PbenR, PbenA were studied. The kinetics of TOL Pr and Ps can be predicted
based on previous biological knowledge. However the relevant genes kinetics which encode
for succinate degradation are not known.
Succinate belongs to Krebs cycle, thus its consumption results in biomass growth
directly using the Krebs cycle metabolites. Therefore by identifying the pair of primers of the
promoter controlling succinate consumption could lead to succinate utilisation and biomass
formation prediction. Succinate dehydrogenase catalyses succinate catabolism and it is
produced by sdhABCD operon. This operon’s promoter identification is necessary through
185

PCR technique and gel electrophoresis followed by transcriptional kinetics through RT-PCR
to model succinate degradation and biomass growth.
186

Chapter 9
9. Bibliography
Abril, M., Buck, M., Ramos, J. L., 1991. Activation of the Pseudomonas TOL plasmid upper pathway operon. J. Biol. Chem. 266, 15832-15838.
Aemprapat, S., Williams, A. P., 1998. Implications of the xylQ gene of TOL plasmid pWl02 for the evolution of aromatic catabolic pathways. Microbiology. 144, 1387-1396.
Almquist, J., Cvijovic, M., Hatzimanikatis, V., Nielsen, J., Jirstrand, M., 2014. Kinetic models in industrial biotechnology – Improving cell factory performance. Metab. Eng. 24, 38-60.
Alon, U., An Introduction to Systems Biology: Design Pronciples of Biological Circuits. CRC Press, Florida, 2006.
Alvarez, P. J. J., Vogel, T. M., 1991. Substrate interactions of benzene, toluene, and para-xylene during microbial degradation by pure cultures and mixed culture aquifer slurries. Appl. Environ. Microbiol. 57, 2981–2985.
Andrews, J. F., 1968. A mathematical model for the continuous culture of microorganisms utilizing inhibitory substrates. Biotechnol. Bioeng. 10, 707-723.
Andrianantoandro, E., Basu, S., Karig, D. K., Weiss, R., 2006. Synthetic biology: new engineering rules for an emerging discipline. Mol. Syst. Biol. 2, 1-14.
Aranda-Olmedo, I., Marin, P., Ramos, J. L., Marques, S., 2006. Role of the ptsN gene product in catabolite repression of the Pseudomonas putida TOL toluene degradation pathway in chemostat cultures. Appl. Environ. Microbiol. 72, 7418-7421.
Aranda-Olmedo, I., Ramos, J. L., Marques, S., 2005. Integration of signals through Crc and PtsN in catabolite repression of Pseudomonas putida TOL plasmid pWW0. Appl. Environ. Microbiol. 71, 4191–4198.
Arcangeli, J. P., Arvin, E., 1997. Modeling of the cometabolic biodegradation of trichloroethylene by toluene oxidizing bacteria in a biofilm system. Environ. Sci. Technol. . 31, 3044–3052.
Bader, F. G., 1978. Analysis of double substrate limited growth. Biotechnol. Bioeng. 20, 183-202.
Bader, F. G., 1982. Kinetics of double substrate limited growth. CRC press Boca Raton, FL. Bælum, J., Chambon, J. C., Scheutz, C., Binning, P. J., Laier, T., Bjerg, P. L., Jacobsen, C.
S., 2013. A conceptual model linking functional gene expression and reductive dechlorination rates of chlorinated ethenes in clay rich groundwater sediment. Water Res. 27, 2467-2478.
Bajpai-Dikshit, J., Suresh, A. K., Venkatesh, K. V., 2003. An optimal model for representing the kinetics of growth and product formation by Lactobacillus rhamnosus on multiple substrates. J. Biosci. Bioeng. 96, 481–486.
Ballerstedt, H., Volkers, R. J., Mars, A. E., Hallsworth, J. E., dos Santos, V. A. P. M., Puchalka, J., van Duuren, J., Eggink, G., Timmis, K. N., de Bont, J. A., Wery, J., 2007. Genomotyping of Pseudomonas putida strains using P. putida KT2440-based high-density DNA microarrays: implications for transcriptomics studies. Appl. Microbiol. Biotechnol. 75, 1133-1142.
Bally, M., Egli, T., 1996. Dynamics of substrate consumption and enzyme synthesis in Chelatobacter heintzii during growth in carbon-limited continuous culture with
187

different mixtures of glucose and nitrilotriacetate. Appl. Environ. Microbiol. 62, 133–140.
Bar-Joseph, Z., Gitter, A., Simon, I., 2012. Studying and modelling dynamic biological processes using time-series gene expression data. Nature Rev. Genet. 13, 552-564.
Barabási, A. L., Oltvai, Z. N., 2004. Network biology: understanding the cell's functional organization. Nature Rev. Genet. 5, 101-113.
Baranyi, J., 2002. Stochastic modelling of bacterial lag phase. Int. J. Food Microbiol. 73, 203-206.
Bartels, I., Knackmuss, H. J., Reineke, W., 1984. Suicide inactivation of catechol 2,3-dioxygenase from Pseudomonas putida mt-2 by 3-halocatechols. Appl. Environ. Microbiol. 47, 500–505.
Basu, S., Gerchman, Y., Collins, C. H., Arnold, F. H., Weiss, R., 2005. A synthetic multicellular system for programmed pattern formation. Nature. 434, 1130-1134.
Basu, S., Karig, D., Weiss, R., 2003. Engineering signal processing in cells: Towards molecular concentration band detection. Nat. Comput. 2, 463-478.
Basu, S., Mehreja, R., Thiberge, S., Chen, M. T., Weiss, R., 2004. Spatiotemporal control of gene expression with pulse-generating networks. Proc. Natl. Acad. Sci. USA. 101, 6355-6360.
Bertoni, G., Marques, S., de Lorenzo, V., 1998. Activation of the toluene-responsive regulator XylR causes a transcriptional switch between σ54 and σ70 promoters at the divergent Pr/Ps region of the TOL plasmid. Mol. Microbiol. 27, 651–659.
Bertoni, G., Perez-Martin, J., de Lorenzo, V., 1997. Genetic evidence of separate, repressor and activator activities of the XylR regulator of the TOL plasmid, pWW0, of Pseudomonas putida. Mol. Microbiol. 23, 1221-1227.
Beste, D. J., Hooper, T., Stewart, G., Bonde, B., Avignone-Rossa, C., Bushell, M. E., Wheeler, P., Klamt, S., Kierzek, A. M., McFadden, J., 2007. GSMN-TB: a web-based genome-scale network model of Mycobacterium tuberculosis metabolism. Genome Biol. . 8, R89.
Bielefeldt, A., Stensel, H. D., 1999. Modeling competitive inhibition effects during biodegradation of BTEX mixtures. . Wat. Res. 33, 707–714.
Boethling, R. S., Alexander, M., 1979. Effect of concentration of organic chemicals on their biodegradation by natural microbial communities. Appl. Environ. Microbiol. . 37, 1211-1216.
Buhler, B., Straathof, A. J. J., Witholt, B., Schmid, A., 2006. Analysis of two-liquid-phase multistep biooxidation based on a process model: Indications for biological energy shortage. Org. Process Res. Dev. 10 628-643.
Burlage, R. S., Hooper, S. W., Sayler, G. S., 1989. The TOL (pWW0) catabolic plasmid. Appl. Environ. Microbiol. 55, 1323-1328.
Camas, F. M., Blazquez, J., Poyatos, J. F., 2006. Autogenous and nonautogenous control of response in a genetic network. Proc. Natl. Acad. Sci. USA. 103, 12718–12723.
Carrier, T. A., Keasling, J. D., 1997. Controlling messenger RNA stability in bacteria: strategies for engineering gene expression. Biotechnol. Progr. 13, 699-708.
Cases, I., de Lorenzo, V., 2005. Promoters in the environment: transcriptional regulation in its natural context. Nat. Rev. Microbiol. 3, 105-118.
Cases, I., de Lorenzo, V., Perez-Martin, J., 1996. Involvement of sigma factor σ54 in exponential silencing of the Pseudomonas putida TOL plasmid Pu promoter Mol. Microbiol. 19, 7–17.
Cases, I., Pérez-Martín, J., de Lorenzo, V., 1999. The IIANtr (PtsN) protein of Pseudomonas putida mediates the C source inhibition of the σ54-dependent Pu promoter of the TOL plasmid. J. Biol. Chem. 274, 15562-15568.
188

Chang, M. K., Voice, T. C., Criddle, C. S., 1993. Kinetics of competitive inhibition and cometabolism in the biodegradation of benzene, toluene, and p-xylene by two Pseudomonas isolates. Biotechnol. Bioeng. 41, 1057–1065.
Chugani, S. A., Parsek, M. R., Hershberger, C. D., Murakami, K., Ishihama, A., Chakrabarty, A. M., 1997. Activation of the catBCA promoter: probing the interaction of CatR and RNA polymerase through in vitro transcription. J. Bacteriol. 179, 2221-2227.
Contois, D. E., 1959. Kinetics of bacterial growth: relationship between population density and specific growth of continuous culture. J. Gen. Microbiol. 21, 40-50.
Cowles, C. E., Nichols, N. N., Harwood, C. S., 2000. BenR, a XylS Homologue, regulates three different pathways of aromatic acid degradation in Pseudomonas putida. J. Bacteriol. 182, 6339-6346.
Cuskey, S. M., Sprenkle, A. B., 1988. Benzoate-dependent induction from the OP2 operator-promoter region of the TOL plasmid pWW0 in the absence of known plasmid regulatory genes. J. Bacteriol. 170, 3742-3746.
Dabes, J. N., Finn, R. K., Wilke, C. R., 1973. Equations of substrate-limited growth: the case of Blackman kinetics. Biotechnol. Bioeng. . 15, 1159-1177.
de Jong, H., 2002. Modeling and Simulation of Genetic Regulatory Systems: A Literature Review. J. Comput. Biol. 9, 67-103.
de Lorenzo, V., Herrero, M., Metzke, M., Timmis, K. N., 1991. An upstream XyIR- and IHF-induced nucleoprotein complex regulates the σ54-dependent Pu promoter of TOL plasmid. EMBO J. . 10, 1159–1167.
de Lorenzo, V., Perez-Martin, J., 1996. Regulatory noise in prokaryotic promoters: how bacteria learn to respond to novel environmental signals. Mol. Microbiol. 19, 1177-1184.
Devos, D., Garmendia, J., de Lorenzo, V., Valencia, A., 2002. Deciphering the action of aromatic effectors on the prokaryotic enhancer-binding protein XylR: a structural model of its N-terminal domain. Environ. Microbiol. 4, 29-41.
Diaz, E., Jimenez, J. I., Nogales, J., 2013. Aerobic degradation of aromatic compounds. Curr. Opin. Biotechnol. 24, 431-442.
Díaz, E., Prieto, M. A., 2000. Bacterial promoters triggering biodegradation of aromatic pollutants. Curr. Opin. Biotechnol. 11, 467–475
Dinamarca, M. A., Aranda-Olmedo, I., Puyet, A., Rojo, F., 2003. Expression of the Pseudomonas putida OCT plasmid alkane degradation pathway is modulated by two different global control signals: Evidence from continuous cultures. J. Bacteriol. 185, 4772–4778.
Dominguez-Cuevas, P., Gonzalez-Pastor, J. E., Marques, S., Ramos, J. L., de Lorenzo, V., 2006. Transcriptional tradeoff between metabolic and stress-response programs in Pseudomonas putida KT2440 cells exposed to toluene. J. Biol. Chem. 281, 11981-11991.
Dominguez-Cuevas, P., Marın, P., Busby, S., Ramos, J. L., Marques, S., 2008. Roles of effectors in XylS-dependent transcription activation: Intramolecular domain derepression and DNA binding. J. Bacteriol. 190, 3118–3128.
Dominguez, H., Cocaign-Bousquet, M., Lindley, N. D., 1997. Simultaneous consumption of glucose and fructose from sugar mixtures during batch growth of Corynebacterium glutamicum. Appl. Microbiol. Biotechnol. 47, 600-603.
dos Santos, V. A. P. M., Heim, S., Moore, E., Stratz, M., Timmis, K. N., 2004. Insights into the genomic basis of niche specificity of Pseudomonas putida KT2440. Environ. Microbiol. 6, 1264–1286.
Doshi, P., Rengaswamy, R., Venkatesh, K. V., 1997. Modelling of microbial growth for sequential utilization in a multisubstrate environment. Process Biochem. 32, 643–650.
189

Doshi, P., Venkatesh, K. V., 1998. An optimal model for microbial growth in a multiple substrate environment: Simultaneous and sequential utilization. Process Biochem. 33, 663–670.
Douma, R. D., Verheijen, P. J., de Laat, W. T., Heijnen, J. J., van Gulik, W. M., 2010. Dynamic gene expression regulation model for growth and penicillin production in Penicillium chrysogenum. Biotechnol. Bioeng. 106, 608-618.
Duarte, N. C., Becker, S. A., Jamshidi, N., Thiele, I., Mo, M. L., Vo, T. D., Srivas.R., Palsson, B. O., 2007. Global reconstruction of the human metabolic network based on genomic and bibliomic data. Proc. Natl. Acad. Sci. USA. 104, 1777-1782.
Duetz, W. A., Marques, S., de Jong, C., Ramos, J. L., Van Andel, J. G., 1994. Inducibility of the TOL catabolic pathway in Pseudomonas putida (pWWO) growing on succinate in continuous culture: evidence of carbon catabolite repression control. J. Bacteriol. 176.
Duetz, W. A., Marques, S., Wind, B., Ramos, J. L., van Andel, J. G., 1996. Catabolite repression of the toluene degradation pathway in Pseudomonas putida harboring pWW0 under various conditions of nutrient limitation in chemostat culture. Appl. Environ. Microbiol. 62, 601-606.
Duetz, W. A., Wind, B., Kamp, M., van Andel, J. G., 1997. Effect of growth rate, nutrient limitation and succinate on expression of TOL pathway enzymes in response to m-xylene in chemostat cultures of Pseudomonas putida (pWW0). Microbiology. 143, 2331-2338.
Duetz, W. A., Wind, B., van Andel, J. G., Barne, M. R., Williams, P. A., Rutgers, M., 1998. Biodegradation kinetics of toluene, m-xylene, p-xylene and their intermediates through the upper TOL pathway in Pseudomonas putida (pWW0). Microbiology. 144, 1669-1 675.
Edwards, V. H., 1970. The influence of high substrate concentrations on microbial kinetics. Biotechnol. Bioeng. 12, 679-712.
Ewering, C., Heuser, F., Benölken, J. K., Brämer, C. O., Steinbüchel, A., 2006. Metabolic engineering of strains of Ralstonia eutropha and Pseudomonas putida for biotechnological production of 2-methylcitric acid. Metab. Eng. 8, 587–602.
Feist, A. M., Henry, C. S., Reed, J. L., Krummenacker, M., Joyce, A. R., Karp, P. D., Broadbelt, L. J., Hatzimanikatis, V., Palsson, B. O., 2007. A genome-scale metabolic reconstruction for Escherichia coli K-12 MG1655 that accounts for 1260 ORFs and thermodynamic information. Mol. Syst. Biol. . 3.
Feist, A. M., Scholten, J. C. M., Palsson, B. O., Brockman, F. J., Ideker, T., 2006. Modeling methanogenesis with a genome-scale metabolic reconstruction of Methanosarcina barkeri. Mol. Syst. Biol. . 2.
Feng, X. J., Hooshangi, S., Chen, D., Li, G., Weiss, R., Rabitz, H., 2004. Optimising genetic circuit by global sensitivity analysis. Biophys. J. 87, 2195-2202.
Ferrell, J. E., Jr., Pomerening, J. R., Kim, S. Y., Trunnell, N. B., Xiong, W., Huang, C. Y., Machleder, E. M., 2009. Simple, realistic models of complex biological processes: positive feedback and bistability in a cell fate switch and a cell cycle oscillator. FEBS Lett. 583, 3999-4005.
Ferrell, J. E., Jr., Tsai, T. Y., Yang, Q., 2011. Modeling the cell cycle: why do certain circuits oscillate? Cell. 144, 874-885.
Francois, P., Hakim, V., 2004. Design of genetic networks with specified functions by evolution in silico. Proc. Natl. Acad. Sci. USA. 101, 580-585.
Friedman, N., Linial, M., Nachman, I., Pe'er, D., 2000. Using bayesian networks to analyze expression data. J. Comput. Biol. 7, 601-620.
García Münzer, D. G., M., K., M.C., G., E.N., P., A., M., 2013. Developing a cyclin blueprint as a tool for mapping the cell cycle in GS-NS0. Biochem. Eng. J. 81, 97-107.
190

Gebert, J., Radde, N., Weber, G. W., 2007. Modeling gene regulatory networks with piecewise linear differential equations. Eur. J. Oper. Res. 181, 1148-1165.
Gerischer, U., 2002. Specific and Global Regulation of Genes Associated with the Degradation of Aromatic Compounds in Bacteria. J. Mol. Microbiol. Biotechnol. 4, 111–121.
Gibson, A. M., Bratchell, N., Roberts, T. A., 1987. The effects of sodium chloride and temperature on the rate and extent of growth of Clostridium botulinum type A in pasteurized pork slurry. J. Appl. Microbiol. 62, 479-490.
Gillespie, D., 1976. A general method for numerically simulating the stochastic time evolution of coupled chemical reactions. J. Comp. Phys. 22,, 403–434
Golding, I., Paulsson, J., Zawilski, S. M., Cox, E. C., 2005. Real-time kinetics of gene activity in individual bacteria. Cell. 123, 1025-1036.
Gomada, M., Imaishi, H., Miura, K., Inouye, S., Nakazawa, T., Nakazawa, A., 1994. Analysis of DNA bend structure of promoter regulatory regions of xylene-metabolizing genes on the Pseudomonas TOL plasmid. J. Biochem. 116, 1096-1104.
Gonzalez-Perez, M. M., Ramos, J. L., Marques, S., 2004. Cellular XylS levels are a function of transcription of xylS from two independent promoters and the differential efficiency of translation of the two mRNAs. J. Bacteriol. 186, 1898-1901.
Gonze, D., Kaufman, M., Chemical and enzyme kinetics. Université libre de Bruxelles, 2013. Goudar, C. T., Ganji, S. H., Pujar, B. G., Strevett, K. A., 2000. Substrate inhibition kinetics
of phenol biodegradation. Water Environ. Res. . 72, 50-55. Guet, C. C., Elowitz, M. B., Hsing, W. H., Leibler, S., 2002. Combinatorial synthesis of
genetic networks. Science,. 296, 1466-1470. Guha, S., Peters, C. A., Jaffe, P. R., 1999. Multisubstrate biodegradation kinetics of
naphthalene, phenanthrene, and pyrene mixtures. Biotechnol. Bioeng. 65 491–499. Gunsch, C. K., Kinney, K. A., Szaniszlo, P. J., Whitman, C. P., 2007. Relative gene
expression quantification in a fungal gas-phase biofilter. Biotechnol. Bioeng. 98, 101-111.
Haigler, B. E., Wallace, W. H., Spain, J. C., 1994. Biodegradation of 2-nitrotoluene by Pseudomonas sp. strain JS42. Appl. Environ. Microbiol. 60, 3466–3469.
Han, K., Levenspiel, O., 1988. Extended Monod kinetics for substrate, product and cell inhibition. Biotechnol. Bioeng. . 32, 430 – 437.
Harayama, S., Rekik, M., 1990. The meta cleavage operon of TOL degradative plasmid pWW0 comprises 13 genes. Mol. Genet. Genomics. 221, 113-120.
Harder, W., Dijkhuizen, L., Postgate, J. R., 1982. Strategies of mixed substrate utilization in microorganisms. Philos. Trans. R. Soc. London B. . 297, 459–480.
Harwood, C. S., Parales, R. E., 1996. The β-ketoadipate pathway and biology of self identity. Annu. Rev. Microbiol. 50, 553–90.
Hatzimanikatis, V., Lee, K. H., 1999. Dynamical analysis of gene networks requires both mRNA and protein expression information. Metab. Eng. 1, 275-281.
Heijnen, J. J., Romein, B., 1995. Derivation of kinetic equations for growth on single substrates based on general properties of a simple metabolic network Biotecbnol. Prog. . 11 712-716
Herrnstein, R. J., 1974. Formal properties of the matching law. J. Exp. Ana. Behav. 21, 15–164.
Hester, K. L., Madhusudhan, K. T., Sokatch, J. R., 2000. Catabolite repression control by Crc in 2xYT medium is mediated by post transcriptional regulation of bkdR expression in Pseudomonas putida. J. Bacteriol. 182, 1150–1153.
191

Hirata, H., Yoshiura, S., Ohtsuka, T., Bessho, Y., Harada, T., Yoshikawa, K., Kageyama, R., 2002. Oscillatory expression of the bHLH factor Hes1 regulated by a negative feedback loop. Science. 298, 840-843.
Holtel, A., Goldenberg, D., Giladi, H., Oppenheim, A. B., Timmis, K. N., 1995. Involvement of IHF protein in expression of the Ps promoter of the Pseudomonas putida TOL. J. Bacteriol. 177, 3312–3315.
Holtel, A., Marques, S., Mohler, I., Jakubzik, U., Timmis, K. N., 1994. Carbon source-dependent inhibition of xyl operon expression of the Pseudomonas putida TOL plasmid. J. Bacteriol. 176, 1773-1776.
Holtel, A., Timmis, K. N., Ramos, J. L., 1992. Upstream binding sequences of the XylR activator protein and integration host factor in the xylS gene promoter region of the Pseudomonas TOL plasmid. Nucleic Acids Res. 20, 1755–1762.
Hosokawa, K., Stanier, R. Y., 1966. Crystallization and properties of p-hydroxybenzoate hydroxylase from Pseudomonas putida. J. Biol. Chem. 241, 2453-2460.
Houghton, J. E., Brown, T. M., Appel, A. J., Hughes, E. J., Ornston, L. N., 1995. Discontunuities in the evolution of Pseudomonas Putida cat genes. J. Bacteriol. 177, 401-412.
Hugouvieux-Cotte-Pattat, N., Kohler, T., Rekik, M., Harayama, S., 1990. Growth-phase-dependent expression of the Pseudomonas putida TOL plasmid pWW0 catabolic genes. J. Bacteriol. 172, 6651-6660.
Inouye, S., Nakazawa, A., Nakazawa, T., 1987. Expression of the regulatory gene xylS on the TOL plasmid is positively controlled by the xylR gene product. Proc. Natl. Acad. Sci. U.S.A. 84, 5182-5186
Jeffrey, W. H., Cuskey, S. M., Chapman, P. J., Resnick, S., Olsen, R. H., 1992. Characterization of Pseudomonas putida mutants unable to catabolize benzoate: cloning and characterization of Pseudomonas genes involved in benzoate catabolism and isolation of a chromosomal DNA fragment able to substitute for xylS in activation of the TOL lower-pathway promoter. J. Bacteriol. 174, 4986-4996.
Jindrova, E., Chocova, M., Demnerova, K., Brenner, V., 2002. Bacterial aerobic degradation of Benzene, Toluene, Ethylbenzene and Xylene. Folia Microbiol. (Praha). 47, 83-93.
Jishage, M., Iwata, A., Ueda, S., Ishihama, A., 1996. Regulation of RNA polymerase sigma subunit synthes is in Escherichia coli: intracellular levels of four species of sigma subunit undervarious growth conditions. J. Bacteriol. 178, 5447–5451
Kanani, H., Chrysanthopoulos, P. K., Klapa, M. I., 2008. Standardizing GC–MS metabolomics. J. Chromatogr. B. 871 191–201.
Kanani, H. H., Klapa, M. I., 2007. Data correction strategy for metabolomics analysis using gas chromatography–mass spectrometry. Metab. Eng. 9 39–51.
Karig, D., Weiss, R., 2005. Signal-amplifying genetic circuit enables in vivo observation of weak promoter activation in the RhI quorum sensing system. Biotech. Bioeng. 89, 709-718.
Karlebach, G., Shamir, R., 2008. Modelling and analysis of gene regulatory networks. Nature Rev. Mol. Cell Biol. 9 770-780.
Kauffman, S. A., 1993. The Origins of Order. Oxford University Press, New York. Kessler, B., Marques, S., Kohler, T., Ramos, J. L., Timmis, K. N., de Lorenzo, V., 1994.
Cross talk between catabolic pathways in Pseudomonas putida: XylS-dependent and -independent activation of the TOL meta operon requires the same cis-acting sequences within the Pm promoter. J. Bacteriol. 176, 5578–5582.
Kiparissides, A., Koutinas, M., Kontoravdi, C., Mantalaris, A., Pistikopoulos, E. N., 2011a. ‘Closing the loop’ in biological systems modeling — From the in silico to the in vitro. Automatica. 47, 1147-1155.
192

Kiparissides, A., Koutinas, M., Moss, T., Newman, J., Pistikopoulos, E. N., Mantalaris, A., 2011b. Modelling the Delta1/Notch1 Pathway: In Search of the Mediator(s) of Neural Stem Cell Differentiation. PLoS ONE. 6, e14668.
Kiparissides, A., Pistikopoulos, E. N., Mantalaris, A., 2015. On the model-based optimization of secreting mammalian cell (GS-NS0) cultures. Biotech. Bioeng. 112, 536-548.
Kitano, H., 2002. Looking beyond the details: a rise in system-oriented approaches in genetics and molecular biology. Curr. Genet. 41, 1-10.
Klecka, G. M., Gibson, D. T., 1981. Inhibition of catechol 2,3-dioxygenase from Pseudomonas putida by 3-chlorocatechol. Appl. Environ. Microbiol. 41, 1159–1165.
Klecka, G. M., Maier, W. J., 1988. Kinetics of microbial growth on mixtures of pentachlorophenol and chlorinated aromatic compounds. Biotechnol. Bioeng. . 31, 328–335.
Knightes, C. D., Peters, C. A., 2006. Multisubstrate biodegradation kinetics for binary and complex mixtures of polycyclic aromatic hydrocarbons. Environ. Toxicol. Chem. Eng. Sci. 25, 1746–1756.
Kompala, D. S., Ramkrishna, D., Jansen, N. B., Tsao, G. T., 1986. Investigation of bacterial growth on mixed substrates: experimental evaluation of cybernetic models. Biotechnol. Bioeng. 28, 1044–1055.
Kontoravdi, C., Pistikopoulos, E. N., Mantalaris, A., 2010. Systematic development of predictive mathematical models for animal cell cultures. Comput. Chem. Eng. 34 1192–1198.
Kooijman, S. A. L. M., Muller, E. B., Stouthamer, A. H., 1991. Microbial growth dynamics on the basis of individual budgets Antonie van Leeuwenhoek 60, 159-174.
Koutinas, M., Kiparissides, A., Pistikopoulos, E. N., Mantalaris, A., 2012. Bioprocess systems engineering: transferring traditional process engineering principles to industrial biotechnology. Comput. Struct. Biotechnol. J. 3, 1-9.
Koutinas, M., Kiparissides, A., Silva-Rocha, R., Lam, M., dos Santos, V. A. P. M., de Lorenzo, V., Pistikopoulos, E. N., Mantalaris, A., 2011. Linking genes to microbial growth kinetics: an integrated biochemical systems engineering approach. Metab. Eng. 13, 401-413.
Koutinas, M., Lam, M. C., Kiparissides, A., Silva-Rocha, R., Godinho, M., Livingston, A. G., Pistikopoulos, E. N., de Lorenzo, V., Dos Santos, V. A. P. M., Mantalaris, A., 2010. The regulatory logic of m-xylene biodegradation by Pseudomonas putida mt-2 exposed by dynamic modelling of the principal node Ps/Pr of the TOL plasmid. Environ. Microbiol. 12, 1705-1718.
Kovarova-Kovara, K., Egli, T., 1998. Growth Kinetics of Suspended Microbial Cells: From Single-Substrate-Controlled Growth to Mixed-Substrate Kinetics. Microbiol. Mol. Biol. R. 62, 646-666.
Kovarova, K., Zehnder, A. J. B., Egli, T., 1996. Temperature-Dependent Growth Kinetics of Escherichia coli ML 30 in Glucose-Limited Continuous Culture. J. Bacteriol. 178, 4530–4539.
Lee, J. Y., Choi, Y. B., Kim, H. S., 1993. Simultaneous Biodegradation of toluene and p-xylene in a novel bioreactor: experimental results and mathematical analysis. Biotecbnol. Prog. 9, 46–53.
Lee, S. B., Bailey, J. E., 1984. Analysis of growth rate effects on productivity of recombinant Escherichia coli populations using molecular mechanism models. Biotechnol. Bioeng. 26, 66-73.
Lee, W. C., Huang, C. T., 2000. Modeling of ethanol fermentation using Zymomonas mobilis ATCC 10988 grown on the media containing glucose and fructose. Biochem. Eng. J. 4, 217-227.
193

Lendenmann, U., Growth kinetics of Escherichia coli with mixures of sugars. Swiss Federal Institute of Technology, Switzerland, 1994.
Lendenmann, U., Egli, T., 1998. Kinetic models for the growth of Escherichia coli with mixtures of sugars under carbon-limited conditions. Biotechnol. Bioeng. 59, 99–107.
Lendenmann, U., Snozzi, M., Egli, T., 1996. Kinetics of the simultaneous utilization of sugar mixtures by Escherichia coli in continuous culture. Appl. Environ. Microbiol. 62, 1493–1499.
Li, D., Yan, Y., Ping, S., Chen, M., Zhang, W., Li, L., Lin, W., Geng, L., Liu, W., Lu, W., Lin, M., 2010. Genome-wide investigation and functional characterization of the β-ketoadipate pathway in the nitrogen-fixing and root-associated bacterium Pseudomonas stutzeri A1501. BMC microbiol. 10, 1471-2180.
Li, G., Rabitz, H., Wang, S., Georgopoulos, P. G., 2003. Correlation method for variance reduction of monte carlo integration in RS-HDMR. J. Comput. Chem. 24, 277–283.
Li, S., Brazhnik, P., Sobral, B., Tyson, J. J., 2008. A quantitative study of the division cycle of Caulobacter crescentus stalked cells. . PLoS Comput. Biol. 4, e9.
Linares, J. F., Moreno, R., Fajardo, A., Martínez-Solano, L., Escalante, R., Rojo, F., Martínez, J. L., 2010. The global regulator Crc modulates metabolism, susceptibility to antibiotics and virulence in Pseudomonas aeruginosa. Environ. Microbiol. 12, 3196–3212.
Loh, K., Chua, S., 2002. Ortho pathway of benzoate degradation in Pseudomonas putida:induction of meta pathway at high substrate concentrations. Enzyme Microb. Technol. 30, 620-626.
Lugtenberg, B. J., Dekkers, L. C., 1999. What makes Pseudomonas bacteria rhizosphere competent? Environ. Microbiol. 1, 9–13.
Maeda, M., Itoh, A., Kawase, Y., 2005. Kinetics for aerobic biological treatment of o-cresol containing wastewaters in a slurry bioreactor: biodegradation by utilizing waste activated sludge. Biochem. Eng. J. . 22, 97–103.
Mankad, T., Bungay, H. R., 1988. Model for microbial growth with more than one limiting nutrient. J. Biotechnol. 7.
Marques, S., Gallegos, M. T., Manzanera, M., Holtel, A., Timmis, K. N., Ramos, J. L., 1998. Activation and repression of transcription at the double tandem divergent promoters for the xylR and xylS genes of the TOL plasmid of Pseudomonas putida. J. Bacteriol. 180, 2889–2894.
Marqués, S., Gallegos, M. T., Ramos, J. L., 1995. Role of σs in transcription from the positively controlled Pm promoter of the TOL plasmid of Pseudomonas putida. Mol. Microbiol. 18, 851-857.
Marques, S., Holtel, A., Timmis, K. N., Ramos, J. L., 1994. Transcriptional induction kinetics from the promoters of the catabolic pathways of TOL plasmid pWW0 of Pseudomonas putida for metabolism of aromatics. J. Bacteriol. 176, 2517-2524.
Marques, S., Manzanera, M., Gonzalez-Perez, M. M., Gallegos, M. T., Ramos, J. L., 1999. The XylS-dependent Pm promoter is transcribed in vivo by RNA polymerase with σ32 or σ38 depending on the growth phase. Mol. Microbiol. 31, 1105-1113.
McAdams, H. H., Arkin, A., 1998. Simulation of prokaryotic genetic circuits. Annu. Rev. Biophys. Biomol. Struct. 27, 199-224.
McCarty, P. L., Rittmann, B. E., Bouwer, E. J., 1994. Microbial processes affecting chemical transformations in groundwater. New York.
McDaniel, R., Weiss, R., 2005. Advances in synthetic biology: on the path from prototypes to applications. Curr. Opin. Biotechnol. 16, 476-483.
194

McFall, S. M., Chugani, S. A., Chakrabarty, A. M., 1998. Transcriptional activation of the catechol and chlorocatechol operons: variations on a theme. Genes Cells. 223, 257-267.
McGee, R. D., Drake, J. F., Fredrickson, A. G., Tsuchiya, H. M., 1972. Studies in intermicrobial symbiosis, Saccharomyces cerevisiae and Lactobacillus casei. Can. J. Microbiol. 18, 1733-1742.
McKellar, R. C., 1997. A heterogeneous population model for the analysis of bacterial growth kinetics. Int. J Food. Microbiol. . 36, 179-186.
Mestl, T., Plahte, E., Omholt, S. W., 1995. Periodic solutions in systems of piecewise- linear differential equations. Dynam. Stabil. Syst. 10, 179-193.
Molina, L., Ramos, C., Duque, E., Ronchel, M. C., Garcıa, J. M., Wyke, L., Ramos, J. L., 2000. Survival of Pseudomonas putida KT2440 in soil and in the rhizosphere of plants under greenhouse and environmental conditions. Soil Biol Biochem. 32, 315–321.
Morales, G., Linares, J. F., Beloso, A., Albar, J. P., Martínez, J. L., Rojo, F., 2004. The Pseudomonas putida Crc global regulator controls the expression of genes from several chromosomal catabolic pathways for aromatic compounds. J. Bacteriol. 186, 1337–1344.
Moreno, R., Fonseca, P., Rojo, F., 2010. The Crc global regulator inhibits the Pseudomonas putida pWW0 toluene/xylene assimilation pathway by repressing the translation of regulatory and structural genes. J. Biol. Chem. 285, 24412-24419.
Moreno, R., Fonseca, P., Rojo, F., 2012. Two small RNAs, CrcY and CrcZ, act in concert to sequester the Crc global regulator in Pseudomonas putida, modulating catabolite repression. Mol. Microbiol. 83 24–40.
Moreno, R., Martınez-Gomariz, M., Yuste, L., Gil, C., Rojo, F., 2009a. The Pseudomonas putida Crc global regulator controls the hierarchical assimilation of amino acids in a complete medium: Evidence from proteomic and genomic analyses. Proteomics. 9, 2910–2928.
Moreno, R., Marzi, S., Romby, P., Rojo, F., 2009b. The Crc global regulator binds to an unpaired A-rich motif at the Pseudomonas putida alkS mRNA coding sequence and inhibits translation initiation. Nucleic Acids Res. 37, 7678–7690.
Moreno, R., Rojo, F., 2008a. The target for the Pseudomonas putida Crc global regulator in the benzoate degradation Pathway is the BenR transcriptional regulator. J. Bacteriol. 190, 1539–1545.
Moreno, R., Rojo, F., 2008b. The Target for the Pseudomonas putida Crc global regulator in the benzoate degradation pathway is the BenR transcriptional regulator. J. Bacteriol. 190, 1539-1545.
Mozumdera, M. S. I., De Wever, H., Volcke, E. I. P., Garcia-Gonzalez, L., 2014. A robust fed-batch feeding strategy independent of the carbon source for optimal polyhydroxybutyrate production. Process Biochem. 49, 365-373.
Mulchandani, A., Luong, J. H. T., 1989. Microbial inhibition kinetics revisited Enzyme Microb. Tech. 11, 66-73.
Narang, A., Konopka, A., Ramkrishna, D., 1997. Dynamic analysis of the cybernetic model for diauxic growth. Chem. Eng. Sci. 52, 2567–2578.
Nelson, J. D., Denisenko, O., Bomsztyk, K., 2006. Protocol for the fast chromatin immunoprecipitation (ChIP) method. Nat. Protoc. 1, 179 - 185.
Nichols, N. N., Harwood, C. S., 1995. Repression of 4-hydroxybenzoate transport and degradation by benzoate: a new layer of regulatory control in the Pseudomonas putida β-ketoadipate pathway. J. Bacteriol. 177 7033–7040.
195

Nicolaou, S. A., Gaida, S. M., Papoutsakis, E. T., 2010. A comparative view of metabolite and substrate stress and tolerance in microbial bioprocessing: From biofuels and chemicals, to biocatalysis and bioremediation. Metab. Eng. 12, 307-331.
Nielsen, J., Nikolajsen, K., Villadsen, J., 1991a. Structured modeling of a microbial system: 1. A theoretical study of lactic acid fermentation. Biotech. Bioeng. 38, 1-10.
Nielsen, J., Nikolajsen, K., Villadsen, J., 1991b. Structured modeling of a microbial system: II. Experimental verification of a structured lactic acid fermentation model. Biotech. Bioeng. 38, 11-23.
Nielsen, J., Villadsen, J., 1992. Modelling of microbial kinetics. Chem. Eng. Sci. 47, 4225-4270.
Nikolajsen, K., Nielsen, J., Villadsen, J., 1991. Structured modeling of a microbial system. III. Growth on mixed substrates. Biotechnol. Bioeng. 38, 24–29.
Nogales, J., Palsson, B., Thiele, I., 2008a. A genome scale metabolic reconstruction of Pseudomonas putida KT2440: iJN746 as a cell factory. BMC Syst. Biol. 2.
Nogales, J., Palsson, B. Ø., Thiele, I., 2008b. A genome-scale metabolic reconstruction of Pseudomonas putida KT2440: iJN746 as a cell factory. BMC Syst. Biol. 2, 1-20.
Oh, Y. K., Palsson, B. O., Park, S. M., Schilling, C. H., Mahadevan, R., 2007. Genome-scale reconstruction of metabolic network in Bacillus subtilis based on high-throughput phenotyping and gene essentiality data. J. Biol. Chem. 282, 28791-28799.
Oh, Y. S., Shareefdeen, Z., Baltzis, B. C., Bartha, R., 1994. Interactions between benzene, toluene, and p-xylene (BTX) during their biodegradation. Biotechnol. Bioeng. 44, 533–538.
Okpokwasili, G. C., Nweke, C. O., 2005. Microbial growth and substrate utilization kinetics. Afr. J. Biotechnol. 5, 305-317.
Ong, I. M., Glasner, J. D., Page, D., 2002. Modelling regulatory pathways in E. coli from time series expression profile. Bioinformatics. 18, 241-248.
Österlund, T., Nookaew, I., Nielsen, J., 2012. Fifteen years of large scale metabolic modeling of yeast: Developments and impacts. Biotechnol. Adv. 30, 979-988.
Palleroni, N., Moore, E. R. B., 2004. Taxonomy of Pseudomonads: experimental approaches. Kluwer Academic/Plenum Publishers, New York.
Papanastasiou, A. C., Maier, W. J., 1982. Kinetics of biodegradation of 2,4-dichlorophenoxy-acetate in the presence of glucose. Biotechnol. Bioeng. 24, 2001–2011.
Parsek, M. R., Ye, R. W., Pun, P., M., C. A., 1994. Critical nucleotides in the interaction of a LysR-type regulator with its target promoter region. J. Biol. Chem. 269, 11279-11284.
Pazos, F., Valencia, A., de Lorenzo, V., 2003. The organization of the microbial biodegradation network from a systems-biology perspective. EMBO reports. 4, 994-999.
Penfold, W., Norris, D., 1912. The relation of concentration of food supply to generation time bacteria. J. Hyg. 12, 527-531.
Perez-Martin, J., deLorenzo, V., 1995. The σ54-dependent promoter Ps of theTOL plasmid of Pseudomonas putida requires HU for transcriptional activation in vivo by XylR. J. Bacteriol. 177, 3758–3763.
Perez-Pantoja, D., Kim, J., Silva-Rocha, R., de Lorenzo, V., 2015. The differential response of the Pben promoter of Pseudomonas putida mt-2 to BenR and XylS prevents metabolic conflicts in m-xylene biodegradation. Environ. Microbiol. 17, 64-75.
Pieper, D. H., dos Santos, V. A. P. M., Golyshin, P. N., 2004. Genomic and mechanistic insights into the biodegradation of organic pollutants. Curr. Opin. Biotechnol. 15, 215-224.
196

Puchalka, J., Oberhardt, M. A., Godinho, M., Bielecka, A., Regenhardt, D., Timmis, K. N., Papin, J. A., dos Santos, V. A. P. M., 2008. Genome-Scale reconstruction and analysis of the Pseudomonas putida KT2440 metabolic network facilitates applications in biotechnology. PLoS Comput. Biol. 4, e1000210.
Purnick, P. E. M., Weiss, R., 2009. The second wave of synthetic biology: from modules to systems. Nature Rev. Mol. Cell Biol. 10, 410-422.
Ramakrishna, R., Ramkrishna, D., Konopka, A. E., 1997. Microbial growth on substitutable substrates: Characterizing the consumer-resource relationship. Biotechnol. Bioeng. 54, 77–90.
Ramkrishna, D., 1982. A cybernetic perspective of microbial growth. Foundations of biochemical engineering kinetics, and thermodynamics in biological systems, ACS Symposium
Ramos, J. L., Marques, S., Timmis, K. N., 1997. Transcriptional control of the Pseudomonas TOL plasmid catabolic operons is achieved through an interplay of host factors and plasmid-encoded regulators. Annu. Rev. Microbiol. 51, 341-372.
Ratkowsky, D. A., Lowry, R. K., McMeekin, T. A., Stokes, A. N., Chandler, R. E., 1983. Model for bacterial culture growth rate throughout the entire biokinetic temperature range. J. Bacteriol. 154, 1222-1226.
Reardon, K. F., Mosteller, D. C., Rogers, J. D. B., 2000. Biodegradation kinetics of benzene, toluene, and phenol as single and mixed substrates for Pseudomonas putida F1. Biotechnol. Bioeng. . 69, 385–400.
Rittmann, B. E., McCarty, P. L., 1980. Evaluation of steady-state-biofilm kinetics. Biotechnol. Bioeng. 22, 2359 – 2373.
Rogers, J. B., Reardon, K. F., 2000. Modeling substrate interactions during the biodegradation of mixtures of toluene and phenol by Burkholderia Species JS150. Biotechnol. Bioeng. 70, 428–435.
Rojo, F., 2010. Carbon catabolite repression in Pseudomonas :optimizing metabolic versatilityand interactions with the environment. FEMS Microbiol. Rev. 34 658–684.
Rojo, F., Dinamarca, M. A., 2004. Catabolite repression and physiological control. In: Ramos, J., (Ed.), Pseudomonas: Virulence and gene regulation. vol. 2. Kluwer Academic/Plenum, London, UK, pp. 365-387.
Ruiz-Manzano, A., Yuste, L., Rojo, F., 2005. Levels and activity of the Pseudomonas putida global regulatory rrotein Crc vary according to growth conditions. J. Bacteriol. 187, 3678–3686.
Saez, P. B., Rittmann, B. E., 1993. Biodegradation kinetics of a mixture containing a primary substrate (phenol) and an inhibitory co-metabolite (4-chlorophenol). Biodegradation 4, 3–21.
Samad, H. E., Khammash, M., Petzold, L., Gillespie, D., 2005. Stochastic modelling of gene regulatory networks. Int. J. Robust Nonlin. 15, 691–711.
Sambrook, J., Fritsch, E. F., Maniatis, E., 1989. Molecular Cloning: A Laboratory Manual. Cold Spring Harbour Press, New York.
Santillan, M., 2008. On the Use of the Hill Functions in Mathematical Models of Gene Regulatory Networks. Math. Model. Nat. Phenom. 3, 85-97.
Santos, P. M., Blatny, J. M., Di Bartolo, I., Valla, S., Zennaro, E., 2000. Physiological analysis of the expression of the styrene degradation gene cluster in Pseudomonas fluorescens ST. Appl. Environ. Microbiol. 66, 1305-1310.
Schmidt, E., Bartels, I., Knackmuss, H., 1985a. Degradation of 3-chlorobenzoate by benzoate or 3-methylbenzoate-utilising cultures: 3-chlorobenzoate; mixed cultures; total degradation; incompatible substrates. FEMS Microbiol. Lett. 31, 381-389.
197

Schmidt, S. K., Simkins, S., Alexander, M., 1985b. Models for the kinetics of biodegradation of organic compounds not supporting growth. Appl. Environ. Microbiol. 50, 323-331.
Segel, I. H., 1975. Enzyme Kinetics. New York. Shen-Orr, S. S., Milo, R., Mangan, S., Alon, U., 2002. Network motifs in the transcriptional
regulation network of Escherichia coli. Nat. Genet. 31:, 64–68. Shingler, V., 2003. Integrated regulation in response to aromatic compounds: from signal
sensing to attractive behaviour. Environ. Microbiol. 5 1226–1241. Shmulevich, I., Dougherty, E. R., Kim, S., Zhang, W., 2002. Probabilistic Boolean networks:
a rule-based uncertainty model for gene regulatory networks. Bionformatics. 18, 261-274.
Sidoli, F. R., Mantalaris, A., Asprey, S. P., 2005. Toward Global Parametric Estimability of a Large-Scale Kinetic Single-Cell Model for Mammalian Cell Cultures. Ind. Eng. Chem. Res. 44, 868-878.
Sikkema, J., de Bont, J. A. M., Poolman, B., 1995. Mechanisms of membrane toxicity of hydrocarbons. Microbiol. Mol. Biol. Rev. 59, 201–222.
Silva-Rocha, R., de Jong, H., Tamames, J., de Lorenzo, V., 2011a. The logic layout of the TOL network of Pseudomonas putida pWW0 plasmid stems from a metabolic amplifier motif (MAM) that optimizes biodegradation of m-xylene. BMC Syst. Biol. 5, 191-207.
Silva-Rocha, R., de Lorenzo, V., 2010. Noise and robustness in prokaryotic regulatory networks. Annu. Rev. Microbiol. 64, 257-275.
Silva-Rocha, R., de Lorenzo, V., 2012a. Broadening the signal specificity of prokaryotic promoters by modifying cis-regulatory elements associated with a single transcription factor. Mol. Biosyst. . 8, 1950-1957.
Silva-Rocha, R., de Lorenzo, V., 2012b. Stochasticity of TOL plasmid catabolic promoters sets a bimodal expression regime in Pseudomonas putida mt-2 exposed to m-xylene. Mol. Microbiol. 86, 199-211.
Silva-Rocha, R., de Lorenzo, V., 2013. Engineering Multicellular Logic in Bacteria with Metabolic Wires. ACS Synth. Biol. 3, 204-209.
Silva-Rocha, R., Tamames, J., dos Santos, V. A. P. M., de Lorenzo, V., 2011b. The logicome of environmental bacteria: merging catabolic and regulatory events with Boolean formalisms. Environ. Microbiol. 13, 2389–2402.
Simkins, S., Alexander, M., 1985. Nonlinear estimation of the parameters of monod kinetics that best described mineralization of several substrate concentrations by dissimilar bacterial densities. Appl. Environ. Microbiol. 50.
Singh, R. K., Kumara, S., Kumara, S., Kumarb, A., 2008. Biodegradation kinetic studies for the removal of p-cresol from wastewater using Gliomastix indicus MTCC 3869. Biochem. Eng. J. 40, 293-303.
Sokol, W., 1987. Oxidation of an inhibitory substrate by washed cells (oxidation of phenol by Pseudomonas putida. Biotechnol. Bioeng. 30, 921-927.
Tan, Y., Wang, Z. X., Marshall, K. C., 1996. Modelling substrate inhibition of microbial growth. Biotechnol. Bioeng. 52, 602-608.
Tana, A., Pan, H., 2005. Predictive neural networks for gene expression data analysis. Neural Net. 18 297–306
Tang, W. T., Liang-Shih, F., 1987. Steady State Phenol Degradation in a Draft-Tube, Gas-Liquid-Solid Fluidized-Bed Bioreactor AIChE journal. 33, 239–249.
Thiele, I., Vo, T. D., Price, N. D., Palsson, B., 2005. An expanded metabolic reconstruction of Helicobacter pylori (iIT341 GSM/GPR): An in silico genome-scale characterization of single and double deletion mutants. J. Bacteriol. 187, 5818-5830.
198

Timmis, K. N., 2002. Pseudomonas putida: a cosmopolitan opportunist par excellence. Environ. Microbiol. 4, 779-781.
Tizzard, A. C., Lloyd-Jones, G., 2007. Bacterial oxygenases: In vivo enzyme biosensors for organic pollutants. Biosens. Bioelectron. 22, 2400–2407.
Tropel, D., van der Meer, J. R., 2004. Degradation pathways of aromatic bacterial transcriptional regulators for compounds. Microbiol. Mol. Biol. Rev. 68, 474-500.
Tros, M. E., Schraa, G., Zehnder, A. J. B., 1996. Transformation of low concentrations of 3-chlorbenzoate by Pseudomonas sp. strain B13: kinetics and residual concentrations. Appl. Environ. Microbiol. 62, 437-442.
Tsao, G. T., Hanson, T. P., 1975. Extended Monod equation for batch cultures with multiple exponential phases. Biotechnol. Bioeng. 17, 1591–1598.
Tsipa, A., Koutinas, M., Pistikopoulos, E. N., Mantalaris, A., 2015. Transcriptional kinetics of the cross-talk between the ortho-cleavage and TOL pathways of toluene biodegradation in Pseudomonas putida mt-2 (submitted).
Valls, M., Buckle, M., de Lorenzo, V., 2002. In vivo UV laser footprinting of the Pseudomonas putida sigma 54 Pu promoter reveals that integration host factor couples transcriptional activity to growth phase. J. Biol. Chem. 277, 2169-2175.
Van Dedem, G., Moo-Young, M., 1975. A model for diauxic growth. Biotechnol. Bioeng. 17, 1301–1312.
van Someren, E. P., Wesselsa, L. F. A., Reindersa, M. J. T., Linear modeling of genetic networks from experimental data. Intelligent Systems for Molecular Biology (ISMB 2000), San Diego,CA, 2000.
Velazquez, F., di Bartolo, I., de Lorenzo, V., 2004. Genetic evidence that catabolites of the Entner-Doudoroff pathway signal C source repression of the σ54 Pu promoter of Pseudomonas putida. J. Bacteriol. 186 8267–8275.
Velazquez, F., Parro, V., de Lorenzo, V., 2005. Inferring the genetic network of m-xylene metabolism through expression profiling of the xyl genes of Pseudomonas putida mt-2. Mol. Microbiol. 57, 1557-1569.
Venkatesh, K. V., Doshi, P., Rengaswamy, R., 1997. An optimal strategy to model microbial growth in a multiple substrate environment. Biotechnol. Bioeng. 56, 635–644.
Vercellone-Smith, P., Herson, D. S., 1997. Toluene elicits a carbon starvation response in Pseudomonas putida mt-2 containing the TOL plasmid pWW0. Appl. Environ. Microbiol. 63, 1925–1932.
Vohradsky, J., 2001. Neural network model of gene expression. FASEB J. 15, 846-854. Wang, Z., Yang, F., Ho, D. W. C., Swift, S., Tucker, A., Liu, X., 2008. Stochastic Dynamic
Modeling of Short Gene Expression Time-Series Data. IEEE Trans. Nanobioscience 7, 44-55.
Weiss, R., Cellular computation and communications using engineered genetic regulatory networks. MIT,USA., Cambridge, 2001.
Weiss, R., 2003. Challenges and opportunities in programming living cells. Weiss, R., Basu, S., Hooshangi, S., Kalmbach, A., Karig, D., Mehreja, R., Netravali, I., 2003.
Genetic circuit building blocks for cellular computation, communications, and signal processing. Nat. Comput. 2, 47–84.
Williams, P. A., Murray, K., 1974. Metabolism of benzoate and the methylbenzoates by Pseudomonas putida (arvilla) mt-2: Evidence for the Existence of a TOL Plasmid. J. Bacteriol. 120, 416-423.
Williams, P. A., Sayers, J. R., 1994. The evolution of pathways for aromatic hydrocarbon oxidation in Pseudomonas. Biodegradation. 5, 195-217.
199

Williams, P. A., Shaw, L. M., Pitt, C. W., Vrecl, M., 1997. xylUW, two genes at the start of the upper pathway operon of TOL plasmid pWW0 , appear to play no essential part in determining its catabolic phenotype. Microbiology. 143, 101-107.
Xie, N. Z., Liang, H., Huang, R. B., Xu, P., 2014. Biotechnological production of muconic acid: current status and future prospects. Biotech. Adv. 32, 615-622.
Yano, T., Koga, S., 1969. Dynamic behavior of the chemostat subject to substrate inhibition. Biotechnol. Bioeng. 11, 139-153.
Yeo, D., Kiparissides, A., Min Cha, J., Aguilar-Gallardo, C., Polak, J. M., Tsiridis, E., Pistikopoulos, E. N., Mantalaris, A., 2013. Improving embryonic stem cell expansion through the combination of perfusion and bioprocess model design. PLoS one. 8, e81728.
Yokobayashi, Y., Collins, C. H., Leadbetter, J. R., Weiss, R., Arnold, F. H., 2003. Evolutionary design of genetic circuits and cell-cell communications. Adv. Complex Syst. 6, 1-9.
Yokobayashi, Y., Weiss, R., Arnold, F. H., 2002. Directed evolution of a genetic circuit. Proc. Natl. Acad. Sci. USA. 99, 16587-16591.
Yoon, Y., Klinzing, G., Blanch, W., 1977. Competition for mixed substrates by microbial populations. Biotech. Bioeng. 19, 1193-1210.
You, L., Cox, R. S., Weiss, R., Arnold, F. H., 2004. Programmed population control by cell-cell communication and regulated killing. Nature. 428, 868-871.
Yu, H., Kim, B. J., Rittmann, B. E., 2001. A two-step model for the kinetics of BTX degradation and intermediate formation by Pseudomonas putida F1. Biodegradation. 12, 465–475.
Yuste, L., Rojo, F., 2001. Role of the crc gene in catabolic repression of the Pseudomonas putida GPo1 alkane degradation pathway. J. Bacteriol. 183, 6197–6206.
200
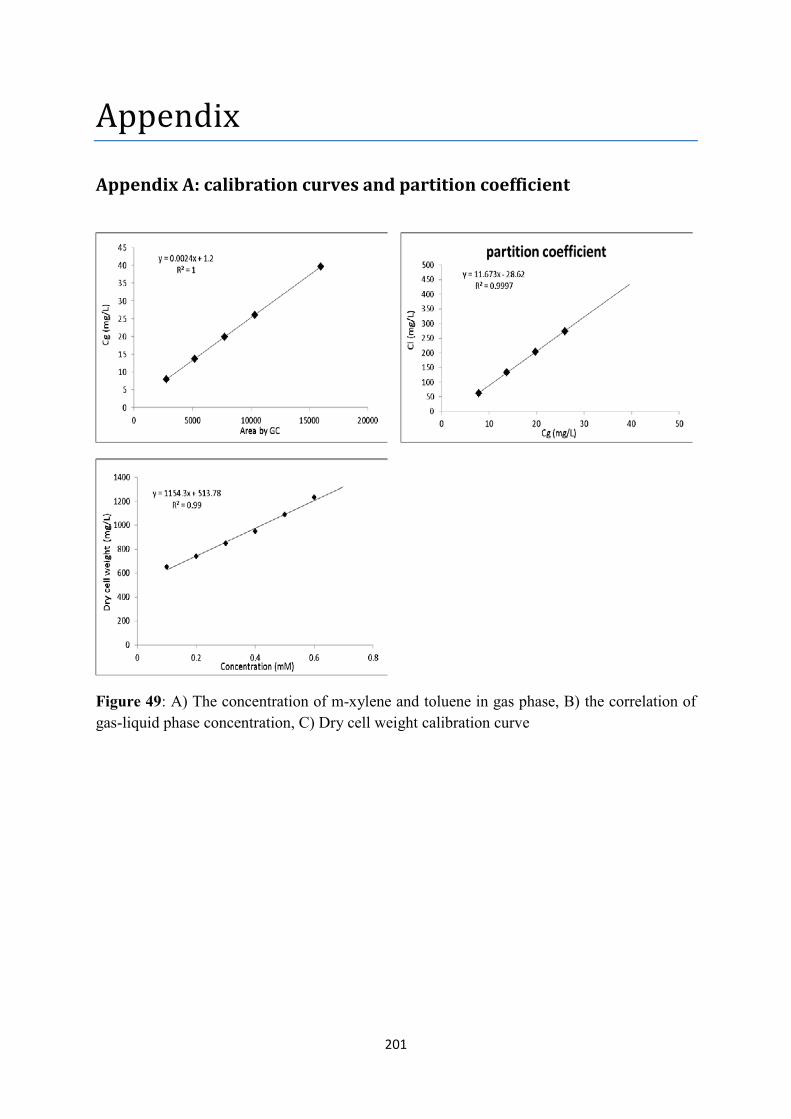
Appendix
Appendix A: calibration curves and partition coefficient
201

Appendix B: experimentally estimated parameters of Monod, Mankad, SKIP and competitive enzymatic interactions models
Table 21: estimated parameters of double Monod, Mankad and Bungay, SKIP, sum kinetics with competitive enzymatic interactions models
parameters Double Monod Mankad and Bungay SKIP
Competitive enzymatic
interactions Ytoluene 0.99 0.99 0.99 0.99
Ym-xylene 0.99 0.99 0.99 0.99 Ktoluene 0.1 0.46 0.0353 0.7
Km-xylene 0.1 0.7 0.7 0.7 μmax 0.0005 0.001
μmax,toluene 0.0003 0.002 μmax,m-xylene 0.001 0.0007
Itoluene 0.004 Im-xylene 0.0003
202