connecting your clients to additional resources ellen mackall 1
TRANSCRIPT

1
Connecting your Clients to Additional Resources
Ellen Mackall
2
Contents
• Heating/utility assistance programs
• 211/InfoLine
• SNAP
• Promoting SNAP at your agency
3
HEAP: Heating Assistance
Home
Energy
Assistance
Program
One-time credit to heating bill
Eligibility: 200% of poverty level
4
HEAP: Heating Assistance
• Clients can fill out application and mail in– Attach proof of income for 12 months & copy of
utility bills
• Appointment at Community Action Agency NOT required!
• Save your clients time by providing HEAP applications in the winter!
• Spanish applications available too
5
PIPP: Utility Assistance
Percentage of
Income
Payment
Plan
PLUS

6
PIPP: Utility Assistance
• Utilities regulated by PUCO (heat)• Heat and electric• Pay 6% of income for gas, 6% for electric
– OR: 10% of income for all-electric
• Applications mailed Ohio Development Services Agency
• Request brochures for clients (free)
7
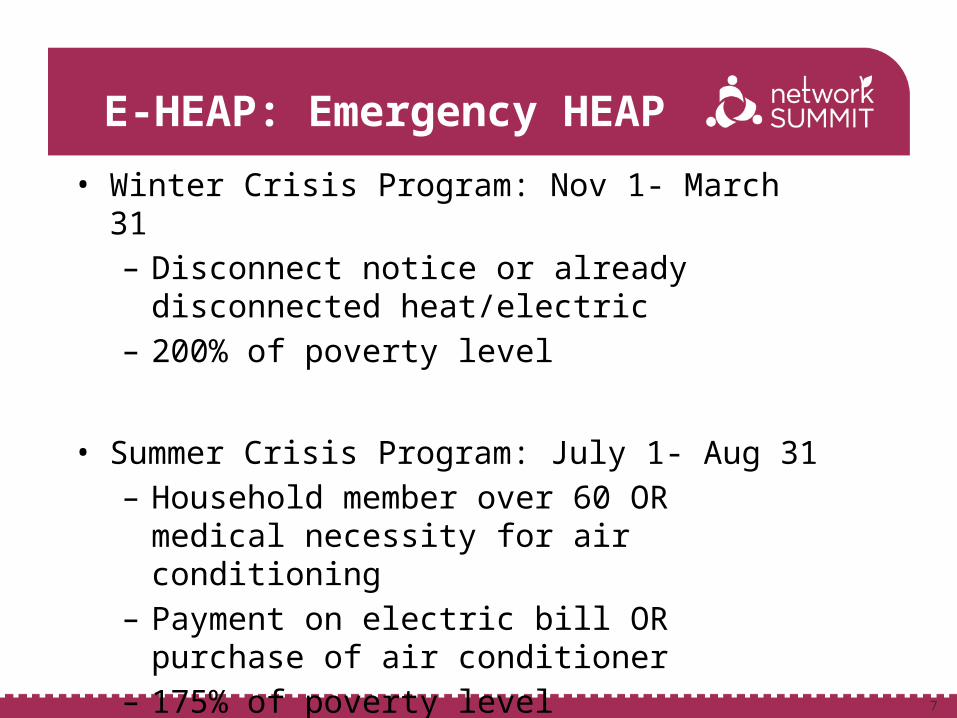
E-HEAP: Emergency HEAP
• Winter Crisis Program: Nov 1- March 31– Disconnect notice or already disconnected
heat/electric– 200% of poverty level
• Summer Crisis Program: July 1- Aug 31– Household member over 60 OR medical
necessity for air conditioning– Payment on electric bill OR purchase of air
conditioner– 175% of poverty level
8
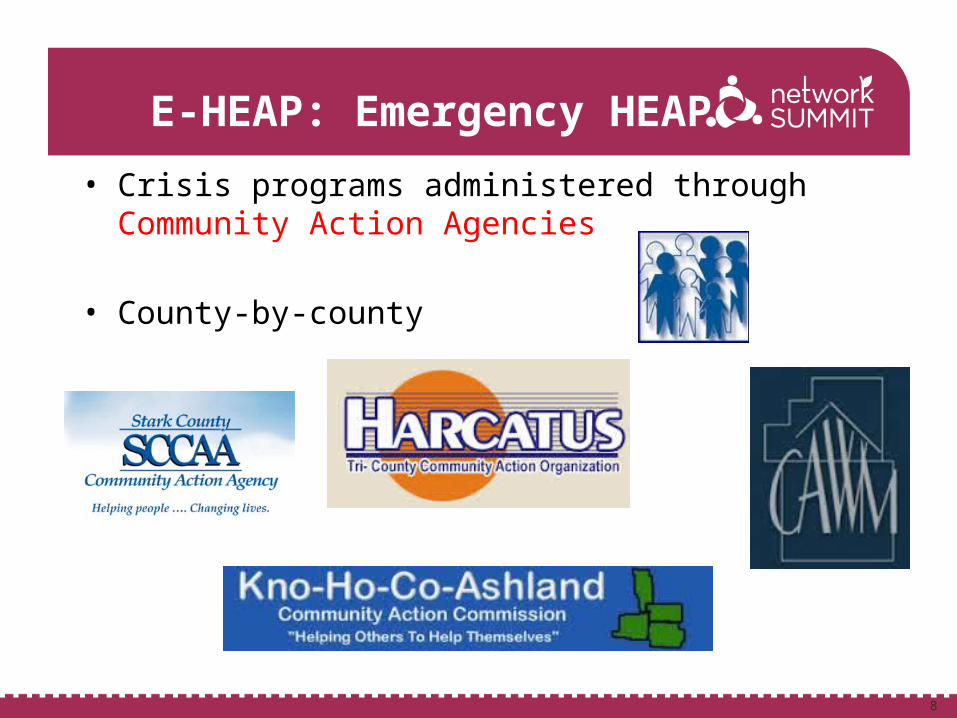
E-HEAP: Emergency HEAP
• Crisis programs administered through Community Action Agencies
• County-by-county

9
Help! My clients are asking questions I can’t answer about other social services!
• Who gives out clothes?• Who helps with rent payments?• Who provides eyeglasses?• Who provides legal aid?• Where can I get counseling?
10
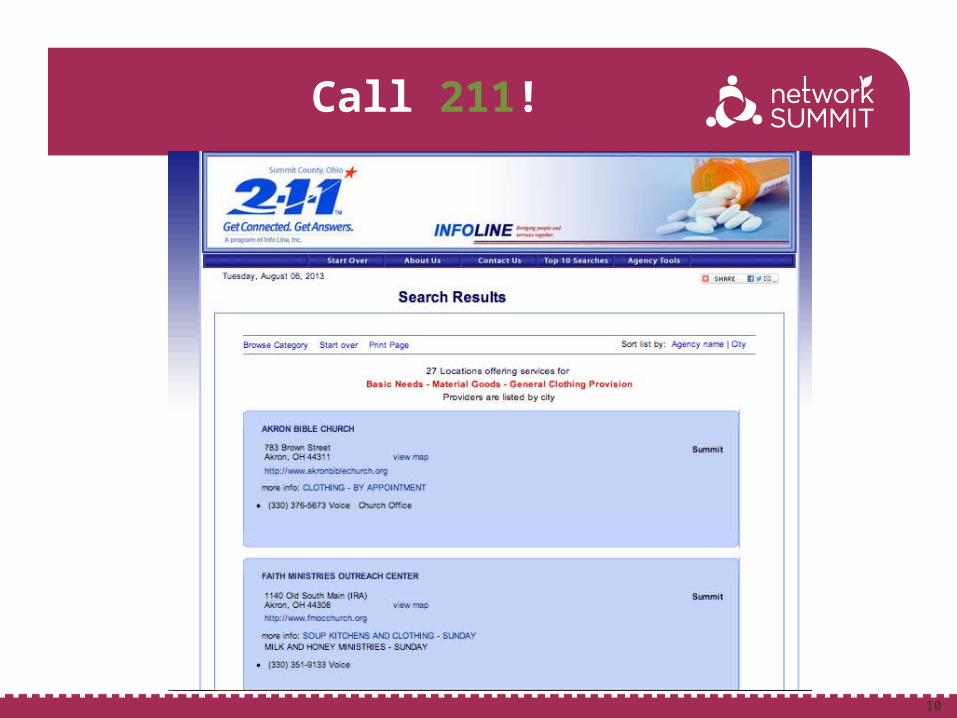
Call 211!
11
Additional food programs
• If clients need more pantry/hot meal recommendations
Getfoodhelp.org OR www.akroncantonfoodbank.org/need-
food.aspx
• Or: call us at 855-560-0850
12
Introduction to SNAP
Supplemental
Nutrition
Assistance
Program
“Food stamps” SNAP
USDA Food and Nutrition Service
13
Introduction to SNAP
• 16% of Ohioans (1,845,000 people)
• 21% of eligible Ohioans aren’t receiving
• 69% of SNAP participants are in families with children (OH)
• Average household: less than 1 year on SNAP
Center on Budget and Policy Priorities state fact sheet
14
New card (August 2013)
15
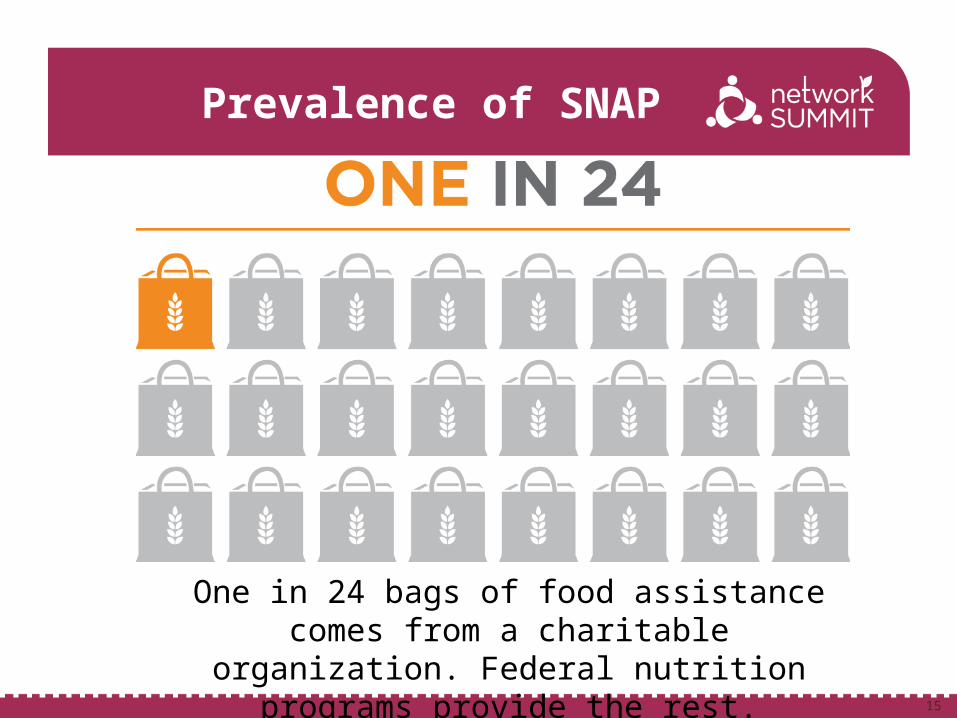
Prevalence of SNAP
One in 24 bags of food assistance comes from a charitable organization. Federal nutrition
programs provide the rest.
16
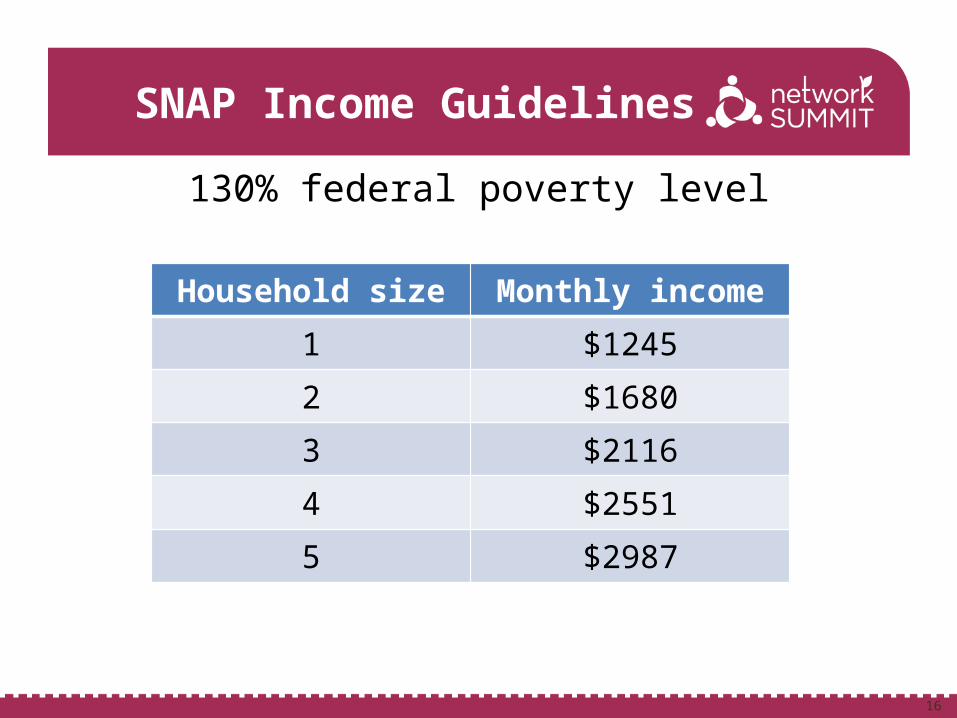
SNAP Income Guidelines
130% federal poverty level
Household size Monthly income1 $12452 $16803 $21164 $25515 $2987
17
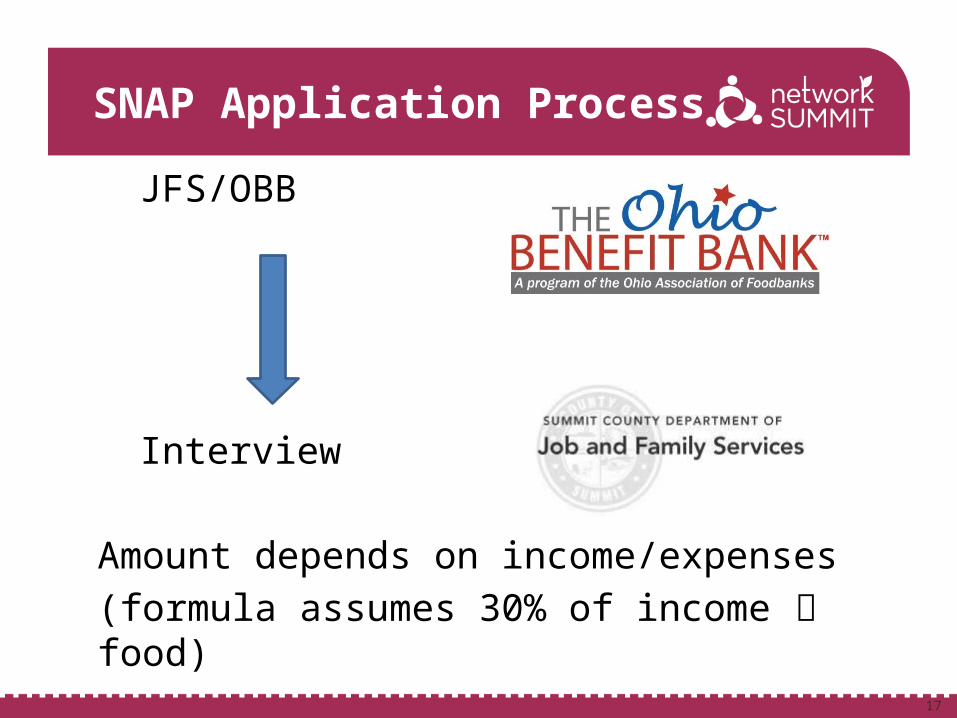
SNAP Application Process
JFS/OBB
Interview
Amount depends on income/expenses
(formula assumes 30% of income food)
18
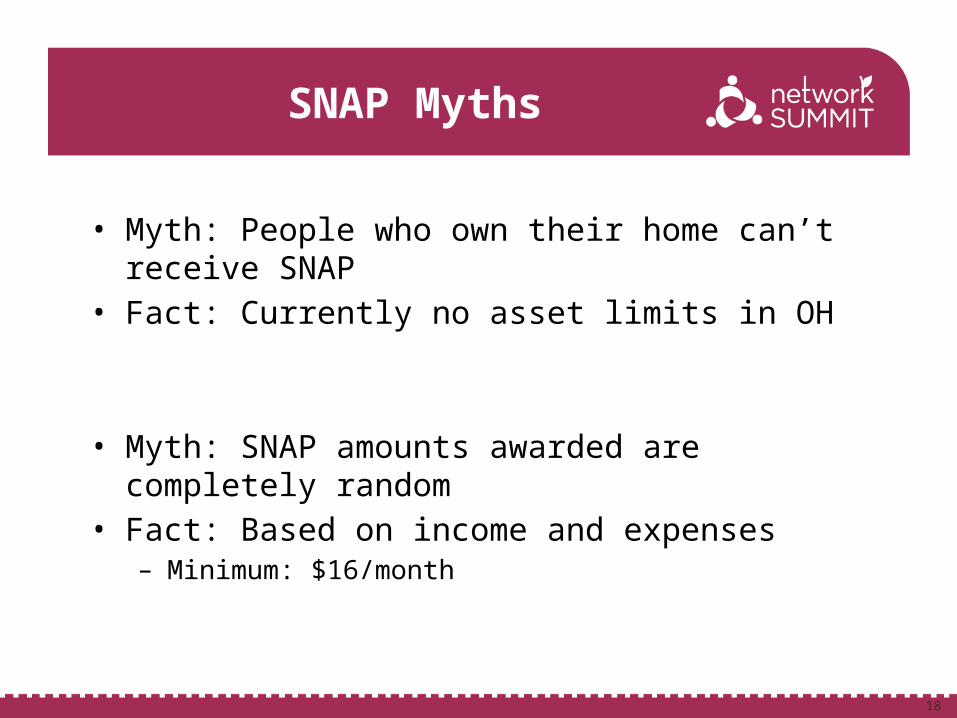
SNAP Myths
• Myth: People who own their home can’t receive SNAP
• Fact: Currently no asset limits in OH
• Myth: SNAP amounts awarded are completely random
• Fact: Based on income and expenses– Minimum: $16/month
19
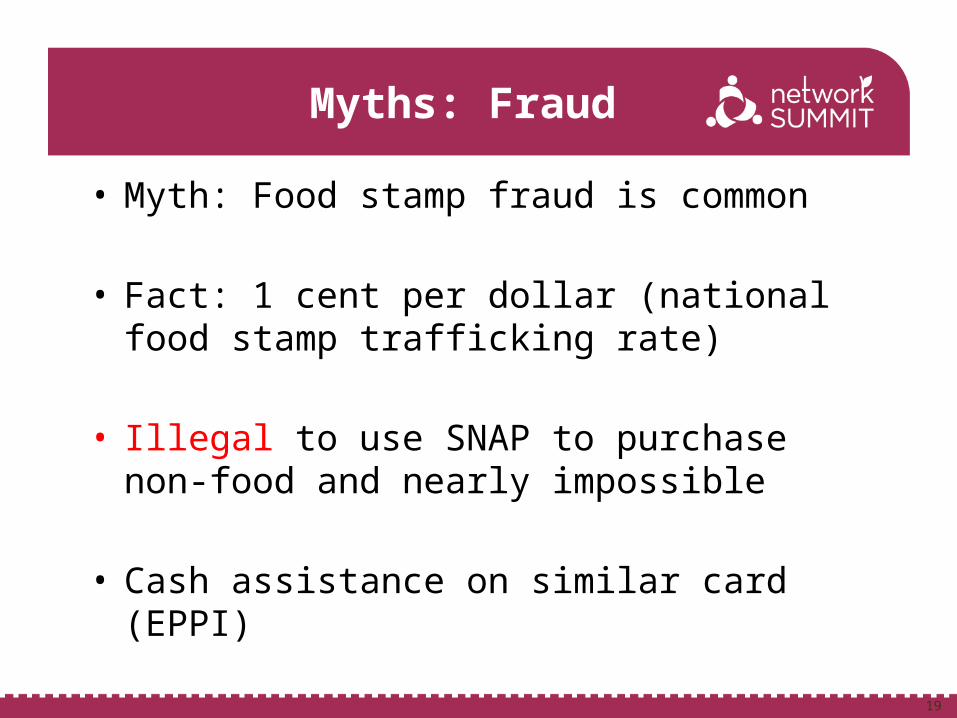
Myths: Fraud
• Myth: Food stamp fraud is common
• Fact: 1 cent per dollar (national food stamp trafficking rate)
• Illegal to use SNAP to purchase non-food and nearly impossible
• Cash assistance on similar card (EPPI)
20
Myths: SNAP and pantries
• Myth: People receiving SNAP don’t need food from pantries too
• Fact: Average monthly SNAP benefit per person = $138.60 (OH)$1.54/person/meal
• 90% redeemed by the 21st of the month
21
Myths: SNAP and pantries
• Myth: Everyone who comes to a food pantry is already receiving SNAP
• Fact: Only 55% of food insecure individuals are eligible for SNAP
22
SNAP Myths
• Myth: Everyone who needs SNAP is already receiving it.
• Fact: 86% of eligible households with children participate
Only 35% of eligible seniors receive SNAP 65% of working families participate
23
SNAP Myths
• Myth: People receiving SNAP are only using it to buy junk food
• Fact: 85% of benefits used for nutritious foods
Comparable to patterns for low/moderate-income households without SNAP
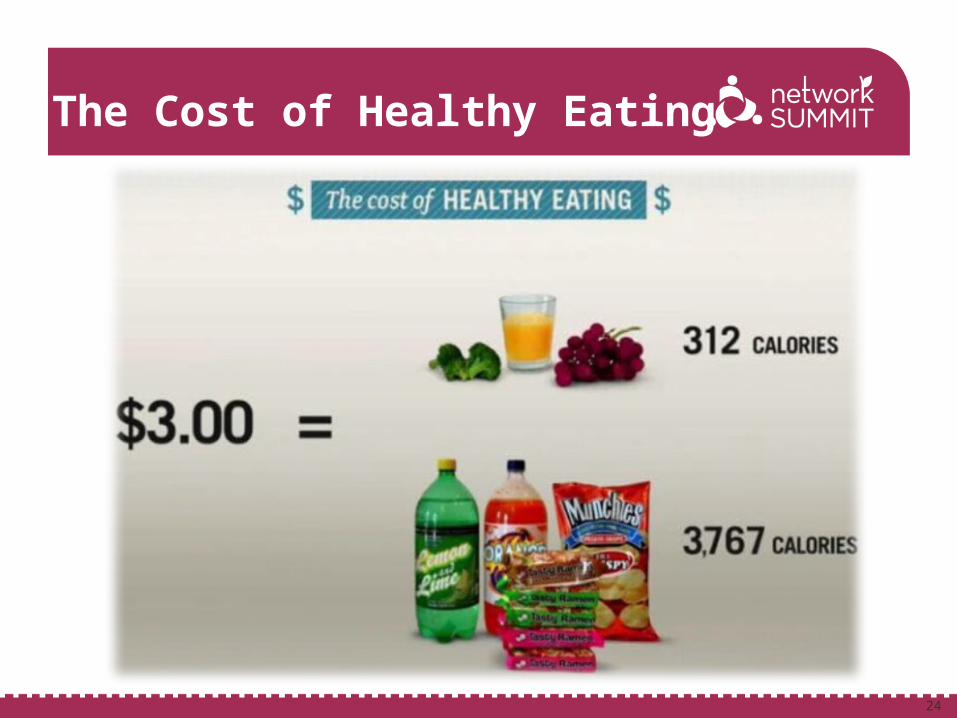
24
The Cost of Healthy Eating
25
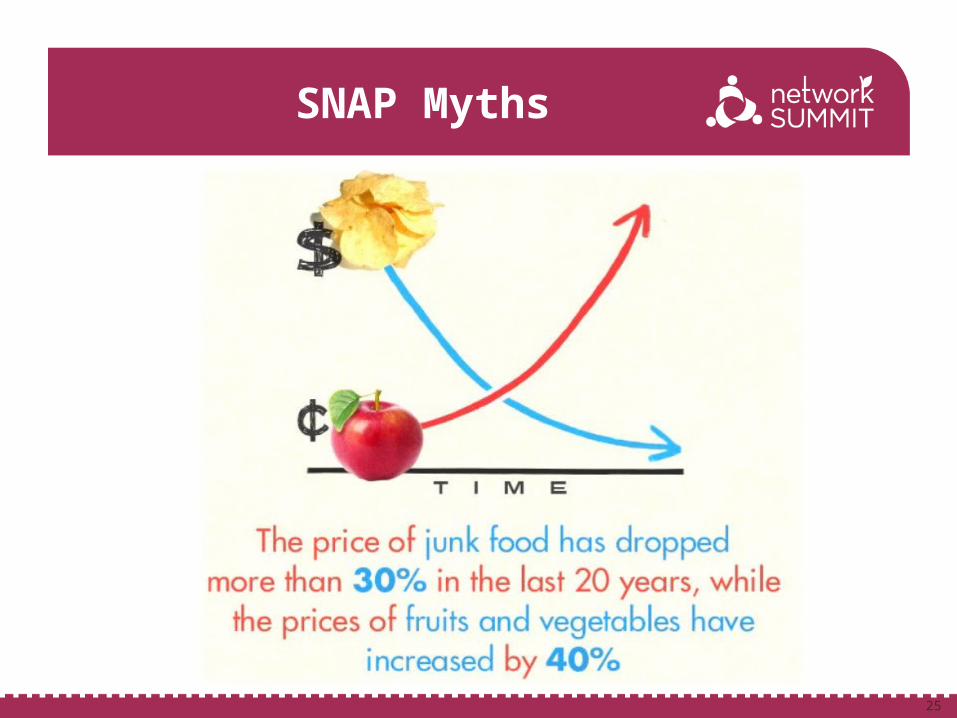
SNAP Myths
26
SNAP Myths
• Myth: Most people on SNAP are just “living off the system”
• Fact: 4 out of 5 SNAP participants are not expected to work (children, elderly, disabled) OR are working
82% of working-age adults worked previous year, that year, or next year (87% for parents)
27
SNAP and Food Security
Household level:
• Reduces food insecurity 20% for high-risk children and improves health
• Recession: increase in participation as unemployment grew
28
SNAP and Food Security
• 40% of SNAP households have incomes below half of the poverty level
• 50% poverty level = $814/month for
family of 3
29
SNAP and Food Security
Impact on community:• $1 SNAP $1.73 economic activity
• $3 billion Ohio’s economy (2012)
• 82% of benefits redeemed at grocery stores
• Only 5% redeemed at convenience stores
30
SNAP and Farmers’ Markets
• Many now accept SNAP2012:
• Alliance Farmers’ Market• Countryside Conservancy (Peninsula/Akron)• Medina County Farmers’ Market• Tuscarawas Valley Family Farmers’ Market
• Programs to double SNAP
31
State of SNAP
• Benefit amounts November 2013
• $20-25/month decrease ($240 yearly)
• Farm Bill hasn’t passed

32
Why does SNAP matter?
When benefits are cut, not everyone can make up the difference
More demand at pantries/hot meals
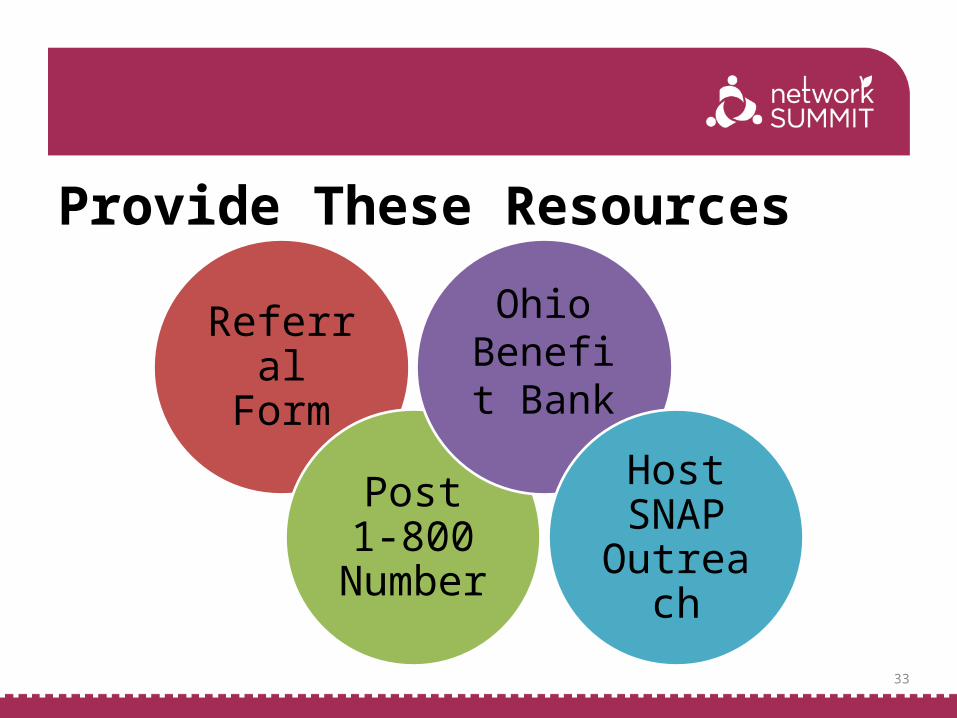
Provide These Resources
33
Referral Form
Post 1-800
Number
Host SNAP
Outreach
Ohio Benefit
Bank

1-(855)560-0850
34
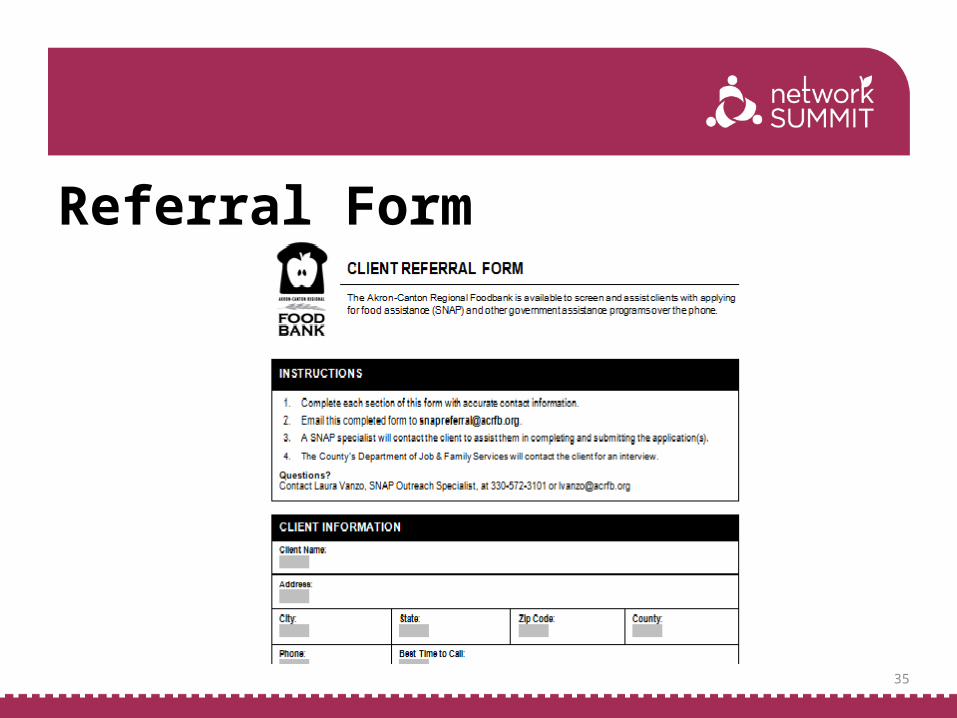
Referral Form
35
Host a SNAP Outreach Worker• A member of our SNAP
outreach team can come to your pantry and speak with your clients
36
Ohio Benefit Bank • Help a client with applications at your agency. • Train your volunteers • Free
37
38
Thank you!
Ellen Mackall, OBB Counselor/HarvestCorps member
330-777-1050
Laura Vanzo, SNAP Outreach Specialist
330-572-3101