connection between version control operations and … · supposed that there is a connection...
TRANSCRIPT

Acta Cybernetica 21 (2014) 585–607.
Connection Between Version Control Operations
and Quality Change of the Source Code
Csaba Faragó∗, Péter Hegedűs†, Ádám Zoltán Végh∗,and Rudolf Ferenc∗
Abstract
Software erosion is a well-known phenomena, meaning that software qual-ity is continuously decreasing due to the ever-ongoing modifications in thesource code. In this research work we investigated this phenomena by study-ing the impact of version control commit operations (add, update, delete) onthe quality of the code.
We calculated the ISO/IEC 9126 quality attributes for thousands of revi-sions of an industrial and three open-source software systems with the help ofthe Columbus Quality Model. We also collected the cardinality of each ver-sion control operation type for every investigated revision. We performed Chi-squared tests on contingency tables with rows of quality change and columnsof version control operation commit types. We compared the results withrandom data as well.
We identified that the relationship between the version control operationsand quality change is quite strong. Great maintainability improvements aremostly caused by commits containing Add operation. Commits containingfile updates only tend to have a negative impact on the quality. Deletionshave a weak connection with quality, and we could not formulate a generalstatement.
Keywords: Software Maintainability, Software Erosion, Source Code VersionControl, ISO/IEC 9126, Case Study
1 Introduction
Software quality plays a crucial role in modern development projects. There isan ever-increasing amount of software systems in maintenance phase, and it is awell-known fact that software systems are eroding [15], meaning that in generaltheir quality is continuously decreasing due to the ever-ongoing modifications in its
∗University of Szeged Department of Software Engineering, Árpád tér 2. H-6720 Szeged,Hungary, E-mail: {farago,azvegh,ferenc}@inf.u-szeged.hu
†MTA-SZTE Research Group on Artificial Intelligence, Szeged, Hungary, E-mail:[email protected]
586 Csaba Faragó et al.
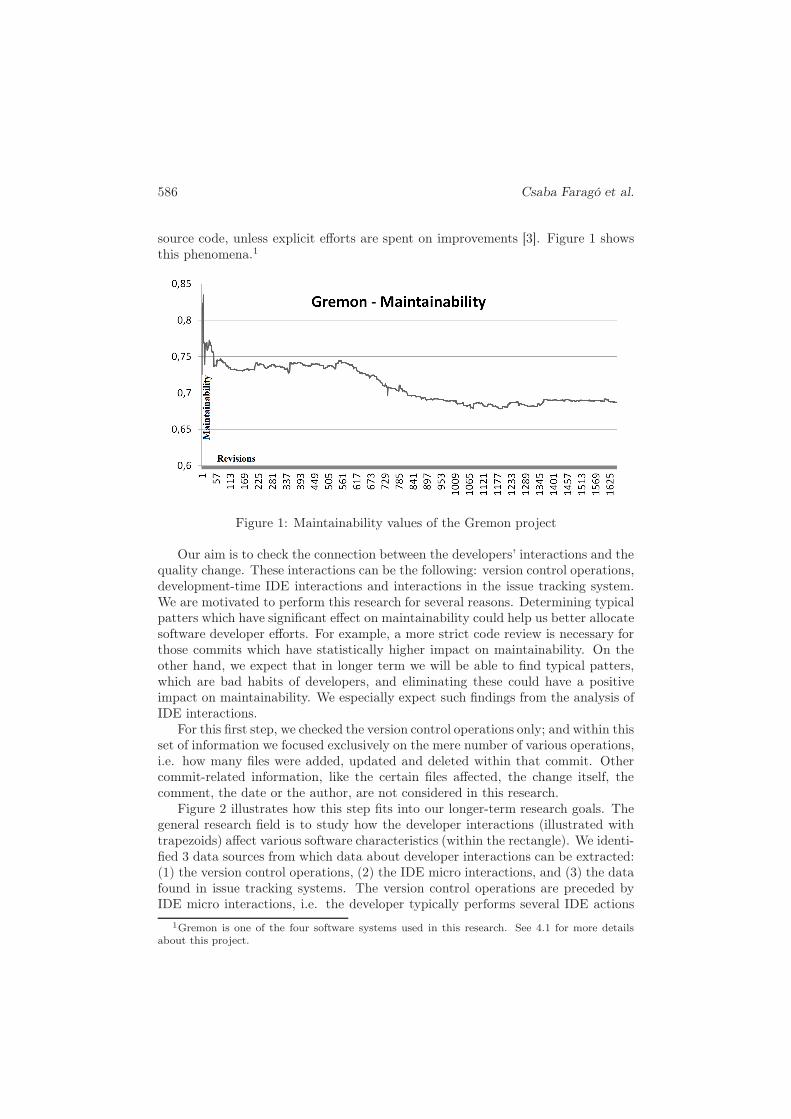
source code, unless explicit efforts are spent on improvements [3]. Figure 1 showsthis phenomena.1
Figure 1: Maintainability values of the Gremon project
Our aim is to check the connection between the developers’ interactions and thequality change. These interactions can be the following: version control operations,development-time IDE interactions and interactions in the issue tracking system.We are motivated to perform this research for several reasons. Determining typicalpatters which have significant effect on maintainability could help us better allocatesoftware developer efforts. For example, a more strict code review is necessary forthose commits which have statistically higher impact on maintainability. On theother hand, we expect that in longer term we will be able to find typical patters,which are bad habits of developers, and eliminating these could have a positiveimpact on maintainability. We especially expect such findings from the analysis ofIDE interactions.
For this first step, we checked the version control operations only; and within thisset of information we focused exclusively on the mere number of various operations,i.e. how many files were added, updated and deleted within that commit. Othercommit-related information, like the certain files affected, the change itself, thecomment, the date or the author, are not considered in this research.
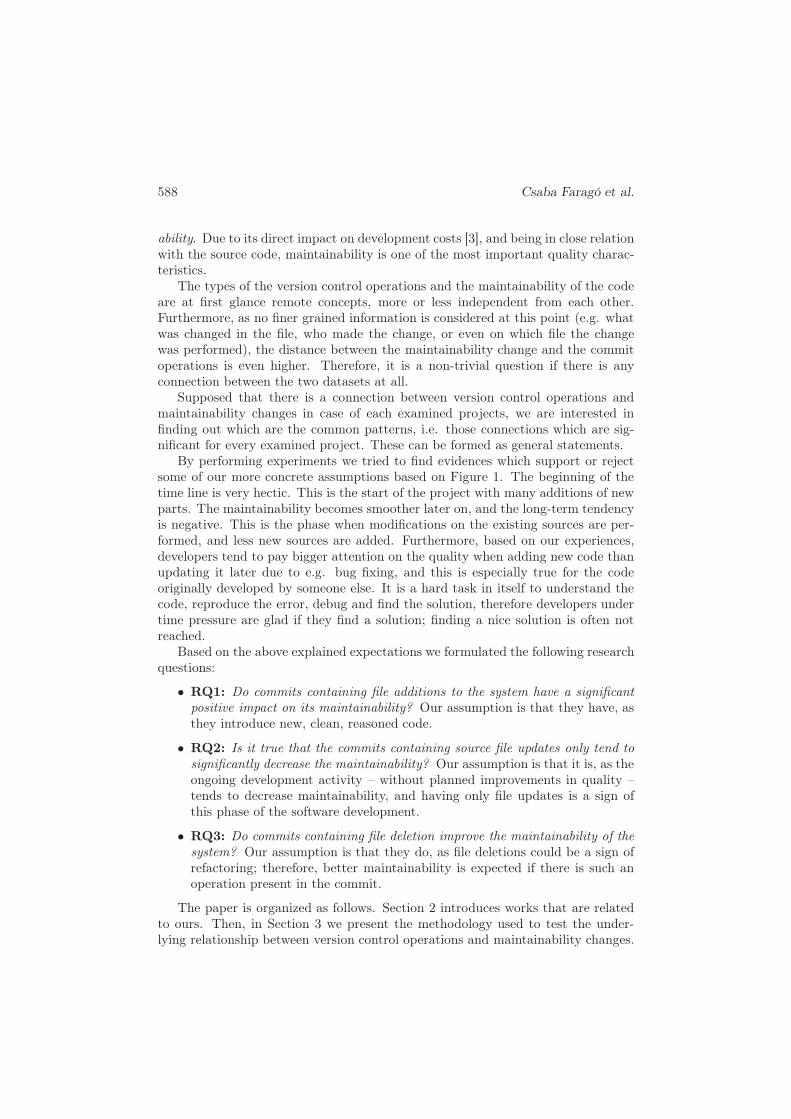
Figure 2 illustrates how this step fits into our longer-term research goals. Thegeneral research field is to study how the developer interactions (illustrated withtrapezoids) affect various software characteristics (within the rectangle). We identi-fied 3 data sources from which data about developer interactions can be extracted:(1) the version control operations, (2) the IDE micro interactions, and (3) the datafound in issue tracking systems. The version control operations are preceded byIDE micro interactions, i.e. the developer typically performs several IDE actions
1Gremon is one of the four software systems used in this research. See 4.1 for more detailsabout this project.

Version Control Operations and Quality Change of the Source Code 587
IDE Micro Interactions
Issue Tracking System
Software
QualityMaintainability
Other measures
Otherattributes
Version Control Operations
Number of Operations
Other Data
Figure 2: Overview
before committing changes. The most exiting area of research would be the IDEinteractions; however, hardly any available data exist, and these are incomplete inmost cases. Furthermore, it is not trivial to assign these interactions to concretecommits, therefore we decided that in the first period we concentrate on versioncontrol interactions only. Data found in the issue tracking system could be alsointeresting in longer term, provided that they contain substantive data about thereality. From the software attributes we selected software quality as worth forinvestigation at first, and among its subcharacteristics, we decided to study main-tainability. The figure provides an overview about the possible directions of futureinvestigations.
This and possibly other future results could help identifying the typical patternswhere code erosion occurs. These patterns could be very useful information forproactive action planning: to find a better distribution of the efforts intended forcode quality improvements.
We were motivated by the question: does the way of introducing code changes(reflected by version control operations of different commits) have a traceable im-pact on software quality? Do all types of commit operations contribute to softwareerosion, or are there exceptions?
For the definition of software quality we refer to the ISO/IEC 9126 standard [8],which defines six high-level characteristics that determine the product quality ofsoftware: functionality, reliability, usability, efficiency, portability, and maintain-
588 Csaba Faragó et al.
ability. Due to its direct impact on development costs [3], and being in close relationwith the source code, maintainability is one of the most important quality charac-teristics.
The types of the version control operations and the maintainability of the codeare at first glance remote concepts, more or less independent from each other.Furthermore, as no finer grained information is considered at this point (e.g. whatwas changed in the file, who made the change, or even on which file the changewas performed), the distance between the maintainability change and the commitoperations is even higher. Therefore, it is a non-trivial question if there is anyconnection between the two datasets at all.
Supposed that there is a connection between version control operations andmaintainability changes in case of each examined projects, we are interested infinding out which are the common patterns, i.e. those connections which are sig-nificant for every examined project. These can be formed as general statements.
By performing experiments we tried to find evidences which support or rejectsome of our more concrete assumptions based on Figure 1. The beginning of thetime line is very hectic. This is the start of the project with many additions of newparts. The maintainability becomes smoother later on, and the long-term tendencyis negative. This is the phase when modifications on the existing sources are per-formed, and less new sources are added. Furthermore, based on our experiences,developers tend to pay bigger attention on the quality when adding new code thanupdating it later due to e.g. bug fixing, and this is especially true for the codeoriginally developed by someone else. It is a hard task in itself to understand thecode, reproduce the error, debug and find the solution, therefore developers undertime pressure are glad if they find a solution; finding a nice solution is often notreached.
Based on the above explained expectations we formulated the following researchquestions:
• RQ1: Do commits containing file additions to the system have a significantpositive impact on its maintainability? Our assumption is that they have, asthey introduce new, clean, reasoned code.
• RQ2: Is it true that the commits containing source file updates only tend tosignificantly decrease the maintainability? Our assumption is that it is, as theongoing development activity – without planned improvements in quality –tends to decrease maintainability, and having only file updates is a sign ofthis phase of the software development.
• RQ3: Do commits containing file deletion improve the maintainability of thesystem? Our assumption is that they do, as file deletions could be a sign ofrefactoring; therefore, better maintainability is expected if there is such anoperation present in the commit.
The paper is organized as follows. Section 2 introduces works that are relatedto ours. Then, in Section 3 we present the methodology used to test the under-lying relationship between version control operations and maintainability changes.

Version Control Operations and Quality Change of the Source Code 589
Section 4 discusses the results of the performed statistical tests and summarizesour findings. In Section 5 we list the possible threats to the validity of the results,while Section 6 concludes the paper.
2 Related Work
The version control system and other types of development related repositories(e.g. bug tracking system) provide a rich source for data mining approaches. Theseapproaches can be used for collecting different kinds of process metrics, identifybug introducing or bug fixing changes, create bug prediction models, etc. In thepresented paper we focus on finding traceable evidences of the relationship betweenthe changes in software maintainability and the different types of version controloperations in developer commits; but first, we collect the works dealing with similarresearches to ours.
There are works which focus on the effect of software processes to the productquality [10]. Hindle et al. [7] deal with understanding the rationale behind largecommits. They contrast large commits against small commits and show that largecommits are more perfective, while small commits are more corrective. Bachmannand Bernstein [4] explore among others if the process quality, as measured by theprocess data, has an influence on the product quality. They showed that the productquality – measured by number of bugs reported – is affected by process data qualitymeasures.
There are also others who utilize process metrics to detect failure-prone compo-nents of the software [9, 12]. Nagappan et al. show that applying different processmetrics significantly improves the accuracy of the fault-prone class prediction [14].They also present an empirical case study [13] of two large-scale commercial oper-ating systems, Windows XP and Windows Server 2003, where they leverage varioushistorical in-process and product metrics to create statistical predictors to estimatethe post-release failures. We think that the number of defects revealed in the code isonly one aspect of maintainability. Moreover, our aim is not to predict fault-proneparts of the source code, but to get a general picture about the effect of the waychanges are introduced (i.e. version control operations in the commit) to softwaremaintainability.
Lots of works build models for predicting refactorings based on version controlhistory analysis [18,19]. Moser et al. [11] developed an algorithm for distinguishingcommits resulted by refactorings from those of other types of changes. Peters andZaidman [16] investigate the lifespan of code smells and the refactoring behaviorof developers by mining the software repository of seven open-source systems. Theresults of their study indicate that engineers are aware of code smells, but are notvery concerned by their impact, given the low refactoring activity.
There are also papers that try to reveal the change-proneness of different sourcecode elements [20, 23] based on version control history. Giger et al. [5] exploreprediction models for whether a source file will be affected by a certain type ofsource code change. For that, they use change data of the Eclipse platform and the
590 Csaba Faragó et al.
Azureus 3 project. Ying et al. [21] have developed an approach that applies datamining techniques to determine change patterns – sets of files that were changedtogether frequently in the past – from the change history of the code base. Our focusis not on introducing a new sophisticated repository mining technique and applyingit for some kind of prediction. We use the number and types of different versioncontrol operations and examine the effect they have on software maintainability.
In this research we analyzed Java source code, as the used quality model handlesthat programming language. A quality model for C# was presented by Hegedűs [6].
3 Methodology
This section summarizes the types of collected data during the experiment anddescribes the methodology of analyzing them. Particularly, we describe what weexactly mean under version control operations and maintainability change, and themethodology used to analyze the data.
3.1 Version Control Operations
In this work we investigated the number of various version control operations of theexamined commits. Only the mere numbers of various operations were considered,e.g. 2 files were added, 5 files were updated and 1 file was deleted within theexamined commit. We omitted every other version control-related data, e.g. thedate, the names of the affected files, the author of the file, or the comment of thefiles. These data will be used for finer-grained analysis in the future.
We analyzed only Java source files, so we skipped all other types of file systementries like directories or non-Java files (e.g. xml files). We did this because thecurrent version of the used quality model considers only the Java source files. Be-sides Add, Update, and Delete, there is a fourth version control operation: Rename.As there were hardly any Rename operations in the examined data (it occurredonly in one of the analyzed projects with very low cardinality) this operation wasnot considered. Therefore, the input data collected from the version control systemwas an integer triple for each commit containing at least one Java source file:
• A - the total number of file additions,
• U - the total number of file updates,
• D - the total number of file deletions.
3.2 The Applied Quality Model
To calculate the absolute maintainability values for every revision of the systemswe used ColumbusQM, our probabilistic software quality model [2] that is basedon the quality characteristics defined by the ISO/IEC 9126 [8] standard. Thecomputation of the high-level quality characteristics is based on a directed acyclic
Version Control Operations and Quality Change of the Source Code 591
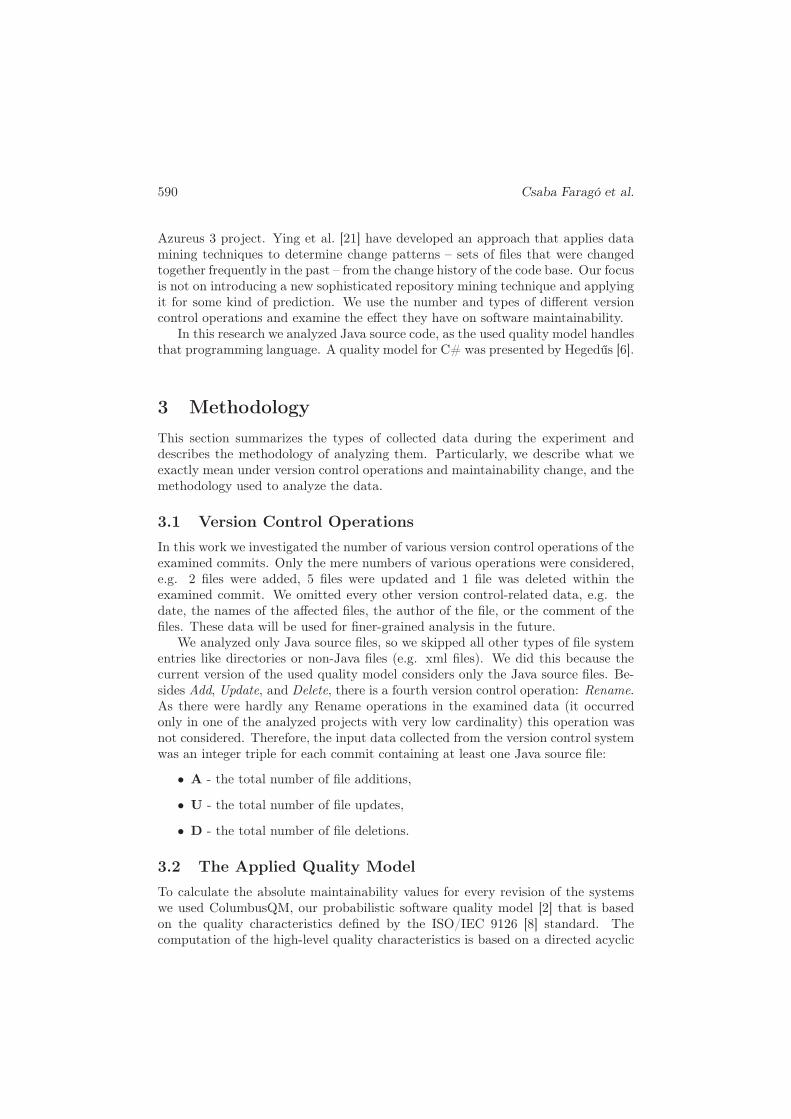
graph (see Figure 3) whose nodes correspond to quality properties that can either beinternal (low-level) or external (high-level). Internal quality properties characterizethe software product from an internal (developer) view and are usually estimatedby using source code metrics. External quality properties characterize the softwareproduct from an external (end user) view and are usually aggregated somehowby using internal and other external quality properties. The nodes representinginternal quality properties are called sensor nodes as they measure internal qualitydirectly (white nodes in Figure 3). The other nodes are called aggregate nodesas they acquire their measures through aggregation. In addition to the aggregatenodes defined by the standard (dark gray nodes) we also introduced new ones (lightgray nodes).
Figure 3: ColumbusQM – Java ADG
The current version of the model applies the following source code metrics:
• LLOC (Logical Lines Of Code) – the LLOC metric is the number of non-comment and non-empty lines of code.
• NOA (Number Of Ancestors) – NOA is the number of classes that a givenclass directly or indirectly inherits from.
• NLE (Nesting Level Else-if) – NLE for a method is the maximum of thecontrol structure depth. Only if, switch, for, foreach, while, and do. . . whileinstructions are taken into account and in the if-else-if constructs only thefirst if instruction is considered.
• CBO (Coupling Between Object classes) – a class is coupled to another if theclass uses any method or attribute of the other class or directly inherits fromit. CBO is the number of coupled classes.
592 Csaba Faragó et al.
• CC (Clone Coverage) – clone coverage is a real value between 0 and 1 thatexpresses what amount of the item is covered by code duplication.
• NUMPAR (NUMber of PARameters) – the number of parameters of the meth-ods.
• McCC (McCabe’s Cyclomatic Complexity) – the value of the metric is calcu-lated as the number of the following instructions plus 1: if, for, foreach, while,do-while, case label (which belongs to a switch instruction), catch, conditionalstatement (?:).
• NII (Number of Incoming Invocations) – the number of other methods andattribute initializations which directly call the method. If a method is invokedseveral times from the same method or attribute initialization, it is countedonly once.
• NOI (Number of Outgoing Invocations) – the number of directly called meth-ods. If a method is invoked several times, it is counted only once.
• WarningP1/P2/P3 (Serious/medium/minor coding rule violations) – thenumber of serious/medium/minor PMD (http://pmd.sourceforge.net/)rule violations in the class.
The edges of the graph represent dependencies between an internal and an ex-ternal or two external properties. The aim is to evaluate all the external qualityproperties by performing an aggregation along the edges of the graph, called At-tribute Dependency Graph (ADG). We calculate a so called goodness value (fromthe [0,1] interval) for each node in the ADG that expresses how good or bad (1 is thebest) is the system regarding that quality attribute. The probabilistic statisticalaggregation algorithm uses a so-called benchmark as the basis of the qualification,which is a source code metric repository database with 100 open source and indus-trial software systems. For further details about ColumbusQM, see our previouswork by Bakota et al. [2].
3.3 Contingency Table
The contingency table is a two-dimensional table with the maintainability changesin the rows and version control operation categories in columns, and the cells con-taining the total number of commits in the category causing that kind of maintain-ability change.
The maintainability changes were partitioned into three sets:
• +: positive change,
• 0 : no traceable change,
• −: negative change.
Version Control Operations and Quality Change of the Source Code 593
The maintainability change is positive if the calculated value of the actual com-mit is higher than the value of the previous commit, negative if it is lower and 0 ifthe two values are the same.
The commits were divided into several disjoint categories based on the versioncontrol operations they include. The categories were defined based on intuitioncoming from the principal component analysis (PCA) of the industrial project’sdata set. We defined the following categories:
• D: commits containing at least one Delete operation,
• A: commits containing no Delete operation, containing at least one Addoperation,
• U+: commits containing Update operations only; the number of Update op-erations is at least 2,
• U1: commits consisting of exactly one Update operation.
Please note that the union of these commits is the full set of examined com-mits. Commits affecting no Java files do not have any effect on the calculatedmaintainability, therefore they were omitted from the calculation.
3.4 Bar Plot Diagrams
In order to visualize the data found in the contingency tables we used proportionalbar plot diagrams (see e.g. Figure 5). Each commit category is represented bya bar, which is divided into 3 parts: the proportion of positive, zero and nega-tive maintainability changes within that category. For a better comparison theproportions of the full commit set are also presented.
We can also get intuitions about the answers of the research questions basedon these diagrams. If there are spectacular differences among categories within aproject, and there are similarities in the diagrams among projects, then it suggeststhat the connection between the version control operation types and the maintain-ability is quite strong, and it even adumbrates the answers on some of the researchquestions.
3.5 Contingency Chi-squared Test
To give well-grounded answers to our research questions we performed Chi-squaredtests [1] (similarly to the method presented by Ying and Robillard [22]) on thecontingency tables.
This test calculates the expected values based on the sum of rows and columns,i.e. what were the values if there were no connection between version controloperations and maintainability. Then it determines if the differences between theactual and the expected values are significant or not. The null-hypothesis is thatthese values are the same, and the reason of the differences are random. The final
594 Csaba Faragó et al.
result of this test is practically the p-value, indicating the chance of the result beingat least as extreme as the observed, provided that the null-hypothesis is true.
The test was performed using the chisq.test() R function [17]. This functioncalculates the standard residuals (stdres) as well for each cell, i.e. what would thevalue be if the data were of standard normal distribution. E.g. if this value was-2.0, then it would mean that the number of the observed elements was less thanthe expected (see the negative sign), and the difference was as much likely to berandom as a standard normally distributed variable is at least as extreme as 2.0(i.e. less than -2.0 or greater than 2.0).
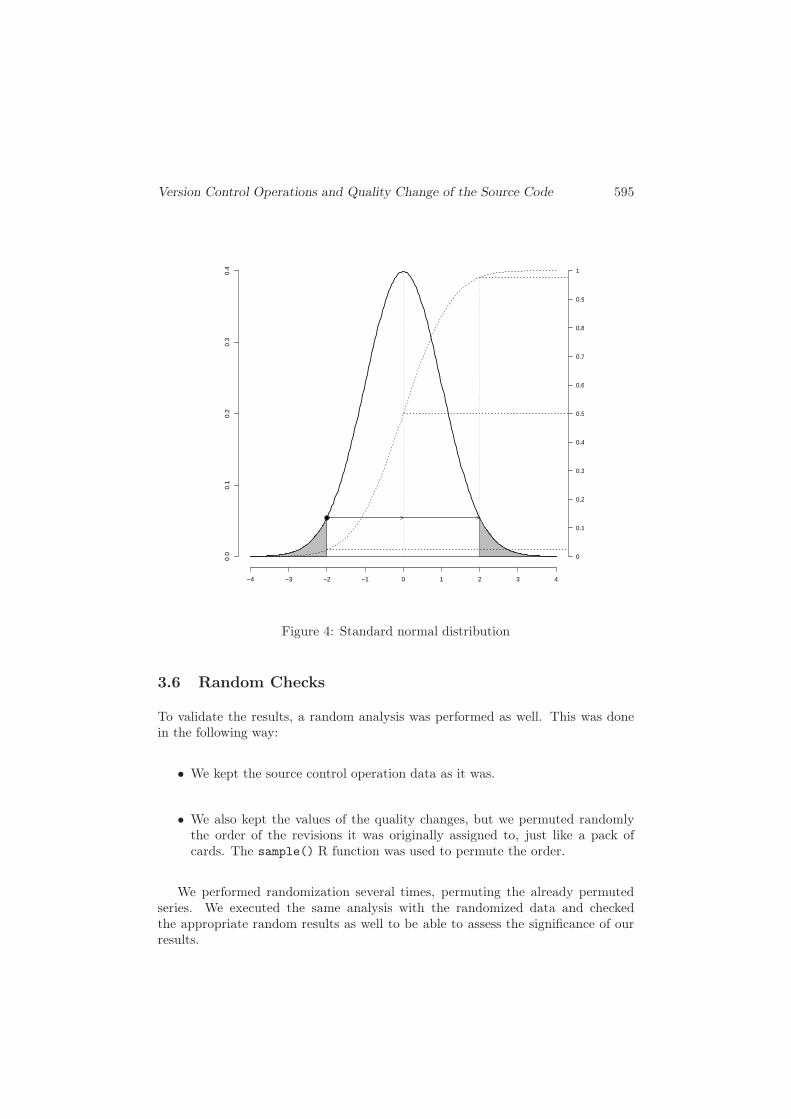
Based on these standard residuals the p-value is calculated as follows. The Rfunction pnorm() calculates the distribution of the given values, i.e. the proportionof elements less than or equal to the provided one. E.g., this value is 0.5 for 0.0,0.023 for -2.0, 0.977 for 2.0 etc. Based on the definition of the p-value, the resultfor value 0.0 would be 1.0, i.e. there is no deviation from the expected value at all.To go on with the running example, for -2.0 we need to calculate the proportionleft to -2.0 and right to 2.0, and sum it. As mentioned, the first value is 0.023,while the second one is also 1.0-0.977=0.023. Therefore the p-value is 0.046.
This process is illustrated on Figure 4. The size of both gray areas is 0.023.The lower dashed line is at 0.023, while the upper one is at 0.977.
To summarize, we have the following formula for calculation:
2 · pnorm(−abs(x))
where x is the value of standard normal distribution. The cells containing smallp-values can be considered as significant results.
In order to provide a quick and easy overview of the results, one last stepwas performed: the number of zeros between the decimal point and the first non-zero digit of the p-value were calculated, with the appropriate sign, denoting thedirection of the deviation from the expected value (negative if it is less than theexpected, positive if it is greater). More formally, if the canonical form of thep-value is (a · 10b), the transformed value is the absolute value of the exponentminus one (i.e. |b| − 1), with the sign of the standard residual. E.g., in the aboveexample the p-value in canonical form is 4.6 ·10−2, and the sign of −2.0 is negative,therefore the transformed value is −1. 0 means that the random probability is atleast 10%, 1 and -1 means that it is between 1% and 10% and so on. Formally, thistransformation was calculated by the following function:
f = ⌊log1
p⌋ · sign(stdres)
This test also gives a common p-value, i.e. not only cell based p-values. Havinga low enough such p-value (p < 0.01) would answer positively the base question ifthere is a connection between version control operations and maintainability.
For answering the research questions formally, we take the last, transformedtable. In case of the cell-based approach we consider those values significant, wherethe absolute values are at least 2 (p < 0.01) for all of the checked software systems.
Version Control Operations and Quality Change of the Source Code 595
−4 −3 −2 −1 0 1 2 3 4
0.0
0.1
0.2
0.3
0.4
0
0.1
0.2
0.3
0.4
0.5
0.6
0.7
0.8
0.9
1
Figure 4: Standard normal distribution
3.6 Random Checks
To validate the results, a random analysis was performed as well. This was donein the following way:
• We kept the source control operation data as it was.
• We also kept the values of the quality changes, but we permuted randomlythe order of the revisions it was originally assigned to, just like a pack ofcards. The sample() R function was used to permute the order.
We performed randomization several times, permuting the already permutedseries. We executed the same analysis with the randomized data and checkedthe appropriate random results as well to be able to assess the significance of ourresults.
596 Csaba Faragó et al.
4 Results
4.1 Examined Software Systems
For the data analysis we used one industrial and three open-source software systems.For the industrial one we had all the information from the very beginning. Formost of the open-source projects this is not the case; generally the initial sourcewas merged from another version control system.
In order to gain as adequate results as possible, we considered only those projectsfor which we had at least 1,000 commits affecting at least one Java file. Further-more, the too small code increase could also have significant bias, therefore weconsidered only those systems where the ratio of the maximal logical lines of code(typically the size of the system after the last available commit) and the minimalone (which was typically the size of the initial commit) was at least 3. We endedup with three such open-source systems.
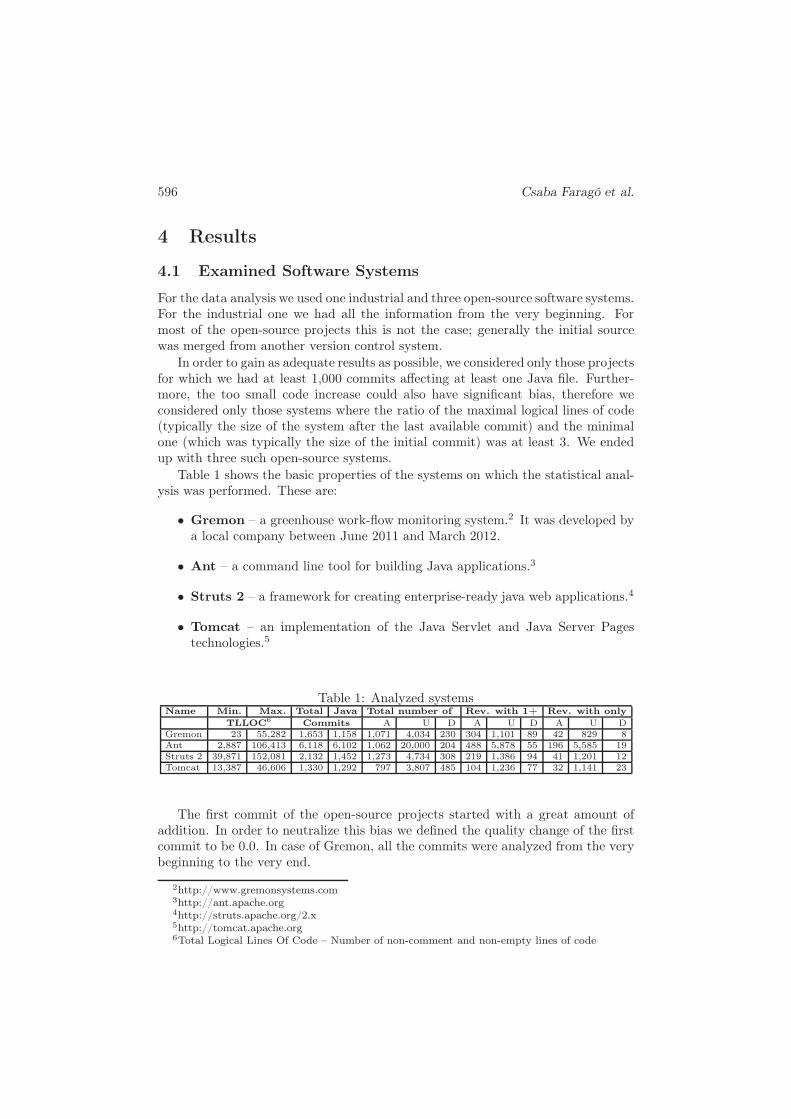
Table 1 shows the basic properties of the systems on which the statistical anal-ysis was performed. These are:
• Gremon – a greenhouse work-flow monitoring system.2 It was developed bya local company between June 2011 and March 2012.
• Ant – a command line tool for building Java applications.3
• Struts 2 – a framework for creating enterprise-ready java web applications.4
• Tomcat – an implementation of the Java Servlet and Java Server Pagestechnologies.5
Table 1: Analyzed systemsName Min. Max. Total Java Total number of Rev. with 1+ Rev. with only
TLLOC6 Commits A U D A U D A U D
Gremon 23 55,282 1,653 1,158 1,071 4,034 230 304 1,101 89 42 829 8
Ant 2,887 106,413 6,118 6,102 1,062 20,000 204 488 5,878 55 196 5,585 19
Struts 2 39,871 152,081 2,132 1,452 1,273 4,734 308 219 1,386 94 41 1,201 12
Tomcat 13,387 46,606 1,330 1,292 797 3,807 485 104 1,236 77 32 1,141 23
The first commit of the open-source projects started with a great amount ofaddition. In order to neutralize this bias we defined the quality change of the firstcommit to be 0.0. In case of Gremon, all the commits were analyzed from the verybeginning to the very end.
2http://www.gremonsystems.com3http://ant.apache.org4http://struts.apache.org/2.x5http://tomcat.apache.org6Total Logical Lines Of Code – Number of non-comment and non-empty lines of code

Version Control Operations and Quality Change of the Source Code 597
4.2 The Input Contingency Tables
The contingency tables created for the examined projects can be found in Ta-bles 2, 3, 4 and 5.
Table 2: Gremon
A D U+ U1∑
+ 118 43 122 54 337
0 13 3 126 223 365
- 109 43 198 106 456∑
240 89 446 383 1158
Table 3: Ant
A D U+ U1∑
+ 277 18 472 715 1482
0 13 12 625 2401 3051
- 172 25 467 905 1569∑
462 55 1564 4021 6102
Table 4: Struts 2
A D U+ U1∑
+ 123 43 183 149 498
0 17 25 166 503 711
- 82 46 233 179 540∑
222 114 582 831 1749
Table 5: Tomcat
A D U+ U1∑
+ 39 31 91 108 269
0 8 14 159 523 704
- 27 32 100 160 319∑
74 77 350 791 1292
There are a couple of notable facts about the tables. First of all, the distributionsof the positive, neutral and negative commits within each commit category aredifferent. Second, these distributions seem to be similar in every project. This ispromising, and worth the effort of the detailed analysis.
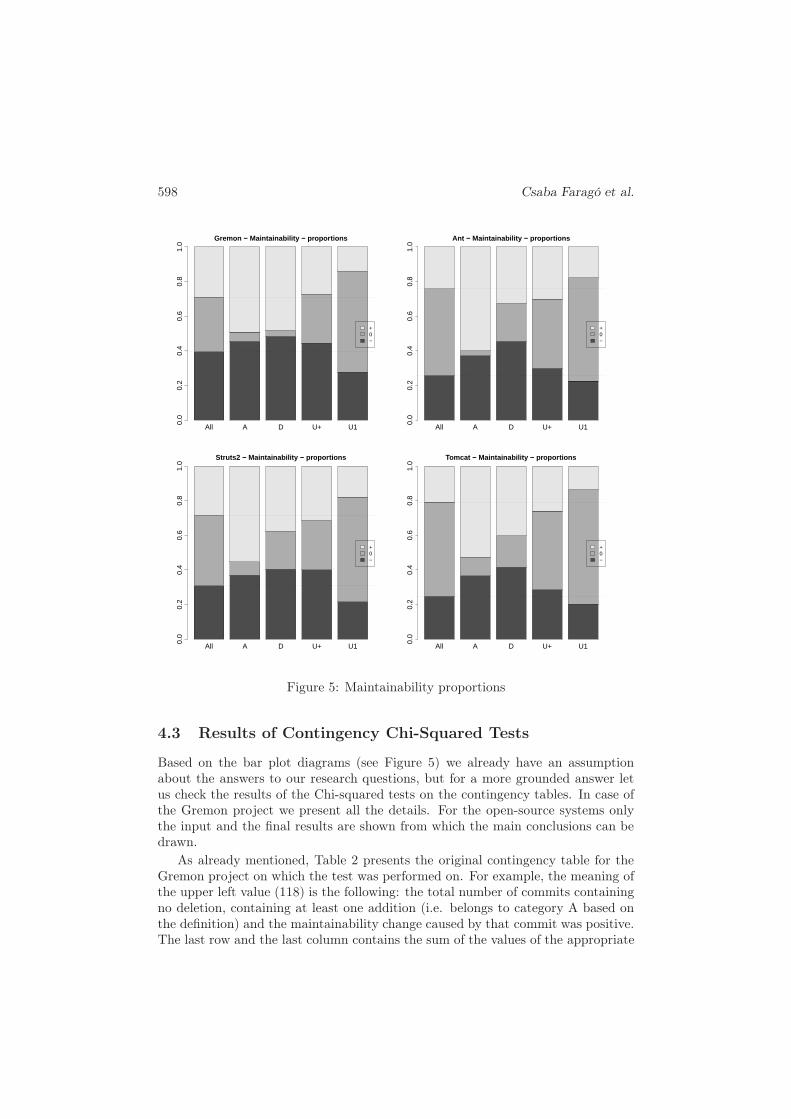
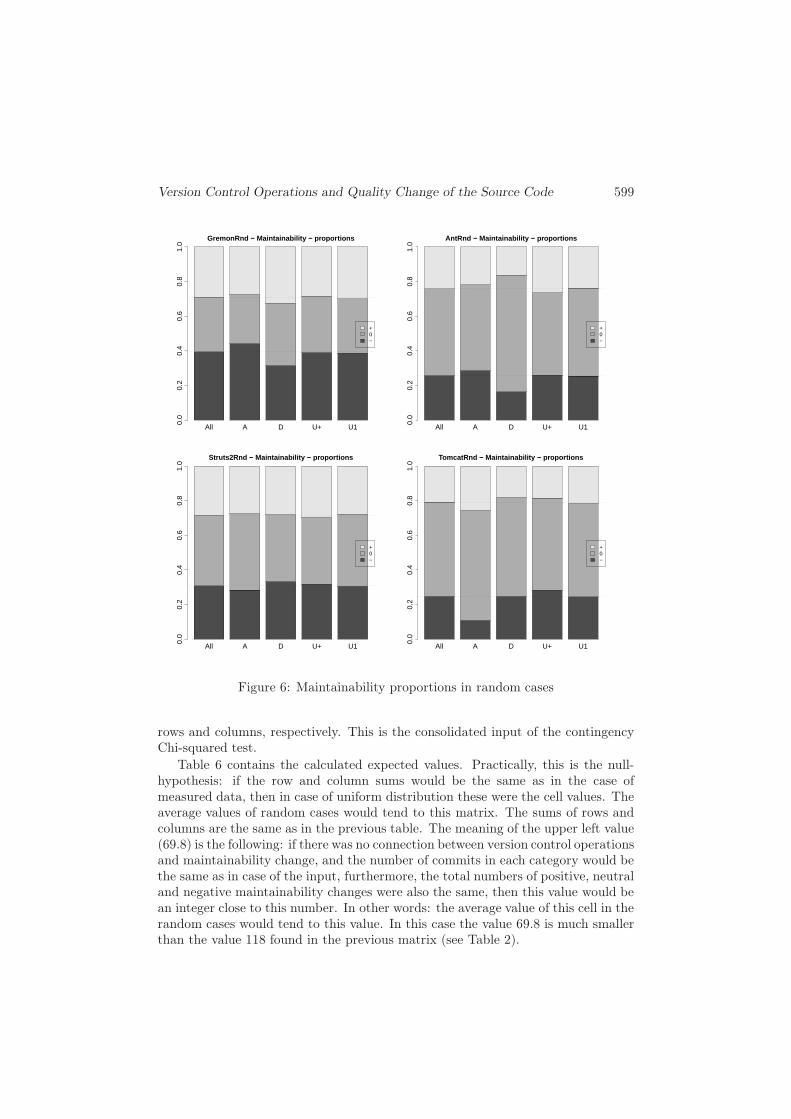
A graphical overview of the data is shown in Figure 5, where the proportions ofeach commit category are illustrated on bar plot diagrams. The bars with differ-ent colors indicate the proportions of the positive (light gray), neutral (gray) andnegative commits (dark gray) for each category, and the overall proportion is alsodisplayed. In order to see the differences between the random and the actual data,the results of random executions for each project is also included (see Figure 6).
The following can be seen on these diagrams:
• The middle bars (gray) are smaller than expected in case of A, D and U+,and higher in case of U1.
• The upper bar (light gray) is the tallest in case of A on every diagram.
• In case of U+ and U1 the lower bars (dark gray) are bigger than the upperones (light gray) in most of the cases.
The relevance of these results are very spectacular if we compare them to thebar plots of the randomized data (see Figure 6). In case of randomized data, thereare no obvious differences in any category bar, compared to the bar of all commits(or with the bar of any other category). Furthermore, even the viewable smalldifferences in the bars do not tend to be relevant: one difference on one diagrammostly differs on the other ones.
598 Csaba Faragó et al.
All A D U+ U1
+0−
Gremon − Maintainability − proportions
0.0
0.2
0.4
0.6
0.8
1.0
All A D U+ U1
+0−
Ant − Maintainability − proportions
0.0
0.2
0.4
0.6
0.8
1.0
All A D U+ U1
+0−
Struts2 − Maintainability − proportions
0.0
0.2
0.4
0.6
0.8
1.0
All A D U+ U1
+0−
Tomcat − Maintainability − proportions
0.0
0.2
0.4
0.6
0.8
1.0
Figure 5: Maintainability proportions
4.3 Results of Contingency Chi-Squared Tests
Based on the bar plot diagrams (see Figure 5) we already have an assumptionabout the answers to our research questions, but for a more grounded answer letus check the results of the Chi-squared tests on the contingency tables. In case ofthe Gremon project we present all the details. For the open-source systems onlythe input and the final results are shown from which the main conclusions can bedrawn.
As already mentioned, Table 2 presents the original contingency table for theGremon project on which the test was performed on. For example, the meaning ofthe upper left value (118) is the following: the total number of commits containingno deletion, containing at least one addition (i.e. belongs to category A based onthe definition) and the maintainability change caused by that commit was positive.The last row and the last column contains the sum of the values of the appropriate
Version Control Operations and Quality Change of the Source Code 599
All A D U+ U1
+0−
GremonRnd − Maintainability − proportions
0.0
0.2
0.4
0.6
0.8
1.0
All A D U+ U1
+0−
AntRnd − Maintainability − proportions
0.0
0.2
0.4
0.6
0.8
1.0
All A D U+ U1
+0−
Struts2Rnd − Maintainability − proportions
0.0
0.2
0.4
0.6
0.8
1.0
All A D U+ U1
+0−
TomcatRnd − Maintainability − proportions
0.0
0.2
0.4
0.6
0.8
1.0
Figure 6: Maintainability proportions in random cases
rows and columns, respectively. This is the consolidated input of the contingencyChi-squared test.
Table 6 contains the calculated expected values. Practically, this is the null-hypothesis: if the row and column sums would be the same as in the case ofmeasured data, then in case of uniform distribution these were the cell values. Theaverage values of random cases would tend to this matrix. The sums of rows andcolumns are the same as in the previous table. The meaning of the upper left value(69.8) is the following: if there was no connection between version control operationsand maintainability change, and the number of commits in each category would bethe same as in case of the input, furthermore, the total numbers of positive, neutraland negative maintainability changes were also the same, then this value would bean integer close to this number. In other words: the average value of this cell in therandom cases would tend to this value. In this case the value 69.8 is much smallerthan the value 118 found in the previous matrix (see Table 2).

600 Csaba Faragó et al.
Table 7 shows the standard residuals. This table illustrates if the previousdifference is significant or not using the well-known standard normal distribution.The difference between the expected and the measured value is exactly as extremeas the difference between 0 and the values found in this table assuming a standardnormal distribution. E.g., in the upper left case this is the chance of resultingin 7.69. Based on this, we already have a feeling that this is a very extreme value;the probability of resulting such value only by chance is very low.
Table 6: Gremon: expected values
A D U+ U1∑
+ 69.8 25.9 129.8 111.5 337
0 75.6 28.1 140.6 120.7 365
- 94.5 35.0 175.6 150.8 456∑
240 89 446 383 1158
Table 7: Gremon: standard residuals
A D U+ U1
+ 7.69 4.15 -1.04 -7.90
0 -9.78 -5.95 -1.89 13.75
- -2.15 1.80 2.77 -5.73
In Table 8 we present the p-values related to the standard normal distribution.These values answer the question of how low the previously mentioned chances are.Consider the upper left value again. The difference between the actual value (118)and the expected value (69.8) is 48.2. The other value with the same difference fromthe expected one is 21.6 (=69.8-48.2). The definition of the p-value is the following:the chance of the value being at least as extreme as measured, provided that thenull-hypothesis is true. Therefore the meaning of the value in the upper left corner(1.52 · 10−14) is the following: the chance that the measured value is at least 118or at most 21.6. Taking into consideration that its reciprocal is about 6.58 · 1013
it means that in random case this would statistically happen once in about every66 trillion cases (and about once in every 132 trillion cases if the direction alsomatters).
Table 8: Gremon: p-valuesA D U+ U1
+ 1.52 · 10−14 3.28 · 10−5 3.00 · 10−1 2.76 · 10−15
0 1.43 · 10−22 2.70 · 10−9 5.81 · 10−2 5.06 · 10−43
- 3.15 · 10−2 7.25 · 10−2 5.69 · 10−3 1.01 · 10−8
Table 9 contains the exponents calculated as described in Section 3.5. Theo-retically, the previous tables contain everything we need: the standard residualsprovide the directions and the p-values table provide the absolute values; but thetables containing the exponents are easier to read and comprehend.
Table 9 is composed of the exponents and the directions. Consider the upperleft value (13). The absolute value comes from the exponent (14) minus one (inorder to convert the absolutely not significant results (having p-value > 0.1) to 0instead of 1). The sign means the direction: the positive in this case means thatthe actual value is higher than the expected one. Also note that although this valueis high, it is still far from the highest.
Version Control Operations and Quality Change of the Source Code 601
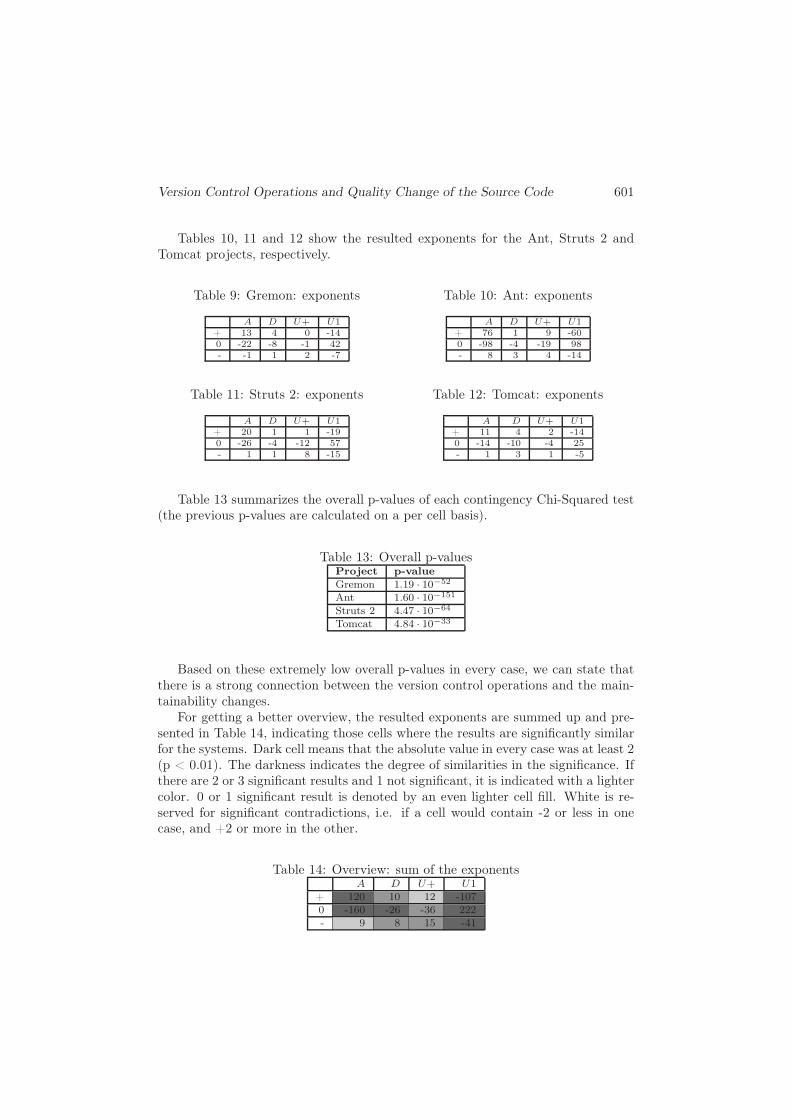
Tables 10, 11 and 12 show the resulted exponents for the Ant, Struts 2 andTomcat projects, respectively.
Table 9: Gremon: exponents
A D U+ U1
+ 13 4 0 -14
0 -22 -8 -1 42
- -1 1 2 -7
Table 10: Ant: exponents
A D U+ U1
+ 76 1 9 -60
0 -98 -4 -19 98
- 8 3 4 -14
Table 11: Struts 2: exponents
A D U+ U1
+ 20 1 1 -19
0 -26 -4 -12 57
- 1 1 8 -15
Table 12: Tomcat: exponents
A D U+ U1
+ 11 4 2 -14
0 -14 -10 -4 25
- 1 3 1 -5
Table 13 summarizes the overall p-values of each contingency Chi-Squared test(the previous p-values are calculated on a per cell basis).
Table 13: Overall p-valuesProject p-value
Gremon 1.19 · 10−52
Ant 1.60 · 10−151
Struts 2 4.47 · 10−64
Tomcat 4.84 · 10−33
Based on these extremely low overall p-values in every case, we can state thatthere is a strong connection between the version control operations and the main-tainability changes.
For getting a better overview, the resulted exponents are summed up and pre-sented in Table 14, indicating those cells where the results are significantly similarfor the systems. Dark cell means that the absolute value in every case was at least 2(p < 0.01). The darkness indicates the degree of similarities in the significance. Ifthere are 2 or 3 significant results and 1 not significant, it is indicated with a lightercolor. 0 or 1 significant result is denoted by an even lighter cell fill. White is re-served for significant contradictions, i.e. if a cell would contain -2 or less in onecase, and +2 or more in the other.
Table 14: Overview: sum of the exponentsA D U+ U1
+ 120 10 12 -1070 -160 -26 -36 222- 9 8 15 -41

602 Csaba Faragó et al.
Half of the cells are dark; these indicate those results which are significant forevery checked project. Please note that the table does not contain any white cells.
4.4 Random Check Result
We were also interested in the random case: does it also result in the same highnumbers as presented previously or not. Based on the definition of the exponent ta-ble, theoretically, in random case the proportion of 0 should be 90%, the proportionof absolute values 1 should be 9% (half of them negative and half of them posi-tive), the proportion of absolute values 2 should be 0.9%, and so on. We receivedapproximately the same kind of distributions in practice. Table 15 illustrates theresults of one concrete execution with an overall p-value of 0.53. There are hardlyany non-null values in these executions.
Table 15: Random: exponentsA D U+ U1
+ 0 0 0 00 0 0 0 0- 1 0 0 0
4.5 Answers to the Research Questions
The answers to the research questions are primarily based on Table 14.
RQ1: Do commits containing file additions to the system have a significantpositive impact on its maintainability?
The values in the first column are related to these commits. Value 120 andthe dark color cell in the upper left cell indicates that the positive impact on themaintainability is very high for those commits which do not contain deletion butcontain at least one addition. This supports our assumption that adding new sourcefiles to the system has a significant positive impact on its maintainability.
On the other hand, the lower left cell of the table is also positive (+9), but thecolor is lighter. In 3 out of the 4 cases it contained a value close to 0, and one highervalue. If we check the input, we see that the absolute number of commits in thepositive cell is also higher than those in the negative cell in every case. Thereforewe can also say that the overall effect of the add operation is positive.
RQ2: Is it true that the commits containing source file updates only tend tosignificantly decrease the maintainability?
The third and fourth columns are related to commits containing updates only.All the colors of the cells found in the fourth column (commits containing exactlyone update) are dark and the values are negative both in the + and - cells. Butthe value found in the + row is much lower than the value found in the - row,and this is true for every input. We should also take into account that the main-tainability tends to decrease, therefore if these values were equal, that would also

Version Control Operations and Quality Change of the Source Code 603
mean maintainability decrease as an overall result. Thus in case of commits con-taining one update our assumption that the source file updates tend to decrease themaintainability is supported with high significance.
The cell colors in the third column (commits containing exclusively at least2 updates) are lighter. Both of the values found in the + and - rows are posi-tive. However, the value found in the - cell is higher than the value in the + cell.Therefore in case of more updates our assumption is also supported, but with lowersignificance.
RQ3: Do commits containing file deletion improve the maintainability of thesystem?
The second column is related to this research question. The values found inthese cells are small in absolute values compared to those found in other columnsand their colors are also not the darkest ones. The number in the + cell (10) ishigher than the number in the - cell (8). Based on this we cannot formulate ageneral statement. Seemingly we could say that deletions have no positive effecton the maintainability as 10 > 8. But that could be a false conclusion, becausein general the number of commits causing negative maintainability change is ingeneral higher than those causing positive change. Therefore 10 in the + cell doesnot necessarily mean higher number of absolute values than 8 in the - cell. And ifwe check the inputs, we see that just the opposite is true, i.e. the absolute numberin the - cells in columns D are less than or equal with the values in the + cells. Ifwe consider the input as well we find that there are more such commits of categoryD which resulted in maintainability decrease than those of increase. Therefore thethird assumption that commits containing deletion improve the maintainability ofthe system is not supported by the results.
4.6 Other Results
Considering Table 14 other results can also be read out, not covered by the originalresearch questions.
First of all, the highest absolute value is 222, in row 0, column U1. All the othervalues in row 0 are negative. This means that no traceable maintainability changesare primary related to small updates. This is a trivial statement, of course, and itrather validates the used quality model than a real usable result of this research.
The second highest value in absolute is -160, also in row 0, but column A.Therefore adding a new source code almost always has some traceable effect on themaintainability.
Considering the negative (-) row alone, it would lead the false result that everycommit category have negative effect on the maintainability, except the small up-dates. This is not true, because the value found in the positive (+) row should alsobe considered in case of every category. On the other hand, these values tell us thatwith the exception of small updates there are too many maintainability decreases.Eliminating some of these decreases would result in a well maintainable code, evenwithout an explicit code quality increase campaign.

604 Csaba Faragó et al.
5 Threats to Validity
In some cases we achieved very convincing results; however, there are some factsthat may threat the validity of some of them.
In case of the open-source projects, the first unknown number of commits aremissing (most probably they were migrated from another version control system).On the other hand, in the case of Gremon, all the commits were available from thevery beginning. This inconsistency may lead to false results in some cases; however,it would be interesting to investigate the differences between the commits in thebeginning and commits in a later phase of the development. For that, a muchgreater amount of data would be necessary.
There are a few diverging results: in most of these cases there are two or threesimilar results, but the other system(s) do(es) not support that. In general it doesnot contradict them either so it does not mean necessarily that the results areinvalid. This may be caused by several issues: the divergence may be caused by thedomain differences, technological differences, differences in development processes,the different phases examined, or simply that there are maybe exceptions underthe general rule, and some of the examined systems fall into these exceptions. Thisis by all means worth further investigations.
6 Conclusions and Future Work
In this work we studied the impact of version control commit operations on main-tainability change. We found that commits containing Update operation only havenegative impact on maintainability, while great maintainability improvements aremostly caused by those commits which contain Add operations as well. Commitscontaining operation Delete have a weak connection with maintainability, and wecould not formulate a general statement. Operation Rename was not investigatedon its own due to the very small number of its occurrences and due to the fact thatthis on its own does not have any measurable effect on the maintainability.
Another conclusion is that commits consisting of a single Update tend to haveno traceable impact on maintainability. On the other hand, other types of commitstend to have significant impact on maintainability.
Based on these results it might make sense for developers to improve the waythey add new features and use the opportunity to also perform refactorings. Thenew features should be implemented in new files, containing sound code (adding newfiles typically improve maintainability), and the existing code should be refactoredto accept the new code in the proper way (refactorings typically introduce filedeletions and additions). Modifications are of course more expensive in this way,but the extra investment returns in mid-term.
During the analysis we used only a subset of the available data. Extendingthe analysis with other types of commit-related data, like the file name, the dateand time of the commit, the developer, or the comment belongs to our short-termplans. As already mentioned among the threats to validity, we did not take into
Version Control Operations and Quality Change of the Source Code 605
consideration the domain and other attributes of the software. That could be animportant extension of this work for a mid-term future research. In longer term,we plan to include non-version control related data into consideration as well. Forinstance, useful information may be extracted from the issue tracking systems.Finally, we have a great expectation from the results of those tests where thedeveloper interactions collected by the IDE are also considered.
Acknowledgments
This research was supported by the Hungarian national grant GOP-1.1.1-11-2011-0006, and the European Union and the State of Hungary, co-financed by the Euro-pean Social Fund in the framework of TÁMOP 4.2.4. A/2-11-1-2012-0001 „NationalExcellence Program”.
References
[1] Agresti, Alan. An Introduction to Categorical Data Analysis. Wiley-Interscience, 2 edition, March 2007.
[2] Bakota, T., Hegedűs, P., Körtvélyesi, P., Ferenc, R., and Gyimóthy, T. AProbabilistic Software Quality Model. In Proceedings of the 27th IEEE Inter-national Conference on Software Maintenance (ICSM 2011), pages 368–377,Williamsburg, VA, USA, 2011. IEEE Computer Society.
[3] Bakota, Tibor, Hegedűs, Péter, Ladányi, Gergely, Körtvélyesi, Péter, Ferenc,Rudolf, and Gyimóthy, Tibor. A Cost Model Based on Software Maintain-ability. In Proceedings of the 28th IEEE International Conference on SoftwareMaintenance (ICSM 2012), pages 316–325, Riva del Garda, Italy, 2012. IEEEComputer Society.
[4] Bernstein, A and Bachmann, A. When Process Data Quality Affects the Num-ber of Bugs: Correlations in Software Engineering Datasets. In Proceedings ofthe 7th IEEE Working Conference on Mining Software Repositories, MSR ’10,pages 62–71, 2010.
[5] Giger, Emanuel, Pinzger, Martin, and Gall, Harald C. Can We Predict Typesof Code Changes? An Empirical Analysis. In Proceedings of the 9th IEEEWorking Conference on Mining Software Repositories (MSR), pages 217–226.IEEE, 2012.
[6] Hegedűs, Péter. A Probabilistic Quality Model for C# – an Industrial CaseStudy. Acta Cybernetica, 21(1):135–147, 2013.
[7] Hindle, Abram, German, Daniel M., and Holt, Ric. What Do Large CommitsTell Us?: a Taxonomical Study of Large Commits. In Proceedings of the 2008

606 Csaba Faragó et al.
International Working Conference on Mining Software Repositories, MSR ’08,pages 99–108, New York, NY, USA, 2008. ACM.
[8] ISO/IEC. ISO/IEC 9126. Software Engineering – Product quality 6.5.ISO/IEC, 2001.
[9] Khoshgoftaar, Taghi M., Allen, Edward B., Halstead, Robert, Trio, Gary P.,and Flass, Ronald M. Using Process History to Predict Software Quality.Computer, 31(4):66–72, April 1998.
[10] Koch, S. and Neumann, C. Exploring the Effects of Process Characteristics onProduct Quality in Open Source Software Development. Journal of DatabaseManagement, 19(2):31, 2008.
[11] Moser, Raimund, Pedrycz, Witold, Sillitti, Alberto, and Succi, Giancarlo. AModel to Identify Refactoring Effort during Maintenance by Mining SourceCode Repositories. In Proceedings of the 9th International Conference onProduct-Focused Software Process Improvement, PROFES ’08, pages 360–370,Berlin, Heidelberg, 2008. Springer-Verlag.
[12] Moser, Raimund, Pedrycz, Witold, and Succi, Giancarlo. A ComparativeAnalysis of the Efficiency of Change Metrics and Static Code Attributes forDefect Prediction. In Proceedings of the 30th International Conference onSoftware Engineering (ICSE ’08), pages 181–190, New York, NY, USA, 2008.ACM.
[13] Nagappan, Nachiappan, Ball, Thomas, and Murphy, Brendan. Using HistoricalIn-Process and Product Metrics for Early Estimation of Software Failures.In Proceedings of the 17th International Symposium on Software ReliabilityEngineering (ISSRE ’06), pages 62–74, Washington, DC, USA, 2006. IEEEComputer Society.
[14] Nagappan, Nachiappan, Ball, Thomas, and Zeller, Andreas. Mining Metricsto Predict Component Failures. In Proceedings of the 28th International Con-ference on Software Engineering (ICSE ’06), pages 452–461, New York, NY,USA, 2006. ACM.
[15] Parnas, David Lorge. Software Aging. In Proceedings of the 16th InternationalConference on Software Engineering, ICSE ’94, pages 279–287, Los Alamitos,CA, USA, 1994. IEEE Computer Society Press.
[16] Peters, Ralph and Zaidman, Andy. Evaluating the Lifespan of Code Smellsusing Software Repository Mining. In Proceedings of the 2012 16th EuropeanConference on Software Maintenance and Reengineering, CSMR ’12, pages411–416, Washington, DC, USA, 2012. IEEE Computer Society.
[17] R Core Team. R: A Language and Environment for Statistical Computing. RFoundation for Statistical Computing, Vienna, Austria, 2013.
Version Control Operations and Quality Change of the Source Code 607
[18] Ratzinger, Jacek, Sigmund, Thomas, Vorburger, Peter, and Gall, Harald. Min-ing Software Evolution to Predict Refactoring. In Proceedings of the First In-ternational Symposium on Empirical Software Engineering and Measurement,ESEM ’07, pages 354–363, Washington, DC, USA, 2007. IEEE Computer So-ciety.
[19] Schofield, Curtis, Tansey, Brendan, Xing, Zhenchang, and Stroulia, Eleni. Dig-ging the Development Dust for Refactorings. In Proceedings of the 14th IEEEInternational Conference on Program Comprehension, ICPC ’06, pages 23–34,Washington, DC, USA, 2006. IEEE Computer Society.
[20] van Rysselberghe, F. and Demeyer, S. Mining Version Control Systems forFACs (frequently Applied changes). In Proceedings of the International Work-shop on Mining Repositories, Edinburgh, Scotland, UK, 2004.
[21] Ying, Annie T. T., Murphy, Gail C., Ng, Raymond, and Chu-Carroll, Mark C.Predicting Source Code Changes by Mining Change History. IEEE Transac-tions on Software Engineering, 30(9):574–586, September 2004.
[22] Ying, Annie T. T. and Robillard, Martin P. The Influence of the Task onProgrammer Behaviour. In Proceedings of the 2011 IEEE 19th InternationalConference on Program Comprehension, ICPC ’11, pages 31–40, Washington,DC, USA, 2011. IEEE Computer Society.
[23] Zimmermann, Thomas, Weissgerber, Peter, Diehl, Stephan, and Zeller, An-dreas. Mining Version Histories to Guide Software Changes. IEEE Transac-tions on Software Engineering, 31(6):429–445, June 2005.
Received 20th November 2013