connie l. valenzuela - granicus
TRANSCRIPT


Connie L. ValenzuelaAgricultural CommissionerSealer of Weights and Measures
Carlos OrtizAssistant Agricultural CommissionerAsst. Sealer of Weights and Measures
AGRICULTURAL COMMISSIONERSEALER OF WEIGHTS AND MEASURES
852 Broadway
El Centro, CA 92243
(442) 265-1500
Fax: (760) 353-9420
E-mail: [email protected]
September 27, 2016
Honorable Board of SupervisorsCounty of Imperial940 West Main StreetEl Centro, CA 92243
Re: 2015 Imperial County Agricultural Crop and Livestock Report
Dear Board Members:
In accordance with the provisions of Section 2279 of the California Food and Agricultural Code, I ampleased to submit the 2015 Agricultural Crop and Livestock Report for Imperial County. This report is asummary of acreage, yield, and gross value of agricultural production in Imperial County for calendaryear 2015.
Also included is a two-page report on sustainable agriculture pursuant to Section 2272 of the CaliforniaFood and Ag Code (beginning with the page titled “Mission Statement”).
Requested Action
Please accept for filing the 2015 Imperial County Agricultural Crop and Livestock Report.
Respectfully submitted,
Connie L. ValenzuelaAgricultural CommissionerSealer of Weights and Measures

2015
Agricultural Crop & Livestock Report
IMPERIAL COUNTY

Connie L. ValenzuelaAgricultural CommissionerSealer of Weights and Measures
Carlos OrtizAssistant Agricultural CommissionerAsst. Sealer of Weights and Measures
AGRICULTURAL COMMISSIONERSEALER OF WEIGHTS AND MEASURES
852 Broadway
El Centro, CA 92243
(442) 265-1500
Fax: (760) 353-9420
E-mail: [email protected]
September 27, 2016
Karen Ross, SecretaryCalifornia Department of Food and Agriculture
and
The Honorable Board of Supervisors, County of ImperialSupervisor Jesus “Jack” Terrazas, Chairman, District 2Supervisor John Renison, District 1Supervisor Michael W. Kelley, District 3Supervisor Ryan E. Kelley, District 4Supervisor Raymond Castillo, District 5
I am pleased to present the 2015 Imperial County Agricultural Crop and Livestock Report in accordance with therequirements of Section 2279 of the California Food and Agricultural Code. This report summarizes the estimated
acreage, yield, and gross value of Imperial County’s agricultural production for the 2015 calendar year. Also included
is a report on sustainable agriculture pursuant to Section 2272 of the California Food and Agricultural Code.
The values presented in this report represent the gross value for products and do not reflect the cost of production,
marketing, storage, or transportation. No attempt is made to reflect the net income, profit, or loss to producers.
Gross production for 2015 was valued at $1,925,134,000. This is an increase of $66,345,000 (3.57%) compared tothe 2014 gross value of $1,858,789,000. Winter vegetables were harvested earlier this year due to early warm
weather which left gaps in the supply chain and drove prices up later in the season. Livestock production increased
due to increases in the number of cattle and sheep and higher market prices.
Cattle again ranked as our #1 commodity with a gross value of $444,887,000, a substantial increase of 28% from
2014. This was due to a 7% increase in head count and a 24% increase in market price. Leaf lettuce moved back
into the Top Ten Commodities from #20 in 2014 to #5 in 2015 due to more planted acres, higher yields, and higher
prices. Sudan grass hay dropped in the commodity ranking from #7 in 2014 to #17 in 2015.
In 2015, there was an increase of 25,347 in total harvested acres, up 4.98% from 2014. This increase occurred in
the Field Crop, Vegetable Crop, and Seed Crop categories. Wheat showed the largest increase in harvested acres, up
70% with an increase of 26,670 acres.
Thank you to all of the growers, processors, industry groups, and agencies who provided the information and
statistics for this report; your help in this effort is truly appreciated. Thank you also to this year’s crop report team,
Phyllis Cason (retired), Victoria Huber, and Sandra Mendivil. In addition, I would like to express my appreciation toall of the members of my staff for their continued hard work and dedication.
Sincerely,
Connie Valenzuela
Agricultural CommissionerSealer of Weights and Measures

Imperial County
Change in Change in
Harvested Gross
Category 2014 2015 Acres 2014 2015 Value
Livestock $410,512,000 $502,065,000 22.30%
Field Crops 322,589 349,687 8.40% $530,849,000 $422,319,000 -20.44%
Vegetable & Melon Crops 122,279 121,284 -0.81% $723,260,000 $805,021,000 11.30%
Fruit & Nut Crops 9,685 8,778 -9.36% $95,909,000 $83,277,000 -13.17%
Seed & Nursery Crops 54,888 55,039 0.28% $93,818,000 $107,673,000 14.77%
Apiary Products $4,441,000 $4,779,000 7.61%
Total 509,441 534,788 4.98% $1,858,789,000 $1,925,134,000 3.57%
Total harvested acres includes multiple cropping on individual fields throughout the year.
Gross ValueHarvested Acres
2015 Production Summary
Rank Gross Value Rank
2015 2015 2014
1 Cattle $444,887,000 1
2 Alfalfa $168,561,000 2
3 Onions $145,022,000 3
4 Head Lettuce $107,788,000 4
5 Leaf Lettuce $99,738,000 20
6 Broccoli $90,265,000 5
7 Alfalfa Seed $66,592,000 10*
8 Bermuda Grass Hay $64,973,000 6
9 Wheat $60,883,000 11*
10 Carrots $56,962,000 9
*Corrected rank from 2014 www.co.imperial.ca.us/ag
Top Ten Commodities

Imperial County
ValueItem Year Head Unit Gain Total Gain Unit Per Unit Gross Value
Cattle (Feedlot) 2015 352,870 9.51 3,356,993 Cwt $132.53 $444,887,000
2014 329,681 9.87 3,253,629 Cwt $106.65 $347,009,000
Sheep (Feeders) 2015 84,000 0.47 39,750 Cwt $169.46 $6,736,000
2014 77,500 0.45 35,075 Cwt $160.71 $5,637,000
Sheep (Wool) 2015 84,000 3.50 294,000 Lb $1.55 $456,000
2014 77,500 3.50 271,250 Lb $1.03 $279,000
Aquatic Products 2015 $10,550,000
(Fish & Algae) 2014 $13,295,000
Misc. Livestock 2015 $39,436,000
2014 $44,292,000
Total 2015 Value $502,065,000
Total 2014 Value $410,512,000
Numbers may not compute due to rounding
Misc. Livestock may include: Calves, Cattle, Cavies, Dairy Animals, Lambs, Milk, Goats, Poultry, Rabbits, Swine, Manure/Compost
Cwt = 100 Pounds
LivestockProduction
Commodities Exported2/
Japan 36.4% United Arab Emirates 2.5% Hay & Straw 44.5%Mexico 36.1% Taiwan 1.6% Vegetables 29.8%Republic of Korea 8.8% Canada 1.1% Seed 13.8%China 6.5% Other Countries 7.0% Other 11.9%
Hawaii 49.1% Vegetables 85.9%Florida 43.1% Nursery 12.2%California 4.9% Other 1.4%Texas 1.5% Seed 0.5%Other States 0.9%Puerto Rico 0.5%
1/ Based on USDA Phytosanitary Certification Program 2/Not all commodities originated in Imperial County
States or Territories
Countries
Commodities2/
Export Commodities1/
2015 Federal Export Certificates
16,175 certificates issued to 86 countries92.9% of the certificates issued to 7 countries191seed samples drawn for export certification
1,174 state certificates issued to 8 states and 1 territory92.2% of the certificates issued to 2 states
2015 State Certificates
www.co.imperial.ca.us/ag

Harvested Yield ValueCrop Year Acres Per Acre Total Units Unit Per Unit Gross Value
Alfalfa Hay 2015 140,663 7.54 1,061,183.31 Ton $158.84 $168,561,000
2014 122,138 8.15 995,453.17 Ton $220.77 $219,766,000Bermuda Grass Hay 2015 51,928 7.61 394,983.47 Ton $164.50 $64,973,000
2014 47,641 8.45 402,749.68 Ton $192.30 $77,448,000Cotton (Lint)
1/2015 1,875 3.68 6,905.59 Bale $343.63 $2,373,000
2014 2,455 4.66 11,449.21 Bale $374.17 $4,284,000Cotton (Seed) 2015 2,453.50 Ton $213.98 $525,000
2014 4,034.00 Ton $367.63 $1,483,000Klein Grass Hay 2015 16,002 8.28 132,422.35 Ton $160.00 $21,188,000
2014 16,771 10.31 172,950.94 Ton $168.13 $29,078,000Pastured Crops2/ 2015 49,227 Acre $37.38 $1,840,000
2014 46,777 Acre $36.28 $1,697,000Straw (Baled) 2015 129,861.26 Ton $38.62 $5,015,000
2014 77,351.33 Ton $86.79 $6,713,000Sudan Grass Hay 2015 45,151 4.66 210,597.16 Ton $143.55 $30,231,000
2014 59,701 5.71 341,148.57 Ton $191.25 $65,245,000Sugar Beets 2015 22,485 43.62 980,795.70 Ton $45.64 $44,764,000
2014 24,376 43.40 1,057,918.40 Ton $42.97 $45,459,000Wheat 2015 64,447 3.23 208,116.07 Ton $292.54 $60,883,000
2014 37,777 3.49 131,906.09 Ton $362.00 $47,750,000
Misc. Field Crops 2015 7,136 $21,966,000
2014 11,730 $31,926,000
Total 2015 Acres 349,687 Value $422,319,000
Total 2014 Acres 322,589 Value $530,849,000
Numbers may not compute due to rounding
Misc. Field Crops may include: Barley, Corn Silage, Field Corn, Mixed Grasses, Oat Hay, Rye Grass Hay,
Sesbania, Sorghum Silage, Sugar Beet Pulp, Sugar Beet Molasses, Sugarcane1/Cotton Bales = 500 Pounds
2/ Pastured Crops may include: Alfalfa, Bermuda Grass, Permanent Pasture, Rye GrassPastured Crops: pastured once and the acreage is not included in the total
Yield ValueItem Year Hives Per Hive Total Units Unit Per Unit Gross Value
Honey 2015 42,489 8.15 346,254.90 Lbs $2.09 $723,000
2014 35,199 12.59 443,277.00 Lbs $2.91 $1,288,000
Wax 2015 22,050 0.52 11,500.00 Lbs $2.17 $25,000
2014 16,850 0.65 10,900.00 Lbs $2.20 $24,000
Pollination 2015 71,113 Colony $56.68 $4,031,000
2014 57,918 Colony $54.02 $3,129,000
Total 2015 Value $4,779,000
Total 2014 Value $4,441,000Numbers may not compute due to rounding
www.co.imperial.ca.us/ag
Apiary Products
Field CropsProduction
Imperial County
Production

Imperial County
Harvested Yield ValueCrop Year Acres Per Acre Total Units Unit Per Unit Gross Value
Broccoli (Market) 2015 14,738 538 7,925,923 26 Lb Ctn $11.39 $90,265,000
2014 15,026 531 7,978,252 26 Lb Ctn $11.25 $89,719,000
Cabbage (Market) 2015 1,218 768 935,295 45 Lb Ctn $12.87 $12,035,000
2014 2,390 628 1,501,119 45 Lb Ctn $15.00 $22,521,000
Carrots
Market 2015 4,920 948 4,665,136 50 Lb Bag $1.86 $8,696,000
2014 4,486 753 3,377,683 50 Lb Bag $4.97 $16,783,000
Processing & Other 2015 11,479 31.73 364,272 Ton $132.50 $48,266,000
2014 10,466 35.67 373,347 Ton $95.83 $35,776,000
Total Carrots 2015 16,399 $56,962,000
2014 14,952 $52,559,000
Cauliflower (Market) 2015 3,694 694 2,565,451 23 Lb Ctn $9.69 $24,859,000
2014 4,065 1,005 4,086,385 23 Lb Ctn $6.58 $26,871,000
Head Lettuce
Naked Pack 2015 2,401,096 50 Lb Ctn $7.66 $18,384,000
2014 2,251,972 50 Lb Ctn $5.50 $12,393,000
Wrap Pack 2015 7,203,288 40 Lb Ctn $8.33 $59,990,000
2014 6,755,917 40 Lb Ctn $8.75 $59,114,000
Bulk 2015 3,841,754 50 Lb Ctn $7.66 $29,414,000
2014 3,603,156 50 Lb Ctn $5.50 $19,829,000
Total Head Lettuce 2015 18,078 13,446,138 Ctn $8.02 $107,788,000
2014 21,157 12,611,045 Ctn $7.24 $91,336,000
Leaf Lettuce 2015 13,132 705 9,262,432 35 Lb Ctn $10.77 $99,738,000
2014 8,305 624 5,182,020 35 Lb Ctn $4.71 $24,407,000
Spring Mix 2015 2,830 18,052 51,088,835 Lb $0.51 $26,157,000
2014 3,232 6,500 21,006,783 Lb $0.61 $12,910,000
www.co.imperial.ca.us/ag
Spring Mix may include: Green, Red, and Baby Leaf Lettuces; Beet Tops, Mizuna, Mustard, Baby SpinachNumbers may not compute due to rounding
Production
Vegetable & Melon Crops

Imperial County
Harvested Yield ValueCrop Year Acres Per Acre Total Units Unit Per Unit Gross Value
OnionsMarket 2015 4,192 2,492 10,447,093 50 Lb Sack $11.35 $118,575,000
2014 4,719 1,721 8,120,539 50 Lb Sack $13.17 $106,920,000Processor 2015 8,439 19.66 165,932 Ton $159.38 $26,447,000
2014 6,134 29.54 181,198 Ton $122.00 $22,106,000Total Onions 2015 12,631 $145,022,000
2014 10,853 $129,026,000Potatoes 2015 2,009 548 1,100,262 Cwt $11.32 $12,460,000
2014 2,337 455 1,063,802 Cwt $10.96 $11,663,000Spinach 2015 6,171 11,413 70,427,155 Lb $0.45 $31,991,000
2014 6,634 10,490 69,588,751 Lb $0.82 $57,010,000Sweet Corn 2015 6,410 438 2,804,375 50 Lb Ctn $14.00 $39,261,000
2014 6,644 220 1,460,463 50 Lb Ctn $7.94 $11,603,000Romaine 2015 6,590 732 4,825,857 35 Lb Ctn $6.50 $31,372,000
2014 6,279 558 3,502,486 35 Lb Ctn $10.74 $37,628,000Misc. Vegetables 2015 10,098 $77,568,000
2014 11,784 $98,302,000Cantaloupes 2015 5,185 877 4,545,023 40 Lb Ctn $6.99 $31,747,000
2014 5,334 460 2,451,980 40 Lb Ctn $9.03 $22,139,000Honeydew & 2015 851 850 723,350 40 Lb Ctn $8.88 $6,423,000
Misc. Melons 2014 1,341 409 547,799 40 Lb Ctn $12.60 $6,902,000Watermelons 2015 1,250 23.75 29,688 Ton $383.09 $11,373,000
2014 1,946 29.17 56,758 Ton $440.01 $24,974,000Total 2015 Acres 121,284 Value $805,021,000Total 2014 Acres 122,279 Value $723,260,000Numbers may not compute due to rounding
Misc. Vegetables may include: Artichoke, Arugula, Asparagus, Basil, Beans, Beets, Bok Choy, Brussel Sprout, Celery, Cilantro,
Collard, Cucumber, Daikon, Dill, Endive, Fennel, Garbanzo Beans, Garlic, Kale, Leek, Mint, Mustard, Napa
Cabbage, Okra, Parsley, Peas, Radish, Rapini, Rutabaga, Sage, Squash, Swiss Chard, Tomato, TurnipCwt = 100 Pounds
California Agricultural Statistics are compiled annually from County Agricultural Commissioner Crop Reports
⦁In 2014, Imperial County ranked #11 out of 58 California Counties with a gross value of agricultural production
at $1,858,789,000.
⦁According to a 2014-15 review of the 2013 Ag Statistics by CDFA, Imperial County was the sole producer of sugar beets;
#1 producer of onion, wheat, Sudangrass and alfalfa seed; and among the top five producers of cattle,
lettuce, alfalfa hay, broccoli, celery, carrots, cauliflower, corn, sheep, dates, melons, spinach, potatoes, salad greens,
cabbage, and grapefruit.
⦁In 2014, California remained the leading state in cash farm receipts with the leading crops being fruits, nuts and vegetables.
California produces over 1/3 of the vegetables and 2/3 of the fruit & nuts in the US; California produces nearlyall the national production of almonds, dates, figs, kiwifruit, olives, peaches, pistachios, dried plums, raisins and walnuts.
www.co.imperial.ca.us/ag
Vegetable & Melon CropsProduction
California Agricultural Statistics – 2014

Imperial County
Harvested Yield Value Gross ValueCrop Year Acres Per Acre Total Unit Per Unit Total
Dates 2015 2,034 3.80 7,731.17 Ton $3,150.62 $24,358,000
2014 2,148 3.22 6,923.57 Ton $5,143.59 $35,612,000Grapefruit 2015 1,220 6.48 7,905.67 Ton $613.61 $4,851,000
2014 1,337 3.05 4,071.98 Ton $706.04 $2,875,000
Lemons 2015 3,745 12.90 48,300.74 Ton $782.78 $37,809,0002014 3,857 10.70 41,273.82 Ton $1,013.02 $41,811,000
Tangelos 2015 530 8.26 4,380.08 Ton $801.13 $3,509,0002014 759 4.08 3,097.70 Ton $1,581.17 $4,898,000
Tangerines 2015 729 7.67 5,589.64 Ton $878.41 $4,910,0002014 816 3.26 2,656.12 Ton $1,007.86 $2,677,000
Misc. Citrus, Fruit 2015 521 11.47 5,972.29 Ton $986.72 $5,893,000
& Nut Crops 2014 769 6.52 5,007.29 Ton $1,369.00 $6,855,000Citrus By-Products 2015 11,761.36 Ton $165.54 $1,947,000
2014 6,178.71 Ton $191.14 $1,181,000
Total 2015 Acres 8,778 Value $83,277,000
Total 2014 Acres 9,685 Value $95,909,000
Numbers may not compute due to rounding
Misc. Citrus, Fruit & Nut Crops may include: Grapes, Limes, Mangos, Olives, Oranges
www.co.imperial.ca.us/ag
Fruit & Nut CropsProduction
Harvested Yield ValueCrop Year Acres Per Acre Total Units Unit Per Unit Gross Value
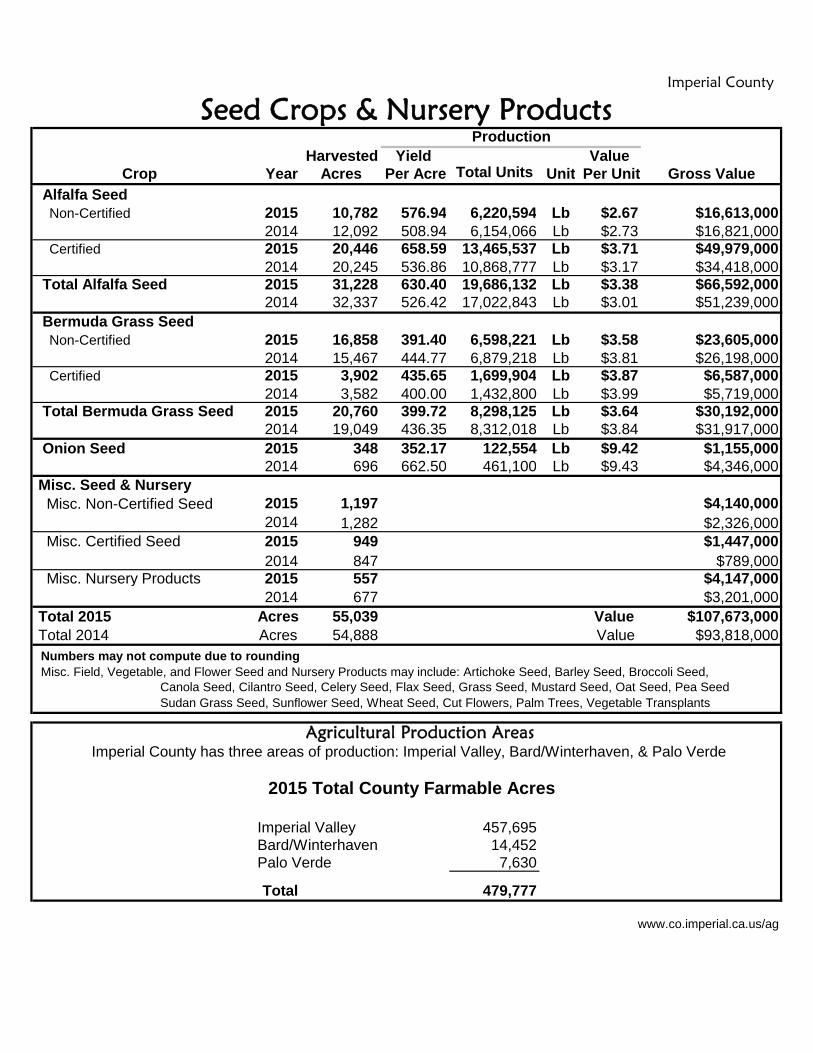
Alfalfa SeedNon-Certified 2015 10,782 576.94 6,220,594 Lb $2.67 $16,613,000
2014 12,092 508.94 6,154,066 Lb $2.73 $16,821,000Certified 2015 20,446 658.59 13,465,537 Lb $3.71 $49,979,000
2014 20,245 536.86 10,868,777 Lb $3.17 $34,418,000Total Alfalfa Seed 2015 31,228 630.40 19,686,132 Lb $3.38 $66,592,000
2014 32,337 526.42 17,022,843 Lb $3.01 $51,239,000
Bermuda Grass SeedNon-Certified 2015 16,858 391.40 6,598,221 Lb $3.58 $23,605,000
2014 15,467 444.77 6,879,218 Lb $3.81 $26,198,000Certified 2015 3,902 435.65 1,699,904 Lb $3.87 $6,587,000
2014 3,582 400.00 1,432,800 Lb $3.99 $5,719,000Total Bermuda Grass Seed 2015 20,760 399.72 8,298,125 Lb $3.64 $30,192,000
2014 19,049 436.35 8,312,018 Lb $3.84 $31,917,000
Onion Seed 2015 348 352.17 122,554 Lb $9.42 $1,155,0002014 696 662.50 461,100 Lb $9.43 $4,346,000
Misc. Seed & Nursery
Misc. Non-Certified Seed 2015 1,197 $4,140,000
2014 1,282 $2,326,000Misc. Certified Seed 2015 949 $1,447,000
2014 847 $789,000Misc. Nursery Products 2015 557 $4,147,000
2014 677 $3,201,000
Total 2015 Acres 55,039 Value $107,673,000Total 2014 Acres 54,888 Value $93,818,000
Numbers may not compute due to rounding
Canola Seed, Cilantro Seed, Celery Seed, Flax Seed, Grass Seed, Mustard Seed, Oat Seed, Pea Seed
Sudan Grass Seed, Sunflower Seed, Wheat Seed, Cut Flowers, Palm Trees, Vegetable Transplants
Imperial Valley 457,695Bard/Winterhaven 14,452Palo Verde 7,630
Total 479,777
www.co.imperial.ca.us/ag
Agricultural Production AreasImperial County has three areas of production: Imperial Valley, Bard/Winterhaven, & Palo Verde
2015 Total County Farmable Acres
Imperial County
Seed Crops & Nursery ProductsProduction
Misc. Field, Vegetable, and Flower Seed and Nursery Products may include: Artichoke Seed, Barley Seed, Broccoli Seed,
Imperial County
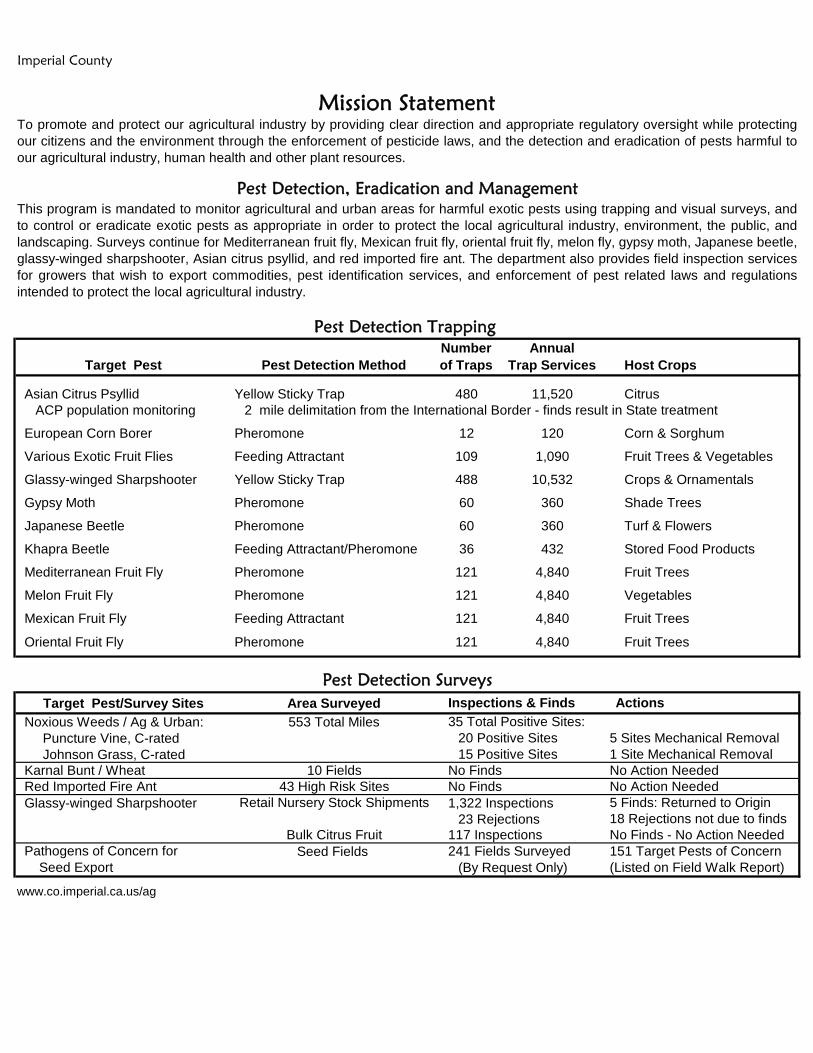
Target Pest Pest Detection Method
Number
of Traps
Annual
Trap Services Host Crops
Asian Citrus Psyllid Yellow Sticky Trap 480 11,520 CitrusACP population monitoring 2 mile delimitation from the International Border - finds result in State treatment
European Corn Borer Pheromone 12 120 Corn & Sorghum
Various Exotic Fruit Flies Feeding Attractant 109 1,090 Fruit Trees & Vegetables
Glassy-winged Sharpshooter Yellow Sticky Trap 488 10,532 Crops & Ornamentals
Gypsy Moth Pheromone 60 360 Shade Trees
Japanese Beetle Pheromone 60 360 Turf & Flowers
Khapra Beetle Feeding Attractant/Pheromone 36 432 Stored Food Products
Mediterranean Fruit Fly Pheromone 121 4,840 Fruit Trees
Melon Fruit Fly Pheromone 121 4,840 Vegetables
Mexican Fruit Fly Feeding Attractant 121 4,840 Fruit Trees
Oriental Fruit Fly Pheromone 121 4,840 Fruit Trees
Target Pest/Survey Sites Area Surveyed
Noxious Weeds / Ag & Urban: 553 Total Miles 35 Total Positive Sites:Puncture Vine, C-rated 5 Sites Mechanical RemovalJohnson Grass, C-rated 1 Site Mechanical Removal
Karnal Bunt / Wheat 10 Fields No Action NeededRed Imported Fire Ant 43 High Risk Sites No Action NeededGlassy-winged Sharpshooter Retail Nursery Stock Shipments 5 Finds: Returned to Origin
18 Rejections not due to findsBulk Citrus Fruit 117 Inspections No Finds - No Action Needed
Pathogens of Concern for Seed Fields 241 Fields Surveyed 151 Target Pests of ConcernSeed Export (By Request Only) (Listed on Field Walk Report)
www.co.imperial.ca.us/ag
1,322 Inspections23 Rejections
Pest Detection Surveys
No FindsNo Finds
Inspections & Finds Actions
20 Positive Sites15 Positive Sites
Mission StatementTo promote and protect our agricultural industry by providing clear direction and appropriate regulatory oversight while protectingour citizens and the environment through the enforcement of pesticide laws, and the detection and eradication of pests harmful toour agricultural industry, human health and other plant resources.
Pest Detection, Eradication and ManagementThis program is mandated to monitor agricultural and urban areas for harmful exotic pests using trapping and visual surveys, andto control or eradicate exotic pests as appropriate in order to protect the local agricultural industry, environment, the public, andlandscaping. Surveys continue for Mediterranean fruit fly, Mexican fruit fly, oriental fruit fly, melon fly, gypsy moth, Japanese beetle,glassy-winged sharpshooter, Asian citrus psyllid, and red imported fire ant. The department also provides field inspection servicesfor growers that wish to export commodities, pest identification services, and enforcement of pest related laws and regulationsintended to protect the local agricultural industry.
Pest Detection Trapping

Imperial County
Type of Inspection Inspections Pounds OriginField & Vegetable Seed 921 15,080,404 Arizona, Canada, Chile, Florida, Idaho, Maine,
Michigan, Nebraska, Oregon, Tennessee, Texas,and Washington
Plants 136
88
-
-
Arizona, Florida, Illinois, Michigan, Pennsylvania,and TexasCalifornia
Bees for Pollination 18 - Canada
Type of Inspection Locations Production Acres Nursery Stock Type
Production Nursery 19 449 Palms, Bamboo, Vegetable Transplants,Ornamentals, Cut Flowers, Succulents
Retail Nursery 37 - Retail Flowers, Trees and Shrubs
Type of Inspection Inspections Seed Transfer Certificates Number of Certificates
Harvest Equipment 33 In-State 90Out of State 54
Plant Quarantine, Exclusion, and CertificationThe department is mandated to exclude exotic agricultural, urban, and environmental pests and to prevent movement of newlydiscovered pests within the state. This is accomplished through inspection of incoming agricultural products and enforcementof quarantines that prohibit or restrict the movement of plants, seeds, and other items capable of harboring harmful pests. Inaddition, certificates of quarantine compliance and phytosanitary certificates are issued for commodities originating here inorder to assist growers in moving their products to other counties, states, or countries.
Plant QuarantinePest Exclusion Inspections (Shipments Entering Imperial County)
Nursery Inspections
California Crop Improvement Association Inspections and Certification
Organic Grower ProgramThe Organic Program is responsible for enforcement of the federal Organic Foods Production Act of 1990 and the California
Organic Products Act of 2003. These statutes protect consumers, producers, handlers, processors and retailers by monitoring
and inspecting fresh commodities grown, labeled or sold as organic.
Nursery and Seed Inspection The goals of the nursery inspection programs are to prevent the introduction and spread of agricultural pests through nurserystock and to protect agriculture and the consumer against economic losses resulting from the sale of inferior, defective, or pest-infested nursery stock. The seed law enforcement program protects seed consumers by regulation of the marketing of seed,inspection of seed grown or sold locally, verification of purity and germination, investigation of seed complaints, and preventionof the spread of noxious weed seeds through seed products. Also included in this program is the California Certified SeedProgram in which superior varieties of seed are grown, processed, and distributed under close supervision.
Year Growers Acres Gross Value
2015 36 31,934 $275,382,000
2014 28 25,156 $159,938,000
2013 20 19,433 $80,904,000
2012 26 11,989 $36,396,000
2011 26 7,487 $39,386,000
www.co.imperial.ca.us/ag
5 Year Comparison of Organic Production
5,000
10,000
15,000
20,000
25,000
30,000
35,000
2011 2012 2013 2014 2015
Organic Acreage Production5 Year ComparisonAcres

Co
nn
ie L
. Val
enzu
ela
Ag
ricu
ltur
al C
om
mis
sio
ner
Seal
er o
f W
eig
hts
and
Mea
sure
s
852
Bro
adw
ay
El C
entr
o, C
A 9
224
3-2
850