conocophillips alaska, inc. (cpai) alaska field study design - drill
TRANSCRIPT

ConocoPhillips Alaska, Inc. (CPAI) Alaska Field Study Design - Drill Rig 1-Hour NO2
Collaborative Study
Monitoring Plan
August 2014

Alaska Field Study Design:
Drill Rig 1-Hour NO2 Collaborative Study Monitoring Plan
August 2014 Page i of i
Table of Contents I. Study Purpose .............................................................................................................. 1
II. Background - Alaska Field Study Design ................................................................ 1
III. Experimental Design, Engineering Design and Budget .......................................... 3
1. Experimental Design ................................................................................................ 3
2. Engineering .............................................................................................................. 4
3. Budget ...................................................................................................................... 5
IV. Conceptual Measurements to be conducted ............................................................. 6
1. Source Measurements .............................................................................................. 6
2. Ambient Air Quality Measurements ........................................................................ 8
3. Meteorological Measurements ................................................................................. 9
4. Data Acquisition .................................................................................................... 10
5. Optional Data ......................................................................................................... 10
6. Experimental Operation ......................................................................................... 10
V. Data Analysis ......................................................................................................... 11
VI. Project Organization .............................................................................................. 11
Attachment A – North Slope Ambient Monitoring Station Locations Attachment B – 1-hour NO2 Monitoring Results from North Slope monitoring stations Attachment C – Drill Site 2N Study Location and Drilling Schedule Attachment D – Drill Site 2N Dispersion Modeling Attachment E – Quality Assurance Criteria Attachment F – Equipment List

Alaska Field Study Design:
Drill Rig 1-Hour NO2 Collaborative Study Monitoring Plan
August 2014 Page 1 of 11
I. Study Purpose
The purpose of this study is to collect ambient pollutant measurements adjacent to oil drilling rigs on the North Slope of Alaska to evaluate actual 1-hour NO2 ambient air quality impacts from drilling operations. This study is a collaborative effort between the Bureau of Land Management (BLM), the Alaska Department of Environmental Conservation (ADEC), and ConocoPhillips, Alaska1 through the auspices of the Western Regional Air Partnership (WRAP). This study, along with the additional information discussed below, is meant to answer the question, “Does reasonable assurance exist that drill rig operations in general do not pose a threat to any of the ambient air quality standards.” With consideration given to available equipment and resources, the study will be designed and executed by these parties. In addition to this purpose, drill rig operational, fuel use, and emission data, along with concurrent meteorological data will be collected primarily to understand the sensitivity of measured impacts to drill rig operation. This data will also be useful in comparing model predicted impacts to the ambient air quality measurements. This information can be used to evaluate the effectiveness of current dispersion models for predicting actual drill rig ambient air quality impacts.
II. Background - Alaska Field Study Design
The use of current modeling techniques and enforceable permit limitations frequently leads to modeled violations of the 1-hour NO2 ambient air quality standard. This approach to drill rig modeling has been, to date, foundational to Alaska’s drill rig permitting program and is also under consideration for application to environmental impact analyses that support drilling on federal lands.2 There exists the informed belief that one of the reasons this approach results in excess model output is because of limitations within the models themselves. But there is little doubt that a major reason the approach results in excess predicted impacts is its prescription to model all rig equipment operating simultaneously at maximum operating rates 8,760 hours per year unless there is a permit limit, including monitoring and recordkeeping requirements, to operate the rig any other way regardless of how big a disconnect exists between normal and modeled operations.
1 BP Alaska is considering joining this effort and may do so as the study progresses. 2 Memorandum of Understanding among the U.S. Department of Agriculture, U.S. Department of the Interior, and U.S. Environmental Protection Agency, Regarding Air Quality Analyses and Mitigation for Federal Oil and Gas Decisions through the National Environmental Policy Act Process, June 23, 2011

Alaska Field Study Design:
Drill Rig 1-Hour NO2 Collaborative Study Monitoring Plan
August 2014 Page 2 of 11
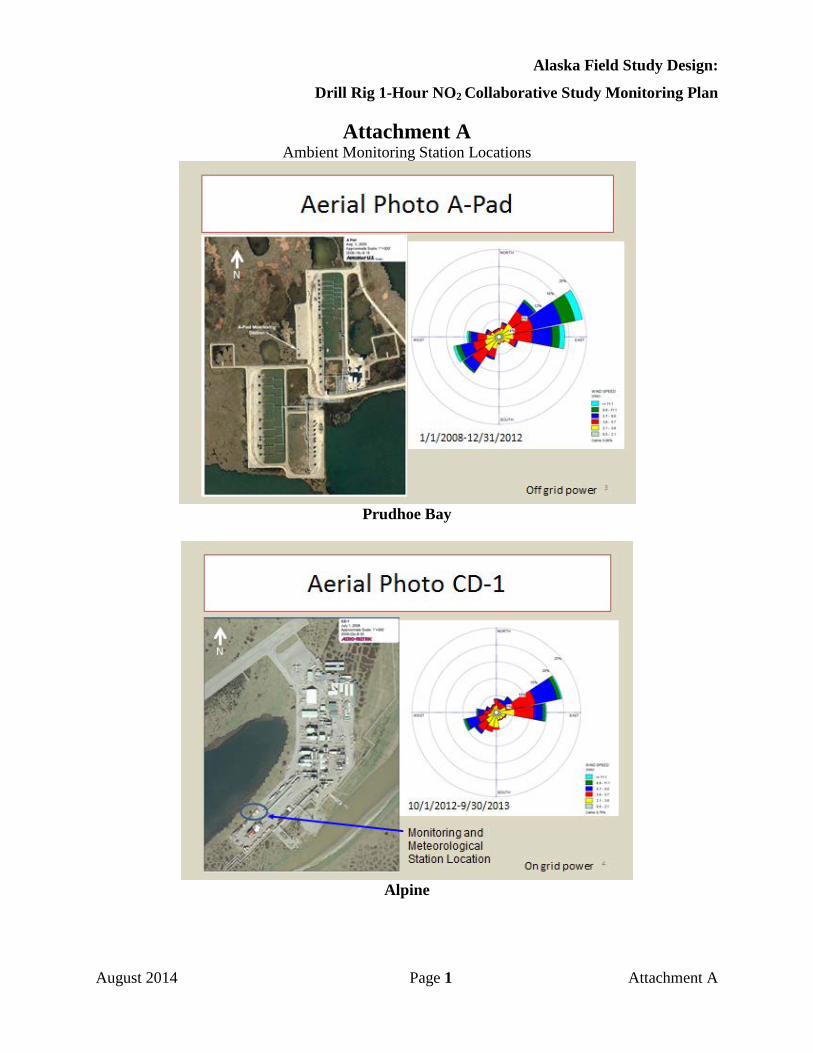
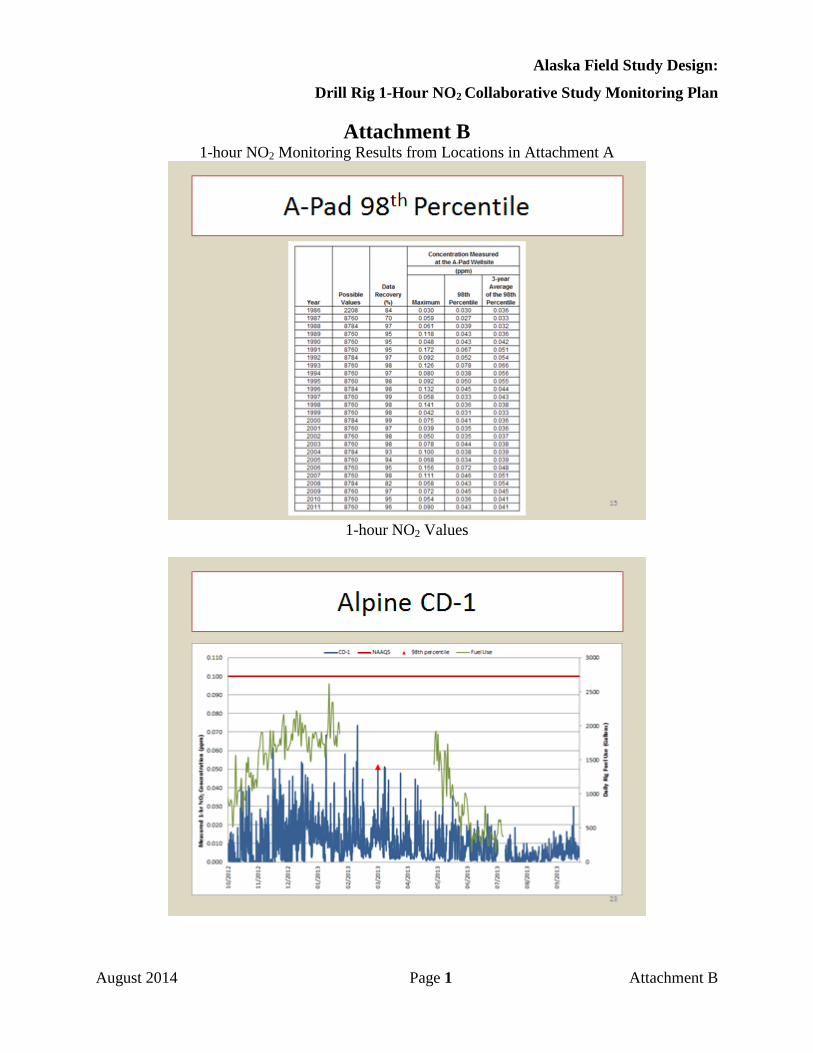
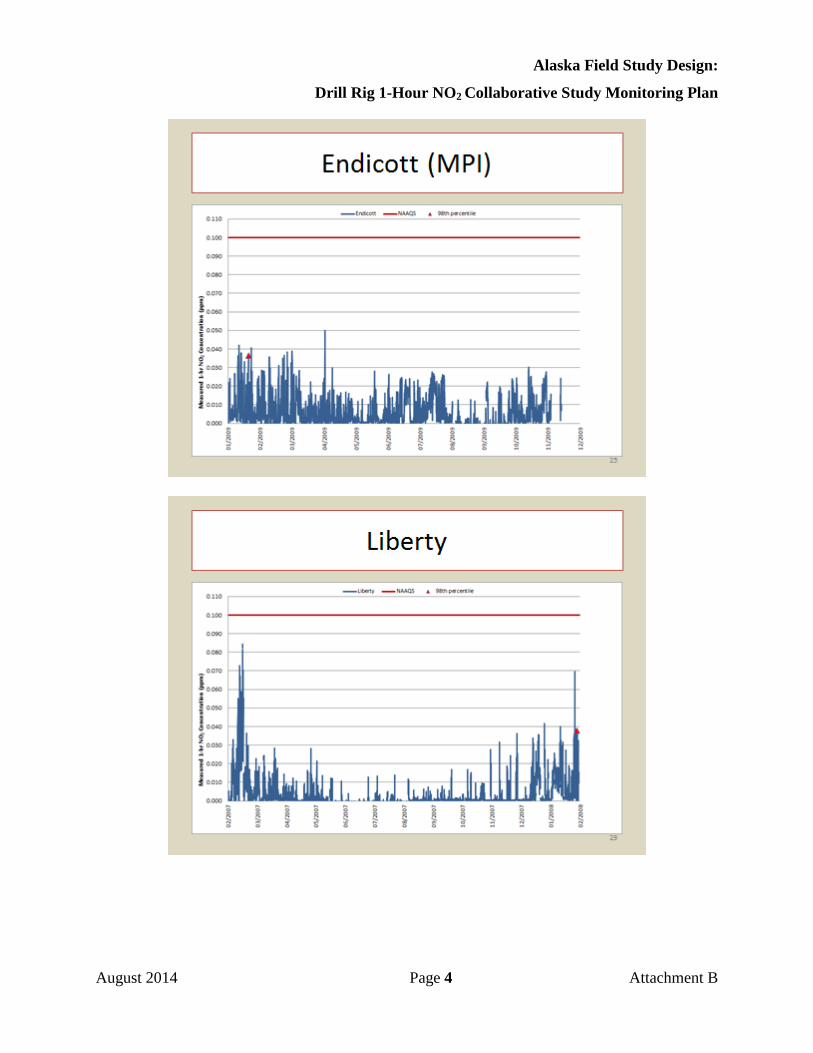
In contrast to the model predicted ambient air quality concentrations, ambient air quality measurements collected in the vicinity of drill rigs show they do not, and have not ever in the case of the Alaska North Slope, threaten (ed) the 1-hour NO2 standard. Because of the number of sites where the ambient air quality data was collected, as well as the duration of the data collection events, the ambient air quality values are believed to represent the range of drilling scenarios (vertical wells, horizontal wells, different rigs, multiple rigs, well maintenance, etc). On Alaska’s North Slope, ambient air quality data has been collected at the drill sites and for the durations listed below. Attachment A contains overhead photographs of these sites along with notations showing the location of the ambient air monitoring equipment.
• Prudhoe Bay A-Pad: 28 years consecutive and continuing
• Alpine CD-1: 1.5 years and continuing
• Kuparuk DS-1F: 2 years (1990-1992), 1 year (2001-2002), 1 year (2012-2013)
• Milne Point: 1 year (2009)
• Liberty: 1 year (2007-2008)
• Alpine CD-3: 2 months (2011)
Although only the Alpine CD-1 and CD-3 data was collected for the express purpose of evaluating rig impacts, there should be little doubt that the duration of monitoring at the other sites resulted in many exposures to representative 1-hour NO2 impacts from drilling activities. Attachment B contains the 1-hour NO2 results from these monitoring efforts. This study, though shorter term than the monitoring discussed above, capitalizes on the data previously collected to design a program that maximizes the chance that the pollutant monitoring occurs at the point of the highest likelihood of maximum impacts. The data collected will be used to identify the specific meteorological conditions and downwind distance leading to the highest impacts. With those conditions identified, a detailed analysis of the existing climatology will pinpoint the appropriate downwind directions and dispersion modeling will help identify the appropriate downwind location and monitoring height. Different from previous studies, this study will be enhanced by collecting detailed rig and related activity operational information for the purpose of understanding the sensitivity of impacts to drill rig activity and comparing measured to modeled predicted concentrations.

Alaska Field Study Design:
Drill Rig 1-Hour NO2 Collaborative Study Monitoring Plan
August 2014 Page 3 of 11
III. Experimental Design, Engineering Design and Budget
1. Experimental Design
The Study location will be on Alaska’s North Slope at Kuparuk River Unit, Drill Site 2N (see Attachment C) for the months of August through December 2014. During this time period, drill rig Nabors 9ES will be on the pad drilling five new wells and will reside at each well for approximately one month (see Attachment C for the current schedule as of June 13, 2014).
Nabors 9ES has two 3512B engines at 1477 bhp each, one 3412 engine at 831 bhp, two 150 hp boilers, and a total heater capacity of 2.96 MMBtu/hr. The 3512B engines run in parallel sharing the load for power generation, the 3412 engine is used as a cold start engine and rarely operates, the two boilers heat the rig, and the heater heats the pipe shed. Continuous Emission Monitoring Systems (CEMS) will be deployed on the drill rig to measure emissions from the two 3512B engines, two 150 hp boilers, and heater. An ambient air quality monitoring station will be deployed downwind to monitor potential impacts originating from the rig operations. An additional upwind ozone sampler will be operated to collect ozone concentrations entering the local study area. Fuel usage of the engines, boilers, and heater is expected to be monitored however may prove impractical or unable to be implemented.
During the summer months, the wind is predominantly from the east-northeast while the wind patterns during the winter months are more bimodal blowing predominantly from both the east-northeast and west-southwest. Attachment A displays annual wind roses for several monitoring stations on Alaska's North Slope.
Predictive dispersion modeling using five (5) years of meteorological data (Attachment D) suggests that a monitoring station on the western edge of Drill Site 2N (Attachment C) will offer the highest frequency of measured impacts originating from the drill rig. This site also offers the safest location to avoid interferences with pad operations. In addition to the monitoring station, an ozone instrument will be deployed at the northeast corner of Drill Site 2N to monitor background ozone concentration levels. These ozone concentration levels may be used for more accurate modeling of NOx conversions between NO and NO2.
Historical weather conditions3 suggest study temperatures should range from a maximum temperature near 25 °C in late July to a minimum temperature nearing -35 °C in the later portions of November and early December. These conditions are expected to effectively represent those typically encountered throughout the majority of the calendar year.
3 Nuiqsut PSD-Quality ambient air quality and meteorological monitoring station (Average temperatures observed July – November, 2011-2013)
Alaska Field Study Design:
Drill Rig 1-Hour NO2 Collaborative Study Monitoring Plan
August 2014 Page 4 of 11
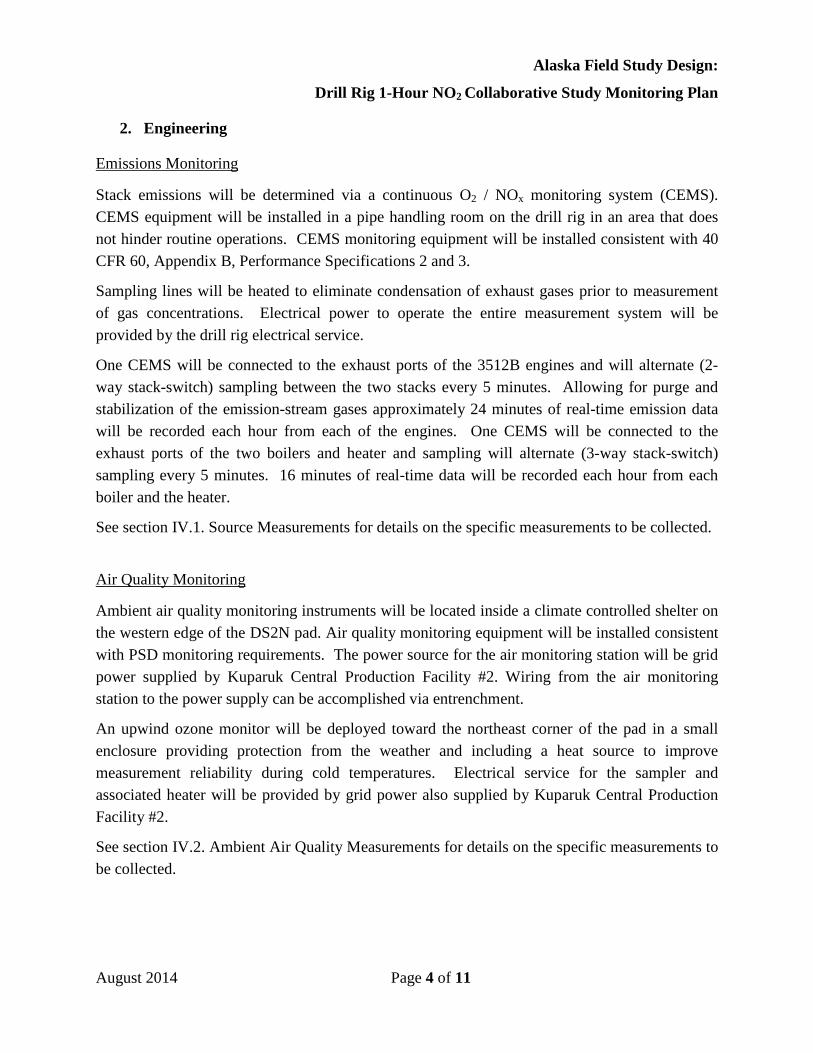
2. Engineering
Emissions Monitoring
Stack emissions will be determined via a continuous O2 / NOx monitoring system (CEMS). CEMS equipment will be installed in a pipe handling room on the drill rig in an area that does not hinder routine operations. CEMS monitoring equipment will be installed consistent with 40 CFR 60, Appendix B, Performance Specifications 2 and 3.
Sampling lines will be heated to eliminate condensation of exhaust gases prior to measurement of gas concentrations. Electrical power to operate the entire measurement system will be provided by the drill rig electrical service.
One CEMS will be connected to the exhaust ports of the 3512B engines and will alternate (2-way stack-switch) sampling between the two stacks every 5 minutes. Allowing for purge and stabilization of the emission-stream gases approximately 24 minutes of real-time emission data will be recorded each hour from each of the engines. One CEMS will be connected to the exhaust ports of the two boilers and heater and sampling will alternate (3-way stack-switch) sampling every 5 minutes. 16 minutes of real-time data will be recorded each hour from each boiler and the heater.
See section IV.1. Source Measurements for details on the specific measurements to be collected.
Air Quality Monitoring
Ambient air quality monitoring instruments will be located inside a climate controlled shelter on the western edge of the DS2N pad. Air quality monitoring equipment will be installed consistent with PSD monitoring requirements. The power source for the air monitoring station will be grid power supplied by Kuparuk Central Production Facility #2. Wiring from the air monitoring station to the power supply can be accomplished via entrenchment.
An upwind ozone monitor will be deployed toward the northeast corner of the pad in a small enclosure providing protection from the weather and including a heat source to improve measurement reliability during cold temperatures. Electrical service for the sampler and associated heater will be provided by grid power also supplied by Kuparuk Central Production Facility #2.
See section IV.2. Ambient Air Quality Measurements for details on the specific measurements to be collected.

Alaska Field Study Design:
Drill Rig 1-Hour NO2 Collaborative Study Monitoring Plan
August 2014 Page 5 of 11
Meteorological Monitoring
The Prevention of Significant Deterioration (PSD) quality meteorological monitoring station previously used at Kuparuk DS1F will be re-commissioned to collect meteorological data representative of the general study area. Data from the Nuiqsut ambient air quality and meteorological monitoring station may also be used during the study. Additionally, supplemental wind speed and wind direction measurements will be collected at the downwind air quality station.
See section IV.3. Meteorological Measurements for details on the specific measurements to be collected.
Fuel Usage Monitoring
Fuel consumption rates of the engines will be monitored throughout the study. The specific type of meters and amount of data that will be able to be collected is still being determined. Fuel consumption rates for the heaters and boilers is planned to be monitored but it is currently unclear whether proper meters can be procured in time for the study.
Special Conditions
All air monitoring will be conducted in a manner that ensures the safety of personnel and does not disrupt drilling operations. If the monitoring equipment or program poses a risk to safe operations of the drill rig or associated support efforts, the study will be suspended until such time that safe simultaneous operations can be restored.
Due to extremely limited space on the pad and safety factors associated with a portable station on a congested pad, the downwind monitoring station and the upwind ozone monitor will remain in fixed locations throughout the study.
While located at Well 350, Nabors 9ES will be in close proximity to the air quality monitoring site location. There is a potential for inadvertent damage to the air monitoring equipment or potential risk to personnel resulting from congestion. If a reasonable solution cannot be achieved that allows both air monitoring and drilling activities to continue unscathed, then the air monitoring station may have to be removed during this time period.
3. Budget
CPAI has allocated sufficient budget to implement the monitoring and associated data analysis and reporting described in this monitoring plan.

Alaska Field Study Design:
Drill Rig 1-Hour NO2 Collaborative Study Monitoring Plan
August 2014 Page 6 of 11
IV. Conceptual Measurements to be conducted
1. Source Measurements
Stack O2, NOx, NO, and NO2 emissions will be determined via a continuous O2 / NOx monitoring system (CEMS). CEMS equipment will be installed in a pipe handling room on the drill rig in an area that does not hinder routine operations. Emissions measurements will be conducted directly from ports installed in the stack of each engine, boiler and heater. To balance study costs with the need for the most accurate data available, stack-switching technology will be used to reduce the number of CEMS samplers required to collect emission data from five (5) to two (2). One (1) CEMS will be dedicated to the two engines, and one (1) CEMS to the two boilers and heater. Monitoring equipment will use operating scales corresponding to expected emissions concentrations calculated for each source. An operating scale of 0 – 2000 ppm will be used for the engine stack monitoring while a scale of 0 – 200 ppm will be used for the boiler / hear stack monitoring system to ensure expected concentrations are measured within the established operating range of the instrument.
Due to the switching, purging, and stabilization time associated with alternating stacks, 4 minutes of valid, accurate data will be recorded from each engine stack every 10 minutes resulting in approximately 24 minutes of data from each stack every hour. 4 minutes of valid, accurate data is expected from each of the boilers and the heater every 15 minutes resulting in approximately 16 minutes of data from each stack every hour. This sampling schedule is consistent with CEMS emission monitoring rules that require minimum sampling frequency every 15 minutes.4 Figure IV – 1 provides a summary of data collection versus off-time periods throughout the course of an hour to demonstrate the amount of data to be collected for each emission source type (engine, boiler, or heater). During periods of data collection, measurements will be obtained for O2, NOx, NO, and NO2.
440 CFR 60.13(h)(2)(i) - Except as provided under paragraph (h)(2)(iii) of this section, for a full operating hour (any clock hour with 60 minutes of unit operation), at least four valid data points are required to calculate the hourly average, i.e., one data point in each of the 15-minute quadrants of the hour.

Alaska Field Study Design:
Drill Rig 1-Hour NO2 Collaborative Study Monitoring Plan
August 2014 Page 7 of 11
Figure IV – 1 Alternating Data Collection Periods by source type
Data CollectionEngine #1
(24 min. / Hr)
Data CollectionEngine #2
(24 min. / Hr)
Switch / PurgeStabilizing
(12 min. / Hr)
Data CollectionBoiler #1
(16 min. / Hr)
Data CollectionBoiler #2
(16 min. / Hr)
Switch / PurgeStabilizing
(12 min. / Hr)
Data CollectionHeater
(16 min. / Hr)

Alaska Field Study Design:
Drill Rig 1-Hour NO2 Collaborative Study Monitoring Plan
August 2014 Page 8 of 11
CEMS instrument measurement range will be scaled according to the predicted concentrations expected for each of the emission sources being monitored. Pollutant concentrations used for the initial instrument calibration and on-going daily calibration drift checks will be adjusted to assess the full range of expected or potential concentration measurements.
Quality assurance criteria that will be used to assess CEMS data quality are provided in Attachment E. Attachment F provides the equipment specifications. CEMS monitoring will conform to 40 CFR Part 60 Appendix B, Performance Specifications 2 and 3 with the exception that Relative Accuracy Test Audits (RATA) will not be conducted. Instead, at least once during the study a gas cylinder audit will be conducted using separate gas cylinders and at different concentration ranges than used for instrument calibration. Calibration and audit gas concentrations will be National Institute of Standards and Technology (NIST) traceable.
2. Ambient Air Quality Measurements
An air quality monitoring station will be located downwind of the drill rig and will monitor the following pollutants:
• NOx/NO/NO2 • SO2 • PM2.5 • PM10 • CO • O3 • Wind Speed • Wind Direction
The downwind air quality monitoring station will be operated according to PSD quality assurance criteria however the wind speed and wind direction measurements are not sited to meet EPA requirements for maintaining the necessary distance from structures that could influence winds. These local wind speed and wind direction measurements will be used to provide information on any localized wind influences that could impact pollutant dispersion. A second ozone monitor will be located upwind of the rig to define background O3 concentrations. The upwind ozone monitor will be operated according to National Park Service quality assurance criteria. See Attachment E for specific quality assurance criteria applied to the ambient air quality data collected and Attachment F for the equipment specifications.
Alaska Field Study Design:
Drill Rig 1-Hour NO2 Collaborative Study Monitoring Plan
August 2014 Page 9 of 11
Due to differences in measurement methodology for O3 between the upwind background O3 sampling equipment and that of the downwind O3 sampling equipment, a short-duration (2 to 4 week) correlation study between the two O3 instruments will be conducted prior to beginning the drill rig study to assess potential for measurement bias between the two measurement methods. If resources and conditions allow, a second correlation study between the two instruments will be conducted at the conclusion of the study.
40 CFR Part 53.32 describe test procedures for assessing O3 testing method comparability. Sub-part C, Table C-1 further suggests that a maximum discrepancy of 0.020 ppm between the measurements obtained by the two different O3 samplers would be an appropriate criteria to demonstrate comparability given that ambient O3 concentrations are expected to be low (< 0.100 ppm). The difference between 1-hour, 8-hour, and 24-hour average concentrations will be evaluated.
However, given that the correlation study in practice is similar in nature to how PM2.5 comparisons are performed using actual ambient measurements (40 CFR Part 53.35), slope and intercept relationships between the two O3 sampler measurements will also be evaluated. A slope of 1 ± 0.1 and intercept of 0 ± 0.005 ppm criteria will be used to assess the overall performance differences between the two O3 monitoring methods. Finally, the coefficient of variation (CV) will be evaluated and compared to the ≤ 7% criteria used in PSD monitoring programs to assess method precision.
Failure to demonstrate comparability of measurements to these criteria will not be considered a critical data quality failure; however data collected during the correlation study may be used during data analysis if measurement differences suggest that upwind ozone data should be corrected, adjusted, or normalized in some manner. If some sort of adjustment is determined necessary, a protocol will be developed in consultation with BLM and ADEC and will be fully explained in data summary reports.
3. Meteorological Measurements
PSD-quality 10-meter meteorological towers are located at Nuiqsut, Alaska as well as at Kuparuk / DS1F. These towers are equipped to measure:
1) Wind speed and direction at 10 meters; 2) Sigma theta (Calculated via the Yamartino method); 3) Temperature (2 meter, 10 meter, and differential temperature / delta T) 4) Solar radiation; and 5) Vertical wind speed.

Alaska Field Study Design:
Drill Rig 1-Hour NO2 Collaborative Study Monitoring Plan
August 2014 Page 10 of 11
Additionally, wind speed and wind direction will be measured at the downwind air quality station at approximately 3 meters to assess localized wind conditions potentially affecting dispersion of drill rig emissions. See Attachment E for specific quality assurance criteria applied to the meteorological measurement data and Attachment F for the monitoring equipment specifications.
4. Data Acquisition
All air quality data and emission related data will be recorded using localized data acquisition systems. All data, with the exception of the CEMS data, will be stored in both 1 minute average form (except sigma theta) and hourly average form. Hourly averages will be calculated using a minimum of 45 minutes of valid 1 minute data for the given hour. Data recording and collection interval capabilities for fuel meters are still in the process of being determined.
Due to limitations associated with stack-switching, CEMS data will be stored in 1 minute averages (while sampling a particular stack) and 1 hour “representative” averages based on the amount of data available in a given hour. CEMS 1 hour “representative” averages will be based on averages of the 16 minutes (boilers and heater) or 24 minutes (engines) of data available during the hour. Despite this limitation, “representative” hourly averages meet the requirements applicable to CEMS monitoring in 40 CFR 60.13.
Data will be polled from the localized data acquisition systems hourly and stored in a central database. Raw data measurements will be archived and a duplicate “edit database” will be created to accommodate data validation and review. Staff will review polled data daily to verify data collection is proceeding according to plan. On a monthly basis, data will be reviewed and validated.
5. Optional Data
No additional optional types of data are planned for the monitoring study.
6. Experimental Operation
The drill rig is planned to operate on high-line power while performing operations at the DS2N pad. Due to the cost of ULSD operation of the drill rig exclusively using diesel fuel throughout the duration of the study is cost-prohibitive. Instead, the drill rig will operate exclusively on diesel fuel for up to one week after arrival at each well and connect to high-line power for the remainder of the time the rig is operating at that well as would typically be the case at the DS2N pad. This combination provides a cost-effective means to assess drill rig impacts to ambient air quality operating on both high-line and diesel-fueled power sources.

Alaska Field Study Design:
Drill Rig 1-Hour NO2 Collaborative Study Monitoring Plan
August 2014 Page 11 of 11
The upwind and downwind monitoring stations will be in fixed locations. The predominant wind direction on Alaska's North Slope will allow substantial emission data capture by the downwind monitoring station without needing to relocate it. Data will be collected as long as the monitoring station does not disrupt drilling operations.
V. Data Analysis
After the data are collected, analysis of the data will be oriented toward showing the impacts of drill rig emissions on ambient air quality. The data analysis methodology will be explained in the report presenting study data. Validated, non-summarized data will be made available to BLM and ADEC.
VI. Project Organization
The study is designed collaboratively by ConocoPhillips, BLM, and ADEC. BP will be brought into the design upon their decision to participate in field exercises. The field portion of the study will be managed by ConocoPhillips. Over the 4 to 5 month study period, monthly meetings will be held to provide data summaries, evaluate study progress, and consider study course corrections, if necessary.
Alaska Field Study Design:
Drill Rig 1-Hour NO2 Collaborative Study Monitoring Plan
August 2014 Page 1 Attachment A
Attachment A Ambient Monitoring Station Locations
Prudhoe Bay
Alpine

Alaska Field Study Design:
Drill Rig 1-Hour NO2 Collaborative Study Monitoring Plan
August 2014 Page 2 Attachment A
Alpine
Kuparuk

Alaska Field Study Design:
Drill Rig 1-Hour NO2 Collaborative Study Monitoring Plan
August 2014 Page 3 Attachment A
Milne Point
Liberty
Alaska Field Study Design:
Drill Rig 1-Hour NO2 Collaborative Study Monitoring Plan
August 2014 Page 1 Attachment B
Attachment B 1-hour NO2 Monitoring Results from Locations in Attachment A
1-hour NO2 Values

Alaska Field Study Design:
Drill Rig 1-Hour NO2 Collaborative Study Monitoring Plan
August 2014 Page 2 Attachment B

Alaska Field Study Design:
Drill Rig 1-Hour NO2 Collaborative Study Monitoring Plan
August 2014 Page 3 Attachment B
Alaska Field Study Design:
Drill Rig 1-Hour NO2 Collaborative Study Monitoring Plan
August 2014 Page 4 Attachment B

Alaska Field Study Design:
Drill Rig 1-Hour NO2 Collaborative Study Monitoring Plan
August 2014 Page 1 Attachment C
Attachment C Drill Site 2N Study Location and Drilling Schedule
Table C -1 – DS2N Drilling Schedule
Well Name Anticipated Start Date 1
Anticipated Completion Date 1
Well 303 August 9, 2014 September 2, 2014 Well 350 September 2, 2014 October 3, 2014 Well 319 October 3, 2014 October 31, 2014 Well 337 October 31, 2014 November 29, 2014 Well 336 November 29, 2014 January 2, 2015
1 Drilling schedule as of 6/13/2014

Alaska Field Study Design:
Drill Rig 1-Hour NO2 Collaborative Study Monitoring Plan
August 2014 Page 1 Attachment D
Attachment D Drill Site 2N Dispersion Modeling
Environment A-1
ConocoPhillips Alaska, Inc. Alpine DS2N Site Monitor Site Analysis
1.0 Introduction and Purpose
ConocoPhillips Alaska, Inc. (CPAI) plans to install an ambient air quality monitoring station on the DS2N pad
which is located on the Alaskan North Slope. The station will measure hourly NO2, CO, SO2, PM10, PM2.5, and
O3 concentrations. One of the purposes of the monitoring program is to characterize maximum ground-level
ambient air quality impacts due to emissions from drilling activity. Given the purpose of the monitoring
program, a dispersion modeling study was designed to aid in selection of a monitoring site on the Drill Site 2N
(DS2N) pad that has the highest probability of measuring maximum 1-hour NO2 and 24-hour PM2.5
concentrations from drilling activities planned for the foreseeable future on the DS2N well line. Section 2
discusses the design and data sources for the modeling. Section 3 discusses the results of the analysis and
Section 4 offers recommendations.
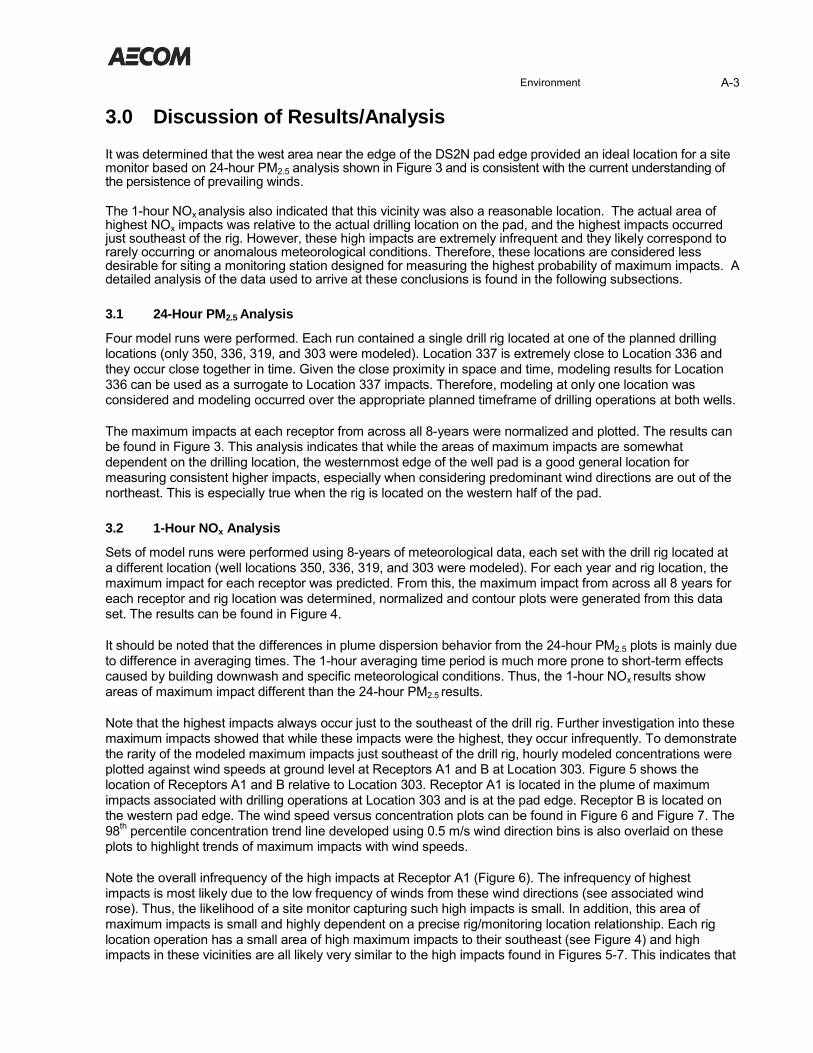
2.0 Study Design
At the time of this study, the drilling schedule during monitoring for DS2N is as follows:
It is likely that minor adjustments to this schedule will occur; however, it is unlikely that minor alterations in this schedule will affect overall conclusions found in this document. Drilling at DS2N will be conducted by the Nabors 9ES drill rig.
Emissions from this activity were simulated using dispersion modeling to understand the optimal placement for the monitoring station.
The dispersion model utilized in this study was the United States Environmental Protection Agency (USEPA) guideline model for estimating near-field impacts, the American Meteorological Society/USEPA Regulatory Model (AERMOD v 13350
1) dispersion model. Inputs required for the model include appropriate source
emission information, a receptor grid, appropriate meteorological data, and building downwash parameters. Figure 1 depicts the receptor grid, ambient boundary and building structures input into the model.
The emissions inventory was based on a Nabors 7ES drill rig which is identical to the Nabors 9ES drill rig. Potential to emit emissions emission rates were calculated and used in the modeling. The five planned drilling locations and timeframes are shown above and on Figure 1. All five of these drill rig locations were modeled only during the periods the drill rig is anticipated to be operating.
The DS2N well site is located roughly in between Drill Site 1F (DS1F) and the community of Nuiqsut. Prevention of Significant Deterioration (PSD) quality meteorological data are collected at both of these locations and meteorological conditions at both of these locations are representative of the DS2N location.
1 Version 13350 was current at the time this study was undertaken but has since been replaced with version 14134 on May
14, 2014.
Well Location Associated Dates of Rig Operation2N-303A (“Location 303”) 7/23/2014-8/16/2014
2N-350A (“Location 350”) 8/16/2014-9/16/2014
2N-319A (“Location 319”) 9/16/2014-10/14/2014
2N-337C (“Location 337”) 10/14/2014-11/12/2014
2N-336 (“Location 336”) 11/12/2014-12/16/2014

Environment A-2
Furthermore, data collected at both of these locations have been used to model facilities located near DS2N2.
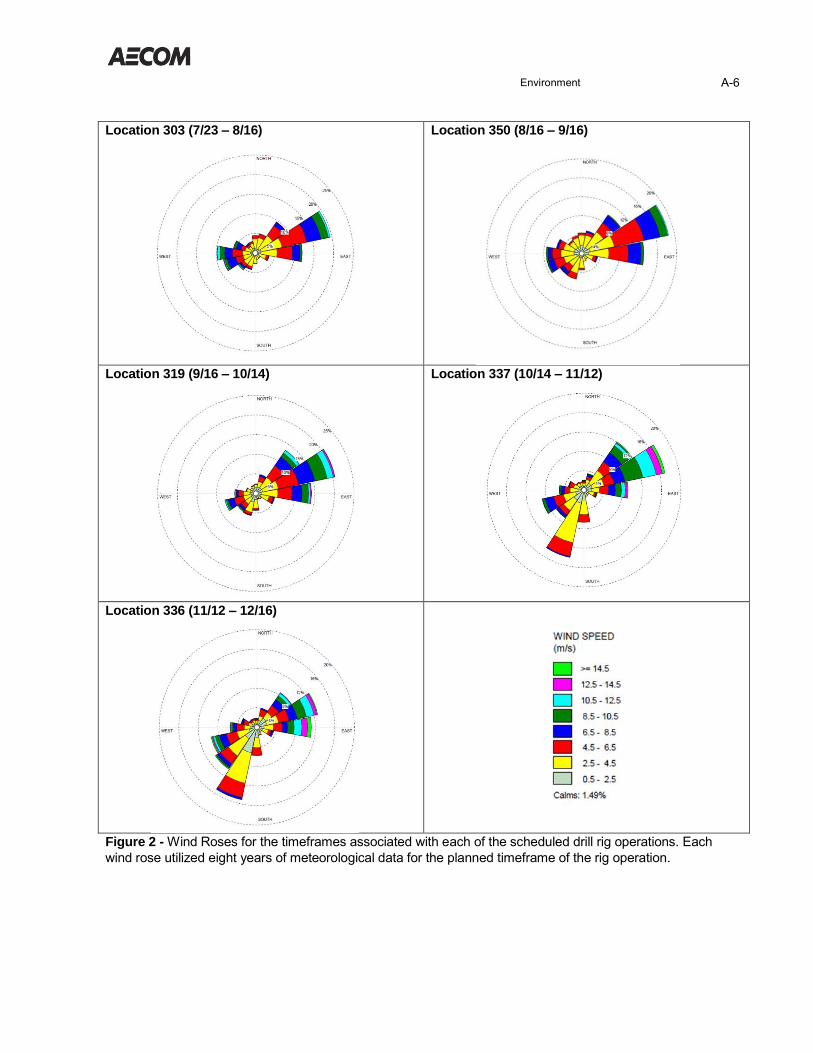
Therefore, three years of meteorological data was generated (January 1, 2002 to December 31, 2004) using data collected at the Nuiqsut Ambient Air Quality and Meteorological Monitoring Station and the Kuparak Air Quality and Meteorological Station at DS1F. Five years of additional meteorological data from January 1, 2008 to December 31, 2012 from the Nuiqsut meteorological station were also used for the analysis. Thus, a total of eight years of meteorological data was used for each model run. Data was processed using AERMET v.12345
3. Wind roses for each respective location/timeframe using all eight years of meteorological data can
be found in Figure 2. Due to the large amount of meteorology data used, it is unlikely that any minor adjustments made to the rig schedule will alter overall conclusions.
Building structures were also included in the model to utilize building downwash simulation. Downwash input parameters associated with the Nabors 9ES were developed using architectural drawings for the Nabors 7ES drill rig and the current version of the U.S. EPA Building Profile Input Program Prime (BPIP-PRIME).
The objective of the monitoring program is focused on siting a station to measure maximum hourly NO2 and 24-hour PM2.5 concentrations. Therefore, one-hour NOx and 24-hour PM2.5 model simulations were run using AERMOD to predict pollutant concentrations within a gridded receptor area on and surrounding the facility. While the focus is NO2, as described below, NOx was modeled as a surrogate since there is less controversy over AERMOD ’s handling of inert pollutants, and NOx and NO2 are correlated for drilling activities at the location of NO2 impact maxima
4.
To help select an appropriate monitoring location consistent with project goals, model-predicted impacts at each receptor were plotted and areas of worst-case impacts were assessed. Since station siting is driven by an objective of measuring maximum impacts from drilling activities, the analysis focused on an analysis of maximum model predicted impacts for 1-hour NOx and 24-hour PM2.5 rather than an analysis of model predicted design values for these averaging periods.
While assessing potential monitor site placement, both areas of high NOx impacts and areas of high PM2.5
impacts were considered jointly in order to identify a single monitoring location which would maximize the probability of obtaining high impacts from drilling activities for both pollutants. Depending on the persistence of meteorological conditions of concern for each averaging period, this can be challenging given the different averaging periods. Though basing the recommendations on locations of maximum pollutant impact is a high priority, site placement must also consider site logistics (i.e., availability of power and communications, safety consideration and land use). Therefore, realistic site placement suitability was also considered.
All results are based on inert pollutant dispersion and no chemical transformations were considered for either NOx or PM2.5. NO to NO2 conversion is a very complex chemical transformation involving not only the rate of ozone mixing into the plume but also the chemical kinetics themselves (i.e. chemical reaction rate of NO to NO2). The same can be said for secondary PM2.5 formation which is dependent on an equally complex set of variables. In both cases, AERMOD offers only highly simplified screening approaches to this problem and were considered too simplified to be appropriate for a station siting analysis.
2 Reference dispersion modeling conducted to support the Brooks Range Petroleum Mustang Development Project. Alaska
Department of Environmental Conservation – Division of Air Quality permit no. AQ1328MSS01.
3 Meteorological data was generated with a version of AERMET one generation older than the version of AERMOD. This
was because 1) that data had already been processed and approved by the State of Alaska for regulatory applications,
and the incompatibility in version numbers will not affect the type of analyses conducted for this study based on sensitivity
testing conducted.
4 Based on historical modeling of drilling activities.
Environment A-3
3.0 Discussion of Results/Analysis
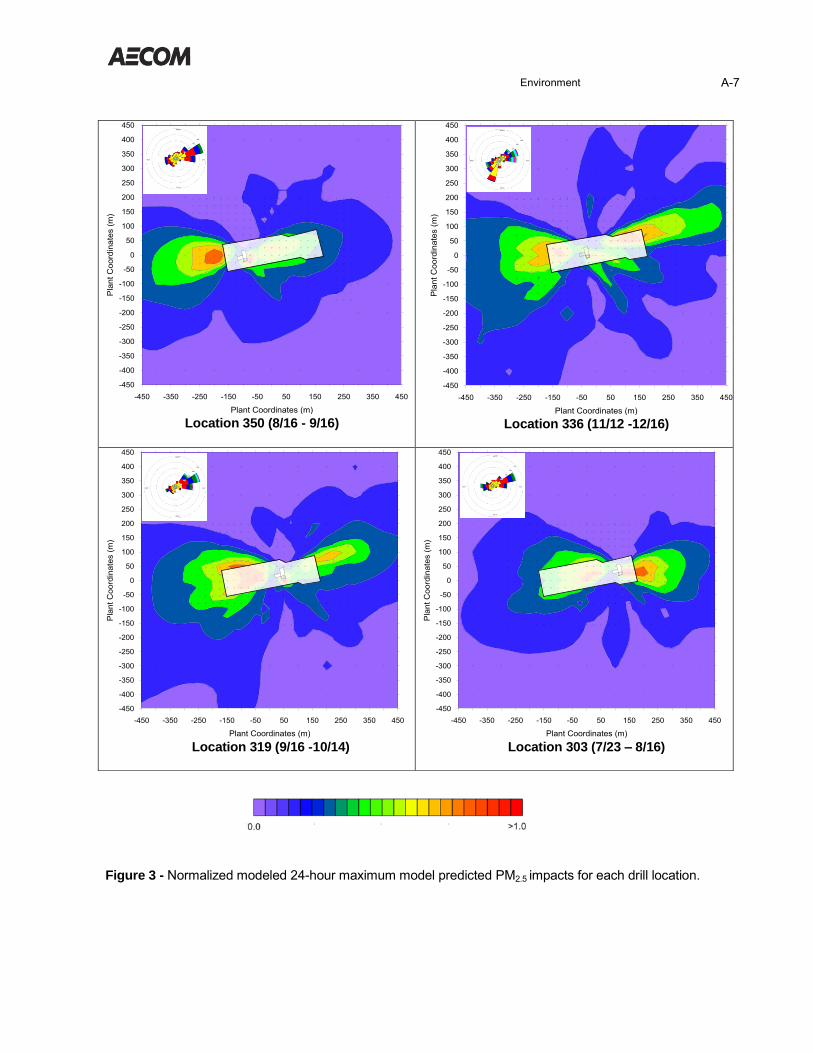
It was determined that the west area near the edge of the DS2N pad edge provided an ideal location for a site monitor based on 24-hour PM2.5 analysis shown in Figure 3 and is consistent with the current understanding of the persistence of prevailing winds.
The 1-hour NOx analysis also indicated that this vicinity was also a reasonable location. The actual area of highest NOx impacts was relative to the actual drilling location on the pad, and the highest impacts occurred just southeast of the rig. However, these high impacts are extremely infrequent and they likely correspond to rarely occurring or anomalous meteorological conditions. Therefore, these locations are considered less desirable for siting a monitoring station designed for measuring the highest probability of maximum impacts. A detailed analysis of the data used to arrive at these conclusions is found in the following subsections.
3.1 24-Hour PM2.5 Analysis
Four model runs were performed. Each run contained a single drill rig located at one of the planned drilling locations (only 350, 336, 319, and 303 were modeled). Location 337 is extremely close to Location 336 and they occur close together in time. Given the close proximity in space and time, modeling results for Location 336 can be used as a surrogate to Location 337 impacts. Therefore, modeling at only one location was considered and modeling occurred over the appropriate planned timeframe of drilling operations at both wells.
The maximum impacts at each receptor from across all 8-years were normalized and plotted. The results can be found in Figure 3. This analysis indicates that while the areas of maximum impacts are somewhat dependent on the drilling location, the westernmost edge of the well pad is a good general location for measuring consistent higher impacts, especially when considering predominant wind directions are out of the northeast. This is especially true when the rig is located on the western half of the pad.
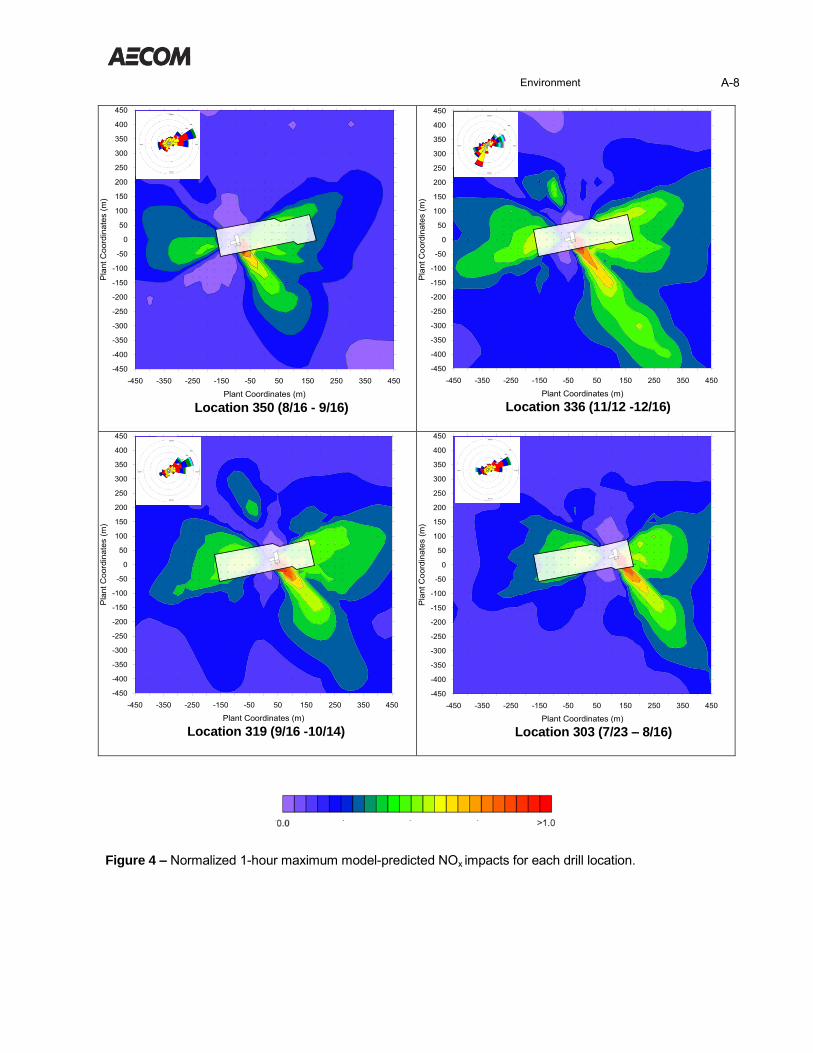
3.2 1-Hour NOx Analysis
Sets of model runs were performed using 8-years of meteorological data, each set with the drill rig located at a different location (well locations 350, 336, 319, and 303 were modeled). For each year and rig location, the maximum impact for each receptor was predicted. From this, the maximum impact from across all 8 years for each receptor and rig location was determined, normalized and contour plots were generated from this data set. The results can be found in Figure 4.
It should be noted that the differences in plume dispersion behavior from the 24-hour PM2.5 plots is mainly due to difference in averaging times. The 1-hour averaging time period is much more prone to short-term effects caused by building downwash and specific meteorological conditions. Thus, the 1-hour NOx results show areas of maximum impact different than the 24-hour PM2.5 results.
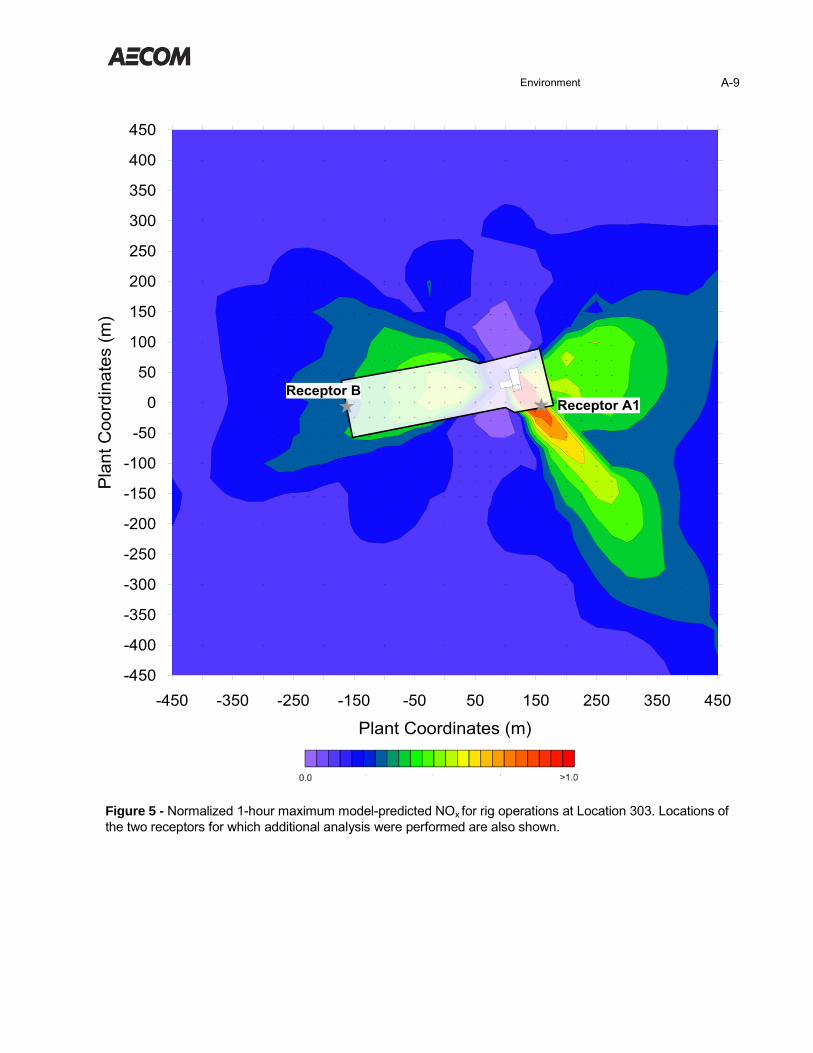
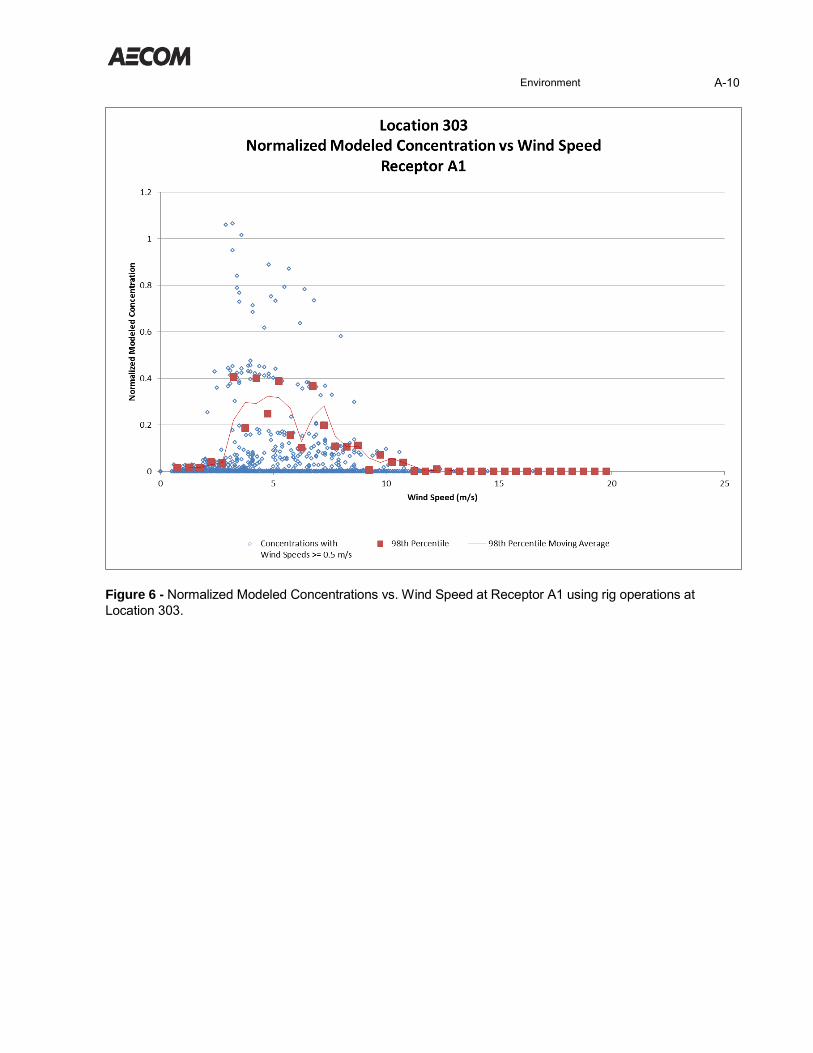
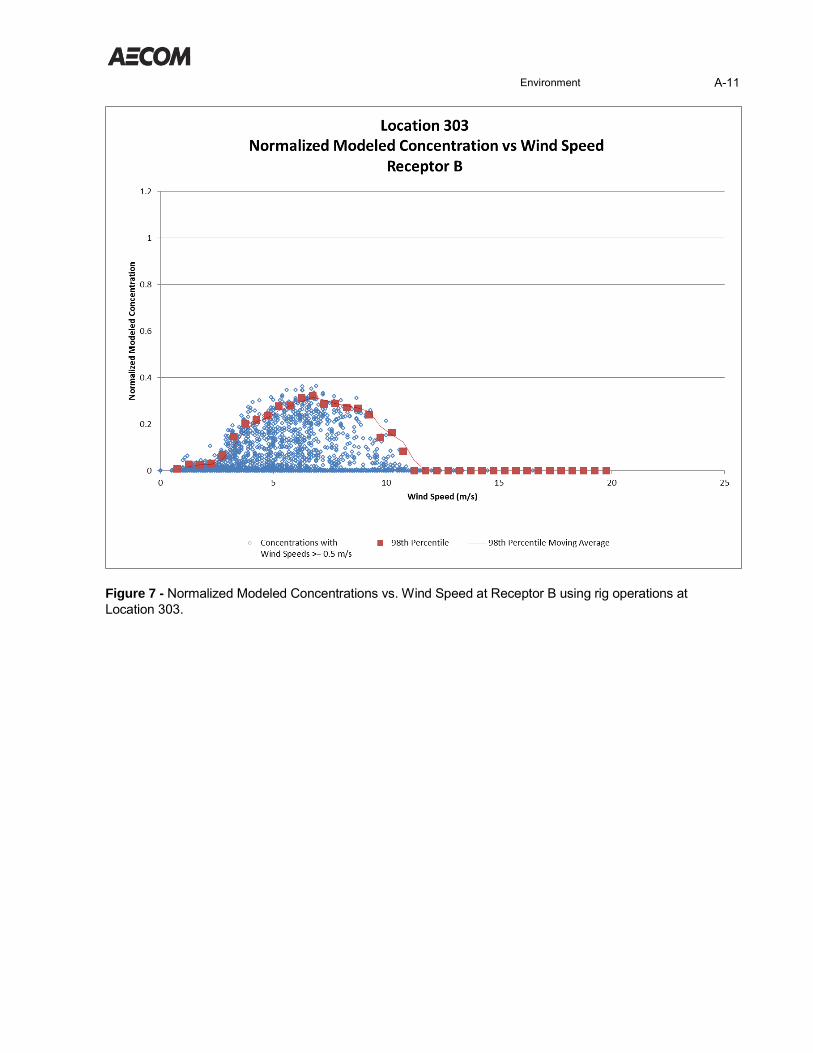
Note that the highest impacts always occur just to the southeast of the drill rig. Further investigation into these maximum impacts showed that while these impacts were the highest, they occur infrequently. To demonstrate the rarity of the modeled maximum impacts just southeast of the drill rig, hourly modeled concentrations were plotted against wind speeds at ground level at Receptors A1 and B at Location 303. Figure 5 shows the location of Receptors A1 and B relative to Location 303. Receptor A1 is located in the plume of maximum impacts associated with drilling operations at Location 303 and is at the pad edge. Receptor B is located on the western pad edge. The wind speed versus concentration plots can be found in Figure 6 and Figure 7. The 98
th percentile concentration trend line developed using 0.5 m/s wind direction bins is also overlaid on these
plots to highlight trends of maximum impacts with wind speeds.
Note the overall infrequency of the high impacts at Receptor A1 (Figure 6). The infrequency of highest impacts is most likely due to the low frequency of winds from these wind directions (see associated wind rose). Thus, the likelihood of a site monitor capturing such high impacts is small. In addition, this area of maximum impacts is small and highly dependent on a precise rig/monitoring location relationship. Each rig location operation has a small area of high maximum impacts to their southeast (see Figure 4) and high impacts in these vicinities are all likely very similar to the high impacts found in Figures 5-7. This indicates that
Environment A-4
placing a site monitor at such maximum impact locations would require the site monitor to be moved each time the drill rig moved.
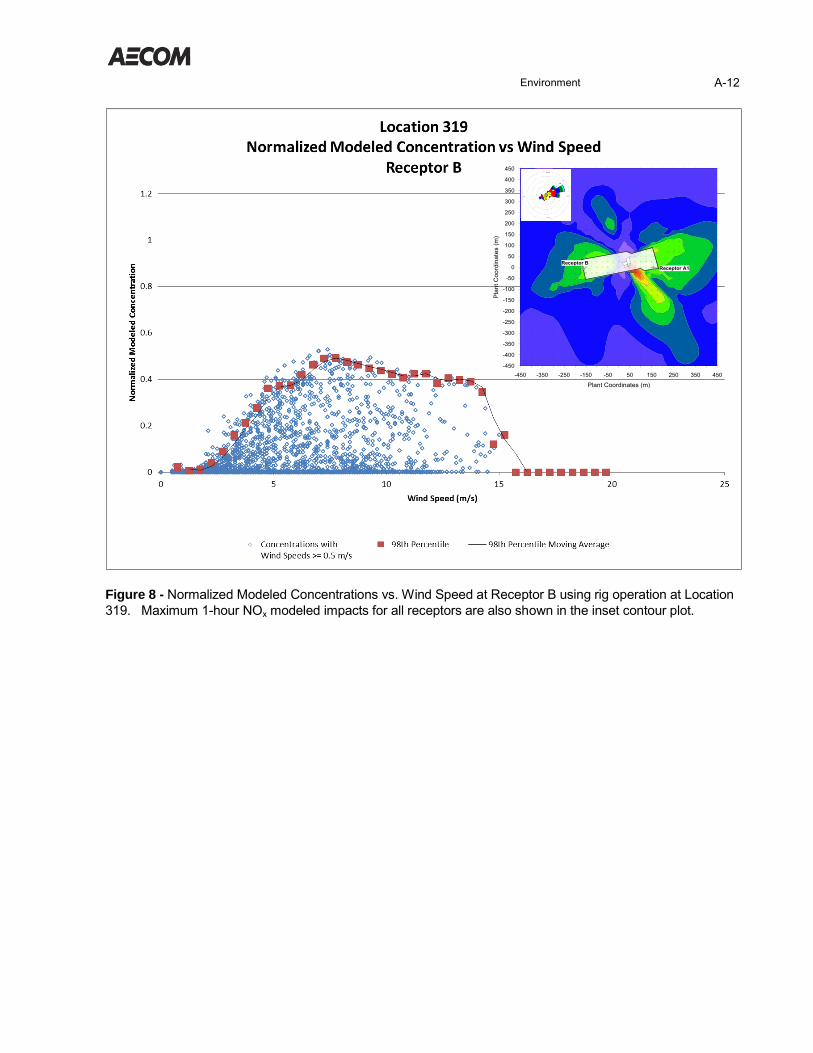
For receptor B (Figure 7) during Location 303 rig operations, high impacts are predicted consistently and occur over a wider variety of wind speeds than impacts at Receptor A1. Modeled impacts at Receptor B during rig operations at two other locations were also analyzed and similar results emerged (see Figures 8 & 9). Thus, similar conclusions can be made at these locations.
Since the objective of the monitoring program is to maximize the number of hours that high concentrations are measured without misrepresenting the magnitude of the maximums, it is important to site the monitor in an area where it is likely to capture high impacts over a broad range of wind speeds and conditions rather than base it on a few maximum AERMOD modeled impacts that are just as likely the result of poor model performance and infrequent meteorological input conditions, or both. When compared with maximum impact locations just southeast of the rig, the western pad edge would be the most reasonable spot for a monitoring location based on a high probability of measuring high 1-hour NOx impacts.
4.0 Recommendations
The conclusions of the AERMOD dispersion analysis for both the 24-hour PM2.5 and 1-hour NOx averaging periods/pollutant support the siting of the monitoring station on the west pad boundary.

Environment A-5
Figure 1 - Modeled well locations, receptor grid, and planned dates of operation at each well location.
Well Location Associated Dates of Rig Operation2N-303A (“Location 303”) 7/23/2014-8/16/2014
2N-350A (“Location 350”) 8/16/2014-9/16/2014
2N-319A (“Location 319”) 9/16/2014-10/14/2014
2N-337C (“Location 337”) 10/14/2014-11/12/2014
2N-336 (“Location 336”) 11/12/2014-12/16/2014
Environment A-6
Location 303 (7/23 – 8/16) Location 350 (8/16 – 9/16)
Location 319 (9/16 – 10/14) Location 337 (10/14 – 11/12)
Location 336 (11/12 – 12/16)
Figure 2 - Wind Roses for the timeframes associated with each of the scheduled drill rig operations. Each
wind rose utilized eight years of meteorological data for the planned timeframe of the rig operation.
Environment A-7
Figure 3 - Normalized modeled 24-hour maximum model predicted PM2.5 impacts for each drill location.
Location 350 (8/16 - 9/16) Location 336 (11/12 -12/16)
Location 319 (9/16 -10/14) Location 303 (7/23 – 8/16)
Environment A-8
Location 350 (8/16 - 9/16) Location 336 (11/12 -12/16)
Location 319 (9/16 -10/14) Location 303 (7/23 – 8/16)
Figure 4 – Normalized 1-hour maximum model-predicted NOx impacts for each drill location.
Environment A-9
Figure 5 - Normalized 1-hour maximum model-predicted NOx for rig operations at Location 303. Locations of
the two receptors for which additional analysis were performed are also shown.
Environment A-10
Figure 6 - Normalized Modeled Concentrations vs. Wind Speed at Receptor A1 using rig operations at
Location 303.
Environment A-11
Figure 7 - Normalized Modeled Concentrations vs. Wind Speed at Receptor B using rig operations at
Location 303.
Environment A-12
Figure 8 - Normalized Modeled Concentrations vs. Wind Speed at Receptor B using rig operation at Location
319. Maximum 1-hour NOx modeled impacts for all receptors are also shown in the inset contour plot.

Environment A-13
Figure 9 - Normalized Modeled Concentrations vs Wind Speed at Receptor B using rig operations at
Location 336. Maximum 1-hour NOx modeled impacts for all receptors are also shown in the inset contour plot.
Alaska Field Study Design:
Drill Rig 1-Hour NO2 Collaborative Study Monitoring Plan
August 2014 Page 1 Attachment E
Attachment E Quality Assurance Criteria
E1 Ambient Air Quality Station Quality Assurance
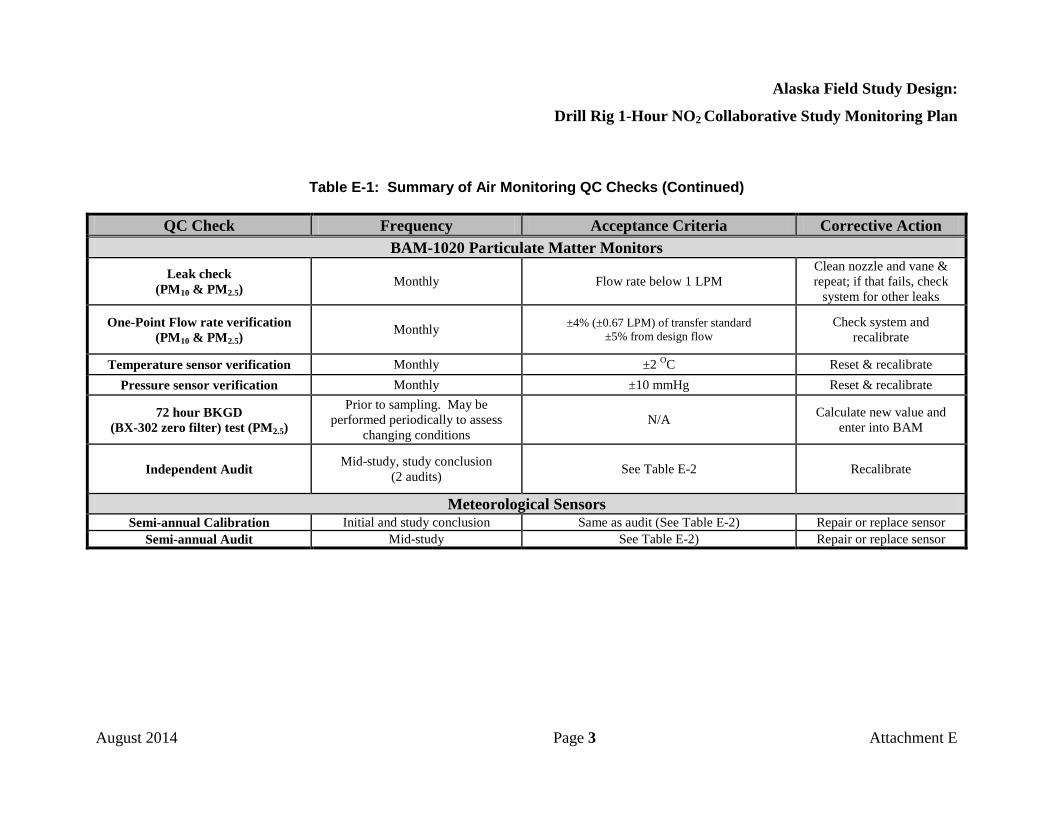
Quality Assurance/Quality Control (QA/QC) procedures are implemented for this project to ensure that the collected ambient air and meteorological data meet standards of reliability and accuracy. Quality control for this project will follow EPA PSD monitoring requirements presented in Meteorological Monitoring Guidance for Regulatory Modeling Applications (EPA-454/R-99-005), Ambient Monitoring Guidelines for Prevention of Significant Deterioration (PSD) (EPA 450/4-87-007), and 40 CFR Parts 50 and 58. Quality control (QC) procedures will include visual inspections and “spot-checks” or meteorological instrument; multi-point calibrations, “Level 1” zero/span checks, and precision checks of the continuous gas analyzers; and leak, temperature, barometric pressure and flow rate checks of the PM10 and PM2.5 monitors. Audit of equipment performance by an independent third-party auditor will also be included. All analyzers and monitoring equipment will be acquired from manufacturers whose equipment meet EPA ambient air and meteorological monitoring guidelines, and will be certified by the operator and auditor over the operating range for the expected conditions at each station. Table E-1 summarizes the QC checks that will be conducted as part of the program. This summary includes the frequency of QC checks, the acceptance criteria for the QC checks, and corrective actions to be performed if the QC checks fail the acceptance test.

Alaska Field Study Design:
Drill Rig 1-Hour NO2 Collaborative Study Monitoring Plan
August 2014 Page 2 Attachment E
Table E-1: Summary of Air Monitoring QC Checks
QC Check Frequency Acceptance Criteria Corrective Action Gas Analyzers
Multi-point calibration When installed, repaired, and approximately every three (3) months throughout the study including at study conclusion
±2% of full scale best fit straight line Recalibrate
Level 1 zero/span calibration At least weekly
(Automated daily zero / span
checks are planned)
Zero Drift (24 hour / 14 day): NO2: ≤ 3 ppb / ≤ 5 ppb
CO: ≤ 0.4 ppm / ≤ 0.6 ppm SO2: ≤ 3 ppb / ≤ 5 ppb O3: ≤ 0.003 ppm / ≤ 0.005 ppm ±10% of span true value (NO2, CO, SO2)
±7% of span true value (O3)
Recalibrate
NO2 converter efficiency When installed, repaired, at least every two weeks, with Multi-point
calibrations and semi-annually >96% Replace converter
Precision Check At least every two weeks ±10% (NO2, SO2 & CO) ±7% (O3)
Recalibrate
Flow Calibration (calibrator MFC’s) Quarterly ±2% of traceable flow standard Recalibrate
Independent Audit Mid-study, study conclusion (2 audits) See Table E-2 Recalibrate
Alaska Field Study Design:
Drill Rig 1-Hour NO2 Collaborative Study Monitoring Plan
August 2014 Page 3 Attachment E
Table E-1: Summary of Air Monitoring QC Checks (Continued)
QC Check Frequency Acceptance Criteria Corrective Action BAM-1020 Particulate Matter Monitors
Leak check (PM10 & PM2.5)
Monthly Flow rate below 1 LPM Clean nozzle and vane & repeat; if that fails, check
system for other leaks
One-Point Flow rate verification (PM10 & PM2.5)
Monthly ±4% (±0.67 LPM) of transfer standard ±5% from design flow
Check system and recalibrate
Temperature sensor verification Monthly ±2 OC Reset & recalibrate Pressure sensor verification Monthly ±10 mmHg Reset & recalibrate
72 hour BKGD (BX-302 zero filter) test (PM2.5)
Prior to sampling. May be performed periodically to assess
changing conditions N/A Calculate new value and
enter into BAM
Independent Audit Mid-study, study conclusion (2 audits) See Table E-2 Recalibrate
Meteorological Sensors Semi-annual Calibration Initial and study conclusion Same as audit (See Table E-2) Repair or replace sensor
Semi-annual Audit Mid-study See Table E-2) Repair or replace sensor
Alaska Field Study Design:
Drill Rig 1-Hour NO2 Collaborative Study Monitoring Plan
August 2014 Page 4 Attachment E
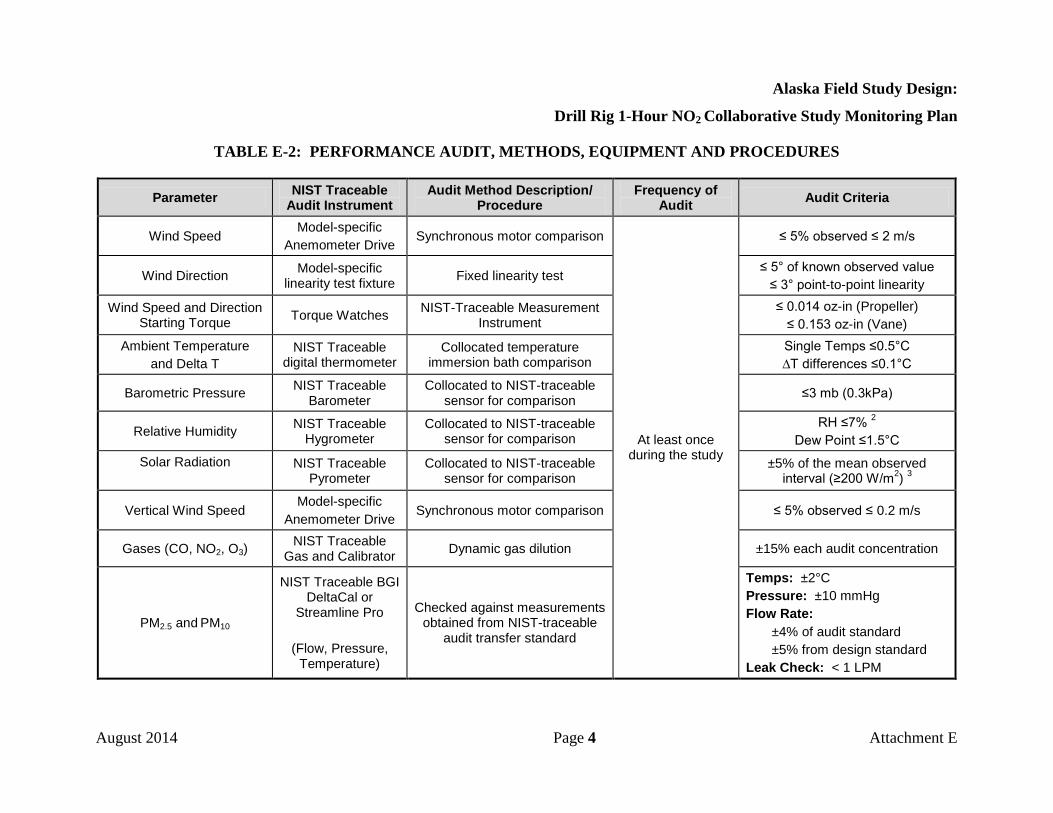
TABLE E-2: PERFORMANCE AUDIT, METHODS, EQUIPMENT AND PROCEDURES
Parameter NIST Traceable Audit Instrument
Audit Method Description/ Procedure
Frequency of Audit Audit Criteria
Wind Speed Model-specific
Anemometer Drive Synchronous motor comparison
At least once during the study
≤ 5% observed ≤ 2 m/s
Wind Direction Model-specific linearity test fixture Fixed linearity test
≤ 5° of known observed value ≤ 3° point-to-point linearity
Wind Speed and Direction Starting Torque Torque Watches NIST-Traceable Measurement
Instrument ≤ 0.014 oz-in (Propeller)
≤ 0.153 oz-in (Vane) Ambient Temperature
and Delta T NIST Traceable
digital thermometer Collocated temperature
immersion bath comparison Single Temps ≤0.5°C ∆T differences ≤0.1°C
Barometric Pressure NIST Traceable Barometer
Collocated to NIST-traceable sensor for comparison ≤3 mb (0.3kPa)
Relative Humidity NIST Traceable Hygrometer
Collocated to NIST-traceable sensor for comparison
RH ≤7% 2 Dew Point ≤1.5°C
Solar Radiation
NIST Traceable Pyrometer
Collocated to NIST-traceable sensor for comparison
±5% of the mean observed interval (≥200 W/m2) 3
Vertical Wind Speed Model-specific
Anemometer Drive Synchronous motor comparison ≤ 5% observed ≤ 0.2 m/s
Gases (CO, NO2, O3) NIST Traceable
Gas and Calibrator Dynamic gas dilution ±15% each audit concentration
PM2.5 and PM10
NIST Traceable BGI DeltaCal or
Streamline Pro
(Flow, Pressure, Temperature)
Checked against measurements obtained from NIST-traceable
audit transfer standard
Temps: ±2°C Pressure: ±10 mmHg Flow Rate: ±4% of audit standard ±5% from design standard Leak Check: < 1 LPM

Alaska Field Study Design:
Drill Rig 1-Hour NO2 Collaborative Study Monitoring Plan
August 2014 Page 5 Attachment E
E2 Upwind Ozone Station Quality Assurance
Quality Assurance/Quality Control (QA/QC) procedures are implemented for this project to ensure that the collected ozone meet standards of reliability and accuracy. Quality control for the will follow National Park Service ozone monitoring protocol presented in Ozone Monitoring Protocol for the National Park Service, June 2004 (NPS D-1654).
Initial multi-point calibration, study startup calibration verification, and study completion calibration verification will utilize the same acceptance criteria as specified for ozone in Table E-1. Independent audit of the upwind ozone sampler will be conducted mid-way during the study and at the study conclusion on similar schedule to the ambient air quality station audits. Audit criteria specified for ozone in Table E-2 will also be used for the upwind ozone sampler.
E3 Continuous Emission Monitoring System (CEMS) Quality Assurance
Quality Assurance/Quality Control (QA/QC) procedures are implemented for this project to ensure that the collected NO/NOx/NO2 and oxygen data meet standards of reliability and accuracy. Quality control for this project will follow the criteria specified in Table E-3. Instrument linearity checks will be performed at the beginning of the sampling program and at approximately three month intervals thereafter including a final check at the conclusion of the study. Calibration gases at the low (20% – 30% of instrument span), mid- (50% – 60% of instrument span), and high-range (80% - 100% of instrument span) concentrations) of instrument operations will be used to validate instrument performance. Linearity checks are acceptable for monitor certifications if none of the test results exceed or deviate from the reference value by more than 5.0 percent.

Alaska Field Study Design:
Drill Rig 1-Hour NO2 Collaborative Study Monitoring Plan
August 2014 Page 6 Attachment E
TABLE E-3: CALIBRATION ERROR CRITERIA
Parameter Criteria Action Required
Zero (low-level) Calibration Error (CE)
CE < ± 2.5% of instrument span from zero calibration value. NOx < ± 12.5 ppm)
None
CE > ± 2.5% of instrument span from zero calibration value, but < ± 5.0% of instrument span from zero calibration value. (NOx > ± 12.5 ppm and < ± 25 ppm)
Check analyzer system operation and verify calibration gas supply. Manually initiate calibration and verify analyzer zero response. It is recommended that the analyzer response be adjusted to match input concentration. Record any adjustments made in the CEMS log.
CE > ± 5.0% of instrument span from zero calibration value. (NOx > ± 25 ppm)
Analyzer out-of-control. Out-of-control begins at the completion of a daily calibration error check that exceeds ± 5.0% of the span of the instrument. Troubleshoot, repair and adjust analyzer. Perform calibration error check. Out-of-control period ends when a successful calibration has been completed. Record any adjustments or maintenance in CEMS log.
Span (high-level) CE CE < ± 2.5% of instrument span from high-level calibration value. (NOx < ± 12.5 ppm)
None
CE > ± 2.5% of instrument span from high-level calibration value, but < ± 5.0% of instrument span from high calibration value. (NOx > ± 12.5 ppm and < ± 25 ppm)
Check analyzer system operation and verify calibration gas supply. Manually initiate calibration and verify analyzer span response. It is recommended that the analyzer response be adjusted to match input concentration. Record any adjustments made in the CEMS log.
CE > ± 5.0% of instrument span from high-level calibration value. (NOx > ± 25 ppm)
Analyzer out-of-control. Out-of-control begins at the completion of a daily calibration error check that exceeds ± 5.0% of the span of the instrument. Troubleshoot, repair and adjust analyzer. Perform calibration error check. Out-of-control period ends when a successful calibration has been completed. Record any adjustments or maintenance in CEMS log.
Alaska Field Study Design:
Drill Rig 1-Hour NO2 Collaborative Study Monitoring Plan
August 2014 Page 1 Attachment F
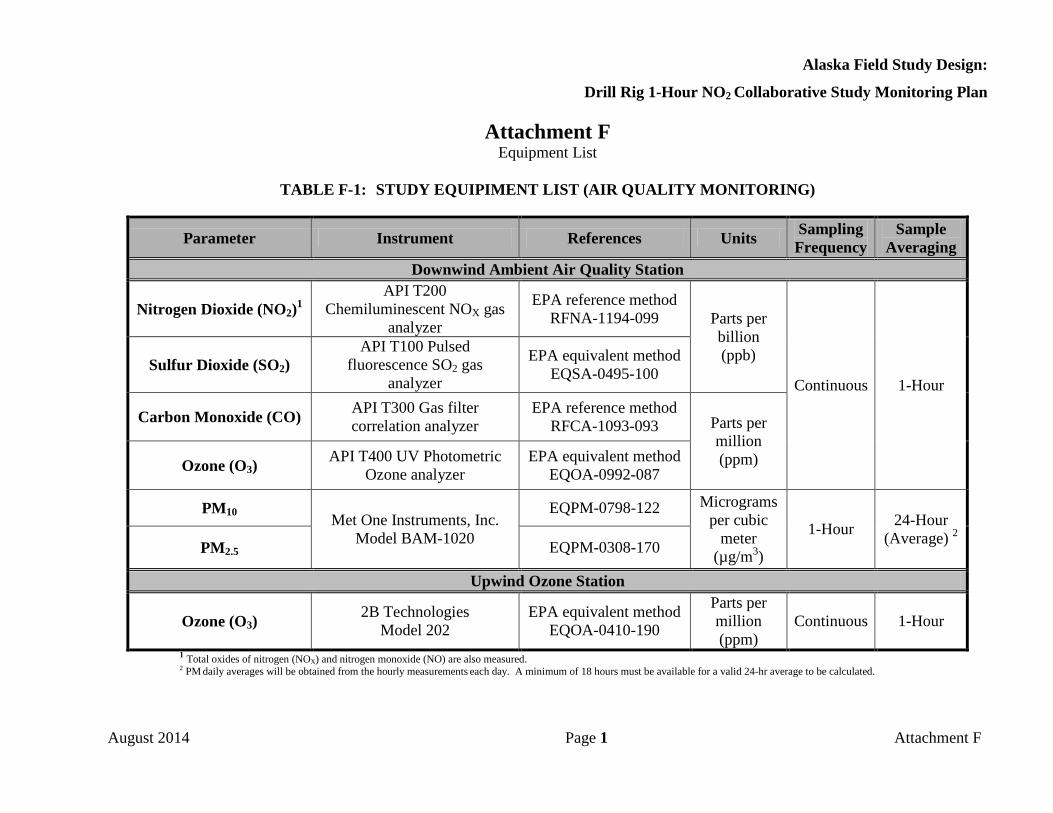
Attachment F Equipment List
TABLE F-1: STUDY EQUIPIMENT LIST (AIR QUALITY MONITORING)
Parameter Instrument References Units Sampling Frequency
Sample Averaging
Downwind Ambient Air Quality Station
Nitrogen Dioxide (NO2)1 API T200
Chemiluminescent NOX gas analyzer
EPA reference method RFNA-1194-099 Parts per
billion (ppb)
Continuous 1-Hour Sulfur Dioxide (SO2)
API T100 Pulsed fluorescence SO2 gas
analyzer
EPA equivalent method EQSA-0495-100
Carbon Monoxide (CO) API T300 Gas filter correlation analyzer
EPA reference method RFCA-1093-093 Parts per
million (ppm) Ozone (O3)
API T400 UV Photometric Ozone analyzer
EPA equivalent method EQOA-0992-087
PM10 Met One Instruments, Inc. Model BAM-1020
EQPM-0798-122 Micrograms per cubic
meter (µg/m3)
1-Hour 24-Hour (Average) 2 PM2.5 EQPM-0308-170
Upwind Ozone Station
Ozone (O3) 2B Technologies
Model 202 EPA equivalent method
EQOA-0410-190
Parts per million (ppm)
Continuous 1-Hour
1 Total oxides of nitrogen (NOX) and nitrogen monoxide (NO) are also measured. 2 PM daily averages will be obtained from the hourly measurements each day. A minimum of 18 hours must be available for a valid 24-hr average to be calculated.
Alaska Field Study Design:
Drill Rig 1-Hour NO2 Collaborative Study Monitoring Plan
August 2014 Page 2 Attachment F
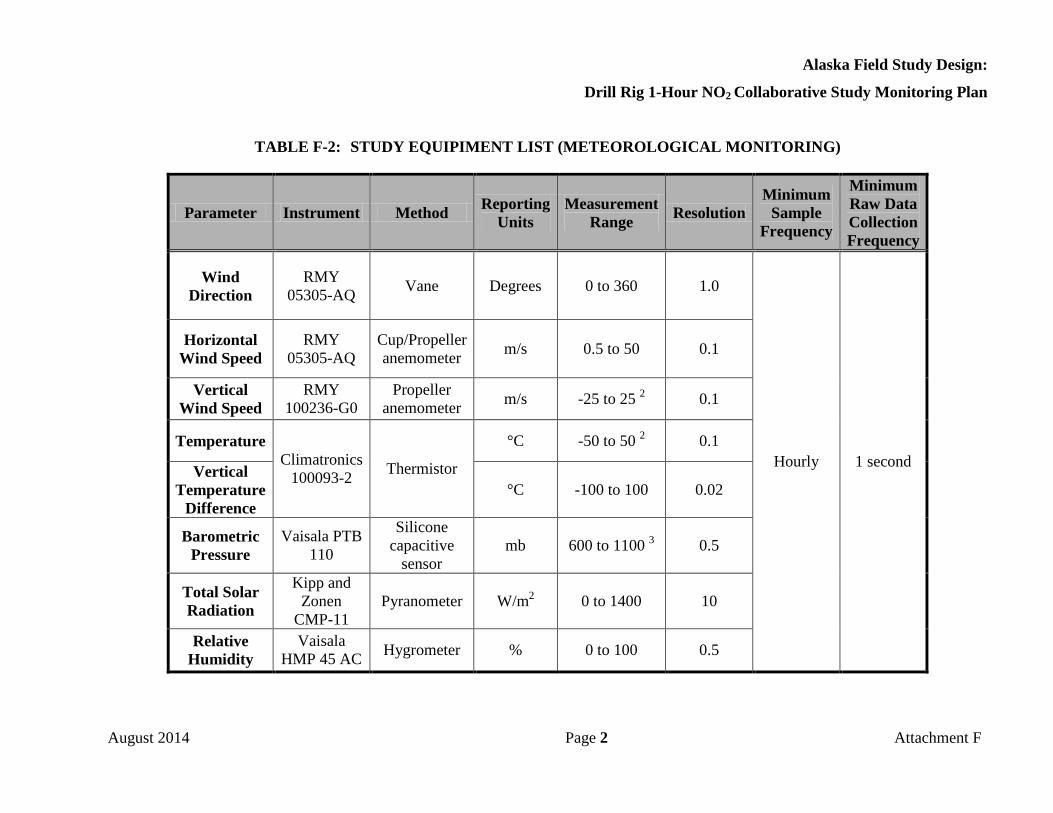
TABLE F-2: STUDY EQUIPIMENT LIST (METEOROLOGICAL MONITORING)
Parameter Instrument Method Reporting Units
Measurement Range Resolution
Minimum Sample
Frequency
Minimum Raw Data Collection Frequency
Wind Direction
RMY 05305-AQ Vane Degrees 0 to 360 1.0
Hourly 1 second
Horizontal Wind Speed
RMY 05305-AQ
Cup/Propeller anemometer m/s 0.5 to 50 0.1
Vertical Wind Speed
RMY 100236-G0
Propeller anemometer m/s -25 to 25 2 0.1
Temperature Climatronics
100093-2 Thermistor
°C -50 to 50 2 0.1
Vertical Temperature
Difference °C -100 to 100 0.02
Barometric Pressure
Vaisala PTB 110
Silicone capacitive
sensor mb 600 to 1100 3 0.5
Total Solar Radiation
Kipp and Zonen
CMP-11 Pyranometer W/m2 0 to 1400 10
Relative Humidity
Vaisala HMP 45 AC Hygrometer % 0 to 100 0.5

Alaska Field Study Design:
Drill Rig 1-Hour NO2 Collaborative Study Monitoring Plan
August 2014 Page 3 Attachment F
TABLE F-3: STUDY EQUIPIMENT LIST (DRILL RIG MONITORING)
NO/NOx/NO2/O2 Fuel Usage Monitoring
Manufacturer TEI
TBD
Model 42IH
Measurement Range 0 - 500 ppm dry
Zero Stability ± 50 ppb
Linearity < ± 1% full scale
Repeatability < ± 1% full scale
Accuracy < ± 1% full scale
Analog Output 4 to 20 mA
Temperature Drift NA
Zero Drift (24 hrs) ± 50 ppb
Span Drift (24 hrs) < ± 1% full scale