conrad n. hilton college of hotel and restaurant
TRANSCRIPT
CONRAD N. HILTON COLLEGE OF HOTEL AND RESTAURANT MANAGEMENTUNIVERSITY OF HOUSTON
Hospitality Business Review2002
VOLUME 4, NUMBER 1
“Learning From Leadership”
25THE STATE OF THE TRAVEL INDUSTRYAFTER SEPTEMBER 11
WILLIAM S. NORMANPresident and Chief Executive Officer,Travel Industry Association of America
28PAUL J. BROWNAssociate Principal,McKinsey & CompanyKEVIN STANGEConsultant,McKinsey & Company
INVESTMENT IN INFORMATION TECHNOLOGY:THE MULTI-BILLION DOLLAR GAME OF CHANCE
39CARLY FIORINAChairman and Chief Executive Officer,Hewlett-Packard Company
TECHNOLOGY, BUSINESS, ANDOUR WAY OF LIFE: WHAT’S NEXT?
47RONALD A. NYKIELChairman,Hospitality Industry Hall of Honor
THE BEAN COUNTER MENTALITY: MISSINGTHE REVENUE AND LOSING THE CUSTOMER
54THOMAS W. LATTINManaging Director,PKF Capital Markets Group
INVESTING MONEY IN HOTELS:IS THE TIMING RIGHT?
3DAVID NADLERChairman, Mercer Delta ConsultingROGER KENNYManaging Partner,Boardroom Consultants
FROM THE BOARDROOMCEO FAILURE: PREVENTIONAND INTERVENTION
12PHIL CONDITChairman and Chief Executive Officer,The Boeing Company
PHILOSOPHIESFOREVER NEW FRONTIERS
17COLIN L. POWELLSecretary of State
LEADERSHIPEIGHTEEN LESSONS FROM A VERYSUCCESSFUL LEADER
57PROFILESSTEVE ANDERSON & JOSEPH A. MCINERNEY
HOSPITALITY BUSINESS REVIEW Volume 4, Number 128
Investment inInformation Technology:The Multi-Billion Dollar
Game of Chanceby Paul J. Brown
Associate Principal, McKinsey & Company, Inc.-Atlanta&
Kevin StangeConsultant, McKinsey & Company, Inc.-San Francisco
They invest billions in information technology,but are hotels getting a return on their investment?
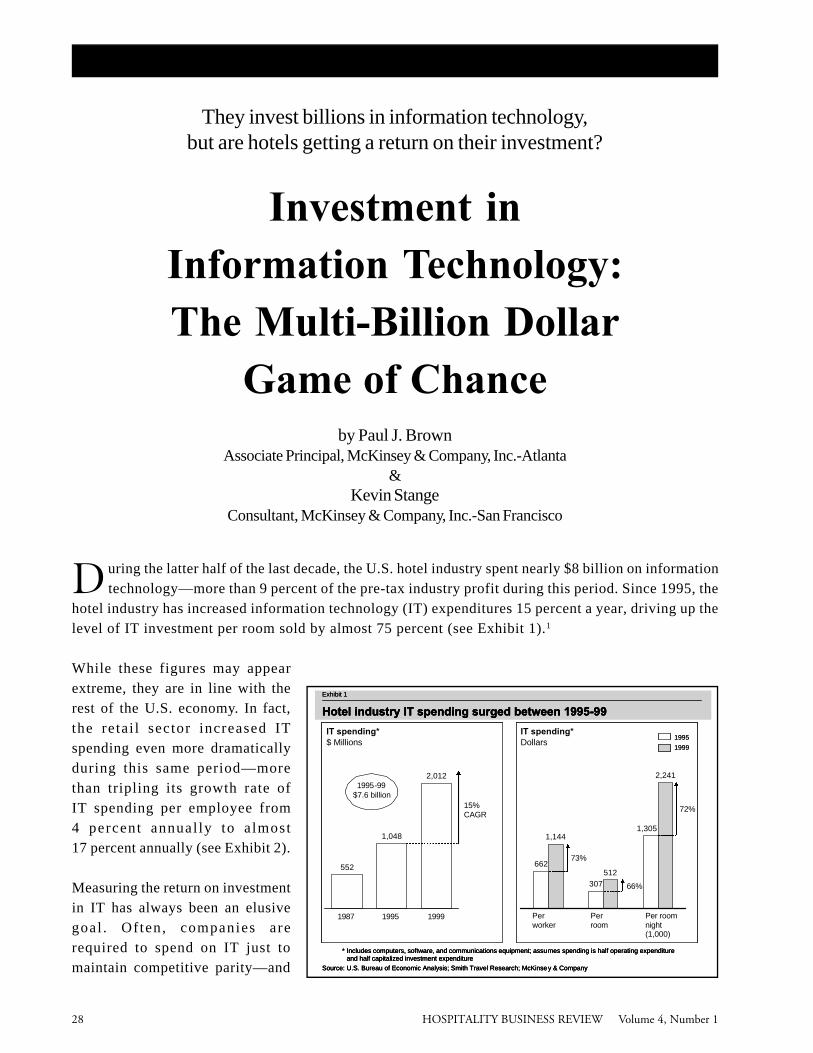
D uring the latter half of the last decade, the U.S. hotel industry spent nearly $8 billion on informationtechnology—more than 9 percent of the pre-tax industry profit during this period. Since 1995, the
hotel industry has increased information technology (IT) expenditures 15 percent a year, driving up thelevel of IT investment per room sold by almost 75 percent (see Exhibit 1).1
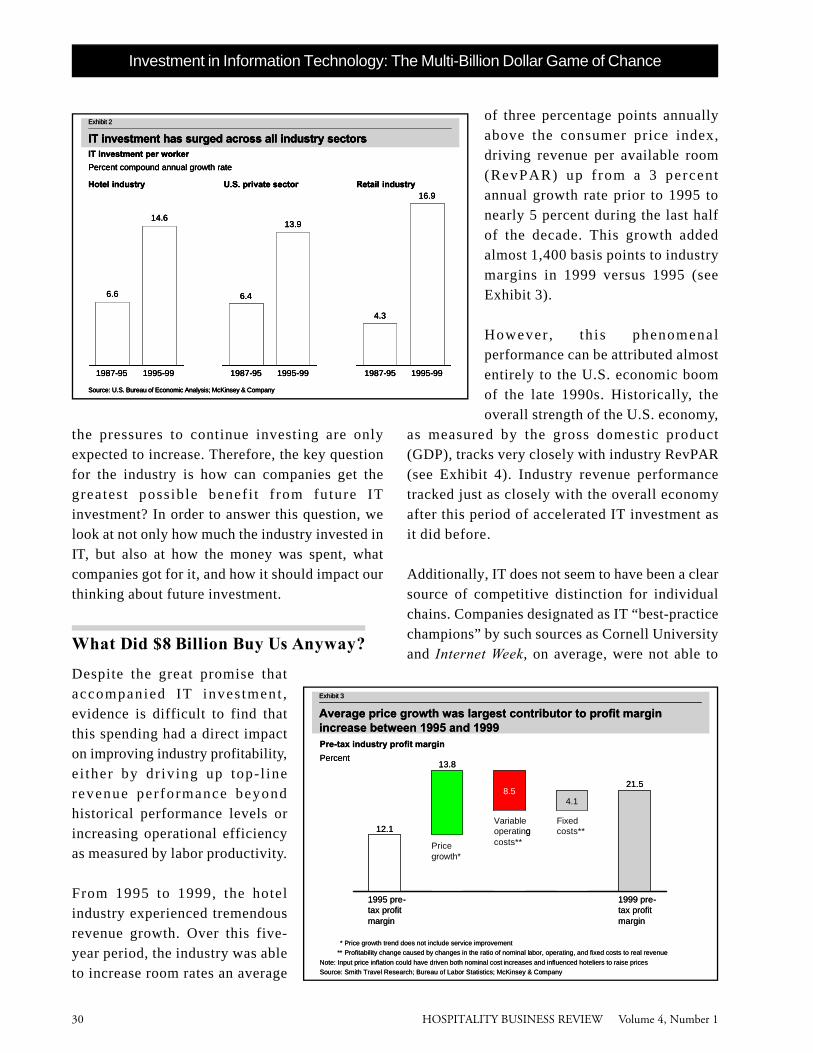
While these figures may appearextreme, they are in line with therest of the U.S. economy. In fact,the retai l sector increased ITspending even more dramaticallyduring this same period—morethan tripling its growth rate ofIT spending per employee from4 percent annual ly to a lmost17 percent annually (see Exhibit 2).
Measuring the return on investmentin IT has always been an elusivegoal . Often, companies arerequired to spend on IT just tomaintain competitive parity—and
552
1,048
2,012
1987
IT spending*$ Millions
* Includes computers, software, and communications equipment; assumes spending is half operating expenditure and half capitalized investment expenditure
Source: U.S. Bureau of Economic Analysis; Smith Travel Research; McKinsey & Company
1995 1999
IT spending*Dollars
1995-99$7.6 billion
1995
1999
662
307512
2,241
1,3051,144
Per worker
Per room
Per room night (1,000)
73%
66%
72%15% CAGR
Hotel industry IT spending surged between 1995-99
Exhibit 1
552
1,048
2,012
1987
IT spending*$ Millions
* Includes computers, software, and communications equipment; assumes spending is half operating expenditure and half capitalized investment expenditure
Source: U.S. Bureau of Economic Analysis; Smith Travel Research; McKinsey & Company
1995 1999
IT spending*Dollars
1995-99$7.6 billion
1995
1999
662
307512
2,241
1,3051,144
Per worker
Per room
Per room night (1,000)
73%
66%
72%15% CAGR
Hotel industry IT spending surged between 1995-99
552
1,048
2,012
1987
IT spending*$ Millions
* Includes computers, software, and communications equipment; assumes spending is half operating expenditure and half capitalized investment expenditure
Source: U.S. Bureau of Economic Analysis; Smith Travel Research; McKinsey & Company
1995 1999
IT spending*Dollars
1995-99$7.6 billion
1995
1999
1995
1999
662
307512
2,241
1,3051,144
Per worker
Per room
Per room night (1,000)
73%
66%
72%15% CAGR
Hotel industry IT spending surged between 1995-99
Exhibit 1
HOSPITALITY BUSINESS REVIEW Volume 4, Number 1 29
Investment in Information Technology: The Multi-Billion Dollar Game of Chance
Paul J. Brown is an associate principal in the Atlanta office of McKinsey &
Company, Inc. Mr. Brown is a leader of the firm’s Global Travel and Logistics
Practice Group and a member of its Retail and Hospitality Practice Group
core team.
McKinsey & Company is a global management consulting firm with wide
experience and expertise in the travel and hospitality industry. McKinsey
focuses, in particular, on travel and hospitality questions related to strategy
and growth, organization, operations, finance, and information technology.
Before joining McKinsey, Mr. Brown served as senior vice president of Strategic Services and vice
president of Strategic Planning with Six Continents Hotels, parent company of Holiday Inn, Holiday
Inn Express, Crowne Plaza, and Inter-Continental Hotels and Resorts. As senior vice president, Paul
was responsible for managing the shared services functions across all brands and global regions.
Functional areas under his management included central reservations, loyalty programs, global sales,
electronic commerce, and strategic alliances.
In his consulting career, Mr. Brown has focused on developing strategies for profitability and growth
across all sectors of the travel and hospitality industry, including hotels, airlines, GDSs and travel
agencies. In the hospitality sector, Mr. Brown has advised companies on such issues as international
expansion, post-merger integration, customer segmentation and branding, customer relationship
management, and sales and distribution strategy.
Mr. Brown holds both an M.B.A. from the Kellogg Graduate School of Management and an M.S. in
engineering management from the McCormick School of Engineering and Applied Science at
Northwestern University, as well as a B.S. in management from Georgia Tech.
Kevin M. Stange is a consultant in the San Francisco office of McKinsey &
Company, Inc. Mr. Stange has served as a member of the firm’s internal business
and economic think tank, the McKinsey Global Institute.
While with the McKinsey Global Institute, Mr. Stange studied information
technology and labor productivity in the U.S. economy, focusing on the U.S.
hotel industry. Through McKinsey, Mr. Stange has consulted for clients in a
diverse set of industries on such issues as investment strategy, business building,
supply chain redesign, and sales force turnaround.
Mr. Stange holds a B.S. in economics and a B.S. in mechanical engineering from the Massachusetts
Institute of Technology.
HOSPITALITY BUSINESS REVIEW Volume 4, Number 130
Investment in Information Technology: The Multi-Billion Dollar Game of Chance
the pressures to continue investing are onlyexpected to increase. Therefore, the key questionfor the industry is how can companies get thegreates t possible benef i t f rom future ITinvestment? In order to answer this question, welook at not only how much the industry invested inIT, but also at how the money was spent, whatcompanies got for it, and how it should impact ourthinking about future investment.
What Did $8 Billion Buy Us Anyway?
Despite the great promise thataccompanied IT inves tment ,evidence is difficult to find thatthis spending had a direct impacton improving industry profitability,e i ther by dr iving up top- l inerevenue per formance beyondhistorical performance levels orincreasing operational efficiencyas measured by labor productivity.
From 1995 to 1999, the hotelindustry experienced tremendousrevenue growth. Over this five-year period, the industry was ableto increase room rates an average
of three percentage points annuallyabove the consumer price index,driving revenue per available room(RevPAR) up f rom a 3 percentannual growth rate prior to 1995 tonearly 5 percent during the last halfof the decade. This growth addedalmost 1,400 basis points to industrymargins in 1999 versus 1995 (seeExhibit 3).
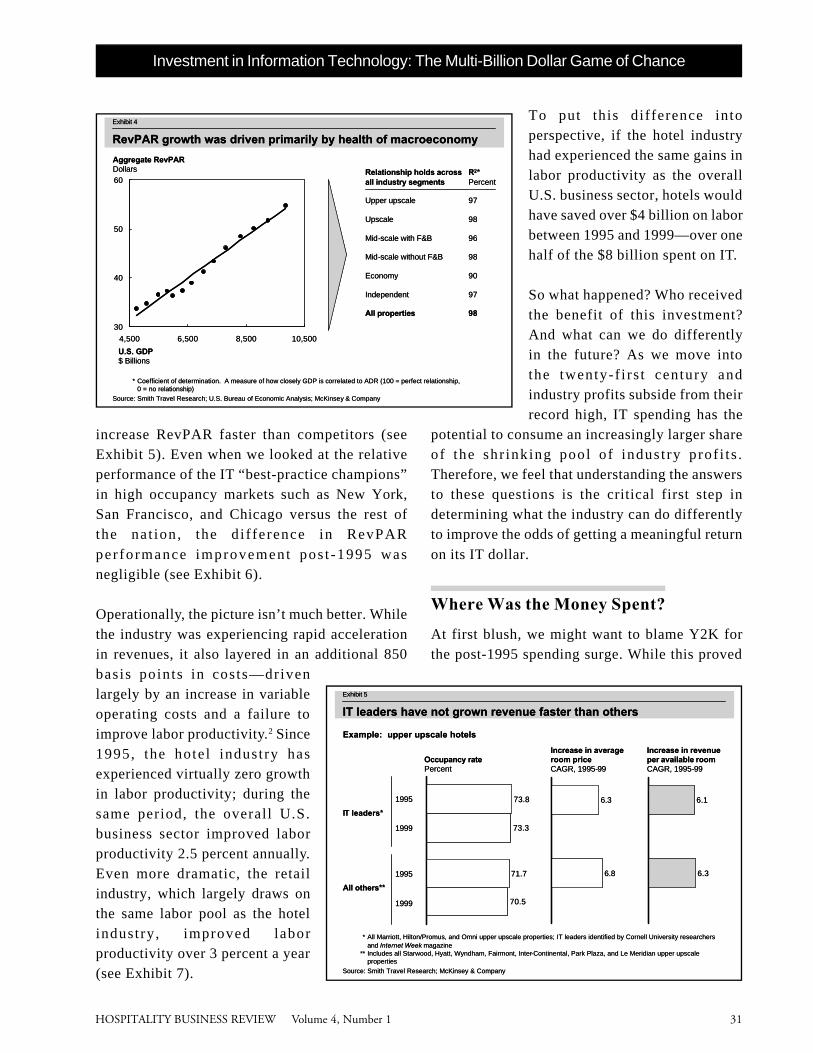
However , th is phenomenalperformance can be attributed almostentirely to the U.S. economic boomof the late 1990s. Historically, theoverall strength of the U.S. economy,
as measured by the gross domestic product(GDP), tracks very closely with industry RevPAR(see Exhibit 4). Industry revenue performancetracked just as closely with the overall economyafter this period of accelerated IT investment asit did before.
Additionally, IT does not seem to have been a clearsource of competitive distinction for individualchains. Companies designated as IT “best-practicechampions” by such sources as Cornell Universityand Internet Week, on average, were not able to
4.3
16.9
6.4
13.9
6.6
14.6
1987-95 1995-99
IT investment per worker
Percent compound annual growth rate
Source: U.S. Bureau of Economic Analysis; McKinsey & Company
IT investment has surged across all industry sectors
1987-95 1995-99 1987-95 1995-99
Hotel industry U.S. private sector Retail industry
Exhibit 2
4.3
16.9
6.4
13.9
6.6
14.6
1987-95 1995-99
IT investment per worker
Percent compound annual growth rate
Source: U.S. Bureau of Economic Analysis; McKinsey & Company
IT investment has surged across all industry sectors
1987-95 1995-99 1987-95 1995-99
Hotel industry U.S. private sector Retail industry
Exhibit 2
21.5
4.18.5
13.8
12.1
1995 pre-tax profit margin
* Price growth trend does not include service improvement
** Profitability change caused by changes in the ratio of nominal labor, operating, and fixed costs to real revenue
Note: Input price inflation could have driven both nominal cost increases and influenced hoteliers to raise prices
Source: Smith Travel Research; Bureau of Labor Statistics; McKinsey & Company
Price growth*
Variable operating costs**
Fixed costs**
1999 pre-tax profit margin
Pre-tax industry profit margin
Percent
Exhibit 3
Average price growth was largest contributor to profit margin increase between 1995 and 1999
HOSPITALITY BUSINESS REVIEW Volume 4, Number 1 31
Investment in Information Technology: The Multi-Billion Dollar Game of Chance
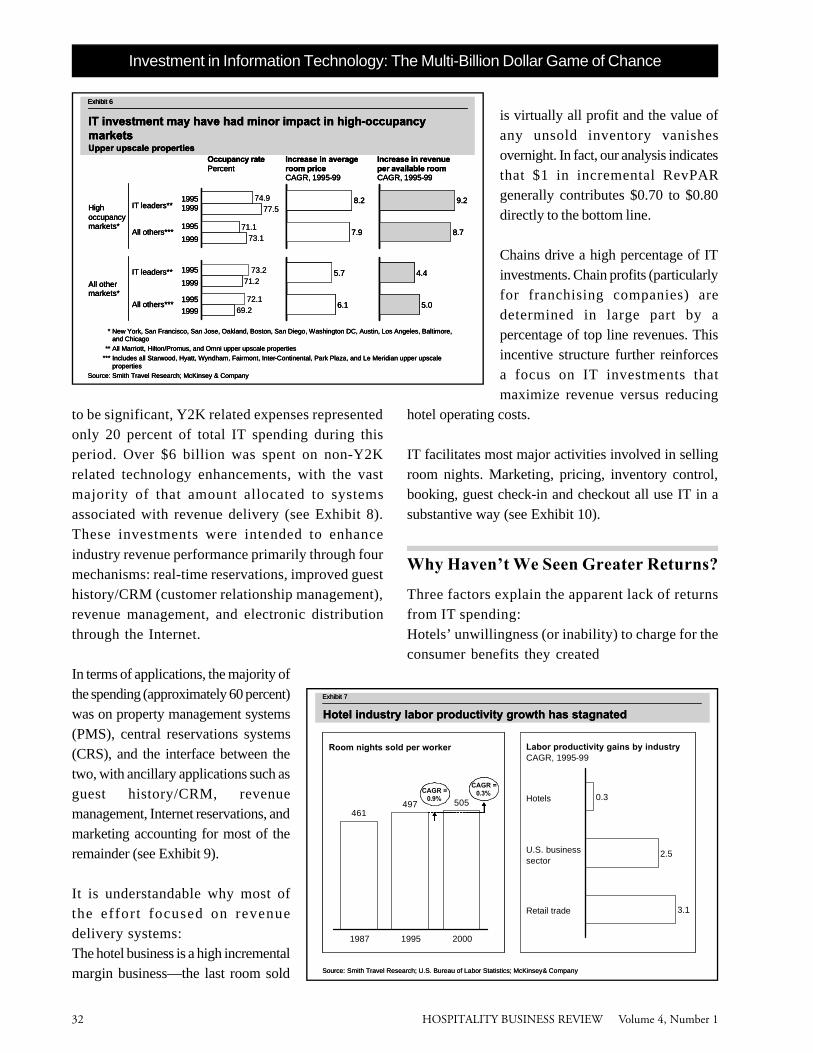
increase RevPAR faster than competitors (seeExhibit 5). Even when we looked at the relativeperformance of the IT “best-practice champions”in high occupancy markets such as New York,San Francisco, and Chicago versus the rest ofthe nat ion , the d i f ference in RevPARperformance improvement pos t -1995 wasnegligible (see Exhibit 6).
Operationally, the picture isn’t much better. Whilethe industry was experiencing rapid accelerationin revenues, it also layered in an additional 850basis points in costs—drivenlargely by an increase in variableoperating costs and a failure toimprove labor productivity.2 Since1995, the hotel industry hasexperienced virtually zero growthin labor productivity; during thesame period, the overall U.S.business sector improved laborproductivity 2.5 percent annually.Even more dramatic, the retailindustry, which largely draws onthe same labor pool as the hotelindustry , improved laborproductivity over 3 percent a year(see Exhibit 7).
To put this difference intoperspective, if the hotel industryhad experienced the same gains inlabor productivity as the overallU.S. business sector, hotels wouldhave saved over $4 billion on laborbetween 1995 and 1999—over onehalf of the $8 billion spent on IT.
So what happened? Who receivedthe benefit of this investment?And what can we do differentlyin the future? As we move intothe twenty-f i rs t century andindustry profits subside from theirrecord high, IT spending has the
potential to consume an increasingly larger shareof the shr inking pool of indus t ry prof i t s .Therefore, we feel that understanding the answersto these questions is the critical first step indetermining what the industry can do differentlyto improve the odds of getting a meaningful returnon its IT dollar.
Where Was the Money Spent?
At first blush, we might want to blame Y2K forthe post-1995 spending surge. While this proved
30
40
50
60
4,500 6,500 8,500 10,500
* Coefficient of determination. A measure of how closely GDP is correlated to ADR (100 = perfect relationship, 0 = no relationship)
Source: Smith Travel Research; U.S. Bureau of Economic Analysis; McKinsey & Company
Aggregate RevPAR Dollars
U.S. GDP$ Billions
Upper upscale
Upscale
Mid-scale with F&B
Mid-scale without F&B
Economy
Independent
All properties
R2*Percent
97
98
96
98
90
97
98
Relationship holds across all industry segments
Exhibit 4
RevPAR growth was driven primarily by health of macroeconomy
73.8
71.7
73.3
70.5
1995
1999
Example: upper upscale hotels
* All Marriott, Hilton/Promus, and Omni upper upscale properties; IT leaders identified by Cornell University researchers and Internet Week magazine
** Includes all Starwood, Hyatt, Wyndham, Fairmont, Inter-Continental, Park Plaza, and Le Meridian upper upscale properties
Source: Smith Travel Research; McKinsey & Company
6.3
6.81995
1999
All others**
IT leaders*
Occupancy ratePercent
Increase in average room price CAGR, 1995-99
Increase in revenue per available roomCAGR, 1995-99
6.1
6.3
Exhibit 5
IT leaders have not grown revenue faster than others
HOSPITALITY BUSINESS REVIEW Volume 4, Number 132
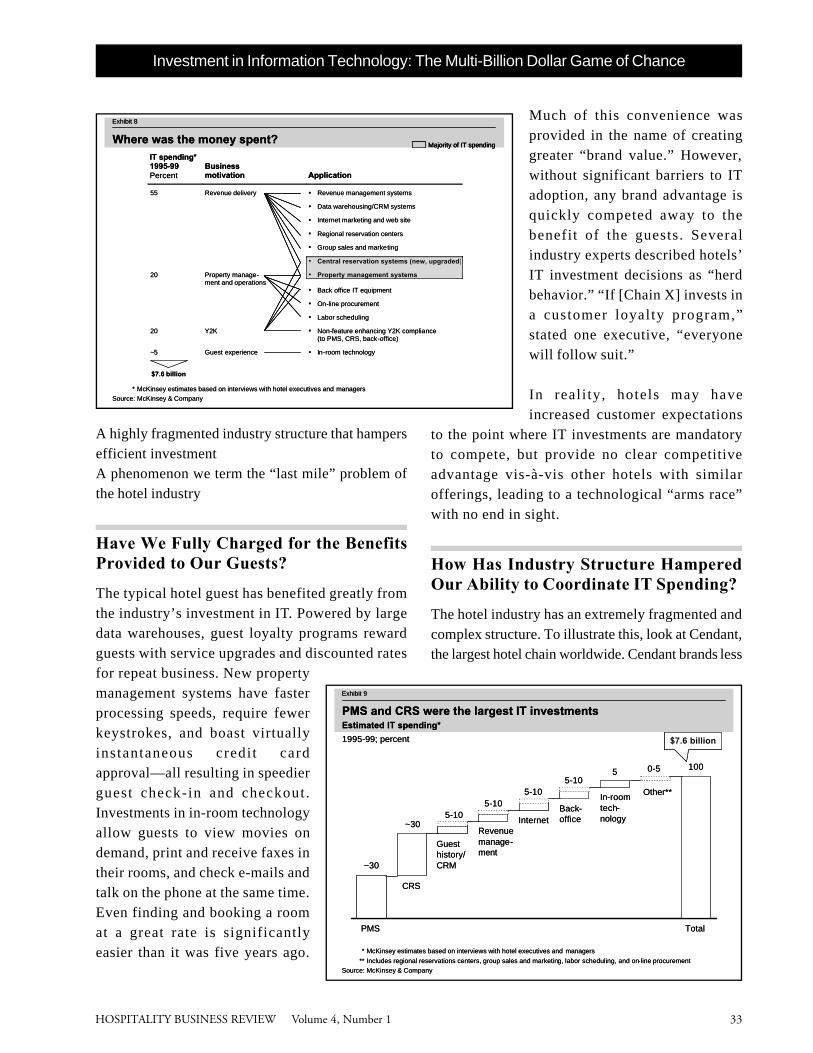
to be significant, Y2K related expenses representedonly 20 percent of total IT spending during thisperiod. Over $6 billion was spent on non-Y2Krelated technology enhancements, with the vastmajority of that amount allocated to systemsassociated with revenue delivery (see Exhibit 8).These investments were intended to enhanceindustry revenue performance primarily through fourmechanisms: real-time reservations, improved guesthistory/CRM (customer relationship management),revenue management, and electronic distributionthrough the Internet.
In terms of applications, the majority ofthe spending (approximately 60 percent)was on property management systems(PMS), central reservations systems(CRS), and the interface between thetwo, with ancillary applications such asguest history/CRM, revenuemanagement, Internet reservations, andmarketing accounting for most of theremainder (see Exhibit 9).
It is understandable why most ofthe effort focused on revenuedelivery systems:The hotel business is a high incrementalmargin business—the last room sold
is virtually all profit and the value ofany unsold inventory vanishesovernight. In fact, our analysis indicatesthat $1 in incremental RevPARgenerally contributes $0.70 to $0.80directly to the bottom line.
Chains drive a high percentage of ITinvestments. Chain profits (particularlyfor franchising companies) aredetermined in large part by apercentage of top line revenues. Thisincentive structure further reinforcesa focus on IT investments thatmaximize revenue versus reducing
hotel operating costs.
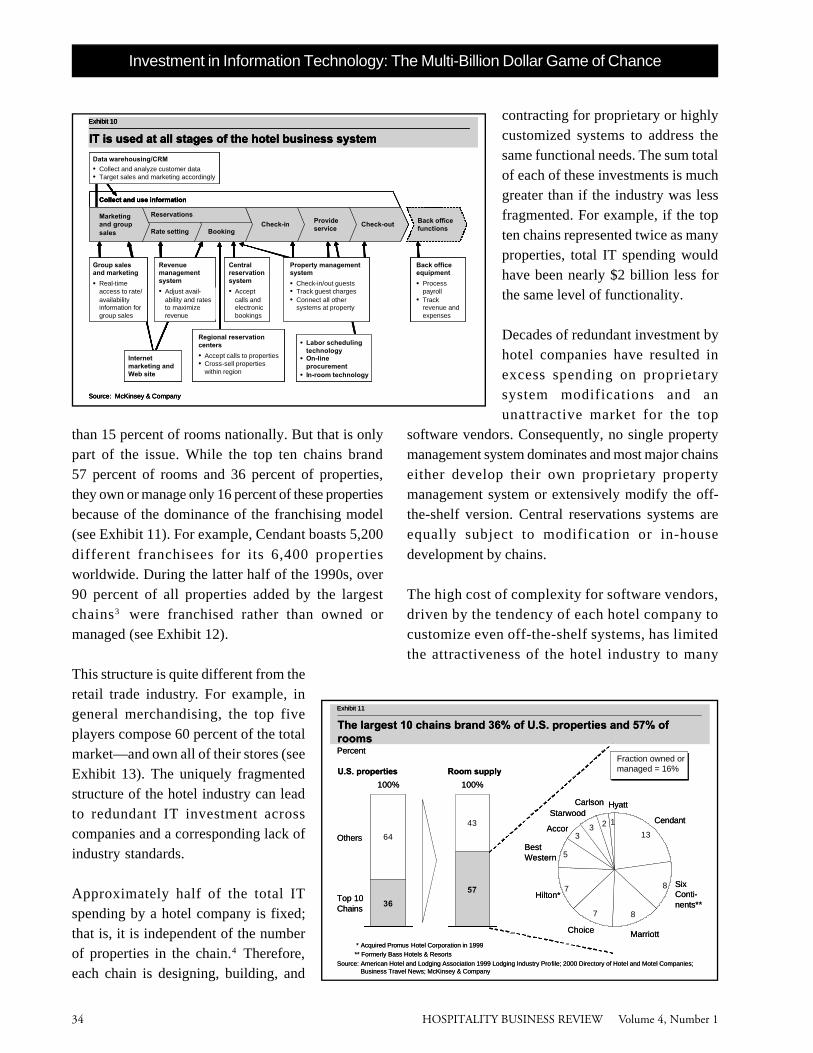
IT facilitates most major activities involved in sellingroom nights. Marketing, pricing, inventory control,booking, guest check-in and checkout all use IT in asubstantive way (see Exhibit 10).
Why Haven’t We Seen Greater Returns?
Three factors explain the apparent lack of returnsfrom IT spending:Hotels’ unwillingness (or inability) to charge for theconsumer benefits they created
Investment in Information Technology: The Multi-Billion Dollar Game of Chance
74.9
71.1
77.5
73.1
Upper upscale properties
* New York, San Francisco, San Jose, Oakland, Boston, San Diego, Washington DC, Austin, Los Angeles, Baltimore, and Chicago
** All Marriott, Hilton/Promus, and Omni upper upscale properties
*** Includes all Starwood, Hyatt, Wyndham, Fairmont, Inter-Continental, Park Plaza, and Le Meridian upper upscale properties
Source: Smith Travel Research; McKinsey & Company
All others***
IT leaders**
Increase in average room price CAGR, 1995-99
Increase in revenue per available room CAGR, 1995-99
High occupancy markets*
8.2
7.9
All others***
IT leaders**
All other markets*
5.7
6.1
9.2
8.7
4.4
5.0
Exhibit 6
IT investment may have had minor impact in high-occupancy markets
19951999
Occupancy ratePercent
1995
1999
1995
1999
1995
1999
73.2
72.1
71.2
69.2
74.9
71.1
77.5
73.1
Upper upscale properties
* New York, San Francisco, San Jose, Oakland, Boston, San Diego, Washington DC, Austin, Los Angeles, Baltimore, and Chicago
** All Marriott, Hilton/Promus, and Omni upper upscale properties
*** Includes all Starwood, Hyatt, Wyndham, Fairmont, Inter-Continental, Park Plaza, and Le Meridian upper upscale properties
Source: Smith Travel Research; McKinsey & Company
All others***
IT leaders**
Increase in average room price CAGR, 1995-99
Increase in revenue per available room CAGR, 1995-99
High occupancy markets*
8.2
7.9
All others***
IT leaders**
All other markets*
5.7
6.1
9.2
8.7
4.4
5.0
Exhibit 6
IT investment may have had minor impact in high-occupancy markets
19951999
Occupancy ratePercent
1995
1999
1995
1999
1995
1999
73.2
72.1
71.2
69.2
1987 1995 2000
Labor productivity gains by industryCAGR, 1995-99
461497 505
0.3
2.5
3.1Retail trade
U.S. businesssector
Hotels
Source: Smith Travel Research; U.S. Bureau of Labor Statistics; McKinsey& Company
CAGR =0.9%
CAGR =0.3%
Exhibit 7
Room nights sold per worker
Hotel industry labor productivity growth has stagnated
1987 1995 2000
Labor productivity gains by industryCAGR, 1995-99
461497 505
0.3
2.5
3.1Retail trade
U.S. businesssector
Hotels
Source: Smith Travel Research; U.S. Bureau of Labor Statistics; McKinsey& Company
CAGR =0.9%
CAGR =0.9%
CAGR =0.3%
CAGR =0.3%
Exhibit 7
Room nights sold per worker
Hotel industry labor productivity growth has stagnated
HOSPITALITY BUSINESS REVIEW Volume 4, Number 1 33
A highly fragmented industry structure that hampersefficient investmentA phenomenon we term the “last mile” problem ofthe hotel industry
Have We Fully Charged for the BenefitsProvided to Our Guests?
The typical hotel guest has benefited greatly fromthe industry’s investment in IT. Powered by largedata warehouses, guest loyalty programs rewardguests with service upgrades and discounted ratesfor repeat business. New propertymanagement systems have fasterprocessing speeds, require fewerkeystrokes, and boast virtuallyinstantaneous credi t cardapproval—all resulting in speedierguest check-in and checkout .Investments in in-room technologyallow guests to view movies ondemand, print and receive faxes intheir rooms, and check e-mails andtalk on the phone at the same time.Even finding and booking a roomat a great rate is significantlyeasier than it was five years ago.
Much of this convenience wasprovided in the name of creatinggreater “brand value.” However,without significant barriers to ITadoption, any brand advantage isquickly competed away to thebenefit of the guests. Severalindustry experts described hotels’IT investment decisions as “herdbehavior.” “If [Chain X] invests ina customer loyalty program,”stated one executive, “everyonewill follow suit.”
In real i ty, hotels may haveincreased customer expectations
to the point where IT investments are mandatoryto compete, but provide no clear competitiveadvantage vis-à-vis other hotels with similarofferings, leading to a technological “arms race”with no end in sight.
How Has Industry Structure HamperedOur Ability to Coordinate IT Spending?
The hotel industry has an extremely fragmented andcomplex structure. To illustrate this, look at Cendant,the largest hotel chain worldwide. Cendant brands less
Investment in Information Technology: The Multi-Billion Dollar Game of Chance
IT spending* 1995-99 Percent
Business motivation Application
55 Revenue delivery � Revenue management systems � Data warehousing/CRM systems � Internet marketing and web site � Regional reservation centers � Group sales and marketing
� Central reservation systems (new, upgraded)
20 � Property management systems
Property manage-ment and operations
� Back office IT equipment � On-line procurement � Labor scheduling
20 Y2K � Non-feature enhancing Y2K compliance (to PMS, CRS, back-office)
~5 Guest experience � In-room technology
* McKinsey estimates based on interviews with hotel executives and managers
Source: McKinsey & Company
$7.6 billion
Majority of IT spending
Exhibit 8
Where was the money spent?IT spending* 1995-99 Percent
Business motivation Application
55 Revenue delivery � Revenue management systems � Data warehousing/CRM systems � Internet marketing and web site � Regional reservation centers � Group sales and marketing
� Central reservation systems (new, upgraded)
20 � Property management systems
Property manage-ment and operations
� Back office IT equipment � On-line procurement � Labor scheduling
20 Y2K � Non-feature enhancing Y2K compliance (to PMS, CRS, back-office)
~5 Guest experience � In-room technology
* McKinsey estimates based on interviews with hotel executives and managers
Source: McKinsey & Company
$7.6 billion
Majority of IT spendingMajority of IT spending
Exhibit 8
Where was the money spent?
* McKinsey estimates based on interviews with hotel executives and managers
** Includes regional reservations centers, group sales and marketing, labor scheduling, and on-line procurement
Source: McKinsey & Company
Estimated IT spending*
1995-99; percent
~30
~30
1005
PMS
CRS
Guest history/CRM
Revenue manage-ment
InternetBack-office
In-room tech-nology
Other**
Total
$7.6 billion
5-105-10
5-105-10
0-5
Exhibit 9
PMS and CRS were the largest IT investments
* McKinsey estimates based on interviews with hotel executives and managers
** Includes regional reservations centers, group sales and marketing, labor scheduling, and on-line procurement
Source: McKinsey & Company
Estimated IT spending*
1995-99; percent
~30
~30
1005
PMS
CRS
Guest history/CRM
Revenue manage-ment
InternetBack-office
In-room tech-nology
Other**
Total
$7.6 billion$7.6 billion
5-105-10
5-105-10
0-5
Exhibit 9
PMS and CRS were the largest IT investments
HOSPITALITY BUSINESS REVIEW Volume 4, Number 134
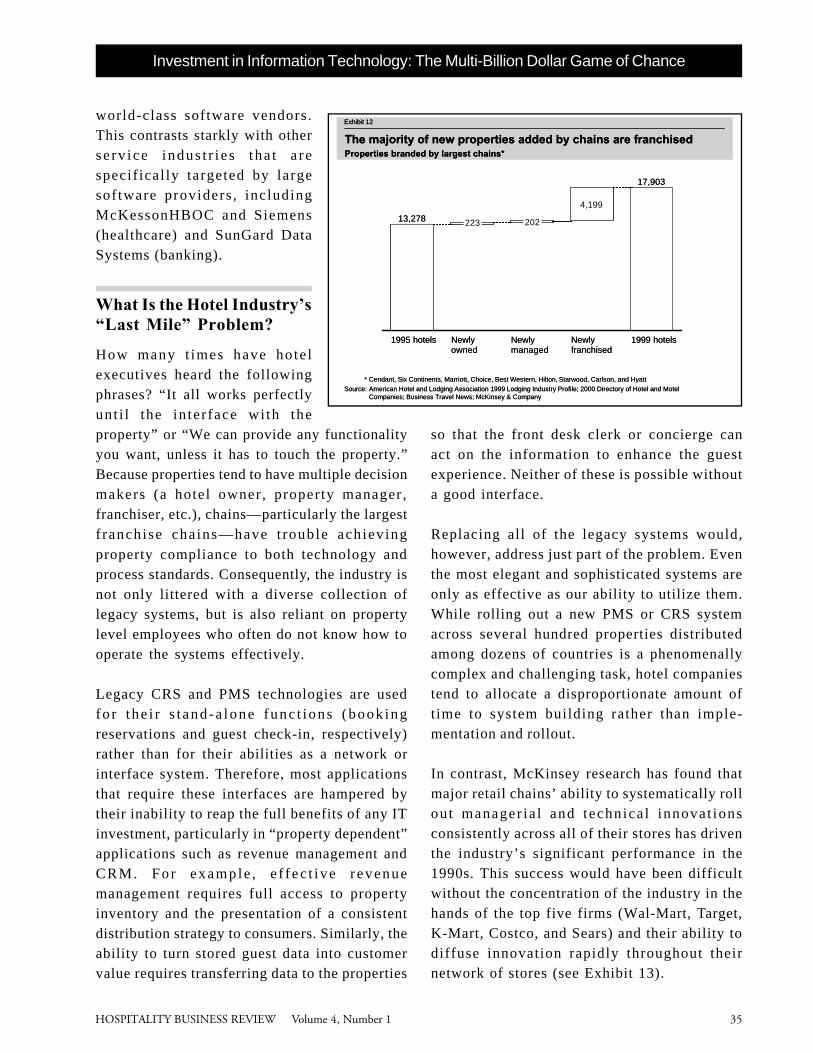
than 15 percent of rooms nationally. But that is onlypart of the issue. While the top ten chains brand57 percent of rooms and 36 percent of properties,they own or manage only 16 percent of these propertiesbecause of the dominance of the franchising model(see Exhibit 11). For example, Cendant boasts 5,200different franchisees for its 6,400 propertiesworldwide. During the latter half of the 1990s, over90 percent of all properties added by the largestchains3 were franchised rather than owned ormanaged (see Exhibit 12).
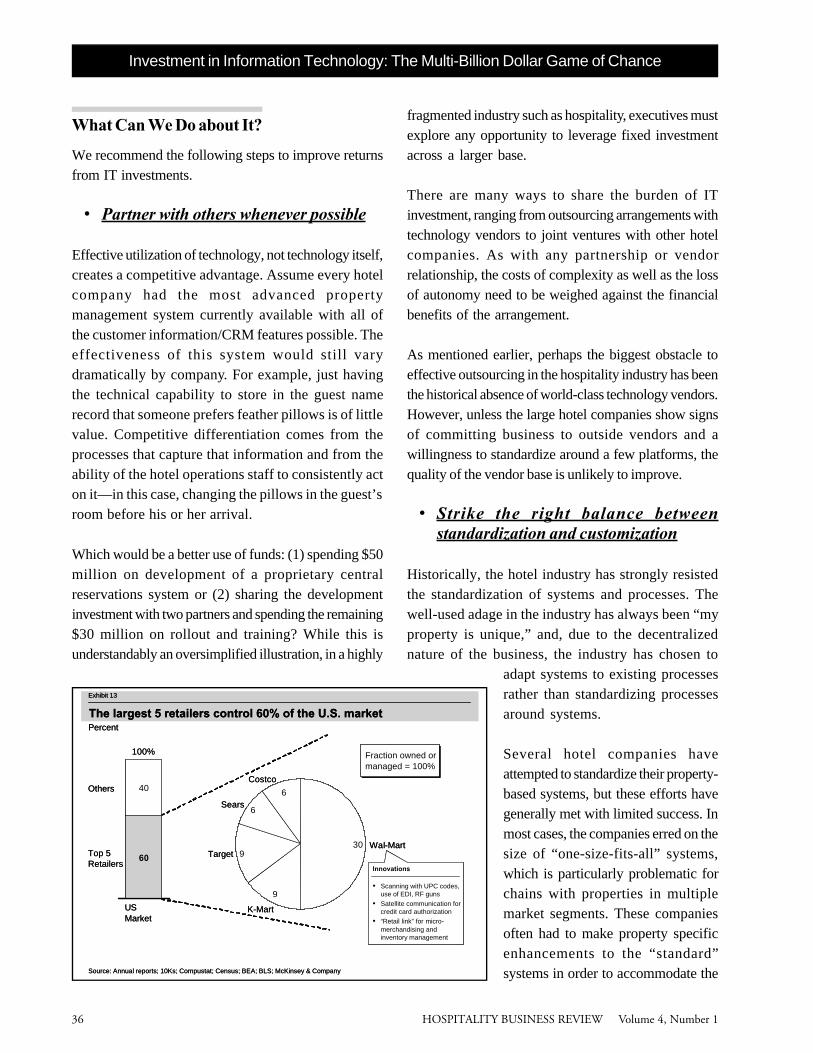
This structure is quite different from theretail trade industry. For example, ingeneral merchandising, the top fiveplayers compose 60 percent of the totalmarket—and own all of their stores (seeExhibit 13). The uniquely fragmentedstructure of the hotel industry can leadto redundant IT investment acrosscompanies and a corresponding lack ofindustry standards.
Approximately half of the total ITspending by a hotel company is fixed;that is, it is independent of the numberof properties in the chain.4 Therefore,each chain is designing, building, and
contracting for proprietary or highlycustomized systems to address thesame functional needs. The sum totalof each of these investments is muchgreater than if the industry was lessfragmented. For example, if the topten chains represented twice as manyproperties, total IT spending wouldhave been nearly $2 billion less forthe same level of functionality.
Decades of redundant investment byhotel companies have resulted inexcess spending on proprietarysystem modifications and anunattractive market for the top
software vendors. Consequently, no single propertymanagement system dominates and most major chainseither develop their own proprietary propertymanagement system or extensively modify the off-the-shelf version. Central reservations systems areequally subject to modification or in-housedevelopment by chains.
The high cost of complexity for software vendors,driven by the tendency of each hotel company tocustomize even off-the-shelf systems, has limitedthe attractiveness of the hotel industry to many
Investment in Information Technology: The Multi-Billion Dollar Game of Chance
Marketing and group sales Rate setting Booking
Check-in Provide service
Check-out Back office functions
Reservations
Collect and use information
Source: McKinsey & Company
Group sales and marketing
Data warehousing/CRM
• Collect and analyze customer data• Target sales and marketing accordingly
Revenue management system
Central reservation system
• Accept calls and electronic bookings
Back office equipment
• Process payroll
• Track revenue and expenses
Regional reservation centers
• Accept calls to properties• Cross-sell properties
within region
Property management system
• Check-in/out guests• Track guest charges• Connect all other
systems at property
• Labor scheduling technology
• On-line procurement
• In-room technology
Internet marketing and Web site
• Real-time access to rate/availability information for group sales
• Adjust avail-ability and rates to maximize revenue
Exhibit 10
IT is used at all stages of the hotel business system
• Real-time access to rate/availability information for group sales
• Adjust avail-ability and rates to maximize revenue
Exhibit 10
IT is used at all stages of the hotel business system
Marketing and group sales Rate setting Booking
Check-in Provide service
Check-out Back office functions
Reservations
Collect and use information
Source: McKinsey & Company
Group sales and marketing
Data warehousing/CRM
• Collect and analyze customer data• Target sales and marketing accordingly
Revenue management system
Central reservation system
• Accept calls and electronic bookings
Back office equipment
• Process payroll
• Track revenue and expenses
Regional reservation centers
• Accept calls to properties• Cross-sell properties
within region
Property management system
• Check-in/out guests• Track guest charges• Connect all other
systems at property
• Labor scheduling technology
• On-line procurement
• In-room technology
Internet marketing and Web site
Internet marketing and Web site
• Real-time access to rate/availability information for group sales
• Adjust avail-ability and rates to maximize revenue
Exhibit 10
IT is used at all stages of the hotel business system
57
43
100%
Room supply
* Acquired Promus Hotel Corporation in 1999** Formerly Bass Hotels & Resorts
Source: American Hotel and Lodging Association 1999 Lodging Industry Profile; 2000 Directory of Hotel and Motel Companies; Business Travel News; McKinsey & Company
Exhibit 11
36
64
Top 10 Chains
Others
100%
13
8
87
7
5
33 2 1 Cendant
Marriott
Hilton*
Accor
Starwood
Percent
U.S. properties
Six Conti-nents**
Choice
Best Western
Carlson Hyatt
The largest 10 chains brand 36% of U.S. properties and 57% of rooms
Fraction owned or managed = 16%
HOSPITALITY BUSINESS REVIEW Volume 4, Number 1 35
world-class software vendors.This contrasts starkly with otherse rv ice indus t r i e s tha t a respecif ical ly targeted by largesoftware providers , includingMcKessonHBOC and Siemens(healthcare) and SunGard DataSystems (banking).
What Is the Hotel Industry’s“Last Mile” Problem?
How many t imes have hote lexecutives heard the followingphrases? “It all works perfectlyunt i l the in ter face wi th theproperty” or “We can provide any functionalityyou want, unless it has to touch the property.”Because properties tend to have multiple decisionmakers (a hotel owner, property manager,franchiser, etc.), chains—particularly the largestf ranchise chains—have t rouble achievingproperty compliance to both technology andprocess standards. Consequently, the industry isnot only littered with a diverse collection oflegacy systems, but is also reliant on propertylevel employees who often do not know how tooperate the systems effectively.
Legacy CRS and PMS technologies are usedfo r t he i r s t and -a lone func t ions (book ingreservations and guest check-in, respectively)rather than for their abilities as a network orinterface system. Therefore, most applicationsthat require these interfaces are hampered bytheir inability to reap the full benefits of any ITinvestment, particularly in “property dependent”applications such as revenue management andCRM. For example , e f f ec t ive r evenuemanagement requires full access to propertyinventory and the presentation of a consistentdistribution strategy to consumers. Similarly, theability to turn stored guest data into customervalue requires transferring data to the properties
so that the front desk clerk or concierge canact on the information to enhance the guestexperience. Neither of these is possible withouta good interface.
Replacing all of the legacy systems would,however, address just part of the problem. Eventhe most elegant and sophisticated systems areonly as effective as our ability to utilize them.While rolling out a new PMS or CRS systemacross several hundred properties distributedamong dozens of countries is a phenomenallycomplex and challenging task, hotel companiestend to allocate a disproportionate amount oftime to system building rather than imple-mentation and rollout.
In contrast, McKinsey research has found thatmajor retail chains’ ability to systematically rollou t manager ia l and technica l innovat ionsconsistently across all of their stores has driventhe industry’s significant performance in the1990s. This success would have been difficultwithout the concentration of the industry in thehands of the top five firms (Wal-Mart, Target,K-Mart, Costco, and Sears) and their ability todiffuse innovation rapidly throughout theirnetwork of stores (see Exhibit 13).
Investment in Information Technology: The Multi-Billion Dollar Game of Chance
* Cendant, Six Continents, Marriott, Choice, Best Western, Hilton, Starwood, Carlson, and Hyatt
Source: American Hotel and Lodging Association 1999 Lodging Industry Profile; 2000 Directory of Hotel and Motel Companies; Business Travel News; McKinsey & Company
Exhibit 12
Properties branded by largest chains*
The majority of new properties added by chains are franchised
4,199
202223
17,903
13,278
1995 hotels Newly owned
Newly managed
Newly franchised
1999 hotels
HOSPITALITY BUSINESS REVIEW Volume 4, Number 136
Investment in Information Technology: The Multi-Billion Dollar Game of Chance
What Can We Do about It?
We recommend the following steps to improve returnsfrom IT investments.
• Partner with others whenever possible
Effective utilization of technology, not technology itself,creates a competitive advantage. Assume every hotelcompany had the most advanced propertymanagement system currently available with all ofthe customer information/CRM features possible. Theeffectiveness of this system would still varydramatically by company. For example, just havingthe technical capability to store in the guest namerecord that someone prefers feather pillows is of littlevalue. Competitive differentiation comes from theprocesses that capture that information and from theability of the hotel operations staff to consistently acton it—in this case, changing the pillows in the guest’sroom before his or her arrival.
Which would be a better use of funds: (1) spending $50million on development of a proprietary centralreservations system or (2) sharing the developmentinvestment with two partners and spending the remaining$30 million on rollout and training? While this isunderstandably an oversimplified illustration, in a highly
fragmented industry such as hospitality, executives mustexplore any opportunity to leverage fixed investmentacross a larger base.
There are many ways to share the burden of ITinvestment, ranging from outsourcing arrangements withtechnology vendors to joint ventures with other hotelcompanies. As with any partnership or vendorrelationship, the costs of complexity as well as the lossof autonomy need to be weighed against the financialbenefits of the arrangement.
As mentioned earlier, perhaps the biggest obstacle toeffective outsourcing in the hospitality industry has beenthe historical absence of world-class technology vendors.However, unless the large hotel companies show signsof committing business to outside vendors and awillingness to standardize around a few platforms, thequality of the vendor base is unlikely to improve.
• Strike the right balance betweenstandardization and customization
Historically, the hotel industry has strongly resistedthe standardization of systems and processes. Thewell-used adage in the industry has always been “myproperty is unique,” and, due to the decentralizednature of the business, the industry has chosen to
adapt systems to existing processesrather than standardizing processesaround systems.
Several hotel companies haveattempted to standardize their property-based systems, but these efforts havegenerally met with limited success. Inmost cases, the companies erred on thesize of “one-size-fits-all” systems,which is particularly problematic forchains with properties in multiplemarket segments. These companiesoften had to make property specificenhancements to the “standard”systems in order to accommodate theSource: Annual reports; 10Ks; Compustat; Census; BEA; BLS; McKinsey & Company
Exhibit 13
60
40
Top 5 Retailers
Others
100%
US Market
30
9
9
6
6
Wal-Mart
K-Mart
Target
Sears
Costco
Percent
Innovations
• Scanning with UPC codes, use of EDI, RF guns
• Satellite communication for credit card authorization
• “Retail link” for micro-merchandising and inventory management
The largest 5 retailers control 60% of the U.S. market
Fraction owned or managed = 100%
Source: Annual reports; 10Ks; Compustat; Census; BEA; BLS; McKinsey & Company
Exhibit 13
60
40
Top 5 Retailers
Others
100%
US Market
30
9
9
6
6
Wal-Mart
K-Mart
Target
Sears
Costco
Percent
Innovations
• Scanning with UPC codes, use of EDI, RF guns
• Satellite communication for credit card authorization
• “Retail link” for micro-merchandising and inventory management
The largest 5 retailers control 60% of the U.S. market
Fraction owned or managed = 100%
HOSPITALITY BUSINESS REVIEW Volume 4, Number 1 37
unique requirements of certain properties, leaving thecompany with many different versions to support.
Companies can use major IT projects as an opportunityto improve and, where possible, standardize operationsacross the chain. Properties can be benchmarked againsteach other and best-practice processes identified andcategorized by property type. Modular IT systems canbe designed around the best-in-class processes of eachmajor property type. Modules can then be pluggedtogether based on the individual hotel’s requirements.Once installed at the property, the systems can be usedto drive property compliance to best practice processes.
• Commit adequate resources to systemsimplementation and training programs
Remember the adage “an IT system is only as good asits user.” Rollout and training is as critical a componentto the success of the project as the programmersthemselves. Senior managers should resist thetemptation to cut training dollars first when asked toreduce a project’s budget—assuming the operationsgroup can fund and staff the rollout as part of theirongoing operations.
In our experience, training and implementation costs ina highly distributed environment such as the hotel orretail industry can often equal or exceed the cost ofsoftware development. This, of course, will vary widelydepending on the number of users that need to betrained on the system (e.g., property managementsystem versus corporate accounting system). However,given that the majority of IT investment is currentlybeing spent on PMS and reservation systemsenhancements, the training and implementationcomponent of these projects will remain a significantinvestment for the industry in the foreseeable future.
Lack of focus on implementation and training is oftenas much a result of organizational structures asbudgetary shortfalls. Many hotel groups have a highlydecentralized organizational structure, with the divisionalheads wielding a tremendous amount of influence over
operations. In order for any corporate-wide initiativeimpacting the properties to be successful, centralizedfunctions such as marketing and IT must secure andretain “buy-in” from the operational divisions.
For lengthy projects, support of divisional managementwill often wane and the relative prioritization of theinitiative will slip. In order to prevent this outcome,companies should assign a senior operations executivewith the responsibility of ensuring successful completionof the project rollout rather than leaving soleaccountability with the heads of the centralized corporatefunctions who have limited control over divisionalresources.
• Manage the IT capital investment processas relentlessly as the hotel propertycapital investment process
Most hotel companies have an extremely rigid and definedprocess for the approval of development and technicalservices projects. Difficult questions are asked, answersare challenged, backup information is demanded, andoptional scenarios and sensitivity analyses are expectedto be included as part of the business case. Comparethe rigor of this process in your company with the capitalallocation process for IT projects. The investment beingrequested by the IT department frequently constitutesmore than a hotel property, with longer payback periodsand greater variability.
Information technology is not generally in the “comfortzone” of most hotel company executives; therefore, theytend not to ask hard questions or challenge answers.Nevertheless, the basic business questions remain thesame: What is the project ROI (return on investment)?Where will the projected cost savings/revenue lift comefrom? How will we measure success? What businessowners are signing up to deliver these numbers? Whatare the risk factors? And perhaps most important: Whatare our alternative courses of action?
Possibly the most fatal error in the IT capital allocationprocess is the failure to assign accountability for
Investment in Information Technology: The Multi-Billion Dollar Game of Chance
HOSPITALITY BUSINESS REVIEW Volume 4, Number 138
delivering the expected benefits (e.g., cost reduction,revenue enhancement) of the project. Before theproject is approved, accountability for each line item inthe “return” column of the ROI calculation should beassigned to an individual, along with the appropriatedeliverable milestones.
• Avoid the temptation to give away thevalue generated by technologyinvestments
The hotel industry has an inexhaustible tendency toward“feature creep.” Whether in the name of “brand value,”competitive parity, or implementation difficulty, theindustry has generally bundled benefits into room rates.
Hotels can extract a premium for these additionalservices in several ways. The most common and visiblemethod is to charge an additional usage fee. A subtlerand potentially more effective way is to selectivelybundle benefits into the rate of a subset of roomcategories. This allows hotels to establish an additionalset of benefits-based hurdles between room ratecategories and provides a mechanism with which to“upsell” customers into a room category that containsthe services they value. Technology bundles can bestatic (part of the published rate class) or dynamic(tailored to a specific customer) via either CRMsoftware or just “plain old good salesmanship”(otherwise known as POGS) by sales representativesand reservations agents.
• Prioritize and target investment againsthighest potential customer segments
Because all customers are not equal, they will not placean equal value on the benefits they enjoy fromtechnology investments. Understanding the relativevalue that customers place on different services isparticularly important when considering in-roomtechnology investments.
For example, a family on vacation will not placethe same value on high-speed Internet access
as a technology consultant on a three-monthsystems integrat ion project . Hotels shouldprioritize not only in which properties technologyservices should be installed, but also in how manyand what types of rooms ( i .e . , c lub f loor ,business rooms) within each property. Thisprioritization should be rooted in an under-standing of who the customer is and whatservices they value.
1Assumes that total IT spending is approximately
half capitalized investment and half non-capitalizedoperating expenditure. This assumption isqualitatively supported by GartnerGroup’s “ITSpending and Staffing Survey” and our interviewswith hotel executives. Additionally, GartnerGroup,Rubin Systems, and Hotels magazine suggest thattotal IT spending was approximately equal to2 percent of industry revenues, which is consistentwith an equal split between capitalized and operatingIT expenditure. The IT investment estimate of $3.8billion is obtained directly from the U.S. Bureau ofEconomic Analysis.
2Mathematically, productivity is calculated as theratio between “output” (room nights) and “input”(labor hours worked to sell and provide thoseroom nights).
3Cendant, Six Continents (formerly Bass Hotels &
Resorts), Marriott, Choice, Best Western, Hilton,Starwood, Carlson, and Hyatt
4Assuming all CRS, CRM, Internet, and some
revenue management spending is not variable withthe number of properties in a chain
This article relies heavily on research conducted by the McKinsey
Global Institute during its yearlong study of the drivers of the
recent U.S. labor productivity performance, including the role of
IT. Their report, U.S. Productivity Growth 1995-2000:
Understanding the Contribution of Information Technology
Relative to Other Factors, can be downloaded at http://
www.mckinsey.com/knowledge/mgi/reports/productivity.asp.
Investment in Information Technology: The Multi-Billion Dollar Game of Chance