consdierations for corridor direct current fast … and renewable fuel and vehicle technology...
TRANSCRIPT
A l t e r n a t i v e a n d R e n e w a b l e F u e l a n d V e h i c l e T e c h n o l o g y P r o g r a m
C o n s u l t a n t R e p o r t
CONSIDERATIONS FOR CORRIDOR DIRECT CURRENT FAST CHARGING INFRASTRUCTURE IN CALIFORNIA
Final Version
DECEMBER 2015
CEC-600-2015-015
Prepared for: California Energy Commission
Prepared by: Alternative Energy Systems Consulting, Inc. (AESC)

DISCLAIMER
This report was prepared as the result of work sponsored by the California Energy Commission. It does not necessarily represent the views of the Energy Commission, its employees or the State of California. The Energy Commission, the State of California, its employees, contractors and subcontractors make no warranty, expressed or implied, and assume no legal liability for the information in this report; nor does any party represent that the uses of this information will not infringe upon privately owned rights. This report has not been approved or disapproved by the California Energy Commission nor has the California Energy Commission passed upon the accuracy or adequacy of the information in this report.
Prepared by: Alternative Energy Systems Consulting, Inc. (AESC) Primary Authors John Clint, Program Manager
Brandon Henzie, P.E., Staff Engineer Billy Gamboa, Engineer Akane Karasawa, P.E., Staff Engineer
AESC, Inc. 5927 Balfour Ct., Suite 213 Carlsbad, CA 92008 760.931.2641 www.aesc-inc.com CEC Agreement Number: 600-14-002 Prepared for: California Energy Commission Leslie Baroody Agreement Manager John P. Butler II Office Manager Randy Roesser Acting Deputy Director Fuels and Transportation Division Robert P. Oglesby Executive Director

ACKNOWLEDGEMENTS
The authors are very appreciative of the California Energy Commission for the opportunity to provide recommendations on the future of DC fast charger infrastructure in California. The authors would like to acknowledge the staff at the Energy Commission’s Alternative Renewable Fuel and Vehicle Technology Program, in particular Leslie Baroody for her valuable direction and input into this process.
The authors built the research upon the exceptional analysis provided by National Renewable Energy Laboratory in its 2014 California Statewide Plug-In Electric Vehicle Infrastructure Assessment. The authors would like to thank the laboratory staff, notably Marc Melaina and Andrew Hudgins for their support in corridor assessment. The authors would also like to recognize Mike Nicholas from University of California, Davis, for all his insight in navigating the various electric vehicle projections provided by the university.
The authors received invaluable information from a multitude of experts, advocates, and early adopters through Energy Commission-sponsored workshops, in-person meetings, and conference calls. These stakeholders came from a variety of sources, including government agencies, utilities, electric vehicle service providers, auto manufacturers, equipment manufacturers, electric vehicle advocacy organizations, regional readiness groups, and academia. The authors greatly appreciate their expertise and knowledgeable contributions to the process.
i

ABSTRACT
This document, Considerations for Corridor Direct Current Fast Charging Infrastructure in California, provides the California Energy Commission and other interested stakeholders with an assessment of the existing state of the direct current fast charging infrastructure within California. Several conclusions are made in this document that lead to recommendations for funding public and private DC fast charger infrastructure improvements.
To date, numerous researchers have produced extensive volumes of accurate and relevant plug-in electric vehicle infrastructure information. This information has been developed through primary research, study, and examination. Alternative Energy Systems Consulting provides a pragmatic assessment of all the available and relevant information to draw practical and actionable conclusions. The authors gathered information and data from multiple sources, which include document research, subject matter expert interviews, stakeholder workshops, and Energy Commission archives. Collected information was then assembled and, in conjunction with extensive consulting experience, prioritized to arrive at practical recommendations.
Alternative Energy Systems Consulting examined three major areas:
• The identification of significant corridor gaps in the existing DC fast charger infrastructure for consideration by the Energy Commission
• The evaluation of infrastructure requirements that should be considered by the Energy Commission, such as site requirements, solar generation, battery storage, and maintenance needs
• The determination of funding requirements and business strategy recommendations.
Keywords: California Energy Commission, NREL, fast charging, DCFC, corridors, corridor gaps, BEV, PEV, PEV infrastructure, IOU, EVSE, EVSP, electric vehicle charging, CHAdeMO, CCS, SAE Combo, CalEV, WCEH, WCGH
Clint, John, Billy Gamboa, Brandon Henzie, Akane Karasawa (Alternative Energy Systems Consulting, Incorporated). 2015. Considerations for Corridor Direct Current Fast Charging Infrastructure in California. California Energy Commission. CEC-600-2015-015
ii

iii

TABLE OF CONTENTS
ACKNOWLEDGEMENTS ....................................................................................................................... i
ABSTRACT ............................................................................................................................................... ii
TABLE OF CONTENTS ......................................................................................................................... iv
LIST OF FIGURES .................................................................................................................................. vi
LIST OF TABLES ................................................................................................................................... vii
EXECUTIVE SUMMARY ........................................................................................................................ 1
Introduction and Background .......................................................................................................... 1
Purpose ................................................................................................................................................ 1
Recommendations .............................................................................................................................. 1
CHAPTER 1: DCFC Gaps ....................................................................................................................... 3
Gap Focus ................................................................................................................................................ 3
Corridors ................................................................................................................................................. 5
DCFC Corridor Gap Analysis .............................................................................................................. 6
Identifying and Selecting Corridor Gaps ........................................................................................ 7
Categorizing and Prioritizing Selected Corridor Gaps ............................................................... 11
CHAPTER 2: DCFC Infrastructure Requirements ........................................................................... 24
Site Requirements ................................................................................................................................ 24
Configuration.................................................................................................................................... 24
Location ............................................................................................................................................. 26
New Construction ............................................................................................................................ 27
Facilities ............................................................................................................................................. 27
Safety .................................................................................................................................................. 27
Public Amenities .............................................................................................................................. 27
Electric Power ................................................................................................................................... 27
Energy and Demand Management.................................................................................................... 27
DCFC and Areas With Limited Utility Infrastructure ................................................................ 30
CHAPTER 3: Funding Requirements and Strategies ....................................................................... 32
iv

Cost Parameters .................................................................................................................................... 32
Revenue Parameters ............................................................................................................................ 32
Framework for the Business Structures ............................................................................................ 33
Constraints ........................................................................................................................................ 33
Cost Compression ............................................................................................................................ 33
Partnerships ...................................................................................................................................... 33
Identification of Market Participants and Roles .......................................................................... 34
Business Structures .............................................................................................................................. 36
Public/Public ..................................................................................................................................... 36
Public/Private.................................................................................................................................... 37
Private/Private .................................................................................................................................. 39
Private/Private (Alternate Project Delivery) ................................................................................ 41
Summary ........................................................................................................................................... 42
Funding Requirements ........................................................................................................................ 43
Installation and Equipment Costs ................................................................................................. 43
First Costs Subsidy ........................................................................................................................... 44
Operation and Maintenance Support ............................................................................................ 44
Site Assessment Support ................................................................................................................. 44
Funding Summaries............................................................................................................................. 44
CHAPTER 4: Recommendations ......................................................................................................... 46
REFERENCES .......................................................................................................................................... 49
Documents ............................................................................................................................................ 49
Interviews and Emails ......................................................................................................................... 50
ACRONYMS ............................................................................................................................................ 52
v

LIST OF FIGURES
Figure 1. Current and Planned DCFC sites ............................................................................................ 4
Figure 2. The Charging Pyramid ............................................................................................................. 5
Figure 3. Sacramento Valley Corridors ................................................................................................. 14
Figure 4. San Joaquin Valley Corridors ............................................................................................... 15
Figure 5. Upstate Region Population Centers With <40 mile Range ................................................ 17
Figure 6. Public/Public Organizational Chart ...................................................................................... 37
Figure 7. Public/Private Organizational Chart .................................................................................... 38
Figure 8. Private/Private (Type 1) Organizational Chart ................................................................... 40
Figure 9. Private/Private (Type 2) Organizational Chart ................................................................... 41
vi

LIST OF TABLES
Table 1. Example of County "Roll-Up" Into Interregional Corridor ................................................... 7
Table 2. Initial Full Set of Northern Corridor Gaps .............................................................................. 8
Table 3. Initial Full Set of Central Corridor Gaps .................................................................................. 9
Table 4. Initial Full Set of Southern Corridor Gaps ............................................................................. 10
Table 5. Recommended CalEV Highway DCFC Sites ........................................................................ 13
Table 6. Electrical Infrastructure for Sacramento Valley Alternate CalEV Highway Routes ....... 19
Table 7. "Other" Corridors by Priority .................................................................................................. 22
Table 8. Charging Station Configuration .............................................................................................. 24
Table 9. Recommended Funding Limit for Option 1 .......................................................................... 25
Table 10. Recommended Funding Limit for Option 2 ........................................................................ 25
Table 11. Transformer Sizing for (a) Option 1 and (b) Option 2 ....................................................... 26
Table 12. Key Market Participants ......................................................................................................... 35
Table 13. Funding Recommendations by Corridor ............................................................................. 45
vii

EXECUTIVE SUMMARY
Introduction and Background In March 2012, California Governor Edmund G. Brown Jr. issued Executive Order B-16-2012 to encourage the successful development of zero-emission vehicles and related infrastructure to “protect the environment, stimulate economic growth, and improve quality of life in the State.”
Through more than five decades of determined effort, the State of California has become a global leader in creating emissions legislation and air quality benchmarks that have made efficient gas-powered vehicle design an imperative. These standards have led to a dramatic improvement in environmental and public health, greater quality of life, and bluer, cleaner skies.
As indicated in the executive order and the subsequent Zero-Emission Vehicle Action Plan, the next step for Californians is to fundamentally transform the state’s transportation systems by moving from internal combustion to zero-emissions vehicles. This project seeks to create a clear path to achieving the electric vehicle charging infrastructure envisioned in the executive order.
Continuing the momentum established by the executive order, the Governor’s 2013 Zero-Emission Vehicle Action Plan and subsequent 2015 ZEV Action Plan Update identified specific actions required to achieve the goal of 1.5 million zero-emission vehicles on California roads by 2025. The plan contained interim milestones, including fast charging infrastructure to support 1 million vehicles by 2020.
The various goals within the plan were divided into component actions and strategies and then assigned to appropriate state agencies. The California Energy Commission was assigned the task of supporting the strategic development of zero-emission vehicle charging infrastructure.
A great deal of foundational work has already been accomplished. In September 2012, the Energy Commission engaged the National Renewable Energy Laboratory to assess the current state of plug-in electric vehicle infrastructure and future recommendations. In May 2014, the National Renewable Energy Laboratory submitted the California Statewide Plug-In Electric Vehicle Infrastructure Assessment (CEC-600-2014-003), a comprehensive overview of current charging infrastructure, future needs, and related challenges.
Purpose In December 2014 the Energy Commission engaged Alternative Energy Systems Consulting to develop an action plan that would prioritize charging locations and guide regional charging infrastructure planning. As part of this plan, the first task was to assess the state of the statewide DC fast charging network and recommend how best to allocate funding to encourage greater development of DC fast charging stations along critical corridors.
Recommendations Alternative Energy Systems Consulting recommends the following for Energy Commission consideration:
1
• Grant funding for identified corridor gaps. Existing and current DC fast charging infrastructure efforts are heavily concentrated in the urban areas. The authors recommend funding sites within corridor gaps that will initially be less commercially viable.
• Grant funding levels. To adequately seed the infrastructure in the corridor gap regions, Alternative Energy Systems Consulting calculates about 80 sites will require some form of public subsidies. Alternative Energy Systems Consulting estimates it will require between $9.4 million and $14.5 million to adequately cover these costs for the California Electric Vehicle Highway (CalEV) and other priority corridors.
• Site requirements. The site must meet minimum requirements to satisfy the needs of the plug-in electric vehicle driver and the infrastructure goals. In general, the site must be safe, accessible, convenient, and reliable. These needs should be expressed as compliant/noncompliant in the process. The site should also contain a type and mix of charging stations that will maximize usefulness. Charge de Move (CHAdeMO), Combined Charging Standard (CCS or SAE Combo), and Tesla Super Charger are the three charging standards that are in use in the United States. Tesla vehicles can physically charge at CHAdeMO stations using an adaptor cable.
o Require that each site include:
• Option #1 ($140,000 cap)
o One CHAdeMO DCFC charger.
o One dual-protocol (CHAdeMO and CSS) DCFC charger.
o One Level II charger.
o One expansion location (for future use).
• Option #2 ($215,000 Cap)
o Two CHAdeMO DCFC chargers.
o Two dual-protocol DCFC Chargers.
o One Level II, dual-port charger.
o One expansion location (for future use).
• Energy and demand management. It is recommended that the Energy Commission continue to encourage the integration of renewable generation and energy storage with DC fast chargers to reduce energy and demand charges.
• Business structures. After reviewing numerous cases and real-world examples, a common theme emerged that suggests business structures can be relatively simplistic or complex as long as they align the interests of the parties involved.
2

CHAPTER 1: DCFC Gaps A significant effort is underway to site, develop, and implement direct current fast charging (DCFC) stations throughout California. Much of this effort was performed under Phases I and II of the Energy Commission’s Three-Phase PEV (plug-in vehicle) Infrastructure Deployment Strategy1. Entities such as eVgo (NRG), Green Charge Networks, NEDO, AeroVironment, Tesla, Chargepoint, and CarCharging Group (Blink Assets) are planning and installing DCFC equipment under a variety of unique operational mandates. For example, NRG is servicing part of a settlement stemming from the 2001 energy crisis (against NRG predecessor Dynegy) by installing 200 public fast chargers. The New Energy and Industrial Technology Development Organization (NEDO)2, a Japanese consortium, is working with Nissan and the California Governor’s Office to demonstrate and install DCFC equipment and infrastructure. Other collaborations, such as Chargepoint, BMW, and VW, have recently announced intentions to install fast charging equipment along both of the high-demand corridors on the West and East Coasts of the United States3. Furthermore, California’s electric investor-owned utilities (San Diego Gas & Electric Company, Southern California Edison, and Pacific Gas and Electric Company) have recently submitted applications to the California Public Utilities Commission (CPUC) to become purveyors of electric vehicle charging.
While these efforts will increase the number of DCFC stations in California, the primary focus to date has been within large urban centers. This focus has resulted in significant gaps in interregional corridors.
Gap Focus Electric vehicle supply providers (EVSPs) have traditionally made a business case by charging usage fees or by taking advantage of subsidized free charging provided by the government and automakers. Typically any collected revenues minimally offset operational and maintenance costs. For this reason, these arrangements work best in areas where DCFC usage is high, as illustrated in the Energy Commission’s electric vehicle charging map. Figure 1 shows high concentrations of DC charging capacity in the major cities and adjacent counties of San Francisco, Oakland, San Jose, Sacramento, Los Angeles/Orange County, and San Diego.
1 http://www.energy.ca.gov/2014publications/CEC-100-2014-001/CEC-100-2014-001-CMF.pdf, page 44. 2 http://www.nedo.go.jp/english/. 3 http://www.chargepoint.com/press-releases/2015/0122.
3

Figure 1: Current and Planned DCFC Sites
Source: Alternative Energy Systems Consulting
4

The Electric Power Research Institute (EPRI) charging pyramid illustrates the relative amount of charging among home, workplace, and public venues (Figure 2). Most charging occurs at home and in the workplace. There are real and perceived needs, however, associated with public charging that are important to consider.
Figure 2: The Charging Pyramid
Source: EPRI
Recent surveys presented at the January 2015 Energy Commission ZEV Infrastructure Workshop4 suggest that actual implementation may be even more skewed away from public charging (Level 2 and DCFC) than the EPRI pyramid would suggest. Considering the current typical range of a battery electric vehicle (BEV) is about 80 miles, both real and perceived range limitations exist when public access charging infrastructure is limited. Moreover, the “public charging need” perception is an authentic phenomenon and is partially responsible for the notion of BEV “range anxiety.”
BEV drivers need the security of a comprehensive charging network to feel comfortable taking trips beyond typical daily commutes. Many EV advocates and early adopters that were interviewed expressed a vision of being able to take “leisure trips” to such places as Lake Tahoe or Las Vegas. A comprehensive DCFC network focused on public areas outside urban centers is a key hurdle that must be overcome before mass adoption can become a reality.
Corridors For this paper, corridors are interregional and interstate highway connectors. Corridors allow BEV drivers to travel between urban centers and destination areas. Key corridors must be
4 http://www.energy.ca.gov/2013-ALT-01/documents/index.html#01282015.
5

identified to construct a comprehensive DCFC infrastructure. DCFC stations must be sited along these corridors at specified geographical distances to provide a useful charging backbone. Other conditions that affect EV battery range, such as increased consumption due to changes in elevation, must be considered when evaluating distances between charging stations.
Stretches within the corridors are typically rural and underserved by existing DCFC infrastructure. It is anticipated that these areas will experience minimal usage until significant BEV market penetration occurs. Based on interviews with EV experts, usage is expected to increase over the next 5 to 10 years, based on the “build it and they will come” theory.
Since developing a commercial business case based solely on charger use fee collection is challenging, these rural and underserved areas will need the most initial public support.
With the possible exception of Tesla, the EV industry appears to lack the motivation to site DCFCs beyond metropolitan areas. To counteract these market forces, public agencies should concentrate funding on hard-to-reach corridors and rural sites. This focus will have the added side benefit of increasing PEV adoption in areas that often lack public transit and a sustainable transportation model.
DCFC Corridor Gap Analysis AESC’s first task was to identify and prioritize the current corridor gaps using data from UC Davis and NREL. UC Davis developed a sophisticated geographic information system-based (GIS) mapping system that identifies current and future DCFC demand. NREL developed a comprehensive GIS-based mapping system that identifies predicted corridor traffic volume. For this exercise, AESC used the UC Davis map to develop an initial set of corridors and rankings for further consideration. AESC then used the NREL traffic map to refine and prioritize the selected corridors.
The UC Davis model incorporates EV ownership location, existing charger usage, traffic patterns, vehicle range, and other key inputs. The results are regional usage intensity maps that can be used to identify areas with underserved DCFC charging station demand. AESC developed a corridor ranking system based on this predicted future demand and two additional criteria: the extent of existing charging infrastructure; and the proximity to a key north-south highway corridor. Each of the three criteria was evaluated on a scale of 0 to 1. Every interstate, highway, and state route that showed potential for future usage was evaluated on a county-by-county basis. The resulting values for the three criteria were weighted equally and summed, resulting in an overall scale of 0 to 3 for each segment. The higher the score, the greater the potential is for the DCFC to serve unmet demand.
These segment data were then “rolled up” into interregional corridors so that they could be ranked and compared. For example, the State Route 99 Sacramento-to-Fresno interregional corridor traverses five counties: San Joaquin, Stanislaus, Merced, Madera, and Fresno. (See Table 1 below.) AESC evaluated each county section independently and then averaged all counties within an interregional corridor into a combined ranking.
6

Table 1: Example of County "Roll-Up" Into Interregional Corridor
Source: Alternative Energy Systems Consulting
The NREL model incorporates Federal Highway Administration (FHWA) traffic data to determine accessibility or “visibility” to potential PEV drivers. AESC used the data to validate the routes identified in the initial analysis and to obtain final prioritization. The resulting dataset was used to form the basis of corridor recommendations.
Identifying and Selecting Corridor Gaps California is large and diverse. Microregions have unique requirements based on available resources and natural surroundings. For these reasons, it made sense to split the initial analysis into northern, central, and southern sections so that each region can be addressed specifically and consistently.
The authors identified applicable corridors using heat maps developed by UC Davis. The maps predict future PEV usage based on traffic patterns, EV concentrations, vehicle range, and existing infrastructure, among other metrics. AESC identified and categorized all the corridors that showed at least 5 percent of predicted future EV demand.
AESC used the UC Davis data, current infrastructure, and road type to develop a simplified trade study and weight the various corridor gaps (1 high – 4 low). The weighting process provided an objective, first-pass comparison of the corridor gaps based on the criteria described above.
Category level thresholds were chosen at natural breaks in the data. Corridors within the first level reside primarily along north-south routes and are potentially part of the California north-south corridor connection to the West Coast Electric Highway (WCEH) in Oregon and Washington. For this report, the authors will refer to this particular route as the “CalEV highway.” The second level consists of corridors that have high future demand and low existing infrastructure. Levels 3 and 4 include corridors that are less traveled or have higher levels of existing charging infrastructure.
AESC used the results to determine an initial list of targeted corridor gaps. Based on feedback from various experts, AESC selected corridors from the first two levels for further consideration. Tables 2 through 4 identify the full sets of corridor gaps excluding the metropolitan and predicted near-zero usage areas.
7

Table 2: Initial Full Set of Northern Corridor Gaps
Source: Alternative Energy Systems Consulting
8

Table 3: Initial Full Set of Central Corridor Gaps
Source: Alternative Energy Systems Consulting
9

Table 4: Initial Full Set of Southern Corridor Gaps
Source: Alternative Energy Systems Consulting
10

Categorizing and Prioritizing Selected Corridor Gaps AESC then worked with NREL to coordinate and prioritize these data with NREL’s heat maps. The NREL maps use a “visibility” metric5 developed from FHWA average annual traffic count data and Polk automotive sales data. This allowed AESC not only to confirm initial results, but to refine corridor prioritization based on federal data.
Interviewed experts tended to agree on 25- to 50-mile charge station spacing as the most appropriate for today’s BEV ranges. NREL and AESC used a midpoint, 33-mile6 geographical spacing in the analysis. As such, corridors were evaluated using 33-mile intervals except in cases where elevation and weather are a consideration, in which case the spacing was reduced appropriately. While closer spacing between stations would improve reliability of access for drivers, the total costs must be considered. Therefore, AESC recommends that the Energy Commission focus on seeding the infrastructure effort on many corridors rather than focus on being comprehensive on a few. Once stations are installed, the increased activity will have the effect of fostering new commercial opportunity in developing additional infrastructure.
AESC considered the extended range on the anticipated release of new BEVs such as the Chevrolet Bolt7. While the increased range will reduce the need for certain kinds of additional infrastructure, the full impact of the advanced technology will take many years to be realized. Increased demand for PEVs resulting from new models and bigger batteries will, in turn, increase the demand for charging stations on interregional corridors. Distributed charging provides a benefit in both low-adoption and high-adoption scenarios as dispersed resources will foster more choices for EV drivers.
In the initial analysis, all corridors were assessed concurrently with the CalEV highway connection routes, given a slight priority in the weighting algorithm. After discussion with the Energy Commission and other stakeholders regarding the importance of the California north-south corridor, it was decided to split the CalEV highway and “Other” routes and analyze them separately.
CalEV Highway The CalEV highway is defined as the north-south route from the Oregon border to the Mexico border. In Northern and Southern California, Interstate 5 (I-5) is the main artery for vehicle travel. However, within parts of the Sacramento Valley and San Joaquin Valley, there is another major freeway that runs parallel to I-5 known as State Route 99 (SR 99), and both routes offer attractive options for the CalEV.
5 The visibility metric indicates corridors with the largest volume of traffic, where DCFC stations would be accessible or “visible” to the most drivers. 6 NREL and AESC used 33 miles as a midrange value between 25-50 miles in the initial analysis. This value was used to determine the estimated number of required stations. 7 Chevrolet Bolt electric vehicle (See http://www.chevrolet.com/culture/article/bolt-ev-concept-car.html.)
11

In the authors’ analysis, AESC split the I-5 and SR 99 corridors into five segments starting at the Oregon border: 1) Oregon to Red Bluff, 2) Red Bluff to Sacramento, 3) Sacramento to Fresno, 4) Fresno to Wheeler Ridge (near the Grapevine), and 5) Wheeler Ridge to Santa Clarita. The analysis omitted the three major metro areas (Sacramento, Los Angeles/Orange County, and San Diego).
Table 5 illustrates the corridor routes by segment and the number of recommended sites (additional sites). The corridors were not prioritized because all routes are seen as critical infrastructure to the effort. The NREL visibility metrics are included for comparison. Alternate SR 99 routes were selected over the I-5 routes in segments two and three (Sacramento and San Joaquin Valleys). An explanation of the rationale behind this decision is in the Interstate 5 or State Route 99 section on page 18.
12

Table 5: Recommended CalEV Highway DCFC Sites
Source: Alternative Energy Systems Consulting
13

Interstate 5 or State Route 99 The CalEV highway could adequately navigate I-5 or SR 99 through the San Joaquin and Sacramento Valleys. The total travel distance from Red Bluff to Sacramento is 131 miles on I-5 and 127 miles on SR 99. The total travel distance from Sacramento to Wheeler Ridge is 306 miles on I-5 and 307 miles on SR 99.
Through the Sacramento Valley, SR 99 travels through the more densely populated cities on the eastern section and intersects Yuba City and Chico. The I-5 route traverses through the more rural agricultural landscape of the western side of the Sacramento Valley. Figure 3 illustrates this point.
Figure 3: Sacramento Valley Corridors
Source: Google Maps
14
Traffic on I-5 is anticipated to be twice the volume of the SR-99, according to the NREL visibility metrics. This is likely because I-5 is a more direct route for interstate traffic. The utility-level infrastructure is roughly equivalent for the two corridors, but the SR 99 route travels through more densely populated urban centers. The SR 99 route offers potentially more site candidates with a higher level of available amenities/conveniences and a higher likelihood of site electrical infrastructure necessary for DCFC operations. Based on usage potential and the outreach objectives of the CalEV, however, the significantly higher level of EV visibility and latent public awareness must take precedence over optimal siting. As a result, AESC recommends prioritizing I-5 over SR 99 for CalEV designation in the Sacramento Valley.
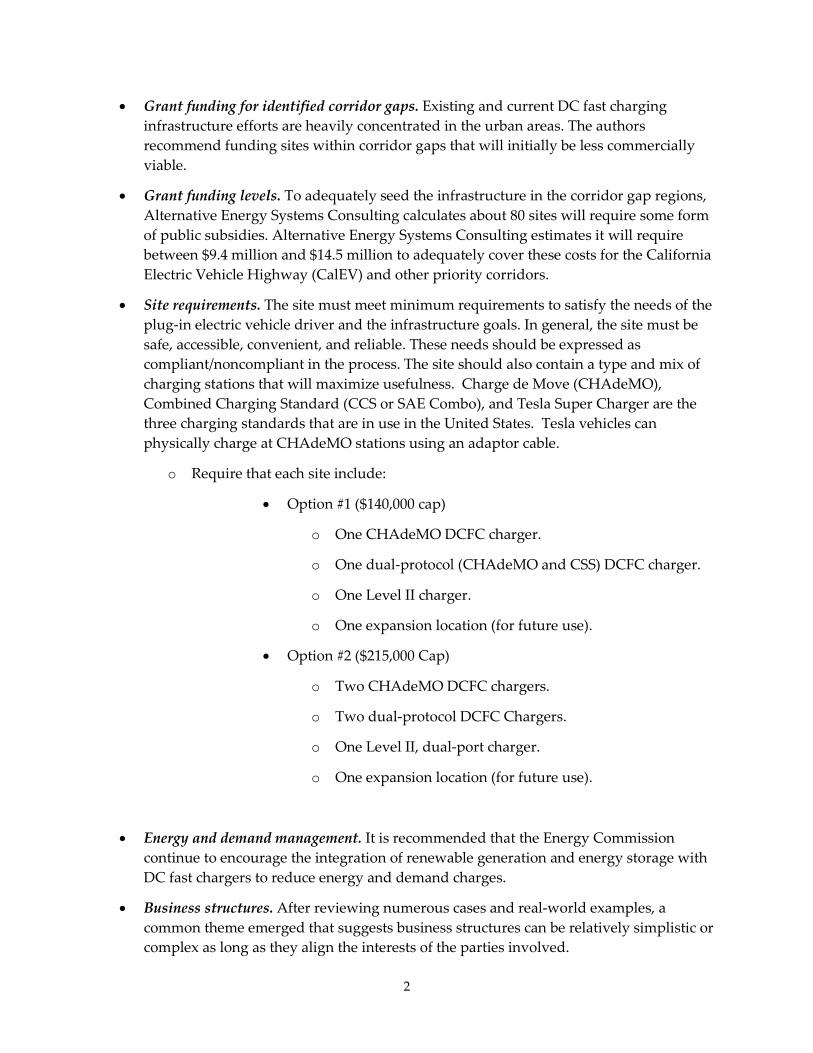
Through the San Joaquin Valley, SR 99 travels through the more densely populated eastern section, including Bakersfield, Visalia, Fresno, Madera, Merced, and Modesto. The I-5 route passes through a prevalence of rural agricultural landscape on the western side of the San Joaquin Valley, as Figure 4 illustrates.
Figure 4: San Joaquin Valley Corridors
Source: Google Maps
15

The traffic is higher on SR 99 in the San Joaquin Valley, according to the NREL visibility metrics, and based on existing infrastructure, fewer additional DCFCs are required. Local PEV drivers would also have greater access to recharging at the corridor DCFC stations. For these reasons, AESC recommends prioritizing SR 99 over I-5 in the San Joaquin Valley.
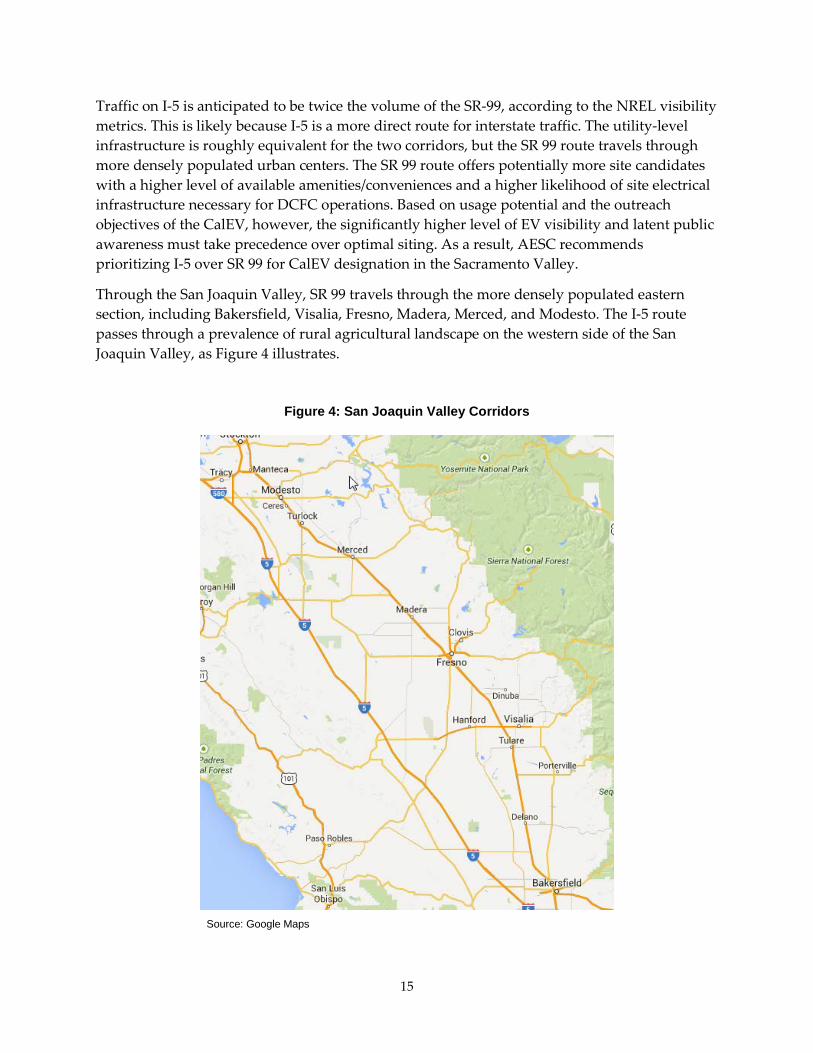
Segment 1 – Oregon Border to Red Bluff Segment 1 covers I-5 travel from the Oregon border to Red Bluff. AESC estimates that this corridor will require seven DCFC sites to adequately serve the projected BEV traffic. The southernmost site, Red Bluff, is covered in the subsequent segment. The Upstate PEV Regional Readiness Plan 8 has a detailed analysis of this corridor. One particular area of concern is the increased grade traveling from Redding to the city of Mt. Shasta. The elevation change is about 3,000 feet and increases the rate of depletion on the EV batteries. For this reason, the typical site separation distance must be considered closer to the 25-mile lower range. Mt. Shasta has one Tesla charging station. Because these chargers are proprietary to Tesla vehicles, the authors did not include them in the analysis.
8 (source: http://static1.squarespace.com/static/53764d9fe4b0cb63d6f97b20/t/546bbf05e4b02cdf60e99f49/1416347462203/Readiness+Plan)
16
Figure 5: Upstate Region Population Centers With <40-Mile Range
Source: The Upstate PEV Regional Readiness Report
AESC performed a top-level infrastructure analysis using Google Maps. According to these results, corroborated by the readiness plan, the potential siting locations include (all sites require additional chargers):
• Yreka • Weed • Mt. Shasta • Dunsmuir • Lakehead • Redding • Anderson
Segment 2 – Red Bluff to Sacramento Segment 2 covers travel on I-5 from Red Bluff to Sacramento. AESC estimates that the I-5 route will require an additional four sites.
AESC performed a special analysis of the electrical infrastructure on this corridor to ensure the required power was available throughout the rural sections. (See Table 6.) AESC reviewed
17

substation capacity, feeder capacity, and existing commercial infrastructure to assess the general siting potential. This additional task was performed on this segment to evaluate the I-5 and SR 99 alternates. The authors’ analysis indicates that there is adequate three-phase 480 volt power on both routes. This level of power is required by most DC fast chargers to operate effectively. This analysis also allowed the authors to determine appropriate siting locations and numbers. The potential siting locations include (all sites require additional chargers):
• Red Bluff. • Orland. • Williams. • Woodland.
18

Table 6: Electrical Infrastructure for Sacramento Valley Alternate CalEV Highway Routes
Source: Alternative Energy Systems Consulting
19

Segment 3 – Sacramento to Fresno Segment 3 covers travel on SR 99 from Sacramento to Fresno. The roads are relatively flat, so the minimum distance spacing applied when selecting site locations was closer to the 50-mile end of the range. AESC estimates that the route will require an additional three sites.
AESC performed a top-level infrastructure analysis using Google Maps. According to these results the potential siting locations include (bold indicates required additional chargers):
• Elk Grove (Energy Commission planned site). • Lodi. • Stockton East (Energy Commission planned site). • Modesto or Turlock. • Atwater (existing). • Merced (Energy Commission-planned site). • Madera.
Segment 4 – Fresno to Wheeler Ridge (the Grapevine) Segment 4 covers travel on SR 99 from Fresno to Wheeler Ridge. The roads are relatively flat, so the minimum distance spacing applied when choosing site locations was closer to the 50-mile end of the range. AESC estimates that the route will require three additional sites. One CHAdeMO DCFC already exists in Bakersfield. To serve all types of anticipated BEV traffic, however, an additional site needs to be installed in this location.
AESC performed a top-level infrastructure analysis using Google Maps. According to these results, the potential siting locations include (bold indicates required additional chargers):
• Fresno (Energy Commission-planned site). • Selma. • Tulare (Energy Commission planned). • Delano. • Bakersfield (existing CHAdeMO). • Wheeler Ridge (Energy Commission planned site).
Segment 5 – Wheeler Ridge to Santa Clarita Segment 5 covers travel on the I-5 from Wheeler Ridge to Santa Clarita. The road ascends and descends through the Tejon Pass, linking the San Joaquin Valley to Southern California. One particular area of concern is the change in grade traveling from either side of the mountain pass. The elevation change is nearly 2,750 feet, adding to significant drain on the EV batteries. For this reason, the typical site separation distance must be considered closer to the 25-mile end of the range.
AESC estimates that the route will require three additional sites. AESC performed a top-level infrastructure analysis using Google Maps. According to these results, the potential siting locations include (bold indicates required additional chargers):
20

• Grapevine (Tesla - Lebec; Energy Commission planned site – Wheeler Ridge). • Lebec or Gorman. • Castaic. • Santa Clarita.
“Other” Corridors Both the UC Davis and NREL heat maps identify additional high-potential EV corridors other than those occurring specifically on the CalEV highway. Many of these “other” corridors are important destination routes or freeway interconnectors. A good example is the Interstate 205/Interstate 580 between Dublin and Tracy. The NREL usage visibility metric for this route is a staggering 119,540 total vehicle miles traveled (VMT) normalized per mile.
As described earlier, AESC created an initial corridor listing from the UC Davis heat maps. NREL separately developed a heat map based on federal highway traffic and Polk BEV ownership data. NREL combined these two analyses to create a comprehensive list of corridors ranked by these visibility metrics. The visibility metric predicts which routes have the highest potential EV usage based on traffic patterns and EV ownership location data. AESC developed a third metric, “perceived driver preference,” to incorporate subjective driving preferences expressed by electric vehicle stakeholders such as PEV readiness personnel and BEV advocates. For example, those surveyed expressed an elevated interest in interstate and destination travel. AESC also took into consideration the available infrastructure on the corridor routes. For instance, Interstate 15 in San Bernardino scores high in the priority based on traffic, but it requires six DCFC site locations through some sparsely populated desert passes. This relegates this corridor to a lower priority than what the raw traffic data would suggest.
In the final analysis, the authors removed the three section designations of the state (that is, north, central, and south). This split was intended to allow examination of each section of the state separately on its own merits. Because the perceived driver preference metric was introduced, however, regional and state preferences were comprehensively applied instead.
Table 7 illustrates each corridor and the number of recommended sites. The number of sites is based on a straight 33-mile separation (mean of the 25-50 mile recommended range). AESC used natural breaks in the visibility metrics to establish visibility priority and the subjective ratings in perceived driver preference to develop the perceived driver preference priority. These two values were overlaid using equal weighting to derive a combined priority. As a result, AESC recommends the following corridors in order of priority.
21

Table 7: "Other" Corridors by Priority
Source: Alternative Energy Systems Consulting
22

23
CHAPTER 2: DCFC Infrastructure Requirements Site Requirements The selected locations must meet a minimum level of criteria to satisfy the needs of the site host, the PEV client, and the infrastructure goals. Selected locations, whether privately or publicly owned, must be safe, accessible, convenient, and reliable.
Configuration Based on conversations with various experts, AESC recommends two options for site configuration.
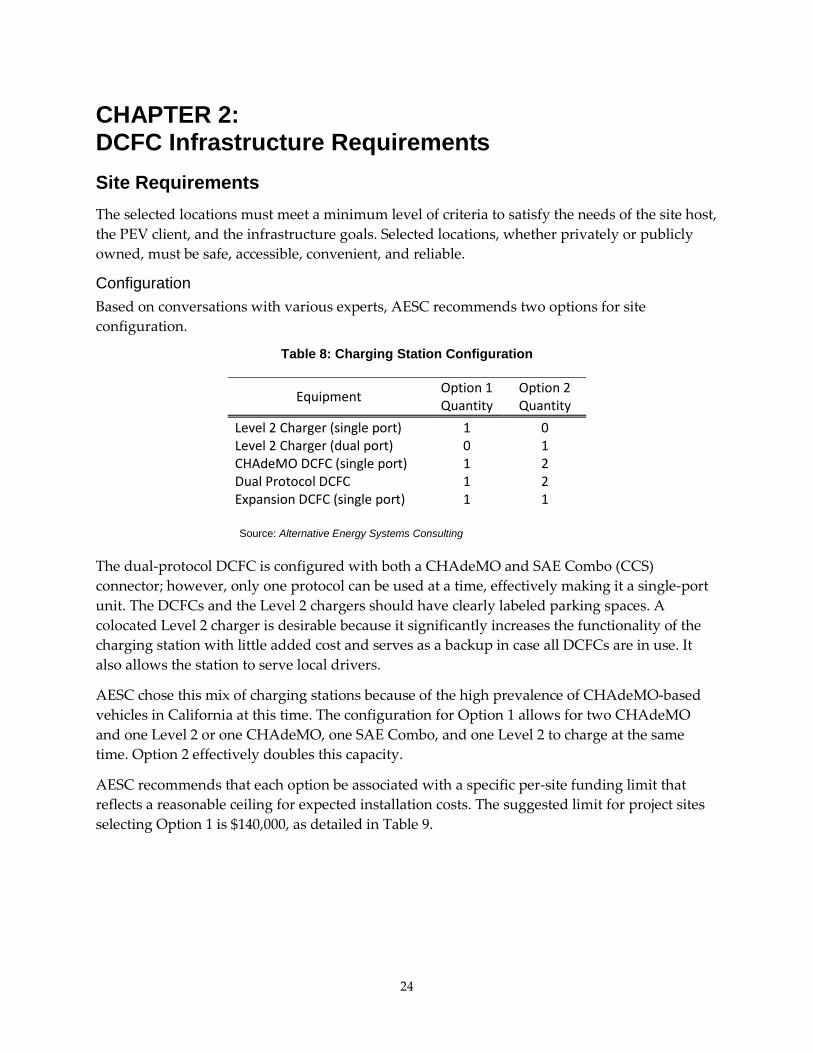
Table 8: Charging Station Configuration
Equipment Option 1 Quantity
Option 2 Quantity
Level 2 Charger (single port) 1 0 Level 2 Charger (dual port) 0 1 CHAdeMO DCFC (single port) 1 2 Dual Protocol DCFC 1 2 Expansion DCFC (single port) 1 1
Source: Alternative Energy Systems Consulting
The dual-protocol DCFC is configured with both a CHAdeMO and SAE Combo (CCS) connector; however, only one protocol can be used at a time, effectively making it a single-port unit. The DCFCs and the Level 2 chargers should have clearly labeled parking spaces. A colocated Level 2 charger is desirable because it significantly increases the functionality of the charging station with little added cost and serves as a backup in case all DCFCs are in use. It also allows the station to serve local drivers.
AESC chose this mix of charging stations because of the high prevalence of CHAdeMO-based vehicles in California at this time. The configuration for Option 1 allows for two CHAdeMO and one Level 2 or one CHAdeMO, one SAE Combo, and one Level 2 to charge at the same time. Option 2 effectively doubles this capacity.
AESC recommends that each option be associated with a specific per-site funding limit that reflects a reasonable ceiling for expected installation costs. The suggested limit for project sites selecting Option 1 is $140,000, as detailed in Table 9.
24

Table 9: Recommended Funding Limit for Option 1
Source: Alternative Energy Systems Consulting
For sites where Option 2 is selected, the suggested funding limit is increased to $215,000 to account for increases in material and labor costs.
Table 10: Recommended Funding Limit for Option 2
Source: Alternative Energy Systems Consulting
The costs used to determine the limits for Options 1 and 2 represent the maximum expected costs of installation and equipment. Specific site conditions, however, may result in significant deviations from estimated costs. Price ranges were determined through a combination of interviews with industry experts and by using information contained in PEV regional readiness reports.
25

It is expected that a significant portion of the costs will be associated with installing a new transformer to handle the anticipated load for the charging station. A portion of this load includes the eventual installation of a 100-kilowatt (kW) DCFC in the expansion port (stub out), which should be accounted for in the transformer sizing calculations. A rough breakdown of expected transformer size for each option is provided in the following tables, but actual values will vary depending on the choice of equipment selected by the contractor.
Table 11: Transformer Sizing for (a) Option 1 and (b) Option 2
Source: Alternative Energy Systems Consulting
Source: Alternative Energy Systems Consulting
Location The site should be within one mile from a highway interchange. It should have appropriate paved parking and reasonable ingress/egress points, as well as sufficient available area to support multiple charging-only spaces.
26
New Construction It is simpler to design a new DCFC station from an electrical and accessibility standpoint than retrofit an existing location. For this reason, the authors recommend that new construction sites also be considered.
Facilities The site should ideally have 24-hour access to a well-maintained and illuminated restroom. The restroom should be supplied with municipal water and have a clean and operable drinking fountain.
Safety The site should have dusk-to-dawn area lighting and have a reasonable level of activity. The site must also have shelter for inclement weather.
Public Amenities The site should ideally have basic amenities such as vending, snacks, or fast food. Full-service amenities such as restaurants or retail shopping within a reasonable walking distance are preferred.
Electric Power Access to existing, nearby 480 V three-phase power is preferable. The local grid must have adequate capacity to serve the site and all the chargers.
Energy and Demand Management As infrastructure is deployed to support the continued adoption of PEVs, the integration of renewable generation and energy storage play an increasingly important role as a way to address the increasing cost of electricity. While the installation of solar and energy storage increases the upfront cost of EVSE installation, the long-term benefits of reduced demand and energy costs could make the economic case more attractive given current electric rates.
The utilities are looking at various strategies for billing EV charging and have implemented pilot programs that could lead to new electric rate schedules for EVs. However, EV rates for nonresidential customers are available only in SCE territory at this time, and the existing rate structures vary greatly from one utility to another. SCE offers EV rates to its residential and nonresidential customers with the energy costs as high as $0.36/kWh9 during summer on-peak periods and demand charges ranging from $7.23/kW10 to $13.20/kW11. PG&E and SDG&E customers are billed according to existing rates, which may include demand charges. Demand charges are levied in PG&E when a customer’s demand exceeds 200 kW. A customer in PG&E territory whose demand is expected to exceed 200 kW and remain under 50 kW expects to pay
9 Southern California Edison has three EV rates. TOU EV 3 A & B and TOU EV 4. 10 SCE TOU EV 3 B demand charge during all times of day is $7.23/kW. 11 SCE TOU EV 4 demand charge during all times of day is $13.20/kW.
27
$0.15/kWh and about $15/kW12. In SDG&E territory, if a facility is expected to exceed 20 kW, it will be put on a general service, time-metered rate schedule and will incur demand charges. Otherwise known as AL-TOU13, this tariff is defined as being applicable to all metered nonresidential customers whose monthly maximum demand equals, exceeds, or is expected to equal or exceed 20 kW. The noncoincident demand (15 minute instantaneous demand unrelated to time of day) charge is about $24/kW, and the peak demand charge is about $10/kW.
Integration of renewable generation—specifically solar photovoltaic (PV) systems—decreases billed energy consumption and helps reduce system electric demand. According to the 2013 EV Project14 report, the average number of charge events at a public DCFC station per week is about 16, or 2.3 charge events per day, and the majority of charging events required fewer than 12 kWh. Based on the data, the authors find that a PV system would need to produce up to 10,000 kWh per year to satisfy the observed DCFC usage patterns. A 6 kW15 PV system can produce enough energy to offset the charging requirement and would cost about $16,00016. If the site applies the net energy metering17 (NEM) tariff, all energy generated by the PV system can offset the energy used to charge EVs by generating credits. For example, a PV system this size located in SDG&E territory could help avoid up to $1,00018 of energy costs and up to $3,60019 of energy costs in PG&E territory.
Integrating grid-tied energy storage systems also allows for demand reduction benefits. The electric energy stored in the battery energy storage system (BESS) can be supplied by the electric utility during periods when electric rates are the cheapest (off-peak) or supplied by the renewable energy resource (such as PV). BESS can be configured to reduce utility peak, maximum, or noncoincident demand costs by targeting periods of high usage during the day or night. Furthermore, energy storage can be used to limit demand spikes such that a customer is not pushed into a demand metered rate schedule in SDG&E and SCE.
12 The values stated here are based on PG&E’s electric schedule A-10. 13 Schedule AL-TOU time of use tariff 14 EV PROJECT – The EV project enrolled Nissan Leaf and Chevy Volt drivers into the program to analyze their driving and charging behavior. The charging infrastructure includes 200 DCFC, and recent reports speak to the use of them. http://avt.inl.gov/evproject.shtml 15 PVWatts is an online-based software that models the output of solar PV systems. This software was used to calculate the system size required to produce the energy needed to offset energy consumed by the EVs. The DC system size was found to be 6kW and has systems losses of 14 percent, a tilt of 20 degrees, and an azimuth of 180 degrees. 16 PVWatts – $2.60/Wdc; this is the value automatically populated by PVWatts when a commercial PV system is selected. 17 Net metering is a billing mechanism that credits solar energy system owners for the electricity they add to the grid. (See http://www.seia.org/policy/distributed-solar/net-metering) 18 The savings is based on avoided energy costs in SDG&E’s AL-TOU rate schedule. 19 The savings is based on avoided energy costs in PG&E’s A-6 rate schedule.
28

Based on the 2013 EV Project report, the maximum charge power required by an EV was 50 kW20, but these events occurred only 1 percent of the time. The vast majority of all other charging events required between 20 kW and 35 kW of power. Using the maximum value of 50 kW as a design criterion for an energy storage system, the authors can approximate a system cost of $55,00021. This energy storage system could provide various levels of demand reduction up to 50 kW and would have enough energy to offset up to 100 kWh of energy required for DCFC operations when combined with the PV generation. Using the same DCFC usage assumptions, this 100 kWh/50 kW BESS could effectively manage demand charges. The avoided demand charges based on $24/kW (SDG&E AL-TOU) could result in $480-$840 savings per month or $5,760 to $10,080 annually. On the other hand, the same system installed in PG&E territory and billed according to the A-6 tariff would see no demand charge offsets since there is no demand component to the A-6 rate schedule.
The high cost of implementing distributed energy resources (DERs)22 remains a critical consideration, but there are incentives to help offset these costs. The federal investment tax credit (ITC)23 for residential renewable energy is offered at 30 percent and could be leveraged to offset the PV costs. Moreover, the California Public Utilities Commission’s Self-Generation Incentive Program (SGIP) offers an incentive of $1,460/kW for energy storage with a cap of 60 percent of project cost, and the utilities offer a net energy metering (NEM) program, although it will close by July 2017. If these credits and incentives are fully realized, the cost of the PV system could be reduced to $11,200 and the BESS to $11,000. The simple payback based on this analysis results in 11.224(SDG&E) years and 3.125 (PG&E) years for the PV system and 3.826(SDG&E) years for the energy storage system.
The above sections illustrated the economic benefit of PV and BESS applications, respectively. The integration of both PV and BESS to DCFC stations are increasingly desired as the system can provide a wider range of operational flexibility and reliability. Furthermore, independence from ever-increasing electric rates will improve the economic viability of DCFC operations in the long run by providing a form of insurance against possible future rate hikes. As the price of
20 EV Project ( http://avt.inl.gov/evproject.shtm) 21 Battery cost and resource: A BESS rated at 100kWh/50kW could cost about $55,000 based on an assumed cost of $550/kWh. 22 The California Energy Commission defines distributed energy resources as small-scale power generation technologies (typically in the range of 3 to 10,000 kilowatts) located close to where electricity is used (for example, a home or business) to provide an alternative to or an enhancement of the traditional electric power system 23 A taxpayer may claim a credit of 30 percent of qualified expenditures for a system that serves a housing unit in the United States that is owned and used as a residence by the taxpayer (See http://energy.gov/savings/residential-renewable-energy-tax-credit.) 24 This return on investment (ROI) is based on the avoided electric cost of $1,000 per year in SDG&E territory. 25 This ROI is based on the avoided electric cost of $3,600 per year in PG&E territory. 26 This ROI is based on the avoided demand cost of $5,760 per year in SDG&E territory.
29

DERs continues to decline, the authors anticipate that more vendors will integrate DERs with their DCFC stations to reap the value that they provide.
DCFC and Areas With Limited Utility Infrastructure DCFCs proposed in remote areas may require additional considerations if the site lacks access to three-phase power. The cost of bringing three-phase power to a new location is costly; it can run from $15,000 to $30,000 per mile. Therefore, alternative options such as a single-phase system or off-grid systems combined with renewables and/or energy storage systems may make sense in certain critical corridors with limited electrical infrastructure.
Single-Phase Systems DCFCs can be successfully integrated with renewable generation and energy storage, where three-phase power is available. The installation of renewables in an area without three-phase utility power is possible but presents several challenges. First, the cost of upgrading to three-phase power is high and may not be financially viable. The number and variety of equipment that can operate on single-phase power are also scarce. According to energy storage manufacturers, the technology exists to allow the simultaneous charging of batteries from both a renewable energy source and the electric grid. Commercial solutions are not presently available, however, that allow single-phase charging of a large-scale energy storage systems. Manufacturers agree that the primary reason for lack of single-phase compatibility is market demand. Most customers interested in energy storage are large commercial customers with available three-phase power or residential customers with PV systems that allow for DC charging of the battery systems.
All commercially available DCFC systems operate on three-phase power in the United States. A single-phase powered DCFC system may become available in the near future. Siemens/Efacec and Valent Power are developing a single-phase DC quick charger rated at roughly 24-30 kW. These quick chargers will be equipped with SAE combo or CHAdeMO connectors and are designed to be powered from either three-phase 208 volt or single-phase 240 volt at nearly 100 amps. The chargers are expected to obtain ETL/UL certification early 2016 and to become commercially available shortly thereafter. Furthermore, research organizations such as the Electric Power Research Institute (EPRI) have already started evaluating new technologies that will allow low-voltage DCFCs.
Off-Grid System For areas with no access to utility infrastructure, self-contained vehicle charging solutions are now available on the market. These products are off-grid and combine solar PV with integrated BESS that is then connected to an electric vehicle through an EV charging unit. For example, SDG&E is proposing an off-grid system with solar canopies in Aliso Creek, where three-phase power is not available27.
27 PEV Infrastructure Proposal to California Energy Commission, SANDAG and Caltrans District 11.
30

When installing the energy storage and PV as an off-grid solution, they should be sized sufficiently large to provide a reasonable level of reliability. The cost of installing a reliable, independent off-grid DCFC system powered by solar and energy storage system can become significant but may be relieved, to some extent, by federal tax credits and state incentives.
31

CHAPTER 3: Funding Requirements and Strategies While it’s clear that the fast charging infrastructure is needed to unlock the full potential of the EV market and connect urban centers, there is less enthusiasm about the business case in more remote and less traveled corridors. To this end, AESC will devise a framework that will act as basis for various business strategies and will suggest ways to compress the cost of operating the DC stations. A key element is the importance of stakeholder collaboration and alignment of objectives. There are many benefits that could result from DCFC station deployment beyond charging revenues.
Cost Parameters The annual operation costs consist of the following parameters:
• Demand Charges: The demand components of electric tariffs can exceed $30/kW; EV tariffs like those in SCE territory have demand cost components of roughly $13/kW. If only Nissan Leafs charged at the proposed sites, the demand costs would be at least $400 per site; the annual demand costs per station if used just once a month will be about $4,800/year. A Tesla Model S would result in demand charges increasing to about $1,500 per month per site, with annual costs of about $18,000 per site.
• Energy Charges: The energy component of electric costs varies greatly by tariff and utility. Using the example EV tariff ($0.30/kWh) and EV (Nissan Leaf), the energy cost component of charging is about $7 per charge during summer on-peak period. If each of the proposed 60 DCFC sites had only one Leaf charge for just half of the year, the annual energy costs would be about $1,300/year/site.
• Meter Charges: ~$200/month per commercial meter. • Annual Maintenance: $300-$3,000/year28 • Cost of Equity
Revenue Parameters The revenue opportunities consist of the following parameters:
• Manufacturing and sales • Operations and maintenance • Installation • Value-added services • Energy premiums
28 Take Charge: A Roadmap to Electric New York City Taxis, NYC Taxi and Limousine Commission, December 2013; UCLA Luskin Center Financial Viability of Non-Residential Electric Vehicle Charging Stations, Snyder, Chang, Erstad, Lin, Rice, Goh, Tsao, August 2012)
32

• Fee-based charging (per minute, per hour, per session): Typical $9-$15/hour ($0.15-0.25/minute) for DCFC – Service based on time rather than energy delivered
• Network fees • Asset utilization • Partnerships and sponsorships
Framework for the Business Structures As mentioned earlier, the key to fostering healthy growth of the EV infrastructure market is an alignment of interests among the various stakeholders and market participants. Since there are numerous barriers to profitability in the remotely located DCFC infrastructure, innovative strategies to fill the DCFC station gaps need to be considered.
Constraints Aside from the costs associated with operating the DCFC infrastructure, there are other constraints on profitability. The operational characteristics and low use of remotely located DCFCs limit meaningful revenue generation from charging alone. Additional restrictions may be placed on the for-profit models if, by chance, the proposed public DCFC stations are operated “free-of-charge.”
Also, when electric infrastructure upgrades are necessary for DCFC installation, the costs can be prohibitive.
Cost Compression A key to overcoming these financial gaps is cost compression. One particular strategy is the effective use of electric rates/tariffs. The statewide Renewable Energy Self-Generation Bill Credit Transfer (RES-BCT)29 tariff allows local governments to generate electricity at one account and transfer any available excess bill credits (in dollars) to another account owned by the same local government. The idea is to use existing or planned local government renewable generation to offset energy cost at DCFC sites. By addressing the energy-billing component of EV charging in this manner, more focus can be placed on demand management. In SDG&E’s service territory, the DG-R tariff is offered to customers with distributed generation capacity that is equal to or greater than 10 percent of their peak annual load. When this occurs, it unlocks the benefit of lower demand and energy charges in the range of $12/kW and $0.05/kWh. In this scenario, a developer could install the required PV capacity at the DCFC site to gain access to these lower rates. Finally, EV charging tariffs are being introduced throughout the state and offer reduced demand billing components. These should be thoroughly examined alongside prevailing tariffs.
Partnerships Partnerships are an effective way to highlight the benefits of multiple technologies and features. They are mutually beneficial and bring value such as access to new markets, better financing
29 These RES-BCT tariffs allow local governments to generate electricity at one account and transfer any available excess bill credits (in dollars) to another account owned by the same local government.
33
terms, stronger buying power, and so forth. On the public side, a partnership in the DCFC infrastructure highlights a local government’s willingness to participate in an innovative economy while addressing local economy needs and local climate action plans.
Along these lines, the DCFC infrastructure needs partnerships similar to the first gas stations that aligned shopkeepers and oil companies at the turn of the 20th century. In keeping with this well-established business model, eVgo partnered with Green Charge Networks (advanced energy storage manufacturer) to deploy energy storage systems at eVgo Freedom Stations. In a similar move, Panasonic teamed with Powertree to build solar/storage EV chargers that will be deployed throughout San Francisco.
Other partnerships include NRG eVgo and BMW, who are collaborating to provide expanded access to DCFCs in key markets throughout the country. Also, BMW and Volkswagen recently teamed up with Chargepoint to develop DCFCs along the East and West Coasts on certain corridors.
Clearly, as stakeholders consider the various market participants, they want to be aware of potential partnerships and remember that they are an excellent way to generate value beyond simple commodity transactions.
Identification of Market Participants and Roles In this section, the authors introduce a common vocabulary for discussing various business cases. The market participants are outlined in Table 12 below. By providing a list of basic functions and market actors/stakeholders, the authors can more readily begin to identify ways to configure each of the parts into logical business structures.
34
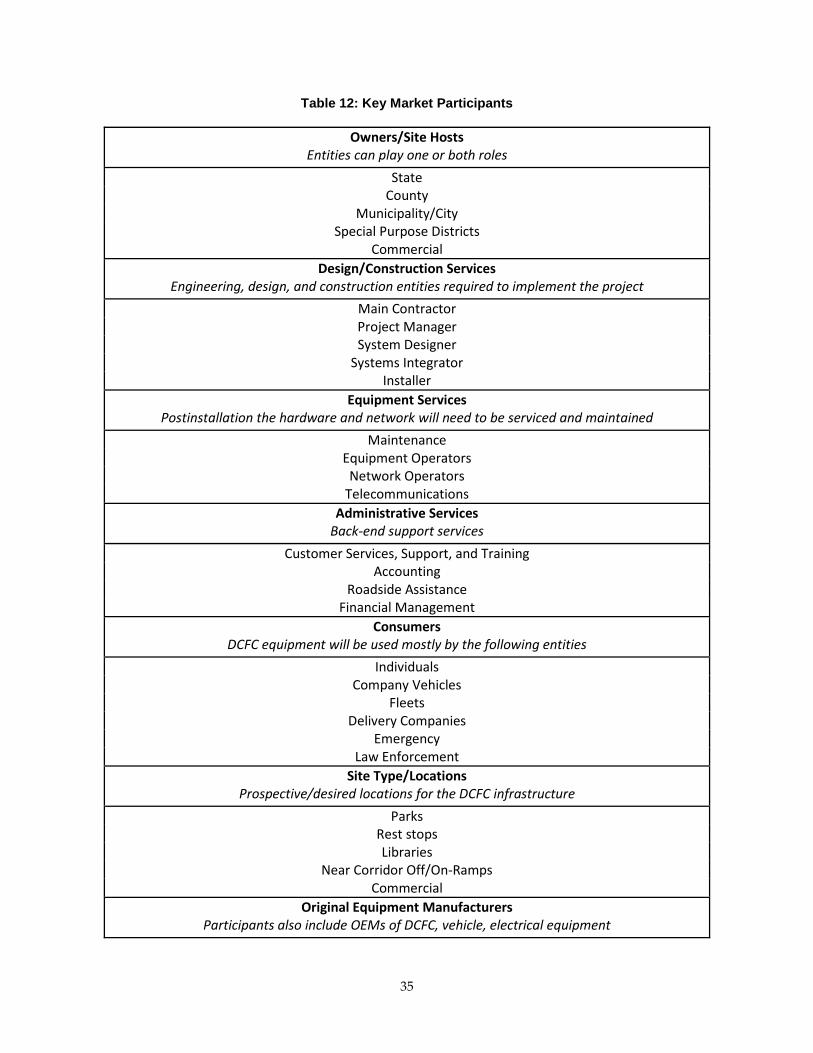
Table 12: Key Market Participants
Owners/Site Hosts Entities can play one or both roles
State County
Municipality/City Special Purpose Districts
Commercial Design/Construction Services
Engineering, design, and construction entities required to implement the project Main Contractor Project Manager System Designer
Systems Integrator Installer
Equipment Services Postinstallation the hardware and network will need to be serviced and maintained
Maintenance Equipment Operators
Network Operators Telecommunications
Administrative Services Back-end support services
Customer Services, Support, and Training Accounting
Roadside Assistance Financial Management
Consumers DCFC equipment will be used mostly by the following entities
Individuals Company Vehicles
Fleets Delivery Companies
Emergency Law Enforcement
Site Type/Locations Prospective/desired locations for the DCFC infrastructure
Parks Rest stops Libraries
Near Corridor Off/On-Ramps Commercial
Original Equipment Manufacturers Participants also include OEMs of DCFC, vehicle, electrical equipment
35
Business Structures The following information describes example business structures for market participants involved in DCFC deployment. The authors have outlined the business structure, including project delivery and responsibilities, and pros/cons.
Public/Public Business Structure In Case 1, the ownership structure type is public/public. This means:
• The assets and site location are publicly owned.
• The nonprofit is the main point of contact that coordinates all of the efforts on behalf of the interested parties. The nonprofit:
o Oversees development of projects.
o Coordinates with counties and cities.
o Obtains permits and other necessary approvals.
o Manages day-to-day operations.
o Needs to understand permitting requirements or at least be familiar with permitting processes.
o If procuring utility services, needs to have interconnection experience.
o Should have a good understanding of the EVs and EV infrastructure.
• In day-to-day operations, the nonprofit is supported in its efforts by the operators that perform the services mentioned in the previous section. The operator can be a single entity or multiple entities that specialize in the service provided.
• The project will be designed and built by a third-party entity selected by the owner or nonprofit.
36

Figure 6: Public/Public Organizational Chart
Source: Alternative Energy Systems Consulting
Pros/Cons The pros of the public/public model include the following:
• The nonprofit takes on major overseeing role in lieu of the government(s).
• The nonprofit acts on government’s behalf during procurement.
• There is potentially no fee to charge.
• It’s mission driven.
• The nonprofit could create other opportunities for funding.
The cons for the public/public model include the following:
• It could be difficult to contract with an entity to provide all the needed operation services.
• The nonprofit could create inefficiencies in the process due to additional layer of oversight.
• The nonprofit may not be technically savvy.
Public/Private Business Structure Business Case 2 is similar to Case 1, however, without the nonprofit. In this case:
• The public owns the asset.
37

• The main contractor operates of the EV stations. The operator/main contractor:
o Oversees development of projects with government entity.
o Coordinates with counties and cities.
o Obtains permits and other necessary approvals.
o Manages day-to-day operations.
o Needs to understand permitting requirements.
o Equipment operation, administration, and construction are performed by a separate company, but as a sub to main contractor.
• The project will be designed, built, and operated by a third party selected by the public owner.
This model is a replica of the structure used in Estonia’s ELMO project.
Figure 7: Public/Private Organizational Chart
Source: Alternative Energy Systems Consulting
Pros/Cons The pros of the public/private model include the following:
• The operator meets necessary technical prerequisites.
• It’s the most streamlined business case.
38

• Government interacts directly with the operator, bringing closer alignment.
• Government procures the entire solution/infrastructure in a single transaction.
• There are centralized negotiations of utilities, sites, and approvals.
• There are streamlined planning and execution of project and phases.
• There is possible access to free charging through stakeholders (such as automakers).
• It’s mission driven.
The cons for the public/private model include the following:
• It requires governments to manage extra efforts and could be burdensome.
• It could be difficult to contract with an entity to provide all the needed services.
Private/Private Business Structure Case 3 is an all-private business structure. There is no local government ownership of asset or land. The assets and land lease deals are wholly controlled by the private entity that owns and operates the infrastructure. Partnerships may be developed to provide the various services required to manage and operate the infrastructure. The private operator:
• Oversees development of projects.
• Coordinates with counties and cities.
• Obtains permits and other necessary approvals.
• Manages day-to-day operations.
The project will be designed, built, and operated by a third party selected by the private owner.
39

Figure 8: Private/Private (Type 1) Organizational Chart
Source: Alternative Energy Systems Consulting
Pros/Cons The pros of the private model include the following:
• The owner/operator meets necessary technical prerequisites.
• There is a streamlined business case.
• There are centralized negotiations of utilities, sites, and approvals.
• There are streamlined planning and execution of project and phases.
• A private entity is motivated to reduce costs as much as possible.
• The owner/operator procures the entire solution/infrastructure in a single transaction – in this case since the OEM is the owner, there are efficiencies that cannot be realized in other business cases, potentially driving down costs.
• After a period, the sites could become fee–based, and that transition would be more efficient without the government ownership of assets.
40

The cons for the private model include:
• Limited government interaction.
• Less oversight.
• Not mission driven.
• Infrastructure decisions made unilaterally.
• Service quality and decisions made unilaterally perhaps with cost-reductions in mind and not with quality of service in mind.
• Need to ensure that the owner is financially liable without the contract – company needs to last as long or longer then the asset.
Private/Private (Alternate Project Delivery) Business Structure Case 4 is also an all-private business structure. It is the same structure as Case 3 with an alternate project delivery. The owner/operator designs the project and puts the construction service out for bid. Since these are separate entities, the process needs to be managed.
Figure 9: Private/Private (Type 2) Organizational Chart
Source: Alternative Energy Systems Consulting
41

Pros/Cons The pros and cons are the same as Case 3. The only additional con is the need for an additional level of management over the construction contractor.
Summary The base case business structures described above illustrate the innovative ways various stakeholders can be aligned. Since projects will be implemented in various counties and cities, however, considerations are needed to encompass differences in permitting, utility requirements, and other factors. The EV Norway project30, the ELMO31, and the Netherlands ElaadNL/EVnetNL & FASTNED32 infrastructures have all successfully implemented countrywide charging infrastructures. In each of these cases, the business strategies achieved the right balance of value while meeting the project objectives and connecting the interests of the stakeholders. For this reason, in lieu of recommending a specific business structure, the authors return to the original thesis, that alignment of interest is paramount to fostering growth of the DCFC infrastructure.
EV Norway Norway has developed a charging infrastructure business model that is most similar to the public/private structures described earlier. The Norwegian government funds or cofunds investment in the infrastructure, and the private sector assumes the ownership and operating responsibilities Specifically, the charge points are developed by Transnova and several municipalities, registered in a national database called Nobil, and owned/operated by various market participants.
30 (source: www.evnorway.no) EV Norway is the name given to the Norwegian national EV charging infrastructure. Today, EV Norway charging infrastructure consists of 6,557 charge points distributed throughout the country.
31 (source: Fast Charging Network for Electric Cars Project "ELMO" in Estonia - Steven Dorresteijn, ABB Group, 29 jan 13; elmo.ee) The Estonian Electricmobility (ELMO) Program is Estonia's effort at establishing a national grid of electric vehicle charging stations. Today, ELMO consists of nearly 163 chargers.
32 (sources: http://www.elaad.nl/organisatie/over-ons/about-us/; http://www.evnet.nl/organisatie/; http://www.fastned.nl/en) The Netherlands has arrived at its EV charging infrastructure in a slightly less concerted effort then the previous two examples. On one side there are organizations like ElaadNL and EVnetNL that are funded by a consortium of electric infrastructure OEM's. ElaadNL is the private entity that coordinates the deployment of public charging infrastructure and interconnection. EVnetNL provides management, maintenance and troubleshooting of the equipment. The ElaadNL/EVnetNL infrastructure boasts about 300 public charging stations.
42

ELMO ELMO is another example of the public/private business model. In this case KredEx, a credit guarantee agency under the jurisdiction of the Ministry of Economic Affairs, owns, organizes and manages the support scheme for the EV infrastructure. ABB, an EV equipment manufacturer, bid and won a contract to supply, install, and commission the EV charging stations, as well as administer the system. ABB partnered with NOW! Innovations and G4S to provide complete systems and service operations.
Netherlands On a slightly different path, there is FASTNED, which is also a private entity and has partnered with ABB and has installed 28 charge stations with multiple chargers at each station. Its goal is to install one station per week until it reaches at least 201 stations throughout the country. Interestingly, the FASTNED network is crowd-funded with 4 million shares outstanding, and each share can be purchased for 10 euro. The FASTNED stations have at least two fast chargers with all fast charging standards, free Wi-Fi, fully covered by solar-paneled roofs, security cameras, and multiple payment options. FASTNED runs all operations from beginning to end and is one of the few wholly contained EV infrastructure developers. A key component that makes the FASTNED plan viable is that it has already secured concession rights to realize and operate the 201 fast charging stations for 15 years.
Funding Requirements As previously stated, making a profitable business case for DCFC is difficult, even in highly used areas. Without exception, all the entities contacted indicated that they would need the installation and equipment cost covered to site any of the corridor gaps where usage would be sparse at the onset. Most of the entities (EVSPs, governmental agencies, and regional bodies) indicated that they would need subsidies to support ongoing operations and maintenance. This was especially true of the not-for-profit entities. Some of the commercial entities indicated that they may be able to get subsidies from external sources such as the Nissan “no charge to charge” program. According to some sources, the sale of charge time covers only ~25-30 percent of the costs of operations. This varies widely based on the cost of electricity by utility and peak demand charges.
Installation and Equipment Costs It’s difficult to estimate specific installation and equipment costs based on varying equipment configurations and site conditions. Experts interviewed estimate an installed cost of $50,000 to $100,000 for a typical DCFC station with at least two ports. Solar generation and battery storage add significantly to the cost of the installation. Some superstations including full battery storage, solar, and up to eight ports can cost from $250,000 to $1,000,000. However, after numerous conversations, AESC has determined an approximate figure of $140,000 to $215,000 per site for the recommended configuration options. This does not include solar or battery storage, but those additions should be considered separately.
43

Through the PEV Infrastructure workshop and subsequent contact, stakeholders have identified several grant funding scenarios, including first costs subsidy, operation and maintenance support, and site assessment support.
First Costs Subsidy According to UCLA’s Luskin Center and many other stakeholders, return on investment is marginal even at the most used sites. Using a model purely based on the income from the sale of energy, the margin between revenues and expenses is low, which makes recovering first costs difficult. The reality is that equipment and installation costs, while dropping, are still at very high levels. To make a business case for the more remote—and initially less used–sites, the site host will need assistance to cover the significant upfront costs. For instance, it is expected that most public/public and public/private entities would need installation and equipment cost to be fully covered to make an investment. The expert consensus on the “willingness threshold” indicates that initial capital costs need to be fully covered with little or no cost share.
Operation and Maintenance Support Many of the public and quasi-public entities that AESC interviewed agreed that having operation and maintenance cost subsidized in the first couple of years would help the financial situation for smaller jurisdictions. There appeared to be a consensus, however, that operation and maintenance support was not critical. For instance, a small regional authority indicated that the operation and/or maintenance could be accounted for in public infrastructure funding.
Site Assessment Support Several stakeholders suggested that public support could be best used in helping local jurisdictions defray the costs associated with site identification and assessment. While these are real costs and site selection is a real barrier to implementation, AESC feels that these are somewhat outside the scope of the intended focus of this effort. The hope is that the competitive nature of the process will yield proposing entities that have the necessary experience and wherewithal to develop a legitimate site assessment process. Moreover, the Energy Commission and other government entities have funded numerous studies with the various PEV regional readiness groups. Many of these studies go to great lengths to identify and rate potential sites.
Funding Summaries It is AESC’s recommendation that the Energy Commission consider covering installation and equipment costs with a small match requirement for less remote sites. The process should be used to encourage bidders to develop innovative ways to build a business case to support operation and maintenance (O&M). This could potentially take the form of teaming with outside entities such as automakers to provide subsidies or use advertising/marketing/social benefits to build the business case.
As described above, AESC recommends a $140,000 cap on the Option #1 configuration and a $215,000 cap on the Option #2 configuration. A 25 percent match funding requirement should be instituted for sites that are in less remote areas. Remote areas are determined as less than the 25,000 VMT/mile in the NREL visibility metric.
44

Table 13: Funding Recommendations by Corridor
Source: Alternative Energy Systems Consulting
45

CHAPTER 4: Recommendations AESC recommends the following for Energy Commission consideration:
• Grant funding for identified corridor gaps. Existing DCFC infrastructure efforts are heavily concentrated in the urban areas. The authors recommend funding sites within corridor gaps that will initially be less commercially viable.
o Consider CalEV Highway and “other” corridors separately to maintain the distinct goals set for the WCEH.
o Fund sites along the “other” corridors based on the first three priority groups.
o Construct a scoring system that gives preference to proposals that include higher priority sites. Proposals with multiple sites of different levels should be weighted accordingly.
• Grant funding levels. To adequately seed the infrastructure in the corridor gap regions, AESC calculates about 80 sites will require some form of public subsidies. Most PEV regional readiness personnel indicated that a grant covering full installation and equipment cost would be necessary to move forward. While most of the PEV stakeholders indicated that a grant covering O&M costs for the first couple years would be welcomed, it did not appear to be an absolute necessity. Several personnel indicated enough of a business case could be made to keep the chargers operational. AESC estimates it will require between $9.4 million and $14.5 million to adequately cover these costs for the CalEV Highway and Priority 1, 2, and 3 corridor gaps on the ”other” corridors.
o Provide between $9.4 million and $14.5 million for DCFC infrastructure funding.
o Fund the full installation and equipment costs up to a maximum of $140,000 - $215,000 per site with a 25 percent cost share component for nonremote sites. The $140,000 cap on site funding should be for sites configured as Option #1 and $215,000 for sites that are configured as Option #2.
o Increase the maximum award funding to $1 million per application to encourage commercial interests to combine corridor gap sites with a commercially sustainable site. This will help offset first costs for identified gap locations.
• Site requirements. The site must meet minimum requirements to satisfy the needs of the PEV client and the infrastructure goals. In general, the site must be safe, accessible, convenient, and reliable. These needs should be expressed as compliant/noncompliant in the process. The site should also contain a type and mix of charging stations that will maximize the usefulness of the site.
46
o Enforce the minimum needs as laid out in the Site Requirements section, which will result in a pass/fail determination for the submitted proposals.
o Require that each site includes:
• Option #1 ($140,000 Cap) o One CHAdeMO DCFC charger o One dual-protocol DCFC charger o One Level II charger o One expansion location (for future use).
• Option #2 ($215,000 Cap) o Two CHAdeMO DCFC chargers o Two dual-protocol DCFC chargers o One Level II, dual-port charger o One expansion location (for future use).
• Energy and demand management. It is recommended that the Energy Commission
continue to encourage the integration of renewable generation and energy storage as DCFCs continue to be installed throughout California.
o For sites with three-phase power available from the local utility, contractors should be encouraged to integrate renewable generation and energy storage into proposed DCFC solutions. However, the additional infrastructure should be considered on merit based on site conditions and needs.
o At this time, locating a DCFC in an area without access to three-phase utility power is not a commercially available or economically viable solution. If a new technology solution is proposed, however, the Energy Commission should consider allowing the project under the higher cap value.
• Business structures. After reviewing numerous cases and real-world examples, a common theme emerged that suggests business structures can be relatively simplistic or complex as long as they meet the expectations of the parties involved.
o All business structures should be allowed to participate. Prioritizing a particular model could have the effect of limiting innovative market structures, which are an effective way to highlight the benefits of multiple technologies and create value beyond simple commodity transactions.
o Many of the DCFC sites may be in areas that have limited commercial activity. As a result, the public/public structure may provide the best solution. In these cases, the local government may need additional financial assistance to operate the site.
47

o Where infrastructure is located in economically challenged regions, the employment of local contractors and workers should be encouraged. The benefits of these types of efforts are the sharing of economies and leveraging the projects to promote the use of local developers and stimulating local economies.
o Using the most advantageous rates/tariffs should not be overlooked; cost compression is necessary for these sites, and therefore, the use of the most beneficial tariffs is imperative.
o The sponsorship model should be promoted to offset the ongoing costs of operating and maintaining the fleet of DCFC infrastructure.
48

REFERENCES
Documents Baroody L. June 5th IEPR workshop on PEV infrastructure: “Major New Ideas and Thoughts Presented.” California Energy Commission; 2014.
Brown JR EG. California Energy Commission report: 2014 Draft Integrated Energy Policy Report Update. CEC-100-2014-001-D; 2014.
Brown JR EG. 2013 ZEV Action Plan: A Roadmap Toward 1.5 Million Zero-Emission Vehicles on California Roadways by 2025. 2013.
Buell T. Washington State Electric Vehicle Action Plan. WA State Dept. of Transportation; 2014.
California Environmental Protection Agency. “Update on Status of ZEV Infrastructure.” PowerPoint presented by the California Air Resources Board, Diamond Bar, CA, 2014.
California Department of Transportation. “Initial Screen for Public Sites” 2015.
Carter D. “Micro Siting Rubric – Upstate Region,” 2014.
California Energy Commission. “2014 IEPR update: Key Workshop Questions by Chapter,” 2014.
California Energy Commission. “Webex Attendee List,” 2015.
California Energy Commission. “Workshop Sign-In Sheets,” 2015.
ChargePoint Website Press Release. BMW, Volkswagen and ChargePoint Announce Initiative to Create Electric Vehicle Express Charging Corridors on the East and West Coasts; 2015 [cited 2014 April 14]. Available from http://www.chargepoint.com/press-releases/2015/0122
Frades, Matt, Nick Nigro, and Philip Quebe. “New Approaches to Financing the Public EV Charging Network.” PowerPoint presented at the fourth meeting of the Advisory Panel and C2ES, November 2014.
Fuji Electric. “Fuji Electric Corp. of America: DC Quick Charging for Electric Vehicles,” 2012.
Governor’s Office of Planning and Research. “West Coast Green Highways (WCGH) Methodology.” Version: 2014.
Keros A, Andreas Klugesheid. “PEV Collaborative: DC Combo (SAE) Update.” PowerPoint presented by BMW and GE; March 13, 2013.
MacCurdy D. “SMUD Smart Charging Pilot Program: EPRI Infrastructure Working Council.” Department of Energy, Award No.: OE000214; 2012.
Melaina M., J. Bremson, K. Solo. “Consumer Convenience and the Availability of Retail Stations as a Market Barrier for Alternative Fuel Vehicles,” PowerPoint presented at the 31st USAEE/IAEE North American Conference, Austin, TX, November 2012.
49

Melaina M., Helwig M. California Statewide Plug-In Electric Vehicle Infrastructure Assessment. National Renewable Energy Laboratory (California Energy Commission); May 2014. CEC-600-2014-003
Morrow K., Karner D., Francfort J. U.S. Department of Energy Vehicle Technologies Program – Advanced Vehicle Testing Activity: Plug-In Hybrid Electric Vehicle Charging Infrastructure Review. Batelle Energy Alliance (U.S.); 2008. Report No.: INL/EXT-08-15058.
Nicholas M., G. Tal, J. Woodjack, and T. Turrentine. Electric Vehicle Infrastructure: Where, How Many and Why? UC Davis Plug-In Hybrid & Electric Vehicle Research Center, 2012.
NRG EV Services LLC. Settlement Year 2 – Fourth Quarter: Progress Report to California Public Utilities Commission Electric Vehicle Charging Station Project. January 23, 2015.
PEV Readiness Region – Upstate. “Likely Stations. Table 5: Summary of Preliminary Engineer’s Opinion of Probable Construction Costs.” Source: GHD, 2014; P33.
PEV Readiness Region – Upstate. “Upstate Corridor Elevation Chart.”
PEV Readiness Region – Upstate. “Upstate DCFC Siting Map.”
PEV Readiness Region – Upstate. “Upstate Siting Map.”
Quinn, P. “Electric Vehicle Infrastructure Rebate Program: Frequently Asked Questions (FAQs).” Illinois Department of Commerce & Economic Opportunity.
Tsang, A. “Refueling Infrastructure for an Electric Vehicle Future.” PowerPoint presented at the Transportation Conference 2014, Hyatt Regency Hotel, Vancouver, British Columbia, and January 2014.
U.S. Department of Energy, Energy Efficiency & Renewable Energy, Vehicle Technologies Program. DC Fast Charge Effects on Battery Life and Performance Study. Report No.: INL/MIS-13-29877. Available from: INL, etec labs; 2013.
U.S. Department of Energy, Energy Efficiency & Renewable Energy. Plug-In Electric Vehicle Handbook for Public Charging Station Hosts. Available from Clean Cities Technical Response Service, NREL, 2012.
Wishart, J. Charged Electric Vehicles Magazine: “Utility Demand Charges and Electric Vehicle Supply Equipment.” Issue: 2013 Oct.
West Coast Green Highway [Internet]. Washington: Washington State Department of Transportation: c2014 [Cited 2015 Feb 13]. Available from: http://www.westcoastgreenhighway.com/
Interviews and Emails Charlie Botsford (Aerovironment), interview February 6, 2015.
50
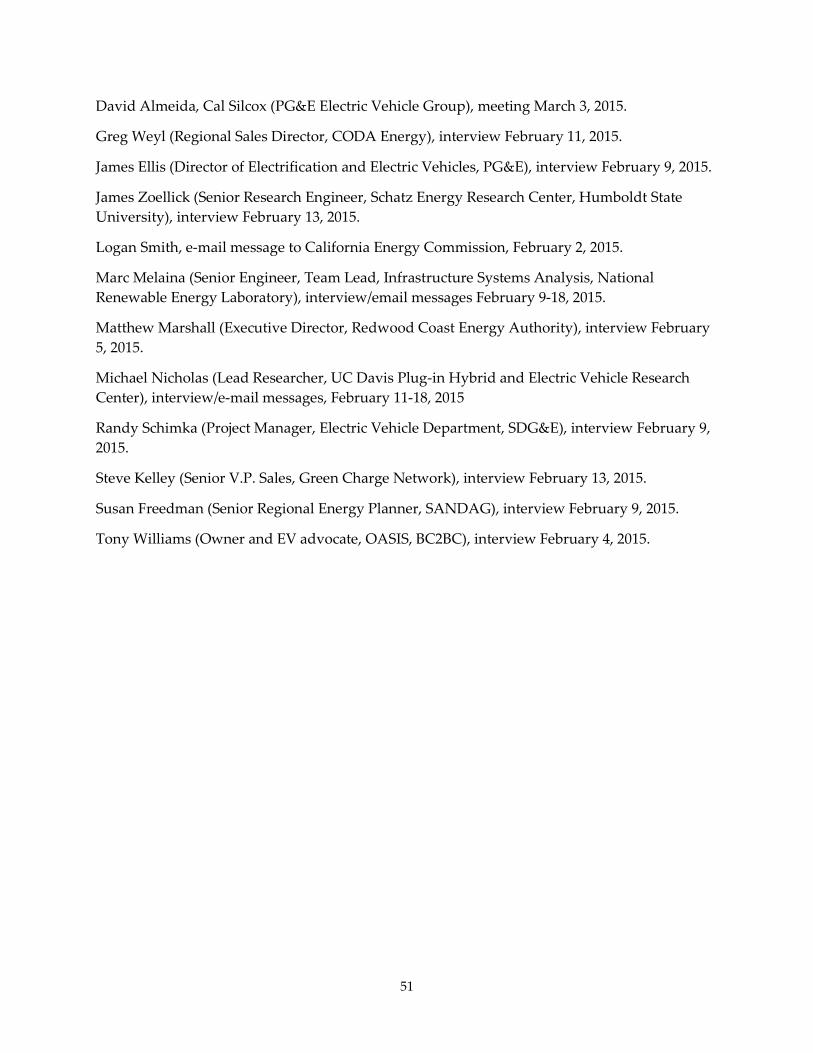
David Almeida, Cal Silcox (PG&E Electric Vehicle Group), meeting March 3, 2015.
Greg Weyl (Regional Sales Director, CODA Energy), interview February 11, 2015.
James Ellis (Director of Electrification and Electric Vehicles, PG&E), interview February 9, 2015.
James Zoellick (Senior Research Engineer, Schatz Energy Research Center, Humboldt State University), interview February 13, 2015.
Logan Smith, e-mail message to California Energy Commission, February 2, 2015.
Marc Melaina (Senior Engineer, Team Lead, Infrastructure Systems Analysis, National Renewable Energy Laboratory), interview/email messages February 9-18, 2015.
Matthew Marshall (Executive Director, Redwood Coast Energy Authority), interview February 5, 2015.
Michael Nicholas (Lead Researcher, UC Davis Plug-in Hybrid and Electric Vehicle Research Center), interview/e-mail messages, February 11-18, 2015
Randy Schimka (Project Manager, Electric Vehicle Department, SDG&E), interview February 9, 2015.
Steve Kelley (Senior V.P. Sales, Green Charge Network), interview February 13, 2015.
Susan Freedman (Senior Regional Energy Planner, SANDAG), interview February 9, 2015.
Tony Williams (Owner and EV advocate, OASIS, BC2BC), interview February 4, 2015.
51

ACRONYMS
Alternative fuel vehicle (AFV)
Alternative and Renewable Fuels and Vehicle Technology Program (ARFVTP)
American Society for Testing and Materials (ASTM)
Battery electric vehicle (BEV)
Battery energy storage system (BESS)
Commission agreement manager (CAM)
California Code of Regulations (CCR)
California Environmental Quality Act (CEQA)
California Public Utilities Commission (CPUC)
Direct current fast charger (DCFC)
Distributed energy resource (DER)
Electric vehicle service providers (EVSP)
Federal Highway Administration (FHWA)
Fuel Cell Electric Vehicle (FCEV)
Greenhouse gas (GHG)
National Renewable Energy Laboratory (NREL)
Net energy metering (NEM)
Plug-in electric vehicle (PEV)
Plug-in hybrid electric vehicle (PHEV)
Self-Generation Incentive Program (SGIP)
University of California, Davis (UC Davis)
United States Environmental Protection Agency (U.S. EPA)
Vehicle miles traveled (VMT)
West Coast Electric Highway (WCEH)
West Coast Green Highway (WCGH)
Zero-emission vehicles (ZEV)
52