conservation biogeography: assessment and prospect
TRANSCRIPT
© 2005 Blackwell Publishing Ltd www.blackwellpublishing.com/ddi
3
Diversity and Distributions, (Diversity Distrib.)
(2005)
11
, 3–23
SPECIALPAPER
D D I 1 4 3
Operator:
Yu Yangjun
Dispatch:
22.11.04
PE:
Jennifer Gall
Journal Name Manuscript No.
Proofreader:
Song Laihui
No. of Pages:
21
Copy-editor:
Shonil Bhagwat
ABSTRACT
There is general agreement among scientists that biodiversity is under assault on aglobal basis and that species are being lost at a greatly enhanced rate. This articleexamines the role played by biogeographical science in the emergence of conservationguidance and makes the case for the recognition of Conservation Biogeography as akey subfield of conservation biology delimited as:
the application of biogeographicalprinciples, theories, and analyses, being those concerned with the distributional dynamicsof taxa individually and collectively, to problems concerning the conservation of bio-diversity.
Conservation biogeography thus encompasses both a substantial body oftheory and analysis, and some of the most prominent planning frameworks used inconservation. Considerable advances in conservation guidelines have been made overthe last few decades by applying biogeographical methods and principles. Herein weprovide a critical review focussed on the sensitivity to assumptions inherent in theapplications we examine. In particular, we focus on four inter-related factors: (i) scaledependency (both spatial and temporal); (ii) inadequacies in taxonomic and distri-butional data (the so-called Linnean and Wallacean shortfalls); (iii) effects of modelstructure and parameterisation; and (iv) inadequacies of theory. These generic problemsare illustrated by reference to studies ranging from the application of historical bio-geography, through island biogeography, and complementarity analyses to bioclimaticenvelope modelling. There is a great deal of uncertainty inherent in predictive analyses inconservation biogeography and this area in particular presents considerable challenges.
Protected area planning frameworks and their resulting map outputs are amongstthe most powerful and influential applications within conservation biogeography,and at the global scale are characterised by the production, by a small number ofprominent NGOs, of bespoke schemes, which serve both to mobilise funds andchannel efforts in a highly targeted fashion. We provide a simple typology of pro-tected area planning frameworks, with particular reference to the global scale, andprovide a brief critique of some of their strengths and weaknesses. Finally, we discussthe importance, especially at regional scales, of developing more responsive analysesand models that integrate pattern (the compositionalist approach) and processes(the functionalist approach) such as range collapse and climate change, again notingthe sensitivity of outcomes to starting assumptions. We make the case for the greaterengagement of the biogeographical community in a programme of evaluation andrefinement of all such schemes to test their robustness and their sensitivity to alter-native conservation priorities and goals.
Keywords
Conservation biogeography, models, protected area frameworks, scale, sensitivity
analysis, uncertainty.
Biodiversity Research Group, School of
Geography and the Environment, University of
Oxford, Mansfield Road, Oxford, OX1 3TB, UK
*Correspondence: Robert J. Whittaker, Biodiversity Research Group, School of Geography and the Environment, University of Oxford, Mansfield Road, Oxford, OX1 3TB, UK. Order of co-authors arranged alphabetically. E-mail: [email protected]
Blackwell Publishing, Ltd.
Conservation Biogeography: assessment and prospect
Robert J. Whittaker*, Miguel B. Araújo, Paul Jepson, Richard J. Ladle,
James E. M. Watson and Katherine J. Willis
INTRODUCTION
Although biogeographical science has played its part alongside
other subfields of biology in the emergence of current scientific
guidance for biodiversity conservation (e.g. Dasmann, 1972,
1973; Diamond, 1975), in our view it has done so as something
of a poor relation — a Cinderella within Conservation Biology. In
the present article, we argue that biogeography can now cast
R. J. Whittaker
et al.
4
Diversity and Distributions
,
11
, 3–23, © 2005 Blackwell Publishing Ltd
aside its metaphorical rags as it emerges as an area of central
importance to conservation planning. In part this has been
driven by the advent of extensive computerised biogeographical
data bases and powerful computer-based analytical tools, which
have enabled rapid progress in many areas of the field, both
pure and applied; and in part, it reflects theoretical and concep-
tual advances (e.g. Williams
et al.
, 2000a; Lomolino & Heaney,
2004).
Yet, we must also recognise that the underlying species distri-
butional and other data often remain highly problematic, protocols
for analysis are still in development, and we have only recently
begun the task of systematically analysing the sensitivity of our
analyses to the starting assumptions. Accordingly, we argue that
there is a need for more biogeographers to get engaged with the
problems of conservation science, and for the injection of more
biogeography into training for conservation scientists (cf. Lourie
& Vincent, 2004). As a step towards these goals, we first offer a
definition of the field of
Conservation Biogeography
, placing it in
the context of the closest surrounding disciplinary areas, and sec-
ond, highlight what we believe to be key generic research needs
within the field.
We are within a crucial phase in the development of conserva-
tion theory and strategy. There is general agreement that biodi-
versity is under assault on a global basis and that species are being
lost at a greatly enhanced level (Lawton & May, 1995; Royal Soci-
ety, 2003). In response, over the last decade, several prominent
international non-governmental organisations (NGOs) have
engaged in developing regional, continental, and particularly
global schemes (e.g. Dinerstein
et al
., 1995; Long
et al.
, 1996;
Olson & Dinerstein, 1998; Myers
et al.
, 2000) to capture and
prioritize substantial new flows of conservation investment
(Dalton, 2000; Myers & Mittermeier, 2003). These schemes are
outputs from analyses that are essentially biogeographical in
nature, and they are having an immense influence in the organ-
isation and prioritisation of conservation efforts (Jepson &
Whittaker, 2002a, Myers & Mittermeier, 2003). As such they are
perhaps the most prominent of recent conservation biogeographical
developments: but many other approaches also warrant attention.
Thus, in the following, we illustrate our case by brief reference
to a wide range of biogeographical applications rather than
providing an in-depth review of each. Even so, there are areas of
conservation biogeography, which, for reasons of space, get little
or no mention.
In climate change research, a mature debate has developed
based on assessing how sensitive future climate scenarios are to
starting assumptions and model parameters (e.g. Gerber
et al.
,
2004). In this, conservation biogeography lags some way behind.
Indeed there appears to be a certain reluctance to entertain criti-
cal debate on the merits of particular schemes lest it detract
policy makers from their implementation or lead to loss of public
support. In illustration, critics of Conservation International’s
hotspots scheme (see, e.g. Humphries, 2001; Brummitt & Lughadha,
2003; Ovadia, 2003) have recently been labelled ‘dissidents’ by the
scheme’s originator (Myers & Mittermeier, 2003). Similarly,
acknowledgement of the non-pristine nature of many rain forest
areas stirs controversy in part because of the dilution in clarity of
the conservation message to policy makers (compare: Gillson &
Willis, 2004; Hambler, 2004; Willis
et al.
, 2004a,b). As applies in
climate change research, we must also have, as a discipline, the
confidence to pursue critical analyses in order to improve the
biogeographical advice being offered. A key objective of our paper
is therefore to assess the sensitivity to assumptions inherent in
the applications of Conservation Biogeography we review. In
particular, we focus on (i) scale dependency; (ii) the Linnean and
Wallacean shortfalls; (iii) model structure and parameterisation;
and (iv) adequacy of theory. This is followed by a brief assessment
of key research issues in the use of biogeography in developing
and refining protected area planning frameworks.
WHAT IS CONSERVATION BIOGEOGRAPHY?
Herein we define Conservation Biogeography as ‘
the application
of biogeographical principles, theories, and analyses, being those
concerned with the distributional dynamics of taxa individually
and collectively, to problems concerning the conservation of biodi-
versity
’. It is not a new area of scientific enquiry, but the conjunc-
tion of the words conservation and biogeography appears to have
arisen very recently, in a meeting leading up to the first confer-
ence of the International Biogeography Society (held in 2003)
and the nearest to a book of the title that we are aware of is
Applied
Biogeography
(Spellerberg & Sawyer, 1999). As an applied and
interdisciplinary science concerned with the conservation of
nature, Conservation Biogeography can be seen as a sub-discipline
of both Biogeography and Conservation Biology. We briefly con-
sider the origins of these related endeavours in order of their
emergence.
Biogeography
is the study at all possible scales of analysis of the
distribution of life across space, and how, through time, it has
changed, within which a major concern has always been the dis-
tribution and dynamics of diversity, frequently codified in terms
simply of numbers of species, or proportions of endemic spe-
cies. The discipline has deep scientific roots, with some of the
major themes already established as areas of enquiry by the early
1800s (Brown & Lomolino, 1998; Lomolino
et al.
, 2004).
By contrast,
nature conservation
can be thought of as a social
movement working to develop or reassert certain values in society
concerning the human–nature relationship (Jepson & Canney,
2001; Jepson & Whittaker, 2002b). The modern conservation
movement emerged in the late 19th century in response to fun-
damental changes in world views concerning the human–nature
relationship, emanating largely from elite society of the American
East Coast and Western Europe (Jepson & Whittaker, 2002b).
The movement was motivated both by a desire to preserve sites
with special meaning for intellectual and aesthetic contempla-
tion of nature and by acceptance that the human conquest of
nature carries with it a moral responsibility to ensure the survival
of threatened life forms. The movement gained new momentum
in the second half of the 20th century when science further
expanded understandings of the society–nature relationship
(Frank
et al.
, 1999; Adams, 2004).
Motivated by, but distinct from the nature conservation move-
ment,
conservation biology
is the name given for applied research

Conservation Biogeography
Diversity and Distributions
,
11
, 3–23, © 2005 Blackwell Publishing Ltd
5
designed to inform management decisions concerning the con-
servation of biodiversity. As such, its roots lie largely within the
mid-20th century: it gained huge momentum during the 1970s
and early 1980s when it was formally identified as a sub-
discipline, with dedicated journals and textbooks (e.g. Soulé, 1986;
Primack, 2002). It is a large field, but if subdivided by scale of
application, we might recognise the following subdivisions of
relevant theory. First, the development and evaluation of biolog-
ical theory spanning population biological and genetic process,
and concerned with minimum viable populations, genetic ero-
sion from small populations, competitive influence of invasive
species, behavioural ecology, etc., i.e. concerned with processes
in which biogeography is generally not prominent (e.g. see
Primack, 2002). Second, theory concerning processes at the
local-landscape scale, including the foundational influence of
MacArthur & Wilson’s dynamic (equilibrium) theory of island
biogeography, the derivative Single Large or Several Small reser-
ves (SLOSS) debate, habitat corridors, metapopulation theory,
and nestedness (reviewed by Whittaker, 1998): i.e. bridging
ecology and biogeography. Third, applications on a yet coarser
scale in part are concerned with mapping and modelling biogeo-
graphic patterns and in part invoke historical biogeographic
theory concerned with the distribution and explanation of geo-
graphical patterns in diversity, which can be referenced back to
the founding fathers of the discipline of biogeography (Alfred
Russel Wallace, Philip Sclater, etc.). We see such coarser scale work
on the geography of nature as being unambiguously within
the heartland of biogeography (cf. Lomolino
et al.
, 2004) and
despite its undoubted importance within conservation science,
we argue that it is here that the ‘Cinderella’ tag applies to conser-
vation biogeography, and here where there is greatest need for
critical attention to our science, and for greater interaction
between those involved in theory and application (cf. Lourie &
Vincent, 2004).
Conservation biogeography, the application of biogeography
in conservation, is thus separable from the application of ecology
and macroecology most clearly at coarser scales. Whilst the
use of zoogeographic regions, areas of endemism, geographic
patterns in species richness, or phylogeographic structure
for conservation prioritisation purposes are readily identifiable
as conservation biogeography, applications at increasingly
fine spatial scales, for example focused on habitat corridors
or metapopulation dynamics can be seen as simultaneously
drawing from traditions in both ecology and biogeography.
Similarly, macroecological analyses [referring to the analysis
of the emergent statistical properties of ecological datasets
(Brown, 1995)] may also be based on both ‘ecological’ traits (e.g.
growth rates, propagule size, breeding system, body size) and
‘biogeographical’ traits (e.g. range size, region of origin). In illus-
tration, efforts to develop explanatory and predictive models of
invasiveness of non-native species have been made that mine
both sets of traits, frequently finding a biogeographical signal in
the resulting models (Dehnen-Schmutz, 2004; Py
Í
ek
et al.
, 2004),
indicative that such analyses draw from both ecological and bio-
geographical traditions within conservation science to varying
degrees.
From this brief outline we highlight three points. First, the
foundation of biogeography as a discipline substantially predates
the emergence of conservation biology. Second, conservation
biogeography forms an important, distinctive (but not entirely
distinct) subset of conservation biology. Third, the motivating
force for these scientific endeavours is a diverse social movement,
representing varied values.
SOCIAL VALUES AND CONSERVATION BIOGEOGRAPHY
We are concerned in this article with the scientific underpinnings
of conservation decision making. Yet it is important to recognise
that such scientific guidance, and the language in which it is
couched (Trudgill, 2001), is not value-free and that there is a
debate to be had concerning what properties of nature we wish as
a society to foster. Much of the scientific guidance and of current
conservation practice assumes that this debate has a particular
outcome, without paying much attention to the possible validity
of alternative value systems (but see: Redford
et al.
, 2003). So, for
example, Conservation International’s hotspots (Myers
et al.
,
2000) delimit as priority regions areas that possess > 1.5% of
global plant diversity uniquely within their bounds, and which
have lost > 70% of their original habitat. In doing so, CI are nec-
essarily placing higher value on those species that on a regional scale
co-occur with many other range-restricted plant species, than
they do on species occurring in other systems. Other value systems
exist, such as those emphasising the importance of intact
megafaunal assemblages, aesthetic and cultural significance of land-
scapes, ecosystem health or biotic integrity (cf. Callicott
et al.
, 1999;
Redford
et al.
, 2003; Adams, 2004), and these value systems motivate
conservation action in many nations, especially at local scales but
also globally (Jepson & Canney, 2001, 2003; Trudgill, 2001).
The decision to adopt a particular set of values does not lie
within the bounds of science, and although conservation scien-
tists are well placed to contribute to debate, there is an important
distinction between the processes leading to the adoption of a set
of values, and the process of deriving the scientific guidelines
to implement these values. So, whilst there may be pragmatic
reasons to opt for a ‘silver-bullet’ approach (e.g. Myers
et al.
, 2000),
conservation biogeographers should be in the business of pro-
viding alternative scenarios addressing differing end goals (cf.
Williams
et al.
, 2000a; Dimitrakopoulos
et al.
, 2004). Thus,
alongside the programme of exploring sensitivity to the more
prosaic assumptions concerning data quality, modelling effects,
etc., set out below, should be added sensitivity of outcomes to
different societal objectives.
KEY ASSUMPTIONS AND SENSITIVITIES
(i) The Linnean and Wallacean shortfalls
Our knowledge of the overall biodiversity of the planet remains
woefully inadequate, with estimates of global biodiversity rang-
ing over one or possibly two orders of magnitude (Groombridge,
1992; Brown & Lomolino, 1998; Groombridge & Jenkins, 2000).

R. J. Whittaker
et al.
6
Diversity and Distributions
,
11
, 3–23, © 2005 Blackwell Publishing Ltd
Much of the diversity we do know about has yet to be formally
described and catalogued. In general, these problems — the so-called
Linnean shortfall (Brown & Lomolino 1998) — appear to be of
increasing severity as the organisms decrease in size and com-
plexity, e.g. from vertebrate groups, to invertebrates, down to
nematodes (e.g. see: Medellín & Soberón, 1999; Ødegaard
et al.
,
2000; Lambshead & Boucher, 2003). In so far as we do know our
species, we also have, for many taxa, inadequate knowledge of
their global, regional, and even local distributions, a problem
that Lomolino (2004) has labelled the Wallacean shortfall. Many
areas of the world remain seriously under-collected for most
taxa, with the result that even for higher plants, reliable, system-
atic species range maps — the necessary basis for robust analyses
of diversity patterns — are available only for a fraction of the
earth’s surface. Moreover, much of our distributional data and
many of our compilations pertain to political geographical units
(states) lacking biological meaning, which have gone their own
ways historically in gathering botanical and zoological data, and
which vary hugely in area: factors liable to produce serious
artefacts when data are combined for analysis.
The following examples illustrate some of these problems,
beginning with an esoteric choice: marine nematodes. Nematodes
have been identified as a possibly hyper-diverse group, especially
benthic nematodes in the deep sea (i.e. estimates of > 1 m species
have been made). Yet, to date, very few marine nematodes have been
described to species level, and these high values are derived using
extrapolation techniques from local sampling. A recently col-
lected transect spanning 3000 km of the abyssal plain of the north-
central Pacific ocean indicated a regional richness of only a few
hundred species (Lambshead & Boucher, 2003). Intriguingly,
fully 71% of the species in the two northern stations of the
transect were also collected from the (more species rich) south-
ern stations. Not only is there a pronounced Linnean shortfall in
marine nematodes, but the relationships between alpha, beta and
gamma richness patterns now
appear
to be radically different
between the shallow and deep seas, i.e. there is an equally large
Wallacean shortfall, and initial assumptions now seen unfounded.
On the basis of these and other recent data, Lambshead &
Boucher (2003) suggest that a radical reassessment downwards
of the global diversity of marine nematodes is necessary.
While the social and economic value placed on marine nema-
todes and their conservation may currently be limited, the same
cannot be said of wild plants. The Atlas Florae Europaeae (AFE)
is a project, launched in 1965 as a collaborative effort of
European botanists, with the aim of mapping and providing taxo-
nomic notes for the entire European flora. Some forty years on,
twelve volumes have been published. Yet, as of 2003, the AFE was
able to claim only that the maps cover families that include
more
than 20%
(our emphasis) of the vascular plants of the European
flora. Moreover, electronic versions of early maps have only
recently become available. We are still a long way off being able to
take full advantage of the collections residing in herbaria and
museums, notwithstanding massive improvements in computer
power, etc. (Wheeler
et al.
, 2004).
Nelson
et al.
(1990) provide a tropical botanical example in
their critique of ‘centres of richness and endemism’ (CORE
areas) for the Brazilian Amazon. The validity of these patterns is
critical to debates on the Quaternary history of the Amazon (e.g.
Bush, 1994; Colinvaux
et al.
, 2001). Nelson
et al.
(1990) quanti-
fied collecting intensity within the herbarium collection at
Manaus by recording the number of specimens of the virtually
ubiquitous tree genus
Inga
per 1
°
grid cell. They found that
vouchers of
Inga
varied from 0 to > 320 per cell, and that only
one of the seven previously proposed Brazilian CORE areas was
not a focus of collecting activity: in short, the biogeographic pat-
tern is confounded by collecting intensity. Despite recent interest
in artefactual effects in diversity gradient analyses (e.g. Diniz-
Filho
et al.
, 2003; Colwell
et al.
, 2004), formal analyses of possible
artefacts in collecting effort and data quality underpinning
coarse-scale strategic conservation schemes appear to be rare
(but see, e.g. Prinzing
et al.
, 2003). It would seem worthwhile to
explore the sensitivity of such data and schemes to the problems
inherent in the Wallacean shortfall.
(ii) Scale dependency
Spatial scale: extent and focus
There are numerous metrics of diversity, and they have been
applied on widely varying scales, often inconsistently (Whittaker
et al.
, 2001). A crucial distinction is that between (a) the geo-
graphical extent of a study system, being the space over which
observations are made, e.g. a hillside, a state, a continent; and (b)
the grain (focus) of the data, being the contiguous area over which
a single observation is made, or at which data are aggregated for
analysis, e.g. a light trap, 1 ha plot, or latitude–longitude grid cell.
Often the term scale, or spatial scale, is used to refer to both of
these quite distinct properties of study systems, but they are not
equivalent or substitutable (Palmer & White, 1994; Nekola &
White, 1999; Whittaker
et al.
, 2001; Whittaker & Heegaard,
2003). This is shown by analyses using nested sets of grid cells
that reveal different patterns of diversity by varying grain and
holding extent constant (Stoms, 1994; Rahbek & Graves, 2000,
2001; Koleff & Gaston, 2002). Similarly, when scale (i.e. grain) is
held constant, but geographic extent is varied, again different
patterns can result (e.g. Hawkins
et al.
, 2003). The failure to
control for scale (e.g. by holding area constant in analysis) and
the confounding of grain and extent within the diversity litera-
ture has undoubtedly hindered progress in the development of
theory. These scale issues have a clear relevance to the develop-
ment of strategic conservation frameworks, in so far as they
make use of, or are dependent upon, mapping diversity patterns
(Williams
et al.
, 2000a; Redford
et al.
, 2003). This is shown by
Lennon
et al
.’s (2001) analyses of British birds, in which spatial
patterns of richness using a 10-km grain grid system were found
to be statistically unrelated to those using a 90-km grain system:
with coarsening scale the locations of the most species-rich
quadrats moved north. This indicates that reserve selection
criteria based on species distribution and diversity data may be
sensitive to the scale of analysis employed. Relatively little work
has been done on this problem, although it may have a strong
influence (Stoms, 1994; Araújo, 2004).

Conservation Biogeography
Diversity and Distributions
,
11
, 3–23, © 2005 Blackwell Publishing Ltd
7
Range restricted species — and thresholds of rarity
Rarity, as Darwin commented, is often a precursor to extinction.
Rarity can mean that a species occurs at low density, and it can
mean that a species occupies a small geographic range. Given
these two forms of rarity (and there are others: Gaston, 1994) a
species can be: (i) abundant and widespread; (ii) abundant but
localised; (iii) low density but widespread; or (iv) low density and
localised. It has long been known that a high proportion of
species have relatively small geographic ranges, and few are
widespread. Brown’s (1995) graphical macroecological analyses of
range size and density indicate that within taxonomically or eco-
logically similar species there tends to be a positive correlation
between these two properties. This means that species occupying
large ranges tend to be more abundant throughout those ranges
than range-restricted species, suggesting the corners of the plot
represented by conditions (ii) and (iii) to be very unusual. When
examining whole faunas, such as the Breeding Bird Survey data
for North American land birds, a lot more scatter is evident than
within similar groups of species, but still the condition of
‘abundant and localised’ (i.e. ii) is extremely rare (Brown, 1995,
Fig. 6.2; and see Gaston, 1994). It would therefore seem that con-
servation biogeographers are right to focus attention on range-
restricted species as being
a priori
of conservation concern
(Rosenfield, 2002).
Yet, what constitutes a small range, and how might the range
size/abundance pattern vary in relation to biogeographic context
(e.g. continental versus island archipelago contexts) or for taxa
of differing body sizes? In the North American breeding bird
survey data set analysed by Brown (1995), range size varies from
c.
10,000 km
2
to over 10 million km
2
and fewer than 10 species
have ranges < 100,000 km
2
. By way of contrast, the land area of
the Canary Islands is only approximately 7500 km
2
and that of the
Hawaiian archipelago is 16,640 km
2
. Assuming that the typical
pattern of many species with small ranges exists within these
essentially self-contained biogeographic areas, then many native
species have tiny ranges, and even the most abundant species on
these islands will have smaller ranges than the ‘localised, low
density’ rarities of the North American data set. In conservation, a
common threshold for defining range-restricted (sometimes
‘local endemic’) species is that the range size is < 50,000 km
2
(from Terborgh & Winter, 1983). On this basis, the entire endemic
biota of island archipelagos such as Hawaii, Galapagos and the
Canaries would be classed as of conservation concern. This
would be unduly pessimistic. A simple illustration is provided by
the case of the Tanimbar corella (
Cacatua goffini
) — a parrot
species endemic to the Tanimbar islands (Indonesia), a group of
66 islands of a total land area of about 5400 km
2
. It was initially
listed as ‘threatened’ in 1989 on the basis of small global range
and concern that it was being traded at a possibly unsustainable
rate, but field survey on the largest island, Yamdena (3250 km
2
)
subsequently produced a population estimate of 231,500 (
±
33,000)
for that island alone, suggesting that the initial categorisation had
been unwarranted (Jepson
et al.
, 2001). That an island species
with a global range one-tenth the size of the Terborgh & Winter
(1983) threshold for range-restricted species can have a healthy
population size is good news. Of course, this may be a misleading
example, and it must be balanced against the knowledge that, for
example, about half of Hawaii’s indigenous bird species have
gone extinct since human colonization, and that population data
indicate many island species to be seriously threatened (Whit-
taker, 1998).
The threshold of 50,000 km
2
has been widely adopted in con-
servation prioritisation analyses (e.g. Long
et al.
, 1996; Rodrigues
et al.
, 2004), and for particular taxa and contexts is a reasonable
approximation (e.g. for freshwater fish species in North America,
Rosenfield, 2002). In the IUCN red list criteria, attribution can
default to range size if other data are lacking, in which case, the
thresholds used are 100 km
2
(extent of occurrence) for critically
endangered, 5000 km
2
for endangered, and 20,000 km
2
for
vulnerable (version 2.3; www.redlist.org/info/categories_
criteria1994.html). This three-point scale recognises that on
average, threat increases incrementally as range size reduces. For
those schemes employing a single range size, whether 50,000 km
2
or another, it would appear valuable to undertake analyses for
different taxa and biogeographical contexts of the sensitivity of
prioritisation analyses to the adoption of that threshold (Williams
et al.
, 2000a). Moreover, to refine the meaning of ‘range-restricted’
for conservation prioritisation, we need more empirical data to
translate range size distributions into population estimates (c.f.
www.birdlife.org/datazone) across a large sample of species for
different contexts, e.g. mainland versus island systems.
Temporal scale
In conservation biogeography we are — or should be — concerned
with both temporal and spatial scale dependency (Gillson & Willis,
2004). By analogy to the terms used in considering spatial scale,
the study ‘grain’ in temporal analyses would refer to the interval
between data points, and the ‘extent’ to the temporal depth of the
analysis. Although fine resolution data often reveal oscillations
hidden in coarse resolution assessments, typically, it is the sensi-
tivity of forward projections to the length of the data series used
that is of greatest concern in the present context. Conservation-
ists aim to ensure the survival of species in the long term. Hence
it is important to understand the temporal dynamics of bio-
geographical processes and whether short-term trends can be
projected into the future (Gillson & Willis, 2004). Yet, the rapidity of
contemporary changes such as habitat fragmentation is such that
attempts typically have to be made to project far into the future
on the basis either of snapshot data or of very short temporal
series. There are many attendant difficulties in doing so, as for
instance, the ecosystem dynamics of forest fragments may respond
to forcing via subtle alterations to the population dynamics of
the dominant organisms (e.g. forest trees) on decadal or multi-
ple-decadal timescales (Bush & Whittaker, 1991; Whittaker,
1998; Willis
et al.
, 2004a).
A classic illustration both of genuine reasons for concern and
of the uncertainty involved in projections is provided by the
tropical moist forests of the Atlantic seaboard of Brazil, which
have been reduced over the past few centuries to only an estimated
12% of their former cover. Simple species–area calculations, based

R. J. Whittaker
et al.
8
Diversity and Distributions
,
11
, 3–23, © 2005 Blackwell Publishing Ltd
on island biogeography theory, predict about 50% extinctions.
To date, none have been documented with certainty, although
species-level assessments show many species to be IUCN listed as
vulnerable, endangered or critically endangered based on range,
or population estimates (see www.birdlife.org/datazone). Brooks
and Balmford (1996) compare losses of birds projected using the
species–area approach with those listed as ‘threatened’ and find
congruence, i.e. they argue that the predictions are basically cor-
rect, but that there is a substantial lag between the habitat loss/
fragmentation process and global extinction of the species. It
should of course be recognised that species–area analyses based
on island theory provides only a coarse, stochastic simulation of
impacts of fragmentation, and the actual drivers of extinction
may be structured, and in some instances avoidable by appropri-
ate management. Conservation action in the Atlantic forests has
likely already been and will continue to be crucial to staving off the
predictions of the species–area models (Birdlife EBA factsheet
75, www.birdlife.org/datazone/ visited July 2004). This also
means that in many cases it is impossible to distinguish between
inadequacies of theory (reviewed in Whittaker, 1998) and suc-
cessful implementation of conservation strategies.
Considering Quaternary-scale studies, it is difficult to obtain
high precision data on past ecosystem dynamics and how they
relate to environmental driving forces, particularly at a mecha-
nistic level. Techniques such as pollen analysis offer the best
resolution, and have greatly improved our understanding of
responses to climatic forcing. In essence, systems respond highly
individualistically, such that past community signatures exist for
which there are no modern-day analogues (e.g. Bush, 1994, 2002).
Yet, palaeoecologists still debate the respective roles of changing
moisture regimes, temperature regimes and CO
2
concentrations
in driving the changes (Bennett & Willis, 2000; Colinvaux
et al.
,
2001). There is also a considerable degree of uncertainty concern-
ing the migrational lags evident in range adjustments to climate
forcing. Long distance dispersal at low density is likely to be the
key to understanding such range shifts but is a difficult process to
model. Recent work by Kullman (e.g. 1998) indicates that
traditional pollen analytical techniques underestimate the ability
of some temperate species to respond rapidly to climate warming
events. Such insights, and others derived from phylogeography,
demonstrating genetic legacies from the restriction and sub-
sequent emergence of populations from refugial areas, can con-
tribute considerably to an improved theoretical understanding of
responses to climate forcing, and to the parameterisation of models
forecasting future changes (Fig. 1; Willis & Whittaker, 2000;
Bush, 2002; Schmitt & Krauss, 2004).
(iii) Effects of model structure and parameterisation
In this section, we focus on the sensitivity of conservation-
biogeographical analyses to how we construct and parameterise
our models. The taxonomic resolution at which we set priorities
is one example. Endemism is usually considered in schemes such
as Endemic Bird Areas (EBAs) (Long
et al.
, 1996) at a species level,
but could be analysed at family, genus, species or subspecies levels,
each implying a diminishing degree of taxonomic distinctiveness
or evolutionary distance. All of the regional and/or global prior-
itisation schemes (as Table 1) that we are aware of operate at the
species level. How might they change if conducted at the family
level, or the subspecies level? Modelling of how spatial patterns of
plant richness varies at species, genus and family levels suggests
that whilst species and genus level patterns are closely related,
shifting to the family level may produce significant differences
(e.g. O’Brien
et al.
, 1998, 2000; Dimitrakopoulos
et al.
, 2004).
An illustration of the effects of adopting different modelling
approaches is provided by da Silva
et al.
’s (2004) analyses of
endemism in passerine birds of the Atlantic forests of eastern
South America: a well-recognised biogeographical unit. The steps
in their analysis were as follows: (a) define operational geo-
graphical units (OGU); (b) construct a data matrix; (c) perform
Figure 1 Some of the steps, choices and assumptions involved in modelling species losses resulting from future climate change using the bioclimatic envelope modelling approach (e.g. Pearson & Dawson, 2003; Thomas et al., 2004, Thuiller et al., 2004). Not all studies involve all elements, e.g. land-use data, or dispersal models, but these components are important for increased realism (Pearson & Dawson, 2004). Original.

Conservation Biogeography
Diversity and Distributions
,
11
, 3–23, © 2005 Blackwell Publishing Ltd
9
a parsimony analysis of the data matrix to produce an area clado-
gram; (d) delimit the OGU or groups of OGUs defined by at least
two endemic species; and (e) map the species endemic to each
OGU or groups of OGUs to delineate the boundaries of each area
of endemism. OGUs can be outputs from previous schemes, e.g.
ecoregions, biomes, provinces, or as in this case, grid cells (24
cells spanning 1
°
). Their analysis identified four areas of ende-
mism (Pernambuco, central Bahia, coastal Bahia and, Serra do
Mar) that exhibit some congruence with those identified for
woody plants, bamboos, and swallowtail butterflies, suggesting
that they may have some generality. However, as they also point
out, they contrast with previous analyses of vertebrate data, in
identifying varying numbers of areas of endemism, with incom-
plete overlap with their own. Whilst the differences arise in part
from improvements in data, they in large part reflect model
effects. In particular, their use of Parsimony Analysis of Ende-
mism is controversial in that the methods are subject to heated
dispute amongst historical biogeographers (e.g. see Brooks & van
Veller, 2003; Ebach
et al.
, 2003). The degree of difference in the
outputs between da Silva
et al.
’s analyses and Stattersfield
et al
.’s
revised (1998, and see Long
et al.
, 1996) scheme is not huge but
it is noteworthy in that the latter’s Endemic Bird Areas approach
has already provided a key strategic planning tool for the deploy-
ment regionally and globally of the conservation advocacy efforts
of Birdlife International. There would again seem to be scope
for further analyses of the sensitivity of this form of ‘hotspot’
mapping outcome to model assumptions, and this may require
biogeographers to adopt flexible and inclusive approaches to
their work. Whilst the goal for an international NGO may appro-
priately be the production of a single map for conservation
prioritisation (Redford
et al.
, 2003), the broader conservation
biogeography community should be concerned with providing
sets of alternative maps, based on varying parameters and choices.
A key distinction within spatial diversity analyses is that between
richness and endemism, i.e. between the number of species per
unit area and the number of local /regional endemic species per
unit area. Areas rich in (restricted-range) endemics are often also
species rich, but there is high variability at regional scales (Williams
et al.
, 2000a), and patterns in richness and endemism are not
necessarily positively related (see maps in Huntley, 1996). Whittaker
et al.
(2001, 2003) argue that explaining patterns of endemicity
requires theories focussing on evolution and historical contingen-
cies, whilst species richness patterns can often be related to con-
temporary ecological processes and controls. This decoupling is of
more than merely theoretical interest, as prioritisation schemes based
on maximising richness may produce different outcomes from ones
based on maximising numbers of endemics (Williams
et al.
, 2000a).
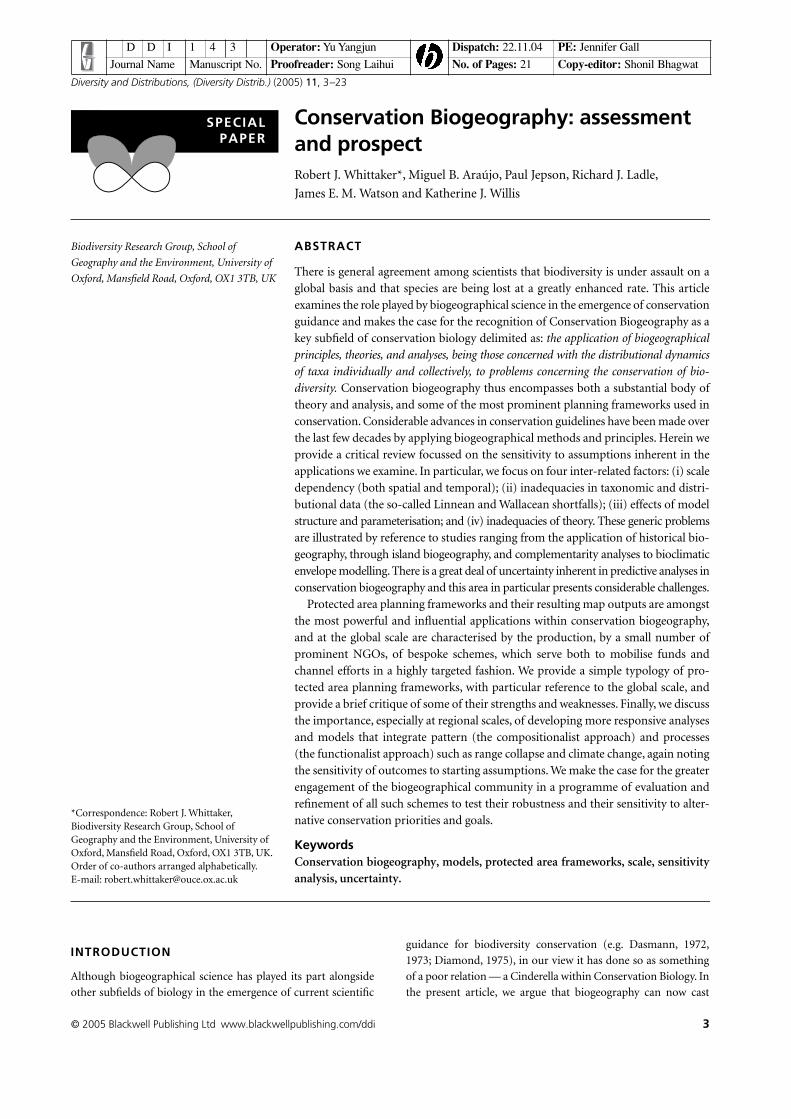
This is illustrated by Dimitrakopoulos
et al.
(2004) who, in
essence, provide a sensitivity analysis for prioritising plant diver-
sity in Crete at species, genus and family levels using a grid of
cells each of 8.25 km
2
(Fig. 2). They used hotspot analysis and
complementarity algorithms to define priority areas for conser-
vation to compare with the recently designated Natura 2000
Special Areas of Conservation (SACs) in Europe. The Natura
Table 1 A typology of protected area planning frameworks of global remit. Biogeographical representation approaches set out to identify representative examples of ecosystem types identified using established biogeographical or ecological frameworks (e.g. Dasmann, 1972, 1973; Udvardy, 1975; Dinerstein et al., 1995). In contrast to this largely zonal approach, hotspot approaches are azonal, and target places rich in species and under threat (e.g. Long et al., 1996; Myers et al., 2000). The Global 200 Ecoregions project combines elements of both hotspot and representation approaches (Olson & Dinerstein, 1998). The approach designated ‘important areas’ uses criteria such as numbers of wintering wildfowl congregating in the site, or importance of site as a stage in a migration route, to identify important areas for prioritisation (e.g. http://www.birdlife.net/action/science/sites/ visited September 2004). Source: P. Jepson & R.J. Whittaker (unpublished)
Global protected area planning frameworks
Representation Hotspots Important Areas
Basic idea An example of each Maximize number of species Select a suite of sites that together
‘saved’ given available resources protect key attributes of concern
Questions arising What are the units of nature? Where are places rich in What are the key attributes & how can
What do we add next? species and under threat? they be assessed?
Parameters Vegetation formations Species richness Threatened species
Faunal regions Species endemism Endemic species
Ecoregions Rate of habitat loss Species assemblages
% original habitat Congregating species
Methods % dissimilarity Species counts Application of varied
Controlling factors Threat/diversity criteria
indexes
Schemes Biogeographic Biodiversity Hotspots Important Bird Areas
provinces Endemic Bird Areas
WWF Ecoregions Global 200 Ecoregions Key Biodiversity Areas
R. J. Whittaker
et al.
10
Diversity and Distributions
,
11
, 3–23, © 2005 Blackwell Publishing Ltd
2000 network was based on an area-selection strategy mostly
concerned with representativeness, quality of habitat, size, density
of listed species, and the degree of their isolation. In their com-
parative analysis, Dimitrakopoulus
et al. scored each cell for:
species richness, a vulnerability index (based on IUCN listings),
a taxonomic distinctiveness index (reflecting proportionality of
species-genus-family membership), a rarity index (reflecting species
of restricted range within Crete), and endemicity (i.e. island
endemics). When these differing indices are used to identify
hotspot areas (i.e. the top 5% of cells) and complementary sets
(i.e. the minimum number of cells containing all target taxa),
they produce quite varied outcomes (Fig. 2). For instance, the
spatial overlap between rarity hotspots, endemic hotspots and
threatspots is only about 33%, whilst that between the comple-
mentary sets calculated for all species and the various categories
of hotspot is less than 9%. In addition, the congruence with the
Natura 2000 sites is also low — these sites cover a substantial area,
located in 32 grid cells, but the overlap between them and the
various hotspot categories is at best only 14%. This analysis indi-
cates that Natura 2000 sites in Crete do not provide a particularly
good representation of the plant diversity of the island. The
analysis also shows that model effects, viz: (a) hotspot versus
complementarity algorithms; (b) taxonomic resolution; and (c)
priority given to richness, taxonomic distinctiveness, and rarity,
Figure 2 Alternative maps of potential conservation prioritisation of plants in Crete, based on 162 grid cells of 8.25 km2. Locations of: (a) species richness hotspots; (b) species threatspots and endemic hotspots; (c) grid cells chosen to represent all genera at least once; and (d) grid cells chosen to represent all families at least once. The asterisks indicate the Natura 2000 Special Areas of Conservation. (From Dimitrakopoulos et al., 2004, Figs 1 and 2). See text for further details.

Conservation Biogeography
Diversity and Distributions, 11, 3–23, © 2005 Blackwell Publishing Ltd 11
provide for a highly diverse range of conservation solutions. Such
model effects are likely to be typical of reserve selection analyses
(e.g. Fig. 3). A further problem that has been identified in analy-
ses of this sort is that there is often a multiplicity of different but
equally efficient complementarity solutions, meaning that
comparisons such as that carried out for Crete should be based on
multiple runs to ensure that the differences resulting are robust (e.g.
Gaston et al., 2001; Hopkinson et al., 2001; Araújo et al., 2005).
There is now a substantial body of work showing variability of
area selection outcomes as a function of starting assumptions
and goals (e.g. Pressey & Nicholls, 1989; Williams et al., 1996,
2000a, 2000b; Rodrigues et al., 1999; Andelman & Fagan, 2000;
Dimitrakopoulos et al., 2004). However, these studies typically
concern simple problems at a regional scale, ignoring issues of
range dynamism, and being restricted to single taxa. Whilst some
studies have improved on these static approaches (e.g. Araújo &
Williams, 2000; Araújo et al., 2002a,b; Cabeza, 2003; Cabeza et al.,
2004), if we begin to consider more sophisticated problems,
such as the conservation implications of climate change, with all
the associated uncertainties, then the various model effects mul-
tiply (Fig. 1; Araújo et al., 2004a; Meir et al., 2004; Williams et al.,
2005). The use of so-called bioclimate envelope models to capture
the relationship between species distributions and climate space and
thereby to model future responses to climate change has advanced
considerably in the last few years. Yet, the sensitivity to key assump-
tions is such that the resulting bioclimate envelope modelling
projections are so uncertain as to effectively compromise their
practical value (compare Buckley & Roughgarden, 2004; Thomas
et al., 2004; Thuiller et al., 2004) notwithstanding the wider
impact they may have (Ladle et al., 2004; Hannah & Phillips, 2004).
These models should be seen as providing merely interesting
‘what if ’ scenarios, until such time as we find ways of assessing
model variability and reliability quantitatively (Hannah et al., 2002;
Pearson & Dawson, 2003, 2004).
(iv) Adequacy of theory
In addition to practical issues concerning e.g. finding the most
efficient tree building or complementarity algorithms, it is also
important to consider the adequacy of biogeographic theory.
Whilst this theme is only partially separable from the foregoing
sections, it is important to focus explicitly on some of the deeper
questions concerning the paradigmatic structures within which
conservation biogeography has so far been constructed. For
instance, in respect of spatial scale, it has long been appreciated
that species richness of otherwise equivalent sample areas
increases as larger areas are sampled. Thus comparative analyses
of richness — whether exploring causation in species diversity or
assessing conservation importance — which fail to hold area
effectively constant, are fatally compromised (Whittaker et al.,
2001; Brummitt & Lughadha, 2003; Ovadia, 2003). One reason
they continue to feature in the literature is that insufficient efforts
have been made to develop diversity theory structured with
respect to scale (Whittaker et al., 2001, 2003; Willis & Whittaker,
2002; Rosenzweig, 2003; Whittaker, 2004).
In respect of temporal perspectives, despite a number of calls
for change, a paradigmatic structure persists within conservation
that the environment has two ‘states’: pre- and post-anthropogenic
impact. Prior to anthropogenic impact the ecosystems is viewed
as an undisturbed natural system in equilibrium with the envi-
ronment: it is ‘pristine’ and change is slow. In contrast, the post-
anthropogenic period is seen as a time of rapid change, where a
threshold is exceeded and the environment irrevocably altered
for the worse. Yet there are now numerous studies to indicate that
this structure is far too simplistic. For instance, some of the sys-
tems associated with the labels ‘pristine’ and ‘fragile’ turn out to
have recovered from past intensive human use (Willis et al.,
2004a,b). The use of such value-laden terms is part and parcel of
this two-state worldview (cf. Stott, 1998; Trudgill, 2001), and it is
a paradigm we surely need to break away from in recognition of
the capacity of biogeographical phenomena to be variously
equilibrial and non-equilibrial dependent on the properties under
scrutiny, the geographical context, and the spatial and temporal
scales of the assessment (as Whittaker, 2004).
One prominent contribution of biogeography to conservation
biology has been the use of island theory, in which the dynamic,
equilibrium theory of MacArthur &Wilson (1967) has been
seminal. We take this body of theory in illustration of the impor-
tance of improved theoretical foundations. In the early 1970s,
Diamond (1975) and others set out a theoretical framework for
fragmentation research derived from MacArthur–Wilson theory,
which has spawned a host of studies of species area relationships
(SPARs) for terrestrial ‘habitat islands’. The premise is that
habitat fragmentation will produce predictable patterns of species
Figure 3 Sensitivity to thresholds in modelling representation in Protected Areas. Coloured cells show species richness (maximum values in red) of plant species not represented in reserves using 10 × 10 km grid cells (for mainland Portugal). A cell is switched on as reserved dependent on how much of its area is covered by a reserve, using thresholds varying from 1% up to 99%. Grey cells are those that have at least some reserved area within them (figure modified from Araújo, 2004, Fig. 2; reproduced with permission from Elsevier).
R. J. Whittaker et al.
12 Diversity and Distributions, 11, 3–23, © 2005 Blackwell Publishing Ltd
loss as previously equilibrial patches become ‘supersaturated’
and thereafter ‘relax’, i.e. shed species. Diamond drew on sup-
porting quantitative evidence for relaxation coming largely from
‘land-bridge islands’, the assumption being that prior to sea level
rise at the start of the Holocene, these islands would have been
connected to the mainland, and would have shared close to the
full quota of species now present on the mainland. The discrepancy
between this assumed starting value and that derived from
species–area plots for ‘control’ areas is taken to represent the
number of extinctions, with the speed of equilibration being seen
as an inverse function of area. The possibilities that the observed
discrepancies reflect the influence of variables other than area
and isolation, or that biotas may not initially be in the assumed
equilibrium richness state prior to fragmentation (Boecklen &
Gotelli, 1984; Boecklen, 1986) were recognized but downplayed.
Diamond made a number of fairly bold statements about our
ability to predict not only total numbers of losses (the oft-cited
50% species remaining in 10% of the area figure) but also rates of
losses. Then, as now, such predictions appear to be derived largely
from inferences based on studies of actual islands, and of the
form of SPARs (e.g. Rosenzweig, 1995, 2003) rather than on
studies of recorded losses from fragmented habitats within large
landmasses (but see Stouffer & Bierregaard, 1996).
It is disappointing that we still know so little about the power
and timescale of ‘species relaxation’. There have paradoxically
been many studies of fragmentation, but remarkably few appear
to have had ‘before’ and ‘after’ data or have undertaken repeat
surveys of the same fragments over a lengthy period (but see
Honnay et al., 1999; Gonzalez, 2000; Bierregaard et al., 2001). As
a result, inferences have to be made based on the use of the
species–area relationship, typically assuming: a fixed z value (slope)
of 0.25 (e.g. Brooks et al., 2002), that the system was essentially
equilibrial prior to fragmentation, and that the properties of the
matrix habitats can be ignored. Each of these assumptions is
problematic (Whittaker, 1998; Watson et al., 2005).
An important contribution to our understanding of SPARs
is provided by Rosenzweig (1995, 2003), who demonstrated the
importance of separating out different categories of curve (and
see Scheiner, 2003, 2004; Gray et al., 2004a,b). First, we may re-
cognize and discount species-accumulation or collectors curves
(Gray et al., 2004b), which describe the increase in total number
of species with increasing collection effort within an area. Rosen-
zweig recognizes three scales of ‘true’ species–area curves (whereby
number of species for each area is plotted against area), which he
terms the sample–area, archipelagic and interprovincial. Respec-
tively, these are (i) sample–area: constructed from considering
different sized (non-nested) samples from within non-isolated
habitat within the same region; (ii) archipelagic: from islands of
an archipelago; and (iii) interprovincial: constructed from all
species found in separate biological provinces, i.e. more or less
self-contained regions whose species are predominantly native
in origin. Rosenzweig argues that the z-values (slopes of the
log-richness–log-area relationship) vary systematically between
these three forms, (i) sample–area, typically between 0.1 and 0.2;
(ii) archipelagic, typically between 0.25 and 0.55; (iii) interpro-
vincial, 0.6–0.9. If these ranges are indeed typical, then they have
profound importance for understanding the eventual impact of
fragmentation on species losses, just as was suggested by MacArthur
& Wilson (1967). In other words, as systems move from the sample–
area to archipelagic curve they should shed species, and should
do so at a predictable rate.
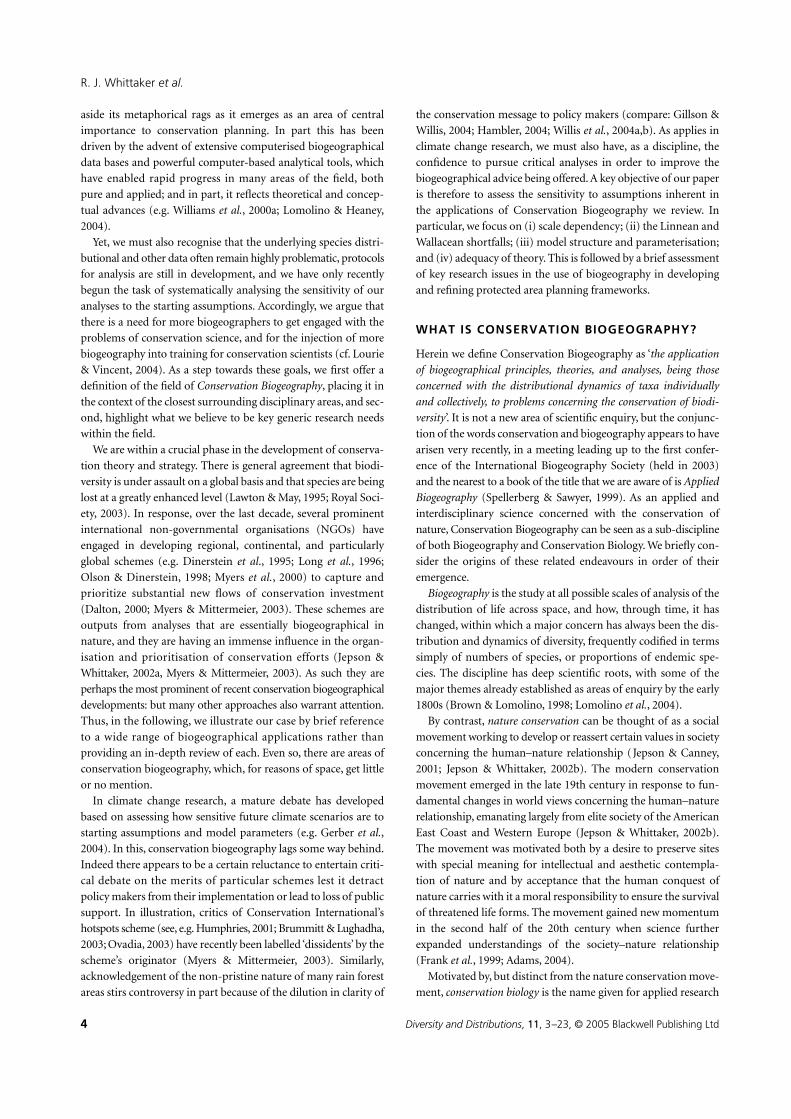
Unfortunately, island theory does not tell us how species
should be distributed across a system of fragments, and this is
crucial to the issue of whether it is better to advocate one very
large reserve, or several smaller ones of the same total area. To
some extent, Diamond himself acknowledged this when he wrote
‘separate reserves in an inhomogeneous region may each favour the
survival of a different group of species; and … even in a homogeneous
region, separate reserves may save more species of a set of vicariant
similar species, one of which would ultimately exclude the others
from a single reserve’ (Diamond, 1975). If we take two extremes,
systems could be either perfectly nested, or perfectly non-nested.
If nested, it means that each smaller set of species is a perfect sub-
set of the next larger: in which case the total number of species
held by the system of fragments is the number held in the largest
(richest) patch. If the fragment system is perfectly non-nested,
then the number held in the system as a whole is the sum of the
number held in each patch, as each contains unique species (Fig. 4).
Empirical work to date indicates that most systems tend signifi-
cantly towards being nested, but are not perfectly nested (Whit-
taker, 1998). But, how sensitive are these observations, of
SPAR z-values and of compositional structure, to the scale of our
system, i.e. to the grain and extent of the data? As fragments are
Figure 4 A variant on the theme of the design principles for nature reserves, originally derived from consideration of island theory by Diamond (1975) and others. Here we posit a choice between a single large reserve and a network of smaller reserves of approximately the same total area. In the perfectly nested system, the largest reserve contains all the species in the reserve network. In the perfectly non-nested system, the set of smaller reserves contains more species than the largest reserve and no species in common with it. Empirical data tend to support nestedness as a general property of small island/habitat island data sets sampled from within a landscape or small region. The degree of nestedness must diminish if islands/habitat islands from across larger areas, or distinctive biogeographical areas are considered.
Conservation Biogeography
Diversity and Distributions, 11, 3–23, © 2005 Blackwell Publishing Ltd 13
considered across a wider area, encompassing more diverse
microenvironments and more biogeographic history, so we cap-
ture more beta diversity, and nestedness must diminish in a hab-
itat island data set. Thus, the answer to the SLOSS debate can be
expected to change from an emphasis on large reserves to an
emphasis on many, comparatively smaller reserves, as the grain
and extent increase above the local-landscape scale.
Moreover, it has recently been argued that the approach to
model fitting for SPARs should be based on an updated consider-
ation of ecology rather than statistics, i.e. that we should examine
the fit of theoretical (mechanistic) models against empirical data sets
rather than setting out to find the best straight-line fit through
the data (Tjørve, 2003). Lomolino (2000) has also questioned the
approach of using data transformation in search of the best linear
fit. He argues that there may be good ecological reasons to posit
more complex scale-dependent relationships, and that untrans-
formed SPARs should exhibit a sigmoidal form, with a phase
across low values of area where species numbers scarcely increase,
followed by a rapid increase with area and a subsequent flattening
as the number of species approaches the richness of the species pool.
The existence of a ‘small island’ effect appears well established
(Lomolino 2000, 2002; Lomolino & Weiser, 2001), and thus must
have some influence on z-values in standard linear SPAR regres-
sions, but Williamson et al. (2001, 2002) contend that there is no
evidence of an upper asymptote. It is noteworthy that the form
and biological meaning of SPARs remains the subject of so much
debate and confusion. One important reason is that empirical
data sets each have their own unique combination of variation in
contributory environmental variables (e.g. area, elevation, climate,
habitat type, isolation, disturbance histories, etc.). Each of which
has relevance, but not necessary significantly so over all scales
within the empirical data gathered. Perhaps unsurprisingly, few
SPAR analyses have attempted to tackle such threshold responses
in respect of the complex array of potentially important,
interacting variables. It has thus proven difficult to identify
general patterns, and to develop general models through this
approach.
Yet, numerous habitat island data sets have been collected, and
so what is needed is not necessarily new field efforts, but more
concerted efforts in analysis and synthesis, to tease out the scale
sensitivity of habitat island data sets, particularly, the form of
their SPARs, and their compositional structure, and how these
responses vary between different higher taxa (e.g. butterflies, all
invertebrates, higher plants, birds). Some theoreticians, notably
Rosenzweig (2003), see dire implications in the continued process
of ecosystem fragmentation and area reduction as systems move
from samples to archipelagic to interprovincial SPAR forms. Yet,
it is also important to recognise that whilst on a global scale bio-
diversity is suffering attrition (i.e. species are going extinct at well
above background rates), at local and regional scales, patterns of
change are quite variable. The introduction of non-native species
and alterations of habitat typically result in the loss of particular
sets of species at the local scale, yet at the regional scale — and
sometimes locally also — the net effect may commonly be increases
in species richness (McKinney, 2002; Sax et al., 2002; Sax &
Gaines, 2003). How can such observations be reconciled?
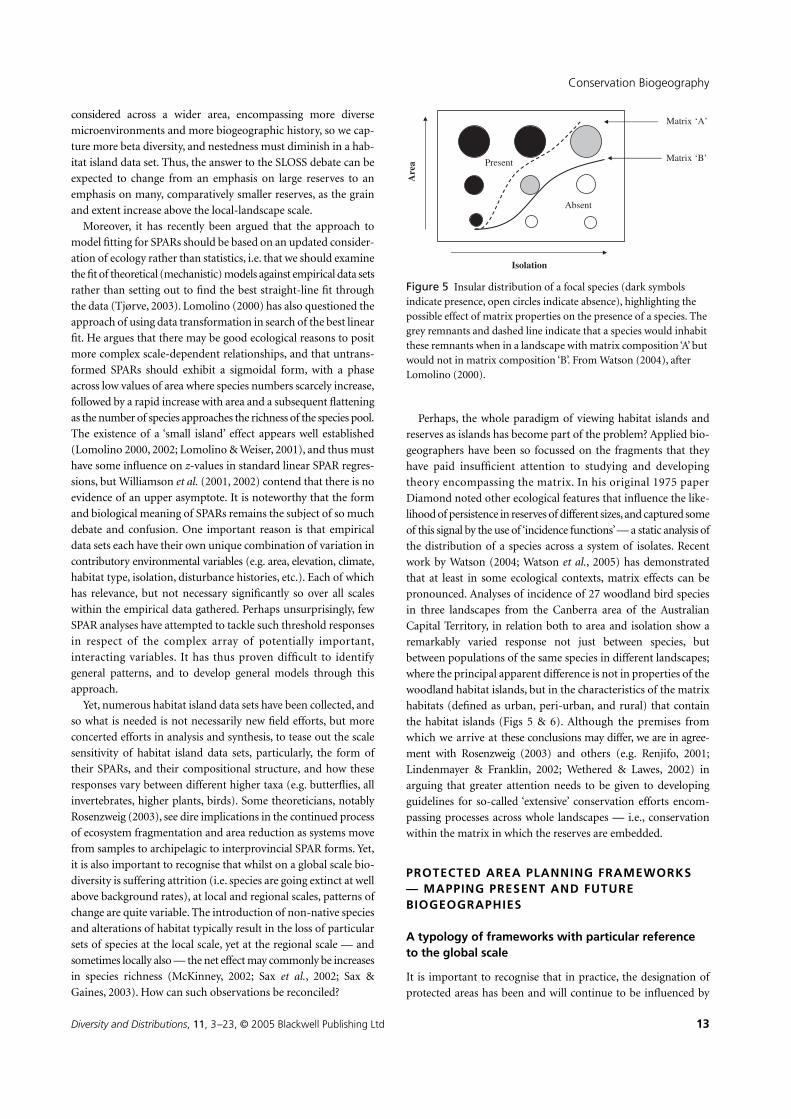
Perhaps, the whole paradigm of viewing habitat islands and
reserves as islands has become part of the problem? Applied bio-
geographers have been so focussed on the fragments that they
have paid insufficient attention to studying and developing
theory encompassing the matrix. In his original 1975 paper
Diamond noted other ecological features that influence the like-
lihood of persistence in reserves of different sizes, and captured some
of this signal by the use of ‘incidence functions’ — a static analysis of
the distribution of a species across a system of isolates. Recent
work by Watson (2004; Watson et al., 2005) has demonstrated
that at least in some ecological contexts, matrix effects can be
pronounced. Analyses of incidence of 27 woodland bird species
in three landscapes from the Canberra area of the Australian
Capital Territory, in relation both to area and isolation show a
remarkably varied response not just between species, but
between populations of the same species in different landscapes;
where the principal apparent difference is not in properties of the
woodland habitat islands, but in the characteristics of the matrix
habitats (defined as urban, peri-urban, and rural) that contain
the habitat islands (Figs 5 & 6). Although the premises from
which we arrive at these conclusions may differ, we are in agree-
ment with Rosenzweig (2003) and others (e.g. Renjifo, 2001;
Lindenmayer & Franklin, 2002; Wethered & Lawes, 2002) in
arguing that greater attention needs to be given to developing
guidelines for so-called ‘extensive’ conservation efforts encom-
passing processes across whole landscapes — i.e., conservation
within the matrix in which the reserves are embedded.
PROTECTED AREA PLANNING FRAMEWORKS — MAPPING PRESENT AND FUTURE BIOGEOGRAPHIES
A typology of frameworks with particular reference to the global scale
It is important to recognise that in practice, the designation of
protected areas has been and will continue to be influenced by
Figure 5 Insular distribution of a focal species (dark symbols indicate presence, open circles indicate absence), highlighting the possible effect of matrix properties on the presence of a species. The grey remnants and dashed line indicate that a species would inhabit these remnants when in a landscape with matrix composition ‘A’ but would not in matrix composition ‘B’. From Watson (2004), after Lomolino (2000).

R. J. Whittaker et al.
14 Diversity and Distributions, 11, 3–23, © 2005 Blackwell Publishing Ltd
diverse and complex environmental, socio-economic and politi-
cal factors (e.g. Sutherland, 1998; Jepson & Whittaker, 2002b).
But in the following account, in the interests of simplification, we
focus exclusively on the scientific principles underpinning the
designation of protected areas.
The concept that the world is a patchwork of regions differing
in their biological makeup has profoundly influenced how
humanity perceives and interacts with the natural world. The
concept of biological regions emerged as a result of European
expansion in the tropics from the 16th century onwards and the
desire to understand the diversity, richness and patterns of nature
for religious, intellectual and economic purposes (Lomolino et al.,
2004). The realisation that nature differed in different parts of
the world, and the subsequent spatial representations of these
differences, played an important role in the planning and execu-
tion of the European colonial endeavour, the creation of national
identities, and the development of international tourism among
other things. Maps play an important role in the communication
of biogeographic theory and are powerful tools within conserva-
tion biogeography (cf. Dalton, 2000; Myers & Mittermeier,
2003). But, maps are only a symbolic representation of nature
(Demeritt, 2001), and the choice of criteria and variables used to
create the maps will be strongly influenced by what the creators
of the map value (Williams et al., 2000a).
In the 1960s there was widespread support within the conser-
vation community for the goal of establishing a worldwide
network of natural reserves encompassing representative areas of
the world’s ecosystems. Under the aegis of the IUCN, Dasmann
(1972, 1973) and Udvardy (1975) put this ‘biogeographic repre-
sentation principle’ into practice, by extending and combining
earlier maps of faunal regions (Wallace) and vegetation zones
(Clements) to create a nested hierarchy of biological regions (Table 1,
Jepson & Whittaker, 2002a). Their work is foundational within
conservation biogeography and provided the framework for
a massive and rapid expansion of protected areas globally.
The Dasmann–Udvardy framework subdivides the globe into
faunal regions (biotic realms) within which a biome classifica-
tion system is applied, with biotic provinces delineated by subdi-
viding a physiognomically defined climax vegetation type on the
basis of a distinctive fauna. Areas with less than 65% of their spe-
cies in common are delimited as separate faunal provinces, and
this essentially zonal scheme is afforced by the recognition of
Figure 6 Incidence curves for six area-sensitive woodland species in different landscape matrices in the ACT region of southeastern Australia. The three woodland landscapes surveyed were: agricultural (n = 55 fragments), modified (peri-urban) (n = 42) and urban (n = 30). Incidence functions were developed using the results of a logistic regression based on the presence/absence of each species in woodland remnants in each landscape. From Watson (2004).

Conservation Biogeography
Diversity and Distributions, 11, 3–23, © 2005 Blackwell Publishing Ltd 15
azonal features such as high mountains and mountainous islands.
As originally developed, the approach was confined to bird and
mammal data and to a coarse scale of application, but it was sub-
sequently refined for use at a finer scale, by using the same algo-
rithm for smaller geographical units (Mackinnon & Wind, 1981;
Mackinnon & Mackinnon, 1986a,b; Jepson & Whittaker, 2002a).
This scheme provides a transparent methodology with a clearly
defined purpose, and in principle the analysis can be repeated to
assess the implications of, for instance, using updated distributional
data, a different system of biogeographic regions (cf. Cox, 2001),
or threshold similarity value.
Since the development of the biogeographic regions approach,
the tools for biogeographic research have undergone a radical
transformation, as computerised databases and advanced spatial
analytical approaches have been developed. Whilst the Dasmann–
Udvardy approach remains an important foundational scheme
at a global scale (Table 1), it has in practical terms been super-
seded at this scale by other global schemes developed and pro-
moted by major conservation NGOs, whilst within regions a far
greater array of approaches have been developed both by NGOs
and other actors from the scientific community (e.g. Redford
et al., 2003). In Table 1 we identify the WWF Ecoregions scheme
as a prominent global scheme based on the principle of biogeo-
graphic representation (e.g. Dinerstein et al., 1995). It incorpo-
rates data on biogeography, habitat type and elevation to identify
biogeographic units at a finer scale than the original Dasmann–
Udvardy framework. The approach aims to meet the goals of
representation and also to draw up natural units within which
ecological flows and linking processes are maintained. In this
way, the approach combines both compositionalist and func-
tionalist perspectives (as Callicott et al., 1999; Williams & Araújo,
2000, 2002). The WWF Ecoregions approach, specifically as
applied within Indonesia, has been criticised by Jepson & Whit-
taker (2002a) for a variety of reasons, including data deficiencies
and a lack of transparency as to the criteria involved in fine-scale
designations. No schemes are entirely free of such problems, and
Wikramanayake et al. (2002) provide a defence of the approach
in an equally forthright reply. The scheme’s proponents are of
course driven by the heavy responsibility of getting on with the
job of putting theory into practice, and effecting conservation
actions on the ground. But, it would be naïve to think of any such
map as being the final say in land-use planning and designation,
as such battles have to be constantly re-fought and occasionally
land abandonment provides new opportunities for ecological
restoration and/or for inclusion of new areas into protected area
networks (cf. Meir et al., 2004). Magnusson (2004) argues that as
ecoregion approaches are being heavily promoted, more rigor-
ous tests of their delineation are urgently needed. He was writing
about an attempt to test the validity of Bailey’s foundational
ecoregions scheme, but the same case can be made for the WWF
scheme. Magnusson suggests a simple approach involving look-
ing for natural breaks in species distributions across ecoregion
boundaries, and a more sophisticated approach to the problem is
illustrated by Williams (1996) and Williams et al. (1999).
To improve further on the alternative representation frame-
works available requires several components. First, the criteria of
the scheme must be transparent and explicit. Second, the data on
which the frameworks are built must be available and of a quality
sufficient to the task, involving both biogeographical data and
environmental data. Third, schemes once developed should be
subject to further, independent tests of their efficiency and
robustness (as e.g. Stoms, 1994; Williams et al., 1999). In prac-
tice, the broad framework for biogeographic representation is
generally agreed at the global scale (although, see Cox, 2001) and
it is arguably at the meso-scale that improvements in data quality
might produce significant alterations in the maps and adjust-
ments in conservation efforts.
An alternative approach to reliance on biogeographic data
sensu stricto was formalised by Faith & Walker (1996a,b), who
based their approach on the correspondence between increasing
numbers of (and/or increasing difference between) environmen-
tal domains and increased biodiversity. They noted that sampling
environmental pattern, or compositional variation within one
indicator group, would predict compositional variation within
other groups if they spanned the entire range of habitats or envi-
ronments available. Hence, sampling environmental pattern (or
assemblage pattern) itself would be an alternative to selecting
areas using species distribution data directly. Whilst this approach
has some merits, its effectiveness in achieving pre-determined
goals has yet to be consistently demonstrated (compare Faith and
Walker, 1996a,b; Ferrier & Watson, 1997; Araújo et al., 2001,
2004b). For example, Araújo et al. (2001) showed that European
plants exhibited consistent non-random positive patterns of re-
presentation with conservation areas selected to maximise pattern
variation among environmental domains, but that terrestrial
vertebrates (especially reptiles and amphibians) were consist-
ently under-represented with this approach. They argued that
the degree of success of environmental-diversity strategies would
be contingent on the contribution of historical biogeography
shaping current distributions. According to this view, taxa with
poor dispersal abilities (e.g. reptiles and amphibians) would be
in clear disadvantage compared with those of good dispersal
abilities (e.g. plants), which would more easily achieve conditions
of quasi-equilibrium with current environmental conditions,
and hence would be better predicted by environmental-based
surrogates. Although evidence of the ability of environmental-
and assemblage-based models to represent biodiversity at a rate
higher than expected by chance is currently lacking (Araújo et al.,
2003), the approach is still strongly advocated by its proponents
(e.g. Faith, 2003; Faith et al., 2004). This is one example where
conservation values, epistemology, theories of equilibrium in
biogeography and numerical ecological techniques are inter-
mingled in a complex but possibly important debate within
Conservation Biogeography.
Hotspot approaches at the global scale contrast with biogeo-
graphical representation approaches by focusing on the richness
and endemism of areas combined with a measure of the threat to
biodiversity (Table 1). There are a number of prominent global
schemes, including: the IUCN–WWF Centres of Plant Diver-
sity, Birdlife International’s Endemic Bird Areas (e.g. Long et al.,
1996; Stattersfield et al., 1998), and Conservation International’s
(CI) hotspots (Myers et al., 2000). Applications of the hotspots

R. J. Whittaker et al.
16 Diversity and Distributions, 11, 3–23, © 2005 Blackwell Publishing Ltd
approach are based, partly through necessity, on a limited array
of taxa. For instance, the 25 CI hotspots are delimited solely on
the basis of plant endemism and habitat conversion statistics.
Myers et al. (2000) claim that the hotspots hold 44% of the
world’s plant species and 35% of the vertebrates in 12% of the
land area of the earth. These taxa, however, represent a relatively
small proportion of the species on earth, and it remains to be
established what proportion of, for example, insects, are found
within these areas. The areas delimited are also far too coarse, of
themselves, to guide issues such as reserve placements. Rather they
provide a global ‘cookie cutter’ of large areas deemed most deserv-
ing of conservation funding and attention. The approach has
been remarkably successful in terms of fund raising, and if
successful in implementation could make a significant contribu-
tion to reducing global biodiversity loss (Myers & Mittermeier,
2003).
The CI hotspots approach can be criticised on several grounds,
including: (i) that it serves only a limited set of values (Jepson &
Canney, 2001); (ii) that it sends out a powerful if entirely unin-
tentional signal that biodiverse areas excluded from the list of
hotspots do not matter in conservation terms (Bates & Demos,
2001); (iii) that it is a very coarse-resolution and simplistic ana-
lysis (Mace et al., 2000); and (iv) that there seems to be no under-
lying base map, and certainly nothing approaching an equal-area
grid cell system is involved, so that the basis for delimiting the
boundaries of the areas selected appears essentially arbitrary.
Moreover, in examining the applicability of the approach to the
marine realm, Hughes et al. (2002) find that first, richness peaks
do not coincide with centres of high endemicity in Indo-Pacific
corals and reef fishes, and second, that fish and coral endemicity
patterns are at variance with one another. They therefore argue
against marine prioritisation by ‘hotspots’, instead calling for a
focus on preserving connectivity and genetic diversity of widely
dispersed species combined with intensive protection of quite
localised areas of high endemicity.
Criticisms have also been levelled at the way in which CI’s 25
selected terrestrial hotspots have been ranked internally (Brummitt
& Lughadha, 2003; Ovadia, 2003), with Brummitt & Lughadha
correctly arguing that the use of unscaled species–area ratios to
select the ‘hottest hotspots’ is inappropriate. Myers & Mitter-
meier (2003) sidestep the scientific criticism in their response to
Brummitt & Lughadha (2003), pointing to the urgency of action
for conservation, the $750 m raised in support funds for CI’s
hotspots scheme, and expressing frustration at the slowness of
the scientific community to engage with their approach. The ten-
sion between the priorities of major NGOs and academic debate
is understandable. The point of our listing the above criticisms of
the WWF Ecoregions and CI hotspots programmes is not to
undermine them as a basis for taking conservation action now,
but to encourage an ongoing effort from conservation biogeo-
graphers to update, revise and test protected area planning frame-
works at global and also regional scales. We see this as valuable
because first, the broader goals of nature conservation are such
that we need alternative sets of maps, capturing and representing
different value sets, and second, because as our data, theory, and
models improve, we can refine our planning frameworks to bet-
ter serve these goals (cf. Mace et al., 2000; Williams et al., 2000a;
Rodrigues et al., 2004). Moreover, as such large sums and efforts
are involved, it is surely crucial that we provide the checks and
balances to ensure that the resources are deployed effectively, and
one part of this is about a continuing process of reviewing the
scientific basis (Meir et al., 2004).
To complete our typology of global protected area approaches
(Table 1), we have designated a third type of approach — ‘impor-
tant areas’ — as being distinct from representation and hotspot
approaches. As exemplified by Birdlife International’s Important
Bird Areas (IBAs) scheme, important areas are key sites for con-
servation, small enough to be conserved in their entirety and
often already part of a protected-area network. The stated criteria
for selection of IBA sites are that they do one or more of the fol-
lowing things: (i) they hold significant numbers of one or more
globally threatened species; (ii) they are one of a set of sites that
together hold a suite of restricted-range species or biome-
restricted species; and (iii) they have exceptionally large numbers
of migratory or congregatory species (http://www.birdlife.net/
action/science/sites/ visited September 2004). The scheme pro-
vides a fine-scale network of sites, below the level of resolution
of Birdlife’s Endemic Bird Areas approach: for instance there
are some 4000 IBA sites in Europe alone, in contrast to 218 EBAs
globally.
In moving from the global to the regional scale of application,
it is clear that there are numerous approaches to mapping and
prioritising putative or existing protected areas (e.g. Pressey &
Nicholls, 1989; Margules & Pressey, 2000; Williams et al., 2000b;
Cabeza & Moilanen, 2001; Williams & Araújo, 2002; Dimitrako-
poulos et al., 2004). Typically these approaches take grid-cell
based species range data and use reiterative computer algorithms
to select complementary sets of cells that achieve a predeter-
mined goal. These approaches have the advantage of making
goals, values and priorities explicit before area priorities are
defined. They are quantitative, repeatable and ensure that effi-
cient and effective solutions are obtained for a set of pre-selected
goals and data (Williams et al., 2000a). Unfortunately, they are
also very data-hungry and highly sensitive to data quality
(Flather et al., 1997; Freitag et al., 1998; Araújo, 2004; Araújo
et al., 2004b). Hence, quantitative ‘gap analyses’ have until very
recently been restricted to problems of regional extent. The
application of this approach at a global scale by Rodrigues et al.
(2004) using data for several groups of terrestrial vertebrates
thus represents an important development, supplementing the
approaches identified in Table 1.
INTEGRATING PATTERN AND PROCESS
In an earlier section of this paper we discussed how varied the
protected area system outcomes can be from taking different
approaches to selecting areas, dependent for instance on the taxo-
nomic level, and whether the emphasis is on richness, endemism,
or perceived threats. This type of approach can be characterised
as compositionalist, as such analyses provide an essentially static
assessment of varying aspects of the present composition of the
biota and seek to preserve the option value that comes from variety
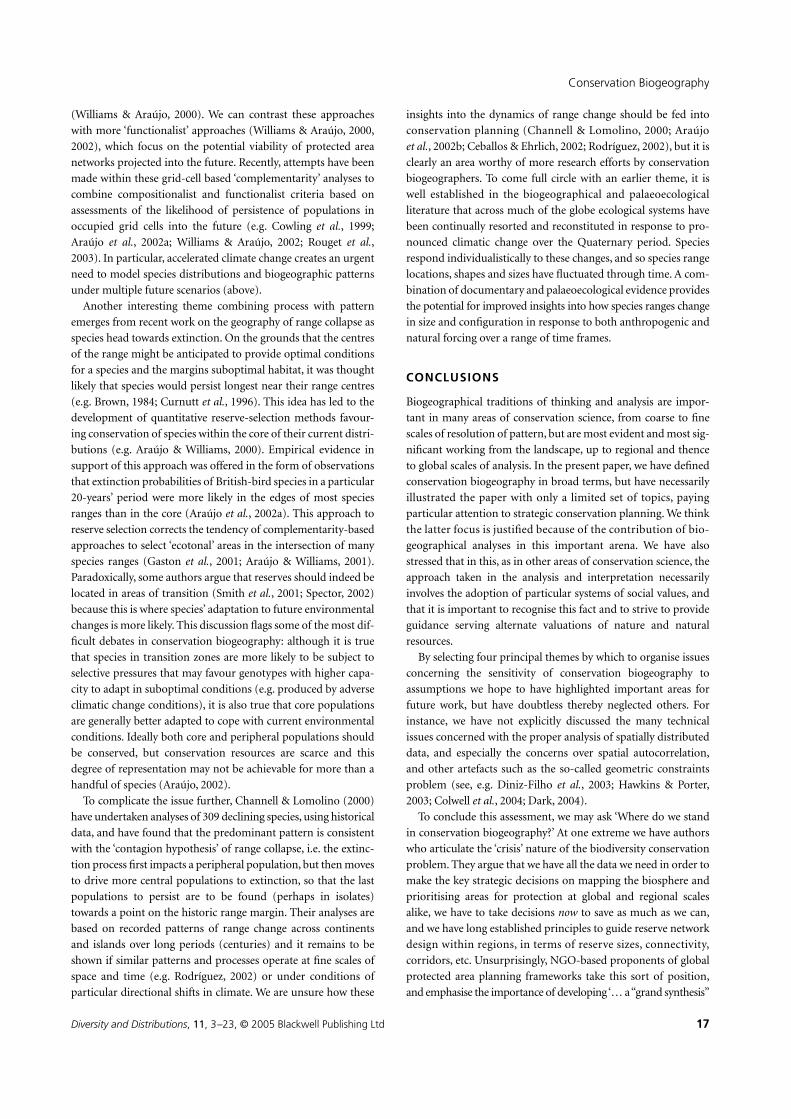
Conservation Biogeography
Diversity and Distributions, 11, 3–23, © 2005 Blackwell Publishing Ltd 17
(Williams & Araújo, 2000). We can contrast these approaches
with more ‘functionalist’ approaches (Williams & Araújo, 2000,
2002), which focus on the potential viability of protected area
networks projected into the future. Recently, attempts have been
made within these grid-cell based ‘complementarity’ analyses to
combine compositionalist and functionalist criteria based on
assessments of the likelihood of persistence of populations in
occupied grid cells into the future (e.g. Cowling et al., 1999;
Araújo et al., 2002a; Williams & Araújo, 2002; Rouget et al.,
2003). In particular, accelerated climate change creates an urgent
need to model species distributions and biogeographic patterns
under multiple future scenarios (above).
Another interesting theme combining process with pattern
emerges from recent work on the geography of range collapse as
species head towards extinction. On the grounds that the centres
of the range might be anticipated to provide optimal conditions
for a species and the margins suboptimal habitat, it was thought
likely that species would persist longest near their range centres
(e.g. Brown, 1984; Curnutt et al., 1996). This idea has led to the
development of quantitative reserve-selection methods favour-
ing conservation of species within the core of their current distri-
butions (e.g. Araújo & Williams, 2000). Empirical evidence in
support of this approach was offered in the form of observations
that extinction probabilities of British-bird species in a particular
20-years’ period were more likely in the edges of most species
ranges than in the core (Araújo et al., 2002a). This approach to
reserve selection corrects the tendency of complementarity-based
approaches to select ‘ecotonal’ areas in the intersection of many
species ranges (Gaston et al., 2001; Araújo & Williams, 2001).
Paradoxically, some authors argue that reserves should indeed be
located in areas of transition (Smith et al., 2001; Spector, 2002)
because this is where species’ adaptation to future environmental
changes is more likely. This discussion flags some of the most dif-
ficult debates in conservation biogeography: although it is true
that species in transition zones are more likely to be subject to
selective pressures that may favour genotypes with higher capa-
city to adapt in suboptimal conditions (e.g. produced by adverse
climatic change conditions), it is also true that core populations
are generally better adapted to cope with current environmental
conditions. Ideally both core and peripheral populations should
be conserved, but conservation resources are scarce and this
degree of representation may not be achievable for more than a
handful of species (Araújo, 2002).
To complicate the issue further, Channell & Lomolino (2000)
have undertaken analyses of 309 declining species, using historical
data, and have found that the predominant pattern is consistent
with the ‘contagion hypothesis’ of range collapse, i.e. the extinc-
tion process first impacts a peripheral population, but then moves
to drive more central populations to extinction, so that the last
populations to persist are to be found (perhaps in isolates)
towards a point on the historic range margin. Their analyses are
based on recorded patterns of range change across continents
and islands over long periods (centuries) and it remains to be
shown if similar patterns and processes operate at fine scales of
space and time (e.g. Rodríguez, 2002) or under conditions of
particular directional shifts in climate. We are unsure how these
insights into the dynamics of range change should be fed into
conservation planning (Channell & Lomolino, 2000; Araújo
et al., 2002b; Ceballos & Ehrlich, 2002; Rodríguez, 2002), but it is
clearly an area worthy of more research efforts by conservation
biogeographers. To come full circle with an earlier theme, it is
well established in the biogeographical and palaeoecological
literature that across much of the globe ecological systems have
been continually resorted and reconstituted in response to pro-
nounced climatic change over the Quaternary period. Species
respond individualistically to these changes, and so species range
locations, shapes and sizes have fluctuated through time. A com-
bination of documentary and palaeoecological evidence provides
the potential for improved insights into how species ranges change
in size and configuration in response to both anthropogenic and
natural forcing over a range of time frames.
CONCLUSIONS
Biogeographical traditions of thinking and analysis are impor-
tant in many areas of conservation science, from coarse to fine
scales of resolution of pattern, but are most evident and most sig-
nificant working from the landscape, up to regional and thence
to global scales of analysis. In the present paper, we have defined
conservation biogeography in broad terms, but have necessarily
illustrated the paper with only a limited set of topics, paying
particular attention to strategic conservation planning. We think
the latter focus is justified because of the contribution of bio-
geographical analyses in this important arena. We have also
stressed that in this, as in other areas of conservation science, the
approach taken in the analysis and interpretation necessarily
involves the adoption of particular systems of social values, and
that it is important to recognise this fact and to strive to provide
guidance serving alternate valuations of nature and natural
resources.
By selecting four principal themes by which to organise issues
concerning the sensitivity of conservation biogeography to
assumptions we hope to have highlighted important areas for
future work, but have doubtless thereby neglected others. For
instance, we have not explicitly discussed the many technical
issues concerned with the proper analysis of spatially distributed
data, and especially the concerns over spatial autocorrelation,
and other artefacts such as the so-called geometric constraints
problem (see, e.g. Diniz-Filho et al., 2003; Hawkins & Porter,
2003; Colwell et al., 2004; Dark, 2004).
To conclude this assessment, we may ask ‘Where do we stand
in conservation biogeography?’ At one extreme we have authors
who articulate the ‘crisis’ nature of the biodiversity conservation
problem. They argue that we have all the data we need in order to
make the key strategic decisions on mapping the biosphere and
prioritising areas for protection at global and regional scales
alike, we have to take decisions now to save as much as we can,
and we have long established principles to guide reserve network
design within regions, in terms of reserve sizes, connectivity,
corridors, etc. Unsurprisingly, NGO-based proponents of global
protected area planning frameworks take this sort of position,
and emphasise the importance of developing ‘… a “grand synthesis”
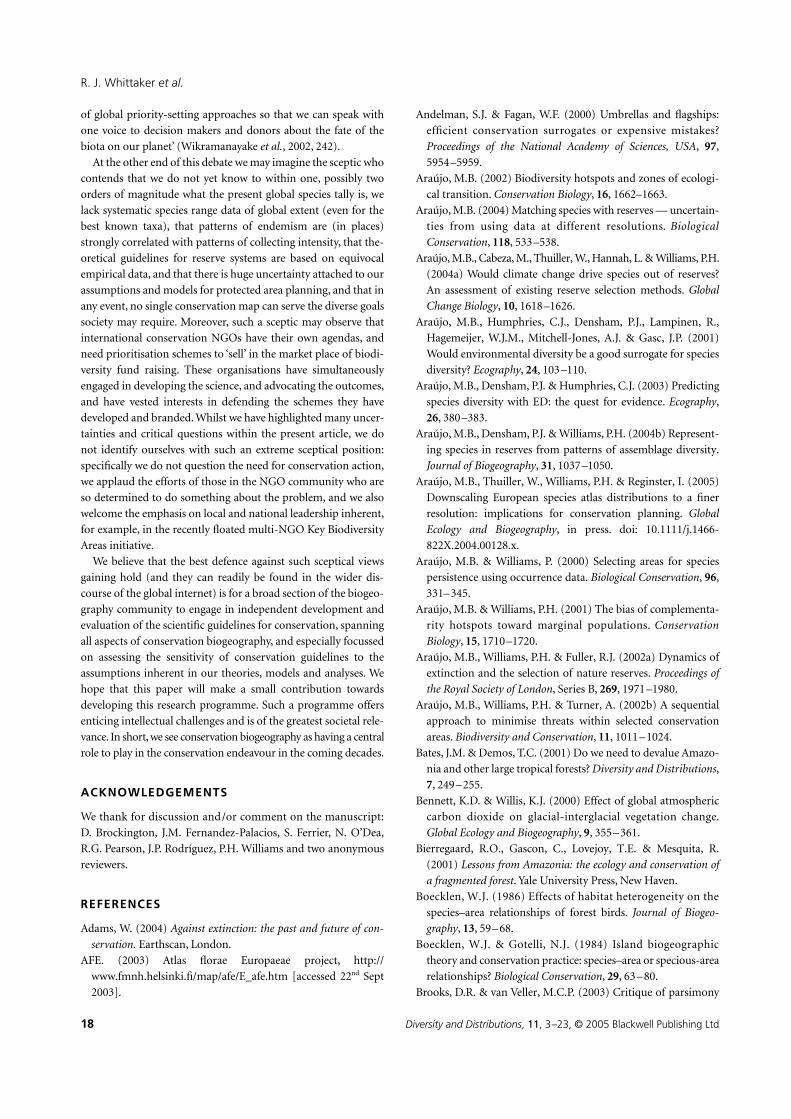
R. J. Whittaker et al.
18 Diversity and Distributions, 11, 3–23, © 2005 Blackwell Publishing Ltd
of global priority-setting approaches so that we can speak with
one voice to decision makers and donors about the fate of the
biota on our planet’ (Wikramanayake et al., 2002, 242).
At the other end of this debate we may imagine the sceptic who
contends that we do not yet know to within one, possibly two
orders of magnitude what the present global species tally is, we
lack systematic species range data of global extent (even for the
best known taxa), that patterns of endemism are (in places)
strongly correlated with patterns of collecting intensity, that the-
oretical guidelines for reserve systems are based on equivocal
empirical data, and that there is huge uncertainty attached to our
assumptions and models for protected area planning, and that in
any event, no single conservation map can serve the diverse goals
society may require. Moreover, such a sceptic may observe that
international conservation NGOs have their own agendas, and
need prioritisation schemes to ‘sell’ in the market place of biodi-
versity fund raising. These organisations have simultaneously
engaged in developing the science, and advocating the outcomes,
and have vested interests in defending the schemes they have
developed and branded. Whilst we have highlighted many uncer-
tainties and critical questions within the present article, we do
not identify ourselves with such an extreme sceptical position:
specifically we do not question the need for conservation action,
we applaud the efforts of those in the NGO community who are
so determined to do something about the problem, and we also
welcome the emphasis on local and national leadership inherent,
for example, in the recently floated multi-NGO Key Biodiversity
Areas initiative.
We believe that the best defence against such sceptical views
gaining hold (and they can readily be found in the wider dis-
course of the global internet) is for a broad section of the biogeo-
graphy community to engage in independent development and
evaluation of the scientific guidelines for conservation, spanning
all aspects of conservation biogeography, and especially focussed
on assessing the sensitivity of conservation guidelines to the
assumptions inherent in our theories, models and analyses. We
hope that this paper will make a small contribution towards
developing this research programme. Such a programme offers
enticing intellectual challenges and is of the greatest societal rele-
vance. In short, we see conservation biogeography as having a central
role to play in the conservation endeavour in the coming decades.
ACKNOWLEDGEMENTS
We thank for discussion and/or comment on the manuscript:
D. Brockington, J.M. Fernandez-Palacios, S. Ferrier, N. O’Dea,
R.G. Pearson, J.P. Rodríguez, P.H. Williams and two anonymous
reviewers.
REFERENCES
Adams, W. (2004) Against extinction: the past and future of con-
servation. Earthscan, London.
AFE. (2003) Atlas florae Europaeae project, http://
www.fmnh.helsinki.fi/map/afe/E_afe.htm [accessed 22nd Sept
2003].
Andelman, S.J. & Fagan, W.F. (2000) Umbrellas and flagships:
efficient conservation surrogates or expensive mistakes?
Proceedings of the National Academy of Sciences, USA, 97,
5954–5959.
Araújo, M.B. (2002) Biodiversity hotspots and zones of ecologi-
cal transition. Conservation Biology, 16, 1662–1663.
Araújo, M.B. (2004) Matching species with reserves — uncertain-
ties from using data at different resolutions. Biological
Conservation, 118, 533–538.
Araújo, M.B., Cabeza, M., Thuiller, W., Hannah, L. & Williams, P.H.
(2004a) Would climate change drive species out of reserves?
An assessment of existing reserve selection methods. Global
Change Biology, 10, 1618–1626.
Araújo, M.B., Humphries, C.J., Densham, P.J., Lampinen, R.,
Hagemeijer, W.J.M., Mitchell-Jones, A.J. & Gasc, J.P. (2001)
Would environmental diversity be a good surrogate for species
diversity? Ecography, 24, 103–110.
Araújo, M.B., Densham, P.J. & Humphries, C.J. (2003) Predicting
species diversity with ED: the quest for evidence. Ecography,
26, 380–383.
Araújo, M.B., Densham, P.J. & Williams, P.H. (2004b) Represent-
ing species in reserves from patterns of assemblage diversity.
Journal of Biogeography, 31, 1037–1050.
Araújo, M.B., Thuiller, W., Williams, P.H. & Reginster, I. (2005)
Downscaling European species atlas distributions to a finer
resolution: implications for conservation planning. Global
Ecology and Biogeography, in press. doi: 10.1111/j.1466-
822X.2004.00128.x.
Araújo, M.B. & Williams, P. (2000) Selecting areas for species
persistence using occurrence data. Biological Conservation, 96,
331–345.
Araújo, M.B. & Williams, P.H. (2001) The bias of complementa-
rity hotspots toward marginal populations. Conservation
Biology, 15, 1710–1720.
Araújo, M.B., Williams, P.H. & Fuller, R.J. (2002a) Dynamics of
extinction and the selection of nature reserves. Proceedings of
the Royal Society of London, Series B, 269, 1971–1980.
Araújo, M.B., Williams, P.H. & Turner, A. (2002b) A sequential
approach to minimise threats within selected conservation
areas. Biodiversity and Conservation, 11, 1011–1024.
Bates, J.M. & Demos, T.C. (2001) Do we need to devalue Amazo-
nia and other large tropical forests? Diversity and Distributions,
7, 249–255.
Bennett, K.D. & Willis, K.J. (2000) Effect of global atmospheric
carbon dioxide on glacial-interglacial vegetation change.
Global Ecology and Biogeography, 9, 355–361.
Bierregaard, R.O., Gascon, C., Lovejoy, T.E. & Mesquita, R.
(2001) Lessons from Amazonia: the ecology and conservation of
a fragmented forest. Yale University Press, New Haven.
Boecklen, W.J. (1986) Effects of habitat heterogeneity on the
species–area relationships of forest birds. Journal of Biogeo-
graphy, 13, 59–68.
Boecklen, W.J. & Gotelli, N.J. (1984) Island biogeographic
theory and conservation practice: species–area or specious-area
relationships? Biological Conservation, 29, 63–80.
Brooks, D.R. & van Veller, M.C.P. (2003) Critique of parsimony

Conservation Biogeography
Diversity and Distributions, 11, 3–23, © 2005 Blackwell Publishing Ltd 19
analysis of endemicity as a method of historical biogeography.
Journal of Biogeography, 30, 819–825.
Brooks, T. & Balmford, A. (1996) Atlantic forest extinctions.
Nature, 380, 115.
Brooks, T.M., Mittermeier, R.A., Mittermeier, C.G., da Fonseca,
G.A.B., Rylands, A.B., Konstant, W.R., Flick, P., Pilgrim, J.,
Oldfield, S., Magin, G. & Hilton-Taylor, C. (2002) Habitat loss
and extinction in the hotspots of biodiversity. Conservation
Biology, 16, 909–923.
Brown, J.H. (1984) On the relationship between abundance and
distribution of species. The American Naturalist, 124, 255–279.
Brown, J.H. (1995) Macroecology. The University of Chicago
Press, Chicago.
Brown, J.H. & Lomolino, M.V. (1998) Biogeography, 2nd edn.
Sinauer Press, Sunderland, Massachusetts.
Brummitt, N. & Lughadha, E.N. (2003) Biodiversity: where’s hot
and where’s not. Conservation Biology, 17, 1442–1448.
Buckley, L.B. & Roughgarden, J. (2004) Effects of changes in
climate and land use. Nature, (01 July 2004); doi:10.1038/
nature02717.
Bush, M.B. (1994) Amazonian speciation — a necessarily complex
model. Journal of Biogeography, 21, 5–17.
Bush, M.B. (2002) Distributional change and conservation on
the Andean flank: a palaeoecological perspective. Global
Ecology and Biogeography, 11, 463–473.
Bush, M.B. & Whittaker, R.J. (1991) Krakatau: Colonization
patterns and hierarchies. Journal of Biogeography, 18, 341–
356.
Cabeza, M. (2003) Habitat loss and connectivity of reserve
networks in probability approaches to reserve design. Ecology
Letters, 6, 665–672.
Cabeza, M. & Moilanen, A. (2001) Design of reserve networks
and the persistence of biodiversity. Trends in Ecology and
Evolution, 16, 242–247.
Cabeza, M., Araújo, M.B., Wilson, R.J., Thomas, C.D.,
Cowley, M.J.R. & Moilanen, A. (2004) Combining probabil-
ities of occurrence with spatial reserve design. Journal of
Applied Ecology, 41, 252–262.
Callicott, J.B., Crowder, L.B. & Mumford, K. (1999) Current
normative concepts in conservation. Conservation Biology,
13, 22–35.
Ceballos, G. & Ehrlich, P.R. (2002) Mammal population losses
and the extinction crisis. Science, 296, 904–907.
Channell, R. & Lomolino, M.V. (2000) Trajectories to extinction:
spatial dynamics of the contraction of geographical ranges.
Journal of Biogeography, 27, 169–179.
Colinvaux, P.A., Irion, G., Rasanen, M.E., Bush, M.B. & de
Mello, J.A.S.N. (2001) A paradigm to be discarded: geological
and paleoecological data falsify the Haffer & Prance refuge
hypothesis of Amazonian speciation. Amazoniana, 16, 609–
646.
Colwell, R.K., Rahbek, C. & Gotelli, N.J. (2004) The mid-domain
effect and species richness patterns: what have we learned so
far? American Naturalist, 163, E1–E23.
Cowling, R.M., Pressey, R.L., Lombard, A.T., Desmet, P.G. &
Ellis, A.G. (1999) From representation to persistence: require-
ments for a sustainable system of conservation areas in the
species-rich Mediterranean-climate desert of southern Africa.
Diversity and Distributions, 5, 51–71.
Cox, C.B. (2001) The biogeographic regions reconsidered.
Journal of Biogeography, 28, 511–523.
Curnutt, J.L., Pimm, S.L. & Maurer, B.A. (1996) Population
variability of sparrows in space and time. Oikos, 76, 131–
144.
Dalton, R. (2000) Biodiversity cash aimed at hotspots. Nature,
406, 818.
Dark, S.J. (2004) The biogeography of invasive alien plants in
California: an application of GIS and spatial regression analy-
sis. Diversity and Distributions, 10, 1–9.
Dasmann, R.F. (1972) Towards a system for classifying natural
regions of the world and their representation by national parks
and reserves. Biological Conservation, 4, 247–255.
Dasmann, R.F. (1973) A system for defining and classifying natural
regions for the purposes of conservation. World Conservation
Union, Morges, Switzerland.
Dehnen-Schmutz, K. (2004) Alien species reflecting history:
medieval castles in Germany. Diversity and Distributions, 10,
147–151.
Diamond, J.M. (1975) The Island Dilemma: lessons of modern
biogeographic studies for the design of nature reserves. Biolog-
ical Conservation, 7, 129–146.
Demeritt, D. (2001) Scientific forest conservation and the statis-
tical picturing of Nature’s limits in the progressive-era United
States. Environment and Planning D: Society and Space, 19,
431–459.
Dinerstein, E., Olson, D.M., Graham, D.J., Webster, A.L.,
Pimm, S.A., Bookbinder, M.A. & Ledec, G. (1995) A conserva-
tion assessment of the terrestrial Ecoregions of Latin America and
the Caribbean. The World Bank, Washington, D.C.
Diniz-Filho, J.A.F., Bini, L.M. & Hawkins, B.A. (2003) Spatial
autocorrelation and red herrings in geographical ecology.
Global Ecology and Biogeography, 12, 53–64.
Dimitrakopoulos, P.G., Memtsas, D. & Troumbis, A.Y. (2004)
Questioning the effectiveness of the Natura 2000 Special Areas
of Conservation strategy: the case of Crete. Global Ecology and
Biogeography, 13, 199–207.
Ebach, M.C., Humphries, C.J. & Williams, D.M. (2003) Phylo-
genetic biogeography deconstructed. Journal of Biogeography,
30, 1285–1296.
Faith, D.P. (2003) Environmental diversity (ED) as a surrogate
information for species-level biodiversity. Ecography, 26, 374–
379.
Faith, D.P., Ferrier, S. & Walker, P.A. (2004) The ED strategy:
how species-level surrogates indicate general biodiversity pat-
terns through an ‘environmental diversity’ perspective. Journal
of Biogeography, 31, 1207–1217.
Faith, D.P. & Walker, P.A. (1996a) How do indicator groups pro-
vide information about the relative biodiversity of different
sets of areas?: on hotspots, complementarity and pattern-based
approaches. Biodiversity Letters, 3, 18–25.
Faith, D.P. & Walker, P.A. (1996b) Environmental diversity: on
the best-possible use of surrogate data for assessing the relative
R. J. Whittaker et al.
20 Diversity and Distributions, 11, 3–23, © 2005 Blackwell Publishing Ltd
biodiversity of sets of areas. Biodiversity and Conservation, 5,
399–415.
Ferrier, S. & Watson, G. (1997) An evaluation of the effectiveness
of environmental surrogates and modelling techniques in predict-
ing the distribution of biological diversity. Report produced for
the Department of Environment, Sports and Territories,
Australia.
Flather, C.H., Wilson, K.R., Dean, D.J. & McComb, W.C. (1997)
Identifying gaps in conservation networks: of indicators and
uncertainty in geographic-based analysis. Ecological Applica-
tions, 7, 531–542.
Frank, D.J., Hironaka, A., Meyer, J.W., Schoffer, E. & Tuma, N.B.
(1999) The rationalization and organisation of Nature in
World culture. Constructing World culture: international
non-government organisations since 1875 (ed. by J. Boli and
G.M. Thomas), pp. 81–96. Stanford University Press, Stan-
ford, California.
Freitag, S., Nicholls, A.O. & van Jaarseveld, A.S. (1998) Dealing
with established reserve networks and incomplete distribution
data sets in conservation planning. South African Journal of
Science, 94, 79–86.
Gaston, K.J. (1994) Rarity. Chapman & Hall, London.
Gaston, K.J., Rodrigues, A.S., van Rensburg, B.J., Koleff, P. &
Chown, S.L. (2001) Complementary representation and zones
of ecological transition. Ecology Letters, 4, 4–9.
Gerber, S., Joos, F. & Prenctice, I.C. (2004) Sensitivity of a
dynamic global vegetation model to climate and atmospheric
CO2. Global Change Biology, 10, 1223–1239.
Gillson, L. & Willis, K.J. (2004) ‘As Earth’s testimonies tell’:
wilderness conservation in a changing world. Ecology Letters,
7, 990–998.
Gonzalez, A. (2000) Community relaxation in fragmented
landscapes: the relation between species richness, area and age.
Ecology Letters, 3, 441–448.
Gray, J.S., Ugland, K.I. & Lambshead, J. (2004a) Species accumu-
lation and species area curves — a comment on Scheiner (2003).
Global Ecology and Biogeography, 13, 473–476.
Gray, J.S., Ugland, K.I. & Lambshead, J. (2004b) On species-
accumulation and species-area curves. Global Ecology and
Biogeography, 13, 567–568.
Groombridge, B. (ed.) (1992) Global biodiversity: status of the
Earth’s living resources. (A report compiled by the World Con-
servation Monitoring Centre). Chapman and Hall, London.
Groombridge, B. & Jenkins, M.D. (2000) Global biodiversity:
Earth’s living resources in the 21st Century. World Conservation
Press, Cambridge.
Hambler, C. (2004) Virgin rainforests and conservation. Science,
305, 943.
Hannah, L., Midgley, G.F. & Millar, D. (2002) Climate change-
integrated conservation strategies. Global Ecology and Biogeog-
raphy, 11, 485–495.
Hannah, L. & Phillips, B. (2004) Extinction-risk coverage is
worth inaccuracies. Nature, 430, 141.
Hawkins, B.A. & Porter, E.E. (2003) Does herbivory depend
on plant diversity? The case of California butterflies. The
American Naturalist, 161, 40–49.
Hawkins, B.A., Porter, E.E. & Diniz-Filho, J.A.F. (2003) Produc-
tivity and history as predictors of the latitudinal diversity gradient
of terrestrial birds. Ecology, 84, 1608–1623.
Honnay, O., Hermy, M. & Coppin, P. (1999) Nested plant com-
munities in deciduous forest fragments: species relaxation or
nested subsets? Oikos, 84, 119–129.
Hopkinson, P., Travis, J.M.J., Evans, J., Gregory, R.D., Telfer, M.G.
& Williams, P.H. (2001) Flexibility and the use of indicator
taxa in the selection of sites for nature reserves. Biodiversity
and Conservation, 10, 271–285.
Hughes, T.P., Bellwood, D.R. & Connolly, S.R. (2002) Biodiver-
sity hotspots, centres of endemicity, and the conservation of
coral reefs. Ecology Letters, 5, 775–784.
Humphries, C.J. (2001) Hotspots: going off the boil? Diversity
and Distributions, 7, 104–105.
Huntley, B.J. (1996) Biodiversity conservation in the New South
Africa. Biodiversity, science and development: towards a new
partnership (ed. by F. di Castri and T. Younès), pp. 282–303.
CABI, Wallingford, UK.
Jepson, P., Brickle, N. & Chayadin, Y. (2001) The conservation
status of Tanimbar corella and blue-streaked lory on the Tanim-
bar Islands, Indonesia: results of a rapid contextual survey.
Oryx, 35, 224–235.
Jepson, P. & Canney, S. (2001) Biodiversity hotspots: hot for
what? Global Ecology and Biogeography, 10, 225–227.
Jepson, P. & Canney, S. (2003) Values-led conservation. Global
Ecology and Biogeography, 12, 271–274.
Jepson, P. & Whittaker, R.J. (2002a) Ecoregions in context: a cri-
tique with special reference to Indonesia. Conservation Biology,
16, 42–57.
Jepson, P. & Whittaker, R.J. (2002b) Histories of Protected Areas:
internationalism of conservationist values and their adoption
in the Netherlands Indies (Indonesia). Environment and
History, 8, 129–172.
Koleff, P. & Gaston, K.J. (2002) The relationships between local
and regional species richness and spatial turnover. Global Ecology
and Biogeography, 11, 363–375.
Kullman, L. (1998) Palaeoecological, biogeographical and palae-
oclimatological implications of early Holocene immigration of
Larix sibirica Ledeb into the Scandes Mountains, Sweden.
Global Ecology and Biogeography Letters, 7, 181–188.
Ladle, R., Jepson, P., Araújo, M.B. & Whittaker, R.J. (2004)
Dangers of crying wolf over risk of extinctions. Nature,
482, 799.
Lambshead, P.J.D. & Boucher, G. (2003) Marine nematode deep-
sea biodiversity — hyperdiverse or hype? Journal of Biogeography,
30, 475–485.
Lawton, J.H. & May, R.M. (eds) (1995) Extinction rates. OUP, Oxford.
Lennon, J.J., Koleff, P., Greenwood, J.J.D. & Gaston, K.J. (2001)
The geographical structure of British bird distributions: diver-
sity, spatial turnover and scale. Journal of Animal Ecology, 70,
966–979.
Lindenmayer, D.B. & Franklin, J.F. (2002) Conserving forest
biodiversity: a comprehensive multiscale approach. Island Press,
Washington.
Lomolino, M.V. (2000) Ecology’s most general, yet protean

Conservation Biogeography
Diversity and Distributions, 11, 3–23, © 2005 Blackwell Publishing Ltd 21
pattern: the species–area relationship. Journal of Biogeography,
29, 555–557.
Lomolino, M.V. (2002) ‘… there are areas too small, and areas
too large, to show clear diversity patterns …’ R.H. MacArthur
(1972: 191). Journal of Biogeography, 29, 555–557.
Lomolino, M.V. (2004) Conservation biogeography. Frontiers of
Biogeography: new directions in the geography of nature (ed. by
M.V. Lomolino and L.R. Heaney). Sinauer Associates, Sunder-
land, Massachusetts.
Lomolino, M.V. & Heaney, L.R. (eds) (2004) Frontiers of
Biogeography: new directions in the geography of nature. Sinauer
Associates, Sunderland, Massachusetts.
Lomolino, M.V., Sax, D. & Brown, J.H. (eds) (2004) Foundations
of Biogeography. Chicago University Press, Chicaco.
Lomolino, M.V. & Weiser, M.D. (2001) Towards a more general
species–area relationship: diversity on all islands, great and
small. Journal of Biogeography, 28, 431–445.
Long, A.J., Crosby, M.J., Stattersfield, A.J. & Wege, D.C. (1996)
Towards a global map of biodiversity: patterns in the distribu-
tion of restricted-range birds. Global Ecology and Biogeography
Letters, 5, 281–304.
Lourie, S.A. & Vincent, A.C.J. (2004) Using biogeography to help
set priorities in marine conservation. Conservation Biology, 18,
1004–1020.
MacArthur, R.H. & Wilson, E.O. (1967) The theory of island
biogeography. Princeton University Press, Princeton.Mace, G.M., Balmford, A., Boitani, L., Cowlishaw, G., Dobson, A.P.,
Faith, D.P., Gaston, K.J., Humphries, C.J., Vane-Wright, R.I.,
Williams, P.H., Lawton, J.H., Margules, C.R., May, R.M.,
Nicholls, A.O., Possingham, H.P., Rahbek, C. & van Jaarseveld,
A.S. (2000) It’s time to work together and stop duplicating
conservation efforts. Nature, 405, 393.
MacKinnon, J. & MacKinnon, K. (1986a) Review of the protected
area systems of the Afrotropical realm. IUCN and UNDP, Gland,
Switzerland.
MacKinnon, J. & MacKinnon, K. (1986b) Review of the protected
areas system in the Indo-Malayan Realm. IUCN, CNPPA and
UNEP, Cambridge & Gland.
MacKinnon, J. & Wind, J. (1981) Birds of Indonesia. Special
report F0/INS/78/061, available from the Food and Agriculture
Organization of the United Nations, Rome.
Magnusson, W.E. (2004) Ecoregion as a Pragmatic Tool. Conser-
vation Biology, 18, 4.
Margules, C.R. & Pressey, R.L. (2000) Systematic conservation
planning. Nature, 405, 243–253.
McKinney, M.L. (2002) Do human activities raise species rich-
ness? Contrasting patterns in United States plants and fishes.
Global Ecology and Biogeography, 11, 343–348.
Medellín, R.A. & Soberón, J. (1999) Predictions of mammal
diversity on four land masses. Conservation Biology, 13, 143–149.
Meir, E., Andelman, S. & Possingham, H.P. (2004) Does conser-
vation planning matter in a dynamic and uncertain world?
Ecology Letters, 7, 615–622.
Myers, N. & Mittermeier, R.A. (2003) Impact and acceptance of
the hotspots strategy: response to Ovadia and to Brummitt
and Lughadha. Conservation Biology, 17, 1449–1450.
Myers, N., Mittermeier, R.A., Mittermeier, C.G., da Fonseca,
G.A.B. & Kent, J. (2000) Biodiversity hotspots for conservation
priorities. Nature, 403, 853–859.
Nekola, J.C. & White, P.S. (1999) The distance decay of similarity in
biogeography and ecology. Journal of Biogeography, 26, 867–878.
Nelson, B.W., Ferreira, C.A.C., de Silva, M.F. & Kawasaki, M.L.
(1990) Endemism centres, refugia and botanical collection
density in Brazilian Amazonia. Nature, 345, 714–716.
O’Brien, E.M., Field, R. & Whittaker, R.J. (2000) Climatic gra-
dients in woody plant (tree and shrub) diversity: water-energy
dynamics, residual variation, and topography. Oikos, 89, 588–
600.
O’Brien, E.M., Whittaker, R.J. & Field, R. (1998) Climate and
woody plant diversity in southern Africa: relationships at
species, genus and family levels. Ecography, 21, 495–509.
Ødegaard, F. Diserud, O.H., Engen, S. & Aagaard, K. (2000) The
magnitude of local host specificity for phytophagous insects
and its implications for estimates of global species richness.
Conservation Biology, 14, 1182–1186.
Olson, D.M. & Dinerstein, E. (1998) The Global 200: a represen-
tation approach to conserving the Earth’s most biologically
valuable ecoregions. Conservation Biology, 12, 502–515.
Ovadia, O. (2003) Ranking hotspots of varying sizes: a lesson
from the nonlinearity of the species–area relationship. Conser-
vation Biology, 17, 1440–1441.
Palmer, M.W. & White, P.S. (1994) Scale dependence and the
species–area relationship. American Naturalist, 144, 717–
740.
Pearson, R.G. & Dawson, T.P. (2003) Predicting the impacts of
climate change on the distribution of species: are bioclimate
envelope models useful? Global Ecology and Biogeography, 12,
361–371.
Pearson, R.G. & Dawson, T.P. (2004) Bioclimate envelope models:
what they detect and what they hide — response to Hampe
(2004). Global Ecology and Biogeography, 13, 471–473.
Pressey, R.L. & Nicholls, A.O. (1989) Efficiency in conservation
evaluation: scoring vs. iterative procedures. Biological Conser-
vation, 50, 199–218.
Primack, R.B. (2002) Essentials of conservation biology, 3rd edn,
Sinauer Press, Sunderland, Massachusetts.
Prinzing, A., Klotz, S., Stadler, J. & Brandl, R. (2003) Woody
plants in Kenya: expanding the higher-taxon approach. Biological
Conservation, 203, 307–314.
PyÍek, P., Richardson, D.M. & Williamson, M. (2004) Predicting
and explaining plant invasion through analysis of source area
floras: some critical considerations. Diversity and Distribu-
tions, 10, 179–187.
Rahbek, C. & Graves, G.R. (2000) Detection of macro-ecological
patterns in South American hummingbirds is affected by
spatial scale. Proceedings of the Royal Society of London, Series
B, 267, 2259–2265.
Rahbek, C. & Graves, G.R. (2001) Multiscale assessment of
patterns of avian species richness. Proceedings of the National
Academy of Sciences, USA, 98, 4534–4539.
Redford, K.H., Coppolillo, P., Sanderson, E.W., da Fonseca, G.A.B.,
Dinerstein, E., Groves, C., Mace, G., Maginnis, S., Mittermeier, R.A.,
R. J. Whittaker et al.
22 Diversity and Distributions, 11, 3–23, © 2005 Blackwell Publishing Ltd
Noss, R., Olson, D., Robinson, J.G., Vedder, A. & Wright, M.
(2003) Mapping the conservation landscape. Conservation
Biology, 17, 116–131.
Renjifo, L.M. (2001) Effect of natural and anthropogenic land-
scape matrices on the abundance of subAndean bird species.
Ecological Applications, 11, 14–31.
Rodrigues, A.S.L., Andelman, S.J., Bakarr, M.I., Boltani, L.,
Brooks, T.M., Cowling, R.M., Fishpool, L.D.C., da Fonseca,
G.A.B., Gaston, K.J., Hoffmann, M., Long, J.S., Marquet, P.A.,
Pilgrim, J.D., Pressey, R.L., Schipper, J., Sechrest, W., Stuart, S.N.,
Underhill, L.G., Waller, R.W., Watts, M.E.J. & Yan, X. (2004)
Effectiveness of the global protected area network in represent-
ing species diversity. Nature, 428, 640–643.
Rodrigues, A.S.L., Tratt, R., Wheeler, B.D. & Gaston, K.J. (1999)
The performance of existing networks of conservation areas in
representing biodiversity. Proceedings of the Royal Society of
London, Series B, 266, 1453–1460.
Rodríguez, J.P. (2002) Range contraction in declining North
American bird populations. Ecological Applications, 12, 238–
248.
Rosenfield, J.A. (2002) Pattern and process in the geographical
range of freshwater fishes. Global Ecology and Biogeography, 11,
323–332.
Rosenzweig, M.L. (1995) Species diversity in space and time.
Cambridge University Press, Cambridge.
Rosenzweig, M.L. (2003) Reconciliation ecology and the future
of species diversity. Oryx, 37, 194–205.
Rouget, M., Cowling, R.M., Pressey, R.L. & Richardson, D.M.
(2003) Identifying spatial components of ecological and evolu-
tionary processes for regional conservation planning in the
Cape Floristic Region, South Africa. Diversity and Distribu-
tions, 9, 191–210.
Royal Society (2003) Measuring Biodiversity for Conserva-
tion. Policy document 11/03. http://www.royalsoc.ac.uk/
document.asp?id=1474
Sax, D.F. & Gaines, S.D. (2003) Species diversity: from global
decreases to local increases. Trends in Ecology and Evolution,
18, 561–566.
Sax, D.F., Gaines, S.D. & Brown, J.H. (2002) Species invasions
exceed extinctions on islands worldwide: a comparative
study of plants and birds. American Naturalist, 160, 766–
783.
Scheiner, S.M. (2003) Six types of species–area curves. Global
Ecology and Biogeography, 12, 441–447.
Scheiner, S.M. (2004) A mélange of curves — Further dialogue
about species–area relationships. Global Ecology and Biogeo-
graphy, 13, 479–484.
Schmitt, T. & Krauss, J. (2004) Reconstruction of the coloniza-
tion route from glacial refugium to the northern distribution
range of the European butterfly Polyommatus coridon
(Lepidoptera: Lycaenidae). Diversity and Distributions, 10,
271–274.
da Silva, J.M.C., Cardoso de Sousa, M. & Castelleti, C.H.M.
(2004) Areas of endemism for passerine birds in the Atlantic
forest, South America. Global Ecology and Biogeography, 13,
85–92.
Smith, T.B., Kark, S., Schneider, C.J., Wayne, R.K. & Moritz, C.
(2001) Biodiversity hotspots and beyond: the need for preserv-
ing environmental transitions. Trends in Ecology and Evolution,
16, 431.
Soulé, M.E. (ed.) (1986) Conservation biology: the science of scar-
city and diversity. Sinauer Press, Sunderland, Massachusetts.
Spector, S. (2002) Biogeographic crossroads as priority areas for
biodiversity conservation. Conservation Biology, 16, 1480–
1487.
Spellerberg, I.F. & Sawyer, J.W.D. (1999) An introduction to
applied biogeography. Cambridge University Press, Cambridge.
Stattersfield, A.J., Crosby, M.J., Long, A.J. & Wege, D.C. (1998)
Endemic bird areas of the World: priorities for conservation.
Birdlife International, Cambridge.
Stoms, D.M. (1994) Scale dependence of species richness maps.
Professional Geographer, 46, 346–358.
Stouffer, P.C. & Bierregaard, R.O., Jr. (1996) Effects of forest
fragmentation on understorey hummingbirds in Amazonian
Brazil. Conservation Biology, 9, 1085–94.
Stott, P. (1998) Biogeography and ecology in crisis: the urgent
need for a new metalanguage. Journal of Biogeography, 25, 1–2.
Sutherland, W.J. (ed.) (1998) Conservation science and action.
Blackwell Science Ltd, Oxford.
Terborgh, J. & Winter, B. (1983) A method for siting parks and
reserves with special reference to Colombia and Ecuador.
Biological Conservation, 27, 45–58.
Thomas, C.D., Cameron, A., Green, R.A. et al. (2004) Extinction
risk from climate change. Nature, 427, 145–148.
Thuiller, W., Araújo, M.B., Pearson, R.G., Whittaker, R.J.,
Brotons, L. & Lavorel, S. (2004) Uncertainty in predictions of
extinction risk. Nature (01 July 2004); doi:10.1038/nature02716.
Tjørve, E. (2003) Shapes and functions of species–area curves: a
review of possible models. Journal of Biogeography, 30, 827–835.
Trudgill, S. (2001) Psychobiogeography: meanings of nature and
motivations for a democratized conservation ethic. Journal of
Biogeography, 28, 677–698.
Udvardy, M.D.F. (1975) A classification of the biogeographical
provinces of the World. IUCN, Morges, Switzerland.
Watson, J.E.M. (2004) Bird responses to habitat fragmentation:
illustrations from Madagascan and Australian case studies.
Unpublished D.Phil. thesis, University of Oxford.
Watson, J.E.M., Whittaker, R.J. & Freudenberger, D. (2005) Bird
community responses to fragmentation: how consistent are
they across landscapes? Journal of Biogeography, 32, in press.
Wethered, R. & Lawes, M.J. (2003) Matrix effects on bird assem-
blages in fragmented Afromontane forests in South Africa.
Biological Conservation, 114, 327–340.
Wheeler, Q.D., Raven, P.H. & Wilson, E.O. (2004) Taxonomy:
impediment or expedient? Science, 303, 285.
Whittaker, R.J. (1998) Island biogeography: ecology, evolution, and
conservation. Oxford University Press, Oxford.
Whittaker, R.J. (2004) Dynamic hypotheses of richness on
islands and continents. Frontiers of Biogeography: new
directions in the geography of nature (ed. by M.V. Lomolino and
L.R. Heaney). Sinauer Press, Sunderland, Massachusetts, USA.
(in press).
Conservation Biogeography
Diversity and Distributions, 11, 3–23, © 2005 Blackwell Publishing Ltd 23
Whittaker, R.J. & Heegaard, E. (2003) What is the observed rela-
tionship between species richness and productivity? Comment.
Ecology, 84, 3384–3390.
Whittaker, R.J., Willis, K.J. & Field, R. (2001) Scale and species
richness: towards a general, hierarchical theory of species
diversity. Journal of Biogeography, 28, 453–470.
Whittaker, R.J., Willis, K.J. & Field, R. (2003) Climatic-energetic
explanations of diversity: a macroscopic perspective. Macro-
ecology: concepts and consequences, British Ecological Society
Symposia Series (ed. by T.M. Blackburn and K.J. Gaston),
pp. 107–129. Blackwell Publishing, Oxford.
Wikramanayake, E., Dinerstein, E., Loucks, C., Olson, D.,
Morrison, J., Lamoreux, J., McKnight, M. & Hedao, P. (2002)
Ecoregions in ascendence: reply to Jepson and Whittaker.
Conservation Biology, 16, 238–243.
Williams, P.H. (1996) Mapping variations in the strength and
breadth of biogeographic transition zones using species
turnover. Proceedings of the Royal Society of London, Series B,
263, 579–588.
Williams, P.H. & Araújo, M.B. (2000) Integrating species and
ecosystem monitoring for identifying conservation priorities.
European Conservation, 4, 17–18.
Williams, P.H. & Araújo, M.B. (2002) Apples, oranges, and
probabilities: Integrating multiple factors into biodiversity
conservation with consistency. Environmental Modeling and
Assessment, 7, 139–151.
Williams, P.H., Burgess, N. & Rahbek, C. (2000b) Flagship spe-
cies, ecological complementarity, and conserving the diversity
of mammals and birds in sub-Saharan Africa. Animal Conser-
vation, 3, 249–260.
Williams, P.H., Gibbons, D.W., Margules, C.R., Rebelo, A.G.,
Humphries, C.J. & Pressey, R.L. (1996) A comparison of rich-
ness hotspots, rarity hotspots and complementary areas for
conserving diversity using British birds. Conservation Biology,
10, 15–74.
Williams, P.H., Hannah, L., Andelman, S., Midgley, G.F.,
Araújo, M.B., Hughes, G., Manne, L.L., Martinez-Meyer, E. &
Pearson, R.G. (2005) Planning for climate change: identifying
minimum-dispersal corridors for the Cape Proteaceae.
Conservation Biology, in press.
Williams, P.H., Humphries, C., Araújo, M.B., Lampinen, R.,
Hagemeijer, W., Gasc, J.-P. & Mitchell-Jones, T. (2000a) Ende-
mism and important areas for representing European bio-
diversity: a preliminary exploration of atlas data for plants
and terrestrial vertebrates. Belgian Journal of Entomology, 2,
221–46.
Williams, P.H., de Klerk, H.M. & Crowe, T.H. (1999) Interpret-
ing biogeographical boundaries among Afrotropical birds:
spatial patterns in richness gradients and species replacement.
Journal of Biogeography, 26, 459–474.
Williamson, M., Gaston, K.J. & Lonsdale, W.M. (2001) The
species–area relationship does not have an asymptote! Journal
of Biogeography, 28, 827–830.
Williamson, M., Gaston, K.J. & Lonsdale, W.M. (2002) An
asymptote is an asymptote and not found in species–area
relationships. Journal of Biogeography, 29, 1713.
Willis, K.J., Gillson, L. & Brncic, T.M. (2004a) How virgin is
virgin rainforest? Science, 304, 402–403.
Willis, K.J., Gillson, L. & Brncic, T.M. (2004b) Virgin rainforests
and conservation: Reply. Science, 305, 944.
Willis, K.J. & Whittaker, R.J. (2000) The refugial debate. Science
287, 1406–1407.
Willis, K.J. & Whittaker, R.J. (2002) Species diversity — scale
matters. Science, 295, 1245–1248.
