conservation & demand management plan 2007 annual …€¦ · distributed generation - wind...
TRANSCRIPT

OAKVILLE HYDRO ELECTRICITY DISTRIBUTION INC.
CONSERVATION & DEMAND MANAGEMENT PLAN
2007 ANNUAL REPORT
THIRD TRANCHE FUNDING
Oakville Hydro Electricity Distribution Inc. – RP-2004-0203 / EB-2004-0527

Oakville Hydro
2
1. INTRODUCTION In February 2005, the Ontario Energy Board approved Oakville Hydro’s conservation and Demand Management Plan. This 2007 annual report is the third annual report submitted as a requirement of that approval. As noted in the 2005 report, Oakville Hydro Electricity Distribution Inc.’s CDM Plan was developed along the following key principles and objectives: sustainability, maximizing benefits, flexibility and maximizing investment efficiency. The initiatives were chosen to produce on-going benefits/habits and not just short-term attempts at conservation and reducing demand that may diminish in time. Oakville is a rapidly growing community and Oakville Hydro plans to add the extra load associated with this growth as efficiently as possible, giving consumers choice now and in the future and protecting the stability and reliability of the distribution system. As Oakville Hydro works through its plan, adjustments have been made and new initiatives introduced. In 2006, selected programs were cancelled due to technical, institutional and other barriers to their implementation as discussed in the 2006 annual report. The present report discusses the programs that are continuing from 2006, and it also discusses progress on a new program introduced in 2007; a lighting retrofit in Oakville Hydro office buildings. On-going components of the CDM plan consist of the following initiatives: Consumer education
• providing information on the Oakville Hydro website • partnering with other utilities and the Halton Learning Foundation on a program
for schools • partnering with the OPA on the Every Kilowatt Counts spring and fall campaigns • participating in the Porchlight program • providing conservation tips in an information package to customers who moved
into either a new or existing home • promoting programmable thermostats to all customers through on-bill messages.
Multi-residential interval metering program
• converting bulk metered multi-residential buildings to individual suite metering • making available time-of-use rates as part of an approved pilot project • providing customers access to information on their usage.
Commercial/industrial energy information seminar

Oakville Hydro
3
• partnering with local providers of energy efficiency products and services • providing information on topics including demand response, energy audits,
energy load profiling and creating a sustainable energy plan Peak demand reduction
• install a large backup generator in Oakville Hydro’s building to be used for peak shaving
• pilot small (100 kW) natural gas generators in small commercial establishments to reduce demand from the system at peak times and provide blackout protection.
Voltage conversion
• convert a 1500 kVA transformer from 4 kV to 27.6 kV direct-feed from the grid at a shopping mall
• perform the same conversion in an older residential neighbourhood Solar hot water heater pilot
• install two roof-mounted solar collectors, heat exchangers and controls to reduce electrical water heating demands in the Oakville Hydro headquarters building.
A new program was introduced in 2007: Lighting Retrofit
• Identify and implement lighting retrofit opportunities within the Oakville Hydro office buildings
2. EVALUATION OF THE CDM PLAN Oakville Hydro wanted to ensure that the programs it implemented were effective and beneficial to its customers and to the distribution system, and therefore undertook careful planning and evaluation of each program to ensure these goals were realized. As program advancement, monitoring and evaluation continue, some of the benefits are yet to be realized. This is particularly the case for programs that involve the installation of equipment. Several programs reported results in 2007, including Oakville Hydro’s participation in the Ontario Power Authority (OPA) on the spring and fall Every Kilowatt Counts

Oakville Hydro
4
programs. The results of participation in the EKC program were over 99 kW reduction in winter peak demand and in year energy savings of 2,268,857 kWh. The multi-residential interval metering program continues to be a successful program. In 2007, Oakville Hydro completed the conversion of one 96 unit, one 208 unit, and two 144 unit condominium buildings. Data for energy analysis are still being gathered for the buildings completed this year but a quick comparison of historical with present consumption patterns indicates that the condominiums are on track to achieving significant savings. In 2007, the voltage conversion program has also continued to be successful. The conversion of a 1500 kVa transformer from a 4 kV to 27.6 kV direct-feed from the grid to an older residential neighbourhood has begun. By the end of 2007, about one third of the neighbourhood had been converted. This has resulted in approximately a 13 kW reduction in peak demand and energy savings of 14,167 kWh over the calendar year. The lighting retrofit program introduced in 2007 changed lighting systems in Oakville Hydro’s garage and loading bays. These first retrofits have already resulted in demand savings of 18.5 kW and total annual energy savings of 83,393 kWh. Energy, power and associated dollar savings are shown on the appended evaluation tables.
3. DISCUSSION OF THE PROGRAMS
Customer education The intent of the Customer Education program is to raise awareness of the importance of energy conservation, encourage behavioural change, and give all customer classes the opportunity to learn how and what they can do on their own to reduce their personal, family and business energy consumption. General program activities for 2007 included:
• sharing energy conservation information with customers on the corporate website • partnering in the OPA’s spring and fall Every Kilowatt Counts program • partnering with other utilities and the Halton Learning Foundation on a program for
schools • participation in the Porchlight program • providing conservation tips in an information package to customers who moved
into either a new or existing home • promoting programmable thermostats to all customers through on-bill messages.

Oakville Hydro
5
The Every Kilowatt Counts program with the OPA involved the direct mail distribution (by the OPA) of a round of consumer coupons in the Spring and another round in the Fall. The coupons included rebates for the following energy efficient products:
• Energy star CFL 15W • Energy Star Ceiling Fan • Outdoor Motion Sensor • Dimmer Switch • Outdoor Solar Lights • Furnace / AC Filter • Seasonal LEDs • T8 lighting fixtures • Energy Star light fixtures • Baseboard programmable thermostats • Lighting and Appliance controls (timers) • Powerbar with integrated timer
In 2006, Oakville Hydro and three other LDCs (Milton Hydro, Burlington Hydro and Halton Hills Hydro) signed a commitment to fund the Conservation Education and Demand Management program (CE&DM) in Halton through the Halton Learning Foundation. Over a three-year term ending in 2008, the partnership will continue to develop and distribute resources for schools pursuing energy conservation and/or EcoSchools certification. Oakville Hydro maintained its commitment to this program through a financial instalment in 2007.
Project Porchlight is a program run by the non-profit group One Change that uses community-based social marketing to educate the general public on simple changes that can have meaningful environmental benefit. The campaign focuses on appealing to residents to replace their incandescent porch light bulb with a CFL light bulb. Oakville Hydro has participated in this campaign by publicly endorsing and financially supporting a local porchlight campaign. In collaboration with other organizations in Ontario, over 500 000 energy efficient light bulbs were delivered to homes across Ontario in the fall of 2007.
Smart meter, intelligent network program As discussed in last year’s report, the Smart Meter, Intelligent Network program was cancelled in 2006.
Multi-residential interval metering program

Oakville Hydro
6
Research has indicated that conversions of multi-unit residential buildings from bulk metering to individual suite metering and billing can save between 15% and 30% of the energy consumption in electrically heated buildings. The intent of this program is to capture these savings by working with owners of bulk metered multi-residential buildings, specifically customers in income-geared and non-profit cooperatives, to convert them to individual suite metering and billing. The program enables customers to be billed directly for the electricity they use and to track their consumption. It also allows the customer to take advantage of time-of-day price differences, conservation opportunities and/or load shifting. In 2007, Oakville Hydro completed the conversion of one 96 unit, one 208 unit, and two 144 unit condominium buildings. These conversions are in addition to the single 76 unit and two 105 unit buildings converted in 2005 and 2006 respectively. Residents of the condominiums converted in 2005 and 2006 are on time-of-use rates as part of an approved pilot project and have on-line access to their accounts through HARRIS, Oakville Hydro's billing system. Data show that customers have reduced their consumption and changed their usage patterns as a result of sub-metering. The 76-unit condominium completed in 2005 has an average month-to-month savings of approximately 24%. Data for energy analysis are still being gathered for the buildings completed in 2006 and 2007 but a quick comparison of historical with present consumption patterns indicates they are on track to achieving significant savings. Major selling points to residents of sub-metering are that it eliminates cross-subsidization of energy costs and that it provides the incentive to conserve electricity. Oakville Hydro found through the multi-residential metering program that when presenting to condominiums, there was a lot of negotiating due to the Condominium Act and individual board rules and regulations. Once the amendment to Bill 21 (that specifies that all condominiums are to be converted by 2010), is passed, the process of implementing the conversions will become easier. Oakville Hydro filed for an extension for this program to March 31, 2008.
Commercial/industrial energy information seminar The intent of this program is to increase awareness of existing energy efficiency programs and incentive programs to local industry. Seminars provide accurate and timely information that improves the ability of large consumers to control their energy and consumption costs and helps increase the competitive standing of the Ontario-based manufacturing sector.

Oakville Hydro
7
In June 2006 Oakville Hydro hosted a Commercial/Industrial Energy efficiency seminar at its office. Oakville Hydro partnered with local providers of energy efficiency products and services to provide information on topics including demand response, energy audits, energy load profiling and creating a sustainable energy plan. The seminar was directed at the top 30 Industrial/Commercial users of electricity in Oakville. The session was attended by 15 energy decision makers and feedback was very positive. Fourteen of the companies invited have received daily energy load profiles as a result of these efforts. The profiles allow the end users to make educated decisions on reducing energy in their facilities through direct feedback from their hydro meters. Oakville Hydro continues to work with these customers on reducing their energy demand and consumption and plans to host additional Industrial/Commercial seminars on current energy efficiency topics. The Commercial/Industrial seminar originally scheduled for 2007 has been rescheduled to March 2008.
Distributed generation - digester gas program As discussed in last year’s report, the digester gas program was cancelled in 2006.
Distributed generation - wind turbine As discussed in last year’s report, the wind turbine program was cancelled in 2006.
Peak demand reduction Emergency generator back-up for Oakville Hydro head office In the 2005-2007 CDM plan Oakville Hydro proposed to install a natural gas fired, low emission generator for peak shaving within the Oakville Hydro office building. The benefits of installing a stand-by generator at the office building include reducing demand from the local distribution grid; developing an increased understanding of synchronization, communications and control system requirements; an increased understanding of fuel issues for future expansion of the program to local customers; and a better understanding of the challenges in developing a larger scope program. In 2006, following further investigation of the project it was found that a generator with a capacity between 320 kW and 350 kW would be required to service the office building rather than the originally estimated capacity requirement of 250 kW. Consequently, the program cost was increased to approximately $866,000. The generator was purchased in

Oakville Hydro
8
2007 within the extension period of the program but has yet to be installed and used due to a long lead time for ordering the equipment. The generator purchased is rated at 375 kW continuous, with the ability to shave peak by 450 kW for up to 500 hours annually. Demand and energy savings for this program are not yet available. Energy management pilot project In 2006, the budget for Oakville Hydro's peak demand reduction program increased due to the development and implementation of a new pilot program, to pilot the management of electricity consumption in the Oakville Hydro service area. Valued at $100,000, the pilot involves installing two 100 kW natural gas generators, one at each of two Tim Horton's small commercial retail outlets. These standby power units will be remotely managed by Oakville Hydro and its partner TDL Group Corp and will be used to reduce demand from the system at peak times and to provide blackout protection for the customers. The payments for the generators were made in 2007 but the generators were not commissioned for use in 2007. Demand and energy savings for this program are therefore not yet available. Some of the common objectives for the project are to;
• Test the ability of certain Tim Horton’s facilities to satisfy Oakville Hydro’s need for Conservation and Demand Response capability (i.e. come off the grid at designated times and for designated durations) via the installation and management of standby power units.
• Address the electrical supply surety and conservation issues within Oakville
Hydro’s footprint by “freeing up” kilowatt hours from various pilot TDL facilities while still maintaining full functionality and “blackout protection” at the facilities.
• Establish as near possible both a seamless and touch-less operational initiation
response and quantification system connected to the standby power utility; which can be remotely managed to the satisfaction of both Oakville Hydro and TDL.
• Monitor, measure and report on multiple relevant variables and results which
build a technical and financial case for future business scrutiny. • Setup the pilot model with the ability to extend the program to other Oakville
Hydro customer locations and simultaneously link to other LDCs. Voltage conversion The intent of this program is to implement measures that will increase system efficiencies and therefore reduce the load on the power grid and add to the security and reliability of the distribution system because of better transformer efficiencies and lower line losses.

Oakville Hydro
9
Shopping mall In 2006, the conversion of a 1500 kVa transformer from 4 kV to 27.6 kV direct-feed power line from the grid was substantially completed, and fully completed in 2007. The conversion resulted in a 10 kW reduction in peak demand and estimated 50,000 kWh per year energy reduction. Residential neighbourhood In 2007 Oakville Hydro began the conversion of transformers in an older residential area from a 4 kV to 27.6 kV direct-feed power line. Upon completion, the conversion of the residential neighbourhood will result in a potential reduction of 40 kW in peak demand and an annual energy reduction of 170,000 kWh per year. Approximately one third of the planned conversions in the neighbourhood were completed in 2007. Solar panel program This program involves the installation and performance monitoring of an EnerWorks solar hot water heating appliance. It includes the installation of two roof mounted solar collectors and an EnerWorks’ Energy Pack heat exchanger and controls. The system was installed at Oakville Hydro’s head office and will work in conjunction with the existing electric hot water system currently being served by two 100 gallon electric hot water tanks with a recirculating loop. The system is also being installed with instrumentation used to track the energy savings achieved by the solar hot water heater appliance. This program will allow Oakville Hydro to confirm the potential energy savings of a solar hot water heating appliance in a commercial installation, save electricity consumption used in the production of domestic hot water, and investigate the various technical and operational issues associated with the installation of a solar hot water heating appliance in a commercial installation. The system was installed in 2006, and the associated invoice was paid in 2007. Although performance monitoring commenced in 2007, comprehensive results are not yet available. Lighting Retrofit The lighting retrofit program is a new program introduced in 2007. As part of this program, the Oakville Hydro facilities were evaluated for energy efficiency retrofit

Oakville Hydro
10
opportunities. As a result, opportunities for retrofitting the existing lighting system in the high bay garage and loading bays were identified. The lighting retrofit replaced 76 high pressure sodium fixtures with high efficiency T8 fluorescents. Eight motion sensors were also added to low traffic areas in the warehouse for additional savings. The project resulted in a 52 percent reduction in kW while increasing light levels by 35 percent. The project was outlined in the annual commercial/industrial seminar for large users resulting in a very successful retrofit incentive program uptake. Oakville Hydro is evaluating its other facilities for energy efficiency opportunities.
4. LESSONS LEARNED There were several lessons learned from Oakville Hydro’s work on the CDM plan in 2007, including:
• The importance and opportunity of identifying energy efficiencies within own facilities
• The need to incorporate lead times into project schedules. The importance and opportunity of identifying energy efficiencies within own facilities Oakville Hydro has learnt that energy efficiency measures can be identified and implemented within its own facilities. These measures benefit all Oakville Hydro customers. In addition to reducing load on the electricity system, these measures prove very useful as demonstrative measures to encourage energy conservation from the utility’s customers. This was seen in the case of the lighting retrofits in Oakville Hydro bays and garages which served as an example of the successful energy efficiency initiatives available to participants of the Commercial/Industrial energy information seminar. Incorporate lead times in project schedules In working against projected timelines for the completion of certain projects, Oakville Hydro has learnt that predicted project timelines are often difficult to govern by due to less predictable external timing factors. Specifically, this has been the case when equipment purchasing is involved. Long lead-times for equipment orders can unexpectedly delay a project. These potential delays should be considered when developing the scheduling of projects that require the ordering of equipment, installation and subsequent monitoring.

Oakville Hydro
11
5. CONCLUSION Oakville Hydro continues to advance the implementation and delivery of its CDM plan. Significant progress continues in the customer education program, multi-residential conversion program, and voltage conversion program. Although data are not yet compiled in the case of 2007 multi-residential conversions to interval metering, as discussed above, it is clear that this project is on the right track to achieve significant energy savings. Having sorted out the requirements and procurement of a stand-by generator for the Oakville Hydro office, the installation and subsequent testing and monitoring of a stand-by system will begin in the near future. Similarly, having received the stand-by units for the two participating retail locations, testing and monitoring of the remotely controlled demand response system will also begin in the near future. The newly implemented lighting retrofit program has enjoyed a strong beginning and is expected to expand to other energy saving retrofit initiatives within the office. These initiatives will aim to encourage the utility’s customers to initiate retrofit opportunities within their own operations. Oakville Hydro remains committed to the discussed programs and will continue to work through any challenges to ensure the implementation of an effective and successful Conservation and Demand Management Program.

Oakville Hydro 2007 CDM annual report
5 Cumulative Totals Life-to-
dateTotal for 2007 Residential Commercial/
Industrial Institutional LDC System 4 Smart Meters
Net TRC value ($): $277,448 $16,594 $543,947 -$499,652 -$3,215 -$24,486
Benefit to cost ratio: 1.20 1.02 2.40 0.00 0.00 0.68
Number of participants or units delivered: 62,439 34,339 33,663 592 0 84
Lifecycle (kWh) Savings: 31,940,039 16,355,646 14,655,646 0 0 1,700,000
Report Year Total kWh saved (kWh): 4,222,940 2,283,024 2,268,857 0 0 14,167
Total peak demand saved (kW): 155 15 1 0 0 13
Total kWh saved as a percentage of total kWh delivered (%): 0.09% 0.14% 0.38% 0.00% 0.00% n/a
Peak kW saved as a percentage of LDC peak kW load (%): 0.04% 0.01% n/a 0.00% 0.00% n/a
1 Report Year Gross C&DM expenditures ($): $ 1,785,477 691,880$ 21,518$ 589,652$ 3,215$ 77,496$ -$
2 Expenditures per KWh saved ($/kWh): 0.06$ 0.04$ 0.00$ -$ -$ 0.05$
3 Expenditures per KW saved ($/kW): 11,543.78$ 47,162.94$ 16,058.12$ -$ -$ 5,813.64$
Utility discount rate (%): 7.35%
2 Expenditures include all utility program costs (direct and indirect) for all programs which primarily generate energy savings.3 Expenditures include all utility program costs (direct and indirect) for all programs which primarily generate capacity savings.
5 Includes total for the reporting year, plus prior year, if any (for example, 2006 CDM Annual report for third tranche will include 2005 and 2004 numbers, if any.
1 Expenditures are reported on accrual basis.
Appendix A - Evaluation of the CDM Plan
4 Please report spending related to 3rd tranche of MARR funding only. TRC calculations are not required for Smart Meters. Only actual expenditures for the year need to be reported.
Oakville Hydro 2007 CDM annual report
A. Name of the Program:
Description of the program (including intent, design, delivery, partnerships and evaluation):
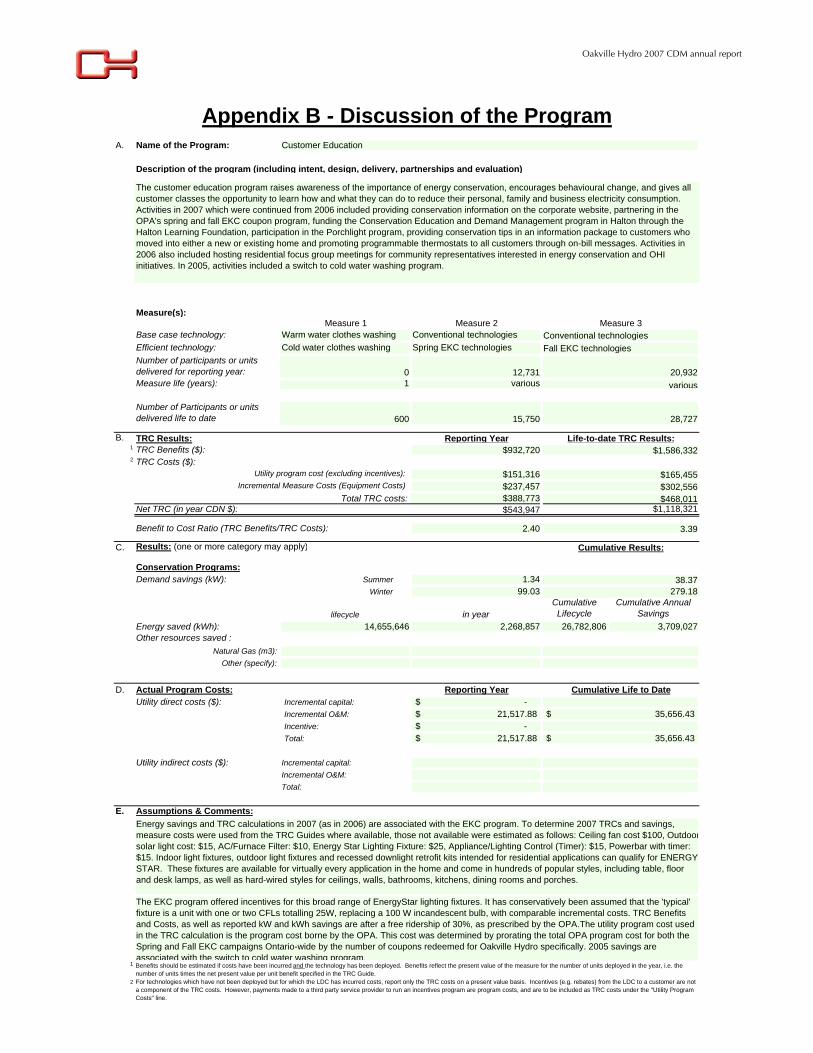
Measure(s):Measure 1 Measure 2
Base case technology: Warm water clothes washing Conventional technologiesEfficient technology: Cold water clothes washing Spring EKC technologiesNumber of participants or units delivered for reporting year: 0 12,731Measure life (years): 1 various
Number of Participants or units delivered life to date 600 15,750
B. TRC Results: Reporting Year1 TRC Benefits ($): $932,7202 TRC Costs ($):
$151,316$237,457
Total TRC costs: $388,773Net TRC (in year CDN $): $543,947
Benefit to Cost Ratio (TRC Benefits/TRC Costs): 2.40
C. Results: (one or more category may apply)
Conservation Programs:Demand savings (kW): Summer 1.34
Winter 99.03 279.18
lifecycle in yearCumulative Lifecycle
Cumulative Annual Savings
Energy saved (kWh): 14,655,646 2,268,857 26,782,806 3,709,027Other resources saved :
Natural Gas (m3):Other (specify):
D. Actual Program Costs: Reporting YearUtility direct costs ($): Incremental capital: -$
Incremental O&M: 21,517.88$ Incentive: -$ Total: 21,517.88$
Utility indirect costs ($): Incremental capital:Incremental O&M:Total:
E. Assumptions & Comments:
1
2
Appendix B - Discussion of the ProgramCustomer Education
The customer education program raises awareness of the importance of energy conservation, encourages behavioural change, and gives all customer classes the opportunity to learn how and what they can do to reduce their personal, family and business electricity consumption. Activities in 2007 which were continued from 2006 included providing conservation information on the corporate website, partnering in the OPA's spring and fall EKC coupon program, funding the Conservation Education and Demand Management program in Halton through the Halton Learning Foundation, participation in the Porchlight program, providing conservation tips in an information package to customers who moved into either a new or existing home and promoting programmable thermostats to all customers through on-bill messages. Activities in 2006 also included hosting residential focus group meetings for community representatives interested in energy conservation and OHI initiatives. In 2005, activities included a switch to cold water washing program.
Measure 3Conventional technologiesFall EKC technologies
20,932various
28,727
Life-to-date TRC Results:$1,586,332
Utility program cost (excluding incentives): $165,455Incremental Measure Costs (Equipment Costs) $302,556
$468,011$1,118,321
3.39
Cumulative Results:
38.37
Cumulative Life to Date
35,656.43$
35,656.43$
Benefits should be estimated if costs have been incurred and the technology has been deployed. Benefits reflect the present value of the measure for the number of units deployed in the year, i.e. the number of units times the net present value per unit benefit specified in the TRC Guide. For technologies which have not been deployed but for which the LDC has incurred costs, report only the TRC costs on a present value basis. Incentives (e.g. rebates) from the LDC to a customer are not a component of the TRC costs. However, payments made to a third party service provider to run an incentives program are program costs, and are to be included as TRC costs under the "Utility Program Costs" line.
Energy savings and TRC calculations in 2007 (as in 2006) are associated with the EKC program. To determine 2007 TRCs and savings, measure costs were used from the TRC Guides where available, those not available were estimated as follows: Ceiling fan cost $100, Outdoorsolar light cost: $15, AC/Furnace Filter: $10, Energy Star Lighting Fixture: $25, Appliance/Lighting Control (Timer): $15, Powerbar with timer: $15. Indoor light fixtures, outdoor light fixtures and recessed downlight retrofit kits intended for residential applications can qualify for ENERGY STAR. These fixtures are available for virtually every application in the home and come in hundreds of popular styles, including table, floor and desk lamps, as well as hard-wired styles for ceilings, walls, bathrooms, kitchens, dining rooms and porches.
The EKC program offered incentives for this broad range of EnergyStar lighting fixtures. It has conservatively been assumed that the 'typical' fixture is a unit with one or two CFLs totalling 25W, replacing a 100 W incandescent bulb, with comparable incremental costs. TRC Benefits and Costs, as well as reported kW and kWh savings are after a free ridership of 30%, as prescribed by the OPA.The utility program cost used in the TRC calculation is the program cost borne by the OPA. This cost was determined by prorating the total OPA program cost for both the Spring and Fall EKC campaigns Ontario-wide by the number of coupons redeemed for Oakville Hydro specifically. 2005 savings are associated with the switch to cold water washing program.

Oakville Hydro 2007 CDM annual report
A. Name of the Program:
Description of the program (including intent, design, delivery, partnerships and evaluation):
Measure(s):Measure 1 Measure 2 (if applicable)
Base case technology:Efficient technology:Number of participants or units delivered for reporting year:Measure life (years):
Number of Participants or units delivered life to date 50
B. TRC Results: Reporting Year1 TRC Benefits ($):2 TRC Costs ($):
Total TRC costs:Net TRC (in year CDN $):
Benefit to Cost Ratio (TRC Benefits/TRC Costs):
C. Results: (one or more category may apply)
Smart metering program:Metric (specify):
D. Actual Program Costs: Reporting YearUtility direct costs ($): Incremental capital:
Incremental O&M:Incentive:Total: -$
Utility indirect costs ($): Incremental capital:Incremental O&M:Total:
E. Assumptions & Comments:
1
2
Appendix B - Discussion of the Program
Smart Metering
The Smart Meter, Intelligent Network was cancelled in 2006. After the research, evaluation and testing of products in 2005, it was concluded that the "Intelligent Network" portion of the program is specific to Quadlogic, and as it stands, Oakville Hydro is unaware whether approved meter technologies will work with the Quadlogic system.
Measure 3 (if applicable)
Life-to-date TRC Results:
Incremental Measure Costs (Equipment Costs)Utility program cost (excluding incentives):
Cumulative Results:
322,531.36$ 144,750.34$
Cumulative Life to Date
467,281.70$
Benefits should be estimated if costs have been incurred and the technology has been deployed. Benefits reflect the present value of the measure for the number of units deployed in the year, i.e. the number of units times the net present value per unit benefit specified in the TRC Guide. For technologies which have not been deployed but for which the LDC has incurred costs, report only the TRC costs on a present value basis. Incentives (e.g. rebates) from the LDC to a customer are not a component of the TRC costs. However, payments made to a third party service provider to run an incentives program are program costs, and are to be included as TRC costs under the "Utility Program Costs" line.

Oakville Hydro 2007 CDM annual report
A. Name of the Program:
Description of the program (including intent, design, delivery, partnerships and evaluation):
Measure(s):Measure 1 Measure 2 (if applicable)
Base case technology: Bulk meteringEfficient technology: Sub-meteringNumber of participants or units delivered for reporting year: 592Measure life (years): 4
Number of Participants or units delivered life to date 878
B. TRC Results: Reporting Year1 TRC Benefits ($): n/a2 TRC Costs ($):
$366,717
Total TRC costs: $366,717Net TRC (in year CDN $): n/a
Benefit to Cost Ratio (TRC Benefits/TRC Costs): n/a
C. Results: (one or more category may apply)
Conservation Programs:Demand savings (kW): Summer n/a
Winter
lifecycle in yearCumulative Lifecycle
Cumulative Annual Savings
Energy saved (kWh): n/a n/a 1,627,904 406,976Other resources saved :
Natural Gas (m3):Other (specify):
D. Actual Program Costs: Reporting YearUtility direct costs ($): Incremental capital: 366,716.73$
Incremental O&M:Incentive:Total: 366,716.73$
Utility indirect costs ($): Incremental capital:Incremental O&M:Total:
E. Assumptions & Comments:
1
2
Appendix B - Discussion of the Program
Multi-residential Interval Metering
In 2005, Oakville Hydro converted the metering of a 76 unit condominium building from bulk metering to individually interval metered condominiums. In 2006, two 105 unit buildings were also converted. In 2007, Oakville Hydro completed the conversion of one 96 unit, one 208 unit, and two 144 unit condominium buildings. Residents of the condominiums converted in 2005 and 2006 are on time-of-use rates as part of an approved pilot project and have on-line access to their accounts. Oakville Hydro filed for an extension for this program to March 31, 2008.
Measure 3 (if applicable)
Life-to-date TRC Results:$104,668
Utility program cost (excluding incentives): $574,286Incremental Measure Costs (Equipment Costs)
$574,286-$469,618
0.182257507
Cumulative Results:
46.5
Cumulative Life to Date574,286.36$
574,286.36$
For technologies which have not been deployed but for which the LDC has incurred costs, report only the TRC costs on a present value basis. Incentives (e.g. rebates) from the LDC to a customer are not a component of the TRC costs. However, payments made to a third party service provider to run an incentives program are program costs, and are to be included as TRC costs under the "Utility Program Costs" line.
TRC benefits are reported only for conversions completed in 2005, at which a reduction of average month-to-month savings of about 25% were observed (NOT weather corrected). Data are still being gathered for the buildings completed in 2007, but initial indications arethat they are on track to achieve significant savings. TRC calculation is based on costs for 2006-2010, when individual meters would be installed in any event, so only the first 4 year value of 20-year meter costs are taken, and only savings from the first 4 years are shown as benefits. Demand savings have been conservatively estimated to be base load savings, but may be considerably higher.
Benefits should be estimated if costs have been incurred and the technology has been deployed. Benefits reflect the present value of the measure for the number of units deployed in the year, i.e. the number of units times the net present value per unit benefit specified in the TRC Guide.

Oakville Hydro 2007 CDM annual report
A. Name of the Program:
Description of the program (including intent, design, delivery, partnerships and evaluation):
Measure(s):Measure 1 Measure 2 (if applicable)
Base case technology:Efficient technology:Number of participants or units delivered for reporting year: 0Measure life (years):
Number of Participants or units delivered life to date 65
B. TRC Results: Reporting Year1 TRC Benefits ($):2 TRC Costs ($):
$29,740
Total TRC costs: $29,740Net TRC (in year CDN $): -$29,740
Benefit to Cost Ratio (TRC Benefits/TRC Costs):
C. Results: (one or more category may apply)
Conservation Programs:Demand savings (kW): Summer
Winter
lifecycle in yearCumulative Lifecycle
Cumulative Annual Savings
Energy saved (kWh):Other resources saved :
Natural Gas (m3):Other (specify):
D. Actual Program Costs: Reporting YearUtility direct costs ($): Incremental capital:
Incremental O&M: 29,740.00$ Incentive:Total: 29,740.00$
Utility indirect costs ($): Incremental capital:Incremental O&M:Total:
E. Assumptions & Comments:
1
2
Appendix B - Discussion of the Program
Annual Commercial/Industrial Energy Information Seminar
The intent of this program is to increase awareness of existing energy efficiency programs and incentive programs to local industry. Seminars provide accurate and timely information that improve the ability of large consumers to control their energy and consumption costs and help increase the competitive standing of the Ontario based manufacturing sector. In June 2006 Oakville Hydro hosted an Industrial/Commercial Energy efficiency seminar at their office. Oakville Hydro partnered with local providers of energy efficiency products and services to provide information on topics including Demand Response, Energy Audits, Energy Load Profiling and Creating a Sustainable Energy Plan. The seminar was directed at the top 30 Industrial/Commercial users of electricity in Oakville. The session was attended by 15 energy decision makers and feedback was very positive. Fourteen of the companies invited have received daily energy load profiles as a result of these efforts. The profiles allow the end users to make educated decisions on reducing energy in their facilities through direct feedback from their hydro meters. Oakville Hydro continues to work with these customers on reducing their energy demand and consumpThe CI seminar originally scheduled for 2007 was rescheduled to March 2008.
Measure 3 (if applicable)
Life-to-date TRC Results:
Incremental Measure Costs (Equipment Costs)
$32,220
Utility program cost (excluding incentives): $32,220
-$32,220
Cumulative Results:
32,220.45$
Cumulative Life to Date
32,220.45$
Benefits should be estimated if costs have been incurred and the technology has been deployed. Benefits reflect the present value of the measure for the number of units deployed in the year, i.e. the number of units times the net present value per unit benefit specified in the TRC Guide. For technologies which have not been deployed but for which the LDC has incurred costs, report only the TRC costs on a present value basis. Incentives (e.g. rebates) from the LDC to a customer are not a component of the TRC costs. However, payments made to a third party service provider to run an incentives program are program costs, and are to be included as TRC costs under the "Utility Program Costs" line.
The costs associated with the seminar rescheduled to March 2008 were paid for in 2007 and are therefore included as 2007 program costs.

Oakville Hydro 2007 CDM annual report
A. Name of the Program:
Description of the program (including intent, design, delivery, partnerships and evaluation):
Measure(s):Measure 1 Measure 2 (if applicable)
Base case technology:Efficient technology:Number of participants or units delivered for reporting year:Measure life (years):
Number of Participants or units delivered life to date
B. TRC Results: Reporting Year1 TRC Benefits ($):2 TRC Costs ($):
Total TRC costs: $0Net TRC (in year CDN $): $0
Benefit to Cost Ratio (TRC Benefits/TRC Costs):
C. Results: (one or more category may apply)
Distributed Generation and Load Displacement Programs:Amount of DG installed (kW):Energy generated (kWh):Peak energy generated (kWh):Fuel type:
Other Programs (specify):Metric (specify):
D. Actual Program Costs: Reporting YearUtility direct costs ($): Incremental capital:
Incremental O&M:Incentive:Total: -$
Utility indirect costs ($): Incremental capital:Incremental O&M:Total:
E. Assumptions & Comments:
1
2
Appendix B - Discussion of the Program
Distributed Generation -- Digester Gas Program
The program has been cancelled by Oakville Hydro due to numerous issues including: uncertainty regarding the exact flow and treatment of digester gas, complications in siting the combusion engine and connecting it to the existing thermal plan, and difficulties negotiating and drafting of the necessary business and legal arrangements with the region of Halton for the Mid-Halton Sewage Treatment Plant.
Measure 3 (if applicable)
Life-to-date TRC Results:
Incremental Measure Costs (Equipment Costs)
$7,245
Utility program cost (excluding incentives): $7,245
-$7,245
Cumulative Results:
7,245.00$ Cumulative Life to Date
7,245.00$
Benefits should be estimated if costs have been incurred and the technology has been deployed. Benefits reflect the present value of the measure for the number of units deployed in the year, i.e. the number of units times the net present value per unit benefit specified in the TRC Guide. For technologies which have not been deployed but for which the LDC has incurred costs, report only the TRC costs on a present value basis. Incentives (e.g. rebates) from the LDC to a customer are not a component of the TRC costs. However, payments made to a third party service provider to run an incentives program are program costs, and are to be included as TRC costs under the "Utility Program Costs" line.

Oakville Hydro 2007 CDM annual report
A. Name of the Program:
Description of the program (including intent, design, delivery, partnerships and evaluation):
Measure(s):Measure 1 Measure 2 (if applicable)
Base case technology:Efficient technology:Number of participants or units delivered for reporting year:Measure life (years):
Number of Participants or units delivered life to date
B. TRC Results: Reporting Year1 TRC Benefits ($):2 TRC Costs ($):
Total TRC costs: $0Net TRC (in year CDN $): $0
Benefit to Cost Ratio (TRC Benefits/TRC Costs):
C. Results: (one or more category may apply)
D. Actual Program Costs: Reporting YearUtility direct costs ($): Incremental capital:
Incremental O&M:Incentive:Total: -$
Utility indirect costs ($): Incremental capital:Incremental O&M:Total:
E. Assumptions & Comments:
1
2
Appendix B - Discussion of the Program
Distributed Generation - Wind Turbine
Oakville Hydro proposed to install and operate an 80 kW wind turbine on a proposed Town of Oakville recreational site to generate electricity for their facilities. After further investigation, Oakville Hydro determined that the proposed site for the wind turbine did not have a suitable wind resource, the proposed wind turbine was no longer supported by the original equipment manufacturer and it was a refurbished model that did not incorporate current technology. Because no commercial or near commercial wind turbines could be found suitable for the proposed site's wind regime and the program budget, Oakville Hydro has decided to cancel the project.
Measure 3 (if applicable)
Life-to-date TRC Results:
Utility program cost (excluding incentives): $4,950Incremental Measure Costs (Equipment Costs)
$4,950-$4,950
Cumulative Results:
Cumulative Life to Date4,950.00$
4,950.00$
For technologies which have not been deployed but for which the LDC has incurred costs, report only the TRC costs on a present value basis. Incentives (e.g. rebates) from the LDC to a customer are not a component of the TRC costs. However, payments made to a third party service provider to run an incentives program are program costs, and are to be included as TRC costs under the "Utility Program Costs" line.
Benefits should be estimated if costs have been incurred and the technology has been deployed. Benefits reflect the present value of the measure for the number of units deployed in the year, i.e. the number of units times the net present value per unit benefit specified in the TRC Guide.

Oakville Hydro 2007 CDM annual report
A. Name of the Program:
Description of the program (including intent, design, delivery, partnerships and evaluation):
Measure(s):Measure 1 Measure 2 (if applicable)
Base case technology:Efficient technology:Number of participants or units delivered for reporting year:Measure life (years):
Number of Participants or units delivered life to date
B. TRC Results: Reporting Year1 TRC Benefits ($):2 TRC Costs ($):
$103,195
Total TRC costs: $103,195Net TRC (in year CDN $): -$103,195
Benefit to Cost Ratio (TRC Benefits/TRC Costs):
C. Results: (one or more category may apply)
Demand Response Programs:Dispatchable load (kW):Peak hours dispatched in year (hours):
D. Actual Program Costs: Reporting YearUtility direct costs ($): Incremental capital: 103,194.95$
Incremental O&M:Incentive: 90,000.00$ Total: 193,194.95$
Utility indirect costs ($): Incremental capital:Incremental O&M:Total:
E. Assumptions & Comments:
1
2
Appendix B - Discussion of the ProgramPeak Demand Reduction
In the CDM plan, Oakville Hydro proposed installing and operating a natural gas-fired, low emission generator for peak shaving within its office building. Although originally proposed at a scale of 250 kW, further investigation revealed that a generator with greater capacity would be required to service the office building. The final generator set is rated at 375kW continuous, offering a standby and peak shaving rating of 450kW for up to 500 hours per year. Although paid for in 2007, the generator is anticipated to be installed by early spring of 2008, due to a long lead time for ordering of the equipment. This program took longer than anticipated and an extension was filed to the end of December 2007. In 2007, Oakville Hydro paid an incentive to Tim Hortons for the purchase of two stand-by natural gas generators of 100 kW each, which will be connected to two small commercial retail operations (Tim Hortons) partnered with TDL Group Corp, expected to be commissioned for use in 2008. These installations serve the purpose of reducing demand from the system at peak times and to provide blackout protection for the customers.
Measure 3 (if applicable)
Life-to-date TRC Results:
Utility program cost (excluding incentives): $126,593Incremental Measure Costs (Equipment Costs)
$126,593-$126,593
Cumulative Results:
Cumulative Life to Date126,593.37$
90,000.00$ 216,593.37$
For technologies which have not been deployed but for which the LDC has incurred costs, report only the TRC costs on a present value basis. Incentives (e.g. rebates) from the LDC to a customer are not a component of the TRC costs. However, payments made to a third party service provider to run an incentives program are program costs, and are to be included as TRC costs under the "Utility Program Costs" line.
Capital costs are those associated with the generator for Oakville Hydro, while the incentive costs are those associated with the stand-by generators for the two Tim Hortons locations.
Benefits should be estimated if costs have been incurred and the technology has been deployed. Benefits reflect the present value of the measure for the number of units deployed in the year, i.e. the number of units times the net present value per unit benefit specified in the TRC Guide.

Oakville Hydro 2007 CDM annual report
A. Name of the Program:
Description of the program (including intent, design, delivery, partnerships and evaluation):
Measure(s):Measure 1 Measure 2 (if applicable)
Base case technology: 4.7kV 1500 kVa transformer in shopping centre
4.7kV 1500 kVa transformer in residential area
Efficient technology: 27.6 kV direct-feed from grid 27.6 kV direct-feed from gridNumber of participants or units delivered for reporting year: 0 0.333Measure life (years): 30 30
Number of Participants or units delivered life to date 1 0.333
B. TRC Results: Reporting Year1 TRC Benefits ($): $53,0102 TRC Costs ($):
$77,496
Total TRC costs: $77,496Net TRC (in year CDN $): -$24,486
Benefit to Cost Ratio (TRC Benefits/TRC Costs): 0.68
C. Results: (one or more category may apply)
Line Loss Reduction Programs:Peak load savings (kW): 13.33
lifecycle in year lifecycle in yearEnergy savings (kWh): 1,700,000 14,167 3,200,000 64,167
Distributed Generation and Load Displacement Programs:Amount of DG installed (kW):Energy generated (kWh):Peak energy generated (kWh):Fuel type:
Other Programs (specify):Metric (specify):
D. Actual Program Costs: Reporting YearUtility direct costs ($): Incremental capital: 77,495.77$
Incremental O&M:Incentive:Total: 77,495.77$
Utility indirect costs ($): Incremental capital:Incremental O&M:Total: $0.00
E. Assumptions & Comments:
1
2
Appendix B - Discussion of the ProgramVoltage Conversion
Two specific projects have been identified that will increase system efficiencies, and therefore reduce the load on the power grid and add to the security and reliability of the distribution system because of better transformer efficiencies and lower line losses. In 2007, the conversion of a 1500 kVa transformer from 4 kV to 27.6 kV direct-feed from the grid was completed at a shopping centre. In 2007, Oakville Hydro also began the conversion of an older residential neighbourhood. By the end of the year, approximately one third of the conversions planned for the residential area were completed.
Measure 3 (if applicable)
Life-to-date TRC Results:$112,317
Utility program cost (excluding incentives): $411,826Incremental Measure Costs (Equipment Costs)
$411,826-$299,509
0.272729286
Cumulative Results:
23.33
Cumulative Life to Date411,826.18$
411,826.18$
For technologies which have not been deployed but for which the LDC has incurred costs, report only the TRC costs on a present value basis. Incentives (e.g. rebates) from the LDC to a customer are not a component of the TRC costs. However, payments made to a third party service provider to run an incentives program are program costs, and are to be included as TRC costs under the "Utility Program Costs" line.
$0.00
TRC calculations are based on savings from the completed shopping mall conversion (2006) estimated at 10 kW reduction in peak demand and estimated 50,000 kWh/a energy savings, and the one third completed residential area conversion (2007) estimated at 40 kW peak reduction, and 170,000 kWh/a. Results are based on the one third of the residential area delivering savings for 3 months.
Benefits should be estimated if costs have been incurred and the technology has been deployed. Benefits reflect the present value of the measure for the number of units deployed in the year, i.e. the number of units times the net present value per unit benefit specified in the TRC Guide.

Oakville Hydro 2007 CDM annual report
A. Name of the Program:
Description of the program (including intent, design, delivery, partnerships and evaluation):
Measure(s):Measure 1 Measure 2 (if applicable)
Base case technology:Efficient technology:Number of participants or units delivered for reporting year:Measure life (years):
Number of Participants or units delivered life to date
B. TRC Results: Reporting Year1 TRC Benefits ($):2 TRC Costs ($):
$3,215
Total TRC costs: $3,215Net TRC (in year CDN $): -$3,215
Benefit to Cost Ratio (TRC Benefits/TRC Costs):Peak load savings (kW):
lifecycle in yearEnergy savings (kWh):
Distributed Generation and Load Displacement Programs:Amount of DG installed (kW):Energy generated (kWh):Peak energy generated (kWh):Fuel type:
Other Programs (specify):Metric (specify):
D. Actual Program Costs: Reporting YearUtility direct costs ($): Incremental capital: 3,215.00$
Incremental O&M:Incentive:Total: 3,215.00$
Utility indirect costs ($): Incremental capital:Incremental O&M:Total:
E. Assumptions & Comments:
1
2
Solar Panel Program
This program involves the installation and performance monitoring of an EnerWorks solar hot water heating appliance. It includes the installation of two roof mounted solar collectors and an EnerWorks’ Energy Pack heat exchanger and controls. The system is to be installed at Oakville Hydro’s head office and will work in conjunction with the existing electric hot water system currently being served by two 100 gallon electric hot water tanks with a recirculating loop. The system is also being installed with instrumentation used to track the energy savings achieved by the solar hot water heater appliance, although comprehensive results are not yet available. The billing for the installation and work completed in 2006 was received in 2007 and is therefore included as 2007 expenditures.
Life-to-date TRC Results:
Utility program cost (excluding incentives):Incremental Measure Costs (Equipment Costs)
Appendix B - Discussion of the Program
Measure 3 (if applicable)
$35,418
$35,418
-$35,418
Cumulative Life to Date35,417.69$
35,417.69$
The pilot project began in 2006, and performance monitoring has not yet begun. Consequently, there are no TRC benefits or savings to report at this time.
Benefits should be estimated if costs have been incurred and the technology has been deployed. Benefits reflect the present value of the measure for the number of units deployed in the year, i.e. the number of units times the net present value per unit benefit specified in the TRC Guide. For technologies which have not been deployed but for which the LDC has incurred costs, report only the TRC costs on a present value basis. Incentives (e.g. rebates) from the LDC to a customer are not a component of the TRC costs. However, payments made to a third party service provider to run an incentives program are program costs, and are to be included as TRC costs under the "Utility Program Costs" line.

Oakville Hydro 2007 CDM annual report
A. Name of the Program:
Description of the program (including intent, design, delivery, partnerships and evaluation):
Measure(s):Measure 1 Measure 2 (if applicable)
Base case technology: 400W HPS light fixturesEfficient technology: 220W HE T8 light fixtures Motion sensorNumber of participants or units delivered for reporting year: 76 8Measure life (years): 10 10
Number of Participants or units delivered life to date 76 8
B. TRC Results: Reporting Year1 TRC Benefits ($): 92,076.59$ 2 TRC Costs ($):
64,310.00$
Total TRC costs: 64,310.00$ Net TRC (in year CDN $): 27,766.59$ 27,766.59$
Benefit to Cost Ratio (TRC Benefits/TRC Costs): 1.43
C. Results: (one or more category may apply)
Conservation Programs:Demand savings (kW): Summer 18.5
Winter 18.5
lifecycle in yearCumulative Lifecycle
Cumulative Annual Savings
Energy saved (kWh): 833930 83,393 833930 83,393Other resources saved :
Natural Gas (m3):Other (specify):
D. Actual Program Costs: Reporting YearUtility direct costs ($): Incremental capital: 64,310.00$
Incremental O&M:Incentive:Total: 64,310.00$
Utility indirect costs ($): Incremental capital:Incremental O&M:Total:
E. Assumptions & Comments:
1
2 For technologies which have not been deployed but for which the LDC has incurred costs, report only the TRC costs on a present value basis. Incentives (e.g. rebates) from the LDC to a customer are not a component of the TRC costs. However, payments made to a third party service provider to run an incentives program are program costs, and are to be included as TRC costs under the "Utility Program Costs" line.
The Oakville Hydro facilities were evaluated for energy efficiency and some opportunities for retrofitting the existing lighting system in the high bay garage and loading bays were found. The lighting retrofit replaced 76 high pressure sodium fixtures with high efficiency T8 fluorescents. The project resulted in a 52 percent reduction in kW while increasing light levels by 35 percent. The project was outlined in the annual commercial/industrial seminar for large users resulting in a very successful retrofit incentive program uptake. Eight motion sensors were also added to low traffic areas in the warehouse for additional savings. Oakville Hydro is evaluating its other facilities for energy efficiency opportunities.
Incremental Measure Costs (Equipment Costs)
1.43
18.518.5
Utility program cost (excluding incentives):
Appendix B - Discussion of the ProgramLighting Retrofit
Measure 3 (if applicable)
Life-to-date TRC Results:92,076.59$
64,310.00$
64,310.00$
Cumulative Results:
Cumulative Life to Date64,310.00$
64,310.00$
The motion sensors are assumed to each control 1/8th of the full new efficient load (76 x 220W / 8 = 2.1 KW). A commercial load type and 6500 annual hours usage (based on Oakville Hydro's facility hours) is assumed.
Benefits should be estimated if costs have been incurred and the technology has been deployed. Benefits reflect the present value of the measure for the number of units deployed in the year, i.e. the number of units times the net present value per unit benefit specified in the TRC Guide.

Oakville Hydro 2007 CDM annual report
Report Year:1. Residential Programs
TRC Benefits (PV) TRC Costs (PV) $ Net TRC Benefits
Benefit/Cost Ratio
Report Year Total kWh Saved
Lifecycle (kWh) Savings
Total Peak Demand (kW)
Saved
Report Year Gross C&DM
Expenditures ($)
Report LTD Gross C&DM Expenditures
($)Customer Education 932,720$ 388,773$ 543,947$ 2.40 2,268,857 14,655,646 1 21,518$ 35,656$ *Totals App. B - Residential 932,720$ 388,773$ 543,947$ 2.40 2,268,857 14,655,646 1 21,518$ 35,656$
Residential Indirect Costs not attributable to any specific program
Total Residential TRC Costs $ 388,773
**Totals TRC - Residential 932,720$ 388,773$ 543,947$ 2.40
2. Commercial/ Industrial Programs
TRC Benefits (PV) TRC Costs (PV) $ Net TRC Benefits
Benefit/Cost Ratio
Report Year Total kWh Saved
Lifecycle (kWh) Savings
Total Peak Demand (kW)
Saved
Report Year Gross C&DM
Expenditures ($)
Report LTD Gross C&DM Expenditures
($)Annual Commercial/Industrial Energy Information Seminar -$ 29,740$ 29,740-$ 0.00 0 0 n/a 29,740$ 32,220$ Multi-residential Interval Metering n/a 366,717$ n/a n/a n/a 366,717$ 574,286$ Peak Demand Reduction -$ 103,195$ 103,195-$ 0.00 0 193,195$ 216,593$
*Totals App. B - Commercial/ Industrial -$ 499,652$ 499,652-$ 0.00 0 0 0 589,652$ 823,100$
Commercial/ Industrial Indirect Costs not attributable to any specific program
Total TRC Costs $ 499,652
**Totals TRC - Commercial/ Industrial -$ 499,652$ 499,652-$ 0.00
3. Institutional Programs
TRC Benefits (PV) TRC Costs (PV) $ Net TRC Benefits
Benefit/Cost Ratio
Report Year Total kWh Saved
Lifecycle (kWh) Savings
Total Peak Demand (kW)
Saved
Report Year Gross C&DM
Expenditures ($)
Report LTD Gross C&DM Expenditures
($)Distributed Generation -- Digester Gas Program -$ -$ -$ 0.00 -$ 7,245$ Distributed Generation - Wind Turbine -$ -$ -$ 0.00 0 0 0 -$ 4,950$ Solar Panel Program -$ 3,215$ 3,215-$ 0.00 0 0 0 3,215$ 35,418$ *Totals App. B - Institutional -$ 3,215$ 3,215-$ 0.00 0 0 0 3,215$ 47,613$
Institutional Indirect Costs not attributable to any specific program
Total TRC Costs $ 3,215
**Totals TRC - Institutional -$ 3,215$ 3,215-$ 0.00
4. Industrial ProgramsTRC Benefits
(PV) TRC Costs (PV) $ Net TRC BenefitsBenefit/Co
st RatioReport Year Total
kWh SavedLifecycle (kWh)
Savings
Total Peak Demand (kW)
Saved
Report Year Gross C&DM
Expenditures ($)0.00
Name of Program B -$ 0.00Name of Program C -$ 0.00Name of Program D -$ 0.00Name of Program E -$ 0.00Name of Program F -$ 0.00Name of Program G -$ 0.00Name of Program H -$ 0.00Name of Program I -$ 0.00Name of Program J -$ 0.00*Totals App. B - Industrial -$ -$ -$ 0.00 0 0 0 -$
Industrial Indirect Costs not attributable to any specific program
Total TRC Costs $ -
**Totals TRC - Industrial -$ -$ -$ 0.00
5. Agricultural ProgramsTRC Benefits
(PV) TRC Costs (PV) $ Net TRC BenefitsBenefit/Co
st RatioReport Year Total
kWh SavedLifecycle (kWh)
Savings
Total Peak Demand (kW)
Saved
Report Year Gross C&DM
Expenditures ($)N/A -$ 0.00Name of Program B -$ 0.00Name of Program C -$ 0.00Name of Program D -$ 0.00Name of Program E -$ 0.00Name of Program F -$ 0.00Name of Program G -$ 0.00Name of Program H -$ 0.00Name of Program I -$ 0.00Name of Program J -$ 0.00*Totals App. B - Agricultural -$ -$ -$ 0.00 0 0 0 -$
Appendix C - Program and Portfolio Totals2007

Oakville Hydro 2007 CDM annual report
Agricultural Indirect Costs not attributable to any specific program
Total TRC Costs $ -
**Totals TRC - Agricultural -$ -$ -$ 0.00
6. LDC System Programs
TRC Benefits (PV) TRC Costs (PV) $ Net TRC Benefits
Benefit/Cost Ratio
Report Year Total kWh Saved
Lifecycle (kWh) Savings
Total Peak Demand (kW)
Saved
Report Year Gross C&DM
Expenditures ($)
Report LTD Gross C&DM Expenditures
($)Voltage Conversion 53,010$ 77,496$ 24,486-$ 0.68 14,167 1,700,000 13 77,496$ 411,826$ Lighting Retrofit 92,077$ 64,310$ 27,767$ 1.43 83,393 833,930 19 64,310$ 64,310$ *Totals App. B - LDC System 53,010$ 77,496$ 24,486-$ 0.68 14,167 1,700,000 13 77,496$ 411,826$
LDC System Indirect Costs not attributable to any specific program
Total TRC Costs $ 77,496
**Totals TRC - LDC System 53,010$ 77,496$ 24,486-$ 0.68
7. Smart Meters ProgramReport Year Gross C&DM Expenditures ($)
Report LTD Gross C&DM Expenditures ($)
Smart Meter - 467,282
LDC's CDM PORTFOLIO TOTALS
TRC Benefits (PV) TRC Costs (PV) $ Net TRC Benefits
Benefit/Cost Ratio
Report Year Total kWh Saved
Lifecycle (kWh) Savings
Total Peak Demand (kW)
Saved
Report Year Gross C&DM
Expenditures ($)
Report LTD Gross C&DM Expenditures
($)*TOTALS FOR ALL APPENDIX B 985,730$ 969,135$ 16,594$ 1.02 2,283,024$ 16,355,646$ 15$ 691,880$ 1,785,477$
Any other Indirect Costs not attributable to any specific program
TOTAL ALL LDC COSTS 969,135$ **LDC's PORTFOLIO TRC 985,730$ 969,135$ 16,594$ 1.02
* The savings and spending information from this row is to be carried forward to Appendix A.** The TRC information from this row is to be carried forward to Appendix A.