conservation of invertebrate biodiversity on a mountain in ... · conservation of invertebrate...
TRANSCRIPT

Conservation of invertebrate biodiversity on a mountain in a global biodiversity hotspot, Cape Floral Region J. S. Pryke M. J. Samways Department of Conservation Ecology and Entomology, Centre for Agricultural Biodiversity, Faculty of AgriSciences, University of Stellenbosch, Private Bag XI, Matieland, 7602, South Africa
AbstractMountains present particular challenges for biodiversity conservation. Table Mountain is a significant mountain in a global biodiversity hotspot, the Cape Floristic Region. It has outstanding angiosperm diversity and endemism. Yet, aerial and foliage invertebrates in the area have been poorly studied, despite their importance as pollinators and predators. These plant and invertebrate assemblages are under great pressure from human disturbance. Aerial and foliage invertebrates were sampled with a range of techniques. Sites were chosen to make comparisons between vegetation structure and type, elevation and aspect. In total, 216 species from 63 families and 14 orders were recorded. Vegetation structure (fynbos or forest) and elevation were the most important environmental variables for both aerial and foliage invertebrates. Peak time for aerial invertebrate abundance was spring and summer in the fynbos and spring in the forests, while the foliage invertebrates showed very little seasonal variation. There was no correlation between the diversity of aerial and foliage invertebrates. When these results were compared with others on epigaeic invertebrates, it became clear that epigaeic and aerial invertebrates are not correlated, while epigaeic and foliage invertebrates were only partially correlated, but not sufficiently so to consider one as a reliable estimator of the other. The management pointer from this study is that sites at all elevations are vital for the conservation of biodiversity on Table Mountain. Both the aerial and epigaeic/foliage invertebrate assemblages will need to be monitored separately to maintain the mountain’s conservation status.
Keywords: Arthropods, Biodiversity conservation, Cape Floristic Region, Foliage invertebrates, Flying invertebrates, Global diversity hotspot, Invertebrates, Monitoring, Mountains, Table Mountain .
IntroductionLocated at the southwestern extremity of Africa, the Cape Peninsula is an area of outstanding biological importance. It is located within the Cape Floristic Region (CFR), a region of exceptional floral diversity and recognised as one of the six floral kingdoms of the world (Goldblatt 1997), and one of the 34 global hotspots (Mittermeier et al. 2004). Although only 470 km2, it supports 158 endemic angiosperm species (Helme and Trinder‐Smith 2006), and has the one of the highest known incidences of local floral endemism in the world (Gentry 1986; Cowling et al. 1992). Indeed, it has the world’s greatest density of narrow endemics for similar sized areas (Cowling et al. 1996). Picker and Samways (1996) compiled a literature survey for the Cape Peninsula and recorded 112 endemic faunal species, of which 111 were invertebrates. Stiller (2002) showed that 68% of the leafhoppers in the CFR are endemic. The CFR also has a number of threatened Odonata, ten of which occur in the CFR and six are endemic to the area (Samways 2006). The Cape Peninsula has number of flying invertebrates that are IUCN Red Listed, including five butterflies (Henning and Henning 1989) and two dragonfly species (Samways 2006). Furthermore, there are few archaic taxa on the Peninsula, such as the Hymenoptera families Trigonalidae (Benoit 1951) and Figitidae (Quinlan 1979).
1

Invertebrates play a vital role in the ecosystem processes of the CFR (Wright 1993), while the monitoring of invertebrates has recently become a global priority owing to their ecosystem services (Dobson 2005; Rohr et al. 2007). Currently, there is concern over the global loss of invertebrate pollinators (Kearns et al. 1998), which are important in maintaining the CFR’s current plant diversity. They are so important that it has been suggested that these pollinators even played a role in the radiation of the CFR plants (Johnson 1996).
Picker and Samways (1996) showed that most of the endemic invertebrate species recorded on the Cape Peninsula were from Table Mountain. Furthermore, at the base of Table Mountain lies the city of Cape Town which has some of the highest levels of disturbance on the Cape Peninsula (Cowling et al. 1996). Among the threats to the invertebrate assemblage of Table Mountain is the invasive Argentine ant (Linepithema humile), which thrives in such disturbed habitats and displaces local ant assemblages (Cole et al. 1992; Human and Gordon 1996, 1997; Human et al. 1998; Human and Gordon 1999). It has been recorded in the fynbos of the CFR (Donnelly and Giliomee 1985; De Kock and Giliomee 1989) as well as in the indigenous forests and fynbos on the slopes of the mountain (Ratsirarson et al. 2002; Pryke and Samways 2008). The European wasp (Vespula germanica) (Hymenoptera: Vespidae) also poses a threat to the flying insects especially other hymenopterans on the Cape Peninsula (Tribe and Richardson 1994).
Many environmental factors, such as temperature, radiation and precipitation vary according to elevation and aspect of the same mountain (Stevens 1992; Lomolino 2001). Although there are many studies on the effect of elevation on insect assemblages (McCoy 1990; Olson 1994; Romero‐Alcaraz and Avila 2000; Axmacher et al. 2004), there has been little consensus. Nevertheless, the general trend has been for decreasing diversity with increasing elevation. Furthermore, very little research has been done on the comparison of aerial and foliage invertebrates between different natural vegetation types, nor on their response to aspect, elevation and seasonal changes, especially in the CFR. In response, these factors are investigated here.
As Table Mountain is arguably a regional biodiversity hotspot within a global biodiversity hotspot, yet is under extreme anthropogenic pressure, it is essential that there is a biodiversity assessment of the invertebrates associated with the diverse plant assemblage. Knowing where they are positioned on the mountain (e.g. at what elevation, associated with which aspect, and with which plants) also means that a meaningful management strategy can be instigated. Determining whether there is a correlation between the various habitat levels (epigaeic, foliage and aerial) will help us determine the effectiveness of sampling one of these levels to determine overall invertebrate diversity. Thus, this study also makes management recommendations.
Methods
StudysiteTable Mountain is within the Table Mountain National Park (TMNP) on the Cape Peninsula. All sampling was conducted within the TMNP, with the exception of the young forest sites, which are owned by the City of Cape Town. These young forest sites are highly disturbed, and are currently regrowing. Far more sunlight is able to penetrate their canopies compared to the protected, and much less disturbed, forests within TMNP. This sunlight penetration has allowed for undergrowth vegetation to establish, which is absent from the natural forests on the mountain.
The slopes of Table Mountain are dominated by Peninsula Granite Fynbos, while the top of the mountain is Peninsula Sandstone Fynbos.
2

InvertebratesamplingOne foliage and two aerial sampling techniques were used to obtain a wide range of species. It has been shown that a wide range trapping techniques, gives a wider range of species per site (Standen 2000; Wikars et al. 2005; Hyvarinen et al. 2006).
Sites were chosen to allow comparisons between vegetation type, elevation and aspect (Table 1). For each combination of vegetation, aspect and elevation, five independent, replicated sites were chosen for replication, and they were at least 400 m apart to avoid sampling interference. There were in total 60 different sites, sampled in 12 different habitats, each site was revisited each season. Of the fynbos sites, the east and west side were in Peninsula Granite Fynbos, the sites on the north, south and top of the mountain were in Peninsula Sandstone Fynbos.
Table 1 Vegetation types sampled, with their codes, aspect and elevation
Code Vegetation type AspectElevation (m, a.s.l.)
Riverine
WeFyn Peninsula Granite Fynbos West 240–320 Non-riverine
NoFyn Peninsula Sandstone Fynbos North 400–440 Non-riverine
EaFyn Peninsula Granite Fynbos East 320–380 Non-riverine
SoFyn Peninsula Sandstone Fynbos South 320–400 Non-riverine
TopFyn Peninsula Sandstone Fynbos Top 680–780 Non-riverine
EaRF Southern Afrotemperate Forest East 320–380 Riverine
EaNR Southern Afrotemperate Forest East 320–380 Non-riverine
SoHRF Southern Afrotemperate Forest South 320–340 Riverine
SoHNF Southern Afrotemperate Forest South 320–340 Non-riverine
SoLRF Southern Afrotemperate Forest South 100–160 Riverine
SoLNR Southern Afrotemperate Forest South 100–160 Non-riverine
YoungF Southern Afrotemperate Forest East 100–140 Non-riverine
Riverine forests are natural forests less than 10 m from a stream Non-riverine forests are forests farther than 30 m from a stream A D‐vac suction sampler was used instead of other more traditional foliage sampling methods, such as sweep netting or beat trays. This was necessary as the fynbos is woody and not easily sampled using a sweep net, and beating is too harmful on the rare plants in the area (over 300 plants are either endemic to the area or IUCN Red Listed.) A D‐vac consists of a collecting bag mounted in the collecting nozzle, which in turn is connected by a 20 cm hose to a 3 horsepower back‐pack mounted engine (Dietrick et al. 1959; Southwood and Henderson 2000). The nozzle width used in this study was 30 cm. The nozzle was vertically moved into the foliage 40 times per site, so overcoming small catch sizes when used horizontality (Richmond and Graham 1969), the entire collection from all 40 ‘stabs’ was accumulated into a single sample. As the objective of this sampling technique was to sample the foliage invertebrates, care was taken not to allow the nozzle of the D‐vac to go too close to the leaf litter. Collected specimens were preserved for later identification.
Flying insects, particularly Coleoptera, fall down on hitting an obstacle. Window traps take advantage of this behaviour to capture these insects (Southwood and Henderson 2000). The window traps used for this study were custom designed to suit the local environment, particularly the fynbos height, the unpredictable winds, the gradient and the rocky terrain of Table Mountain. These traps consisted of a reinforced aluminium frame mounted on cast iron staves hammered into the ground. A glass sheet 0.5 m × 0.7 m was placed in this frame, with effectively 0.25 m2 of glass exposed to the insect flight
3

paths. Below the glass was a collecting trough filled with water and detergent to reduce surface tension. No attractants were used. The whole trap was then pegged to the ground using ropes and four pegs. Glass was chosen over Perspex to eliminate the problems of static electricity holding the insects. Glass was also preferable to avoid the clouding effect of Perspex, when exposed to long periods of sunlight, as was the case here. Two traps were set‐up at each site, with one being perpendicular, and the other horizontal, to the mountain slope. Both were left out for a 24‐h period, to avoid any time of day preference. After this time, the sample was drained using a net, and the specimens were preserved for later identification.
Aerial surveys were established to record flying insects that are not normally collected by window traps. These surveys were particularly effective for recording diurnal Lepidoptera and Odonata. Aerial surveys consisted of 5‐min periods when all focal flying insects were recorded (see Table 2), on windless sunny days only. Unrecognised insects where captured with a hand net for later identification. All aerial surveys were conducted by the same person to minimise any differential errors due to sampling effort or relative knowledge, conduced between 10 and 14 h to avoid errors due to time of day sampling.
Table 2 Invertebrates sampled and location of voucher collections
Class Order Family Level of identification
Identifier Location of voucher specimens
Arachnida Araneae All Species
A Dippenaar‐
Schoeman and C
Haddad
SANCA
Opiliones All Species J Pryke US
Insecta
Odonata All Species J Pryke US
Blattodea All Species J Pryke US
Orthoptera All Species C Bazelet US
Mantodea All Species L Spearman ISAM
Phasmatodea All Species P Brock US
Hemiptera Cicadidae Species J Pryke US
Coleoptera Carabidae Species J Pryke US
Scarabaeidae Species J Pryke US
Neuroptera All Species J Pryke US
Diptera Tabanidae Species J Pryke US
Lepidoptera All Species J Pryke US
4

Class Order Family Level of identification
Identifier Location of voucher specimens
Hymenoptera Formicidae Species C Boonzaaier US
All others Family H Geertsma ISAM
SANCA, South African National Collection of Arachnida; US, University of Stellenbosch; ISAM, Iziko
South African Museum
For all sampling methods the collected arthropods were sorted and placed into families (Table 2). They were then, where possible, identified to species level. Owing to the great taxonomic challenge, time constraints and lack of experts or material to identify the Hymenoptera (with the exception of the Formicidae), morphospecies were used for this group. Nevertheless, all hymenopteran specimens were recorded at least to family level. All retained specimens from all collecting methods were placed in voucher collections in various museums (Table 2).
Sampling was carried out from October 2005 to January 2007. Sampling was done at all sites every three months (January, April, July, October) four times a year using the D‐vac, and three times a year using window traps and aerial surveys (January, April, October).
Epigaeic invertebrate biodiversity data for comparison with data here are given in Pryke and Samways (2008).
DataanalysisSpecies accumulation curves were calculated using EstimateS, with samples randomised 50 times (Colwell 2006). These curves where plotted for all the sites, but separately for the forest and the fynbos sites. Non‐parametric species estimators can provide the best overall species estimates (Hortal et al. 2006), particularly for insect assemblages where a large number of rare species is usual (Novotny and Basset 2000). Furthermore, it is recommended that a variety of species estimators are used in sample‐based biological studies (Hortal et al. 2006). Incidence‐based Coverage Estimator (ICE) is considered a robust and accurate estimator of species richness (Chazdon et al. 1998). Chao2 and second‐order Jackknife estimators provide the least biased estimates, especially for small sample sizes (Colwell and Coddington 1994), thus these estimators were calculated using EstimateS. Since the Chao’s estimated incidence distribution (CV) was >0.5 for all variations recorded here, the classic method rather than to the bias‐corrected option was used.
The species richness residuals for the aerial, foliage and epigaeic sampling methods were tested for normality using Shapiro & Wilk’s W statistic (Legendre and Legendre 1998), as the data showed heterogeneity of variances. Correlations were then calculated using the Spearman’s rank order coefficient. The results of these correlations suggested that the foliage and aerial data should be analysed separately.
Canonical Correspondence Analysis (CCA) was performed on the aerial and foliage data using CANOCO version 4.5 software (ter Braak and Smilauer 2002). CCA adds the power of regression to the ordination (ter Braak and Verdonschot 1995). It is a direct gradient analysis technique that uses multiple regression to select linear combinations of environmental variables that account for most of the variation in the species scores on each axis. The method is considered to be robust, and accommodating for skewed species distributions, interrelated environmental variables and incomplete environmental measurements (Palmer 1993). The nominal variables in the CCA were vegetation types (structure and type) and aspect, while the continuous variables were elevation and the abundance of L. humile. CCAs were done for all aerial and foliage sites separately, with a CCA for aerial fynbos and aerial forests sites separately.
5
Forward selection was used to rank environmental variables in order of importance according to the eigenvalues produced when each variable is considered individually. Monte Carlo permutation tests (Manly 1990), using 499 unrestricted random permutations, were performed to test the significance of the environmental variables on species distribution patterns.
The species richness and abundance residuals for both the aerial and foliage data were tested for normality using Shapiro & Wilk’s W statistic (Legendre and Legendre 1998). The aerial species richness and aerial and foliage abundance data showed non‐normal distribution and heterogeneity of variances, even after transformation (Underwood 1997; Legendre and Legendre 1998). Only the foliage species richness data showed normality and homogeneity of variances after these data were square‐root transformed. Thus, a pairwise Kruskal‐Wallis non‐parametric analysis of variance (ANOVA) was calculated on the aerial species richness and abundance data and the foliage abundance data for the different sites. A one way ANOVA was performed on the square‐root transformed foliage species data comparing the different sites, with multiple comparisons of the means using the Bonferroni correction (Legendre and Legendre 1998).
To determine the seasonal variation, the species richness and abundance residuals, for both the species richness and abundance for aerial and foliage data in both the fynbos and forest sites separately, were tested for normality using Shapiro & Wilk’s W statistic (Legendre and Legendre 1998). All the data, with the exception of those for the aerial fynbos, showed non‐normal distribution and heterogeneity of variances, even after transformation (Underwood 1997; Legendre and Legendre 1998). The aerial fynbos species data showed normality and homogeneity of variances, while the abundance data only showed normality and homogeneity of variances after square‐root transformation. Pairwise Kruskal‐Wallis non‐parametric ANOVAs were performed on the aerial forest data and the all foliage data for species and abundance, per season. Pairwise one way ANOVAs were performed on the aerial species richness and square‐root transformed abundance data using the Bonferroni correction per season (Legendre and Legendre 1998).
Results
SpeciesabundanceandcorrelationsbetweenthespeciesrichnessofthevarioushabitatlayersIn total, 216 species were sampled from 63 families and 14 orders. Aerial sampling recorded 188 species in 43 families from 12 orders, with 126 species in fynbos (41 families, 12 orders) and 62 from forest sites (27 families, 8 orders). The species estimators for the aerial sampling at all the sites were: ICE = 195.80, Chao2 = 192.08 (SD ± 17.15) and Jackknife2 = 215.69. Species estimators for aerial sampling in the fynbos were: ICE = 171.00, Chao2 = 169.23 (SD ± 18.39) and Jackknife2 = 187.40 and for the forest sites: ICE = 98.14, Chao2 = 87.03 (SD ± 13.22) and Jackknife2 = 100.63.
Foliage sampling recorded 105 species from 42 families and 10 orders, with 67 species in fynbos (32 families, 8 orders) and 77 species in forests (31 families, 10 orders). The species estimators for the foliage sampling at all the sites were: ICE = 180.28, Chao2 = 168.63 (SD ± 23.67) and Jackknife2 = 184.64. Species estimators for foliage sampling in the fynbos were: ICE = 123.95, Chao2 = 112.75 (SD ± 19.98) and Jackknife2 = 124.48 and for the forest sites: ICE = 131.35, Chao2 = 136.91 (SD ± 27.57) and Jackknife2 = 138.38.
Species accumulation curves for all sites, and then just fynbos sites and forest sites for both aerial and foliage sampling, although flattening, did not reach asymptotes (Fig. 1). Sample rarefaction curves for aerial sampling showed that the fynbos curve was higher than the overall species curve, with the forest curves far below the other two curves (Fig. 1a). For the foliage sampling, the overall and forest curves followed a very similar pattern, with the fynbos curve below both (Fig. 1b).
6

Fig. 1 Sample rarefaction curves of aerial (a) and foliage (b) invertebrates for all the natural vegetation types, natural forest sites and fynbos sites
Species richness correlation between the various habitat layers (epigaeic, foliage and aerial) showed little correlation, with the exception of the epigaeic versus foliage, which in both the fynbos and forest, showed significant correlation (Table 3). There was also a significant correlation between the epigaeic and aerial sampling in all vegetation.
Table 3 Spearman’s rank order correlation coefficients between the species richness of three areas of invertebrate sampling in various vegetation types
Structural level of invertebrate sampling Aerial Foliage
Fynbos N = 25
Foliage 0.319
Epigaeic 0.131 0.645*
Forest N = 35
Foliage 0.105
Epigaeic 0.224 0.511*
Overall N = 60
Foliage 0.184
Epigaeic 0.452* 0.539*
* Represents a P ≤ 0.01
7
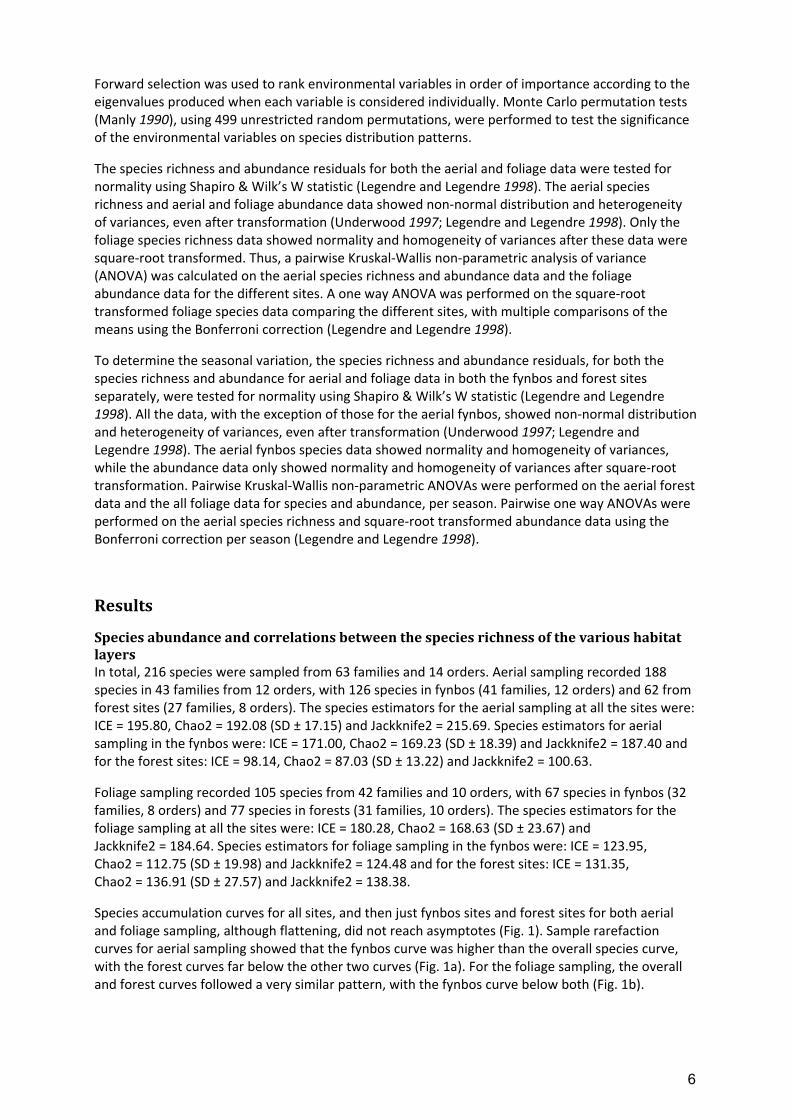
Epigaeic = invertebrate richness of species sampled in pitfall traps, quadrat samples and Berlese‐Tulgren Funnels (data from Pryke and Samways 2008); Foliage = invertebrates recorded by D‐vac sampling and Aerial = invertebrates sampled in window traps and with 5 min visual surveys
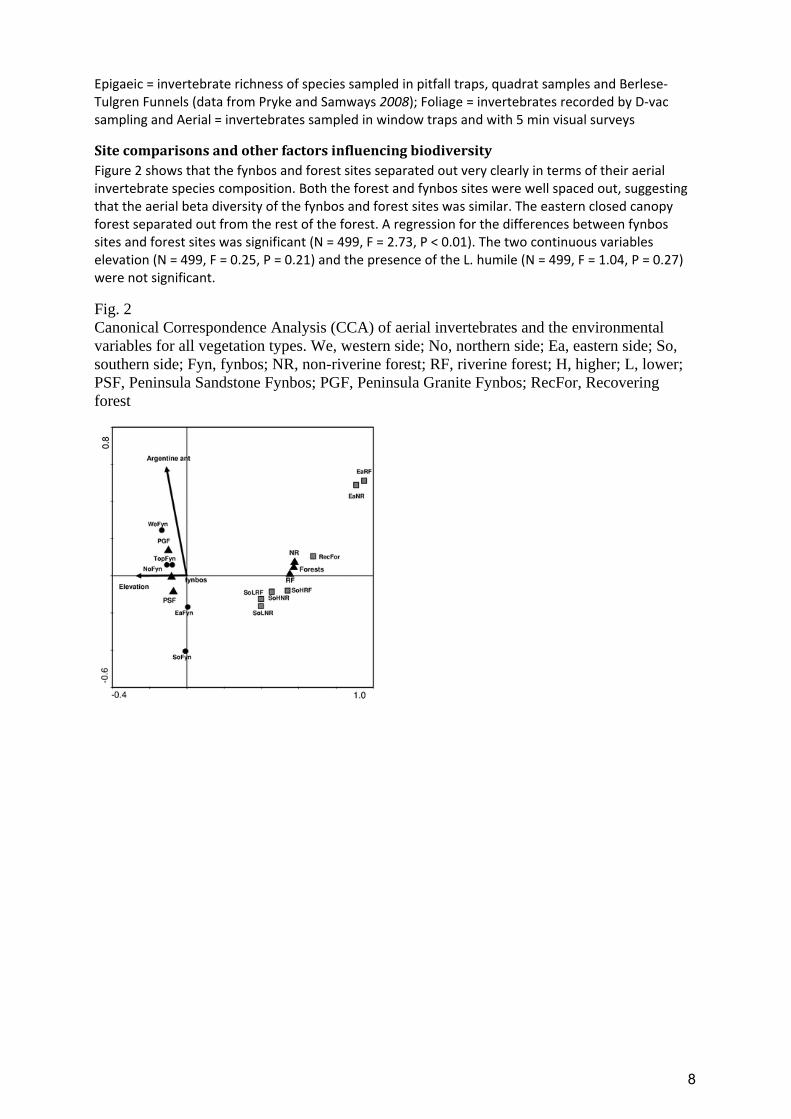
SitecomparisonsandotherfactorsinfluencingbiodiversityFigure 2 shows that the fynbos and forest sites separated out very clearly in terms of their aerial invertebrate species composition. Both the forest and fynbos sites were well spaced out, suggesting that the aerial beta diversity of the fynbos and forest sites was similar. The eastern closed canopy forest separated out from the rest of the forest. A regression for the differences between fynbos sites and forest sites was significant (N = 499, F = 2.73, P < 0.01). The two continuous variables elevation (N = 499, F = 0.25, P = 0.21) and the presence of the L. humile (N = 499, F = 1.04, P = 0.27) were not significant.
Fig. 2 Canonical Correspondence Analysis (CCA) of aerial invertebrates and the environmental variables for all vegetation types. We, western side; No, northern side; Ea, eastern side; So, southern side; Fyn, fynbos; NR, non-riverine forest; RF, riverine forest; H, higher; L, lower; PSF, Peninsula Sandstone Fynbos; PGF, Peninsula Granite Fynbos; RecFor, Recovering forest
8

Fig. 3 Canonical Correspondence Analysis (CCA) of aerial invertebrates and the environmental variables for fynbos sites. We, western side; No, northern side; Ea, eastern side; So, southern side; Fyn, fynbos; PSF, Peninsula Sandstone Fynbos; PGF, Peninsula Granite Fynbos
When the aerial data from the fynbos were plotted on a CCA, the top sites, the western sites and the northern sites, all separated out (Fig. 3). Only two sites grouped together, the eastern and southern aspects, which both shared cooler and wetter conditions (Fig. 3). None of the variables contributed significantly towards the variation, with the presence of the Argentine ant (N = 499, F = 1.41, P = 0.13) having the strongest influence, followed by elevation (N = 499, F = 1.05, P = 0.34) and then type of fynbos (N = 499, F = 0.95, P = 0.56). A CCA of the forest aerial invertebrates showed that the eastern side protected forests separated from the other forest sites and the higher south side forest sites grouped together (Fig. 4). The riverine and non‐riverine low‐lying southern forests, and the young disturbed forests, separated out from all other sites. There were significant regressions for elevation (N = 499, F = 1.44, P < 0.01) and aspect (east versus south) (N = 499, F = 1.31, P = 0.02) but non‐significant regressions for the presence of L. humile (N = 499, F = 0.87, P = 0.66) and proximity of the forest site to a river (N = 499, F = 0.83, P = 0.85).
9

Fig. 4 Canonical Correspondence Analysis (CCA) of aerial invertebrates and the environmental variables for forest sites. Ea, eastern side; So, southern side; NR, non-riverine forest; RF, riverine forest; H, higher; L, lower; RecFor, Recovering forest
The CCA for foliage showed that the fynbos and forest sites separated out from each other, with the forest sites more spread out than the fynbos sites (Fig. 5). The forest sites separated out to some extent on the proximity of to water, while the western fynbos site separated out from the other sites. There were four significant regressions: vegetation structure (fynbos verses forests) (N = 499, F = 1.80, P < 0.01), forest type (riverine verses non‐riverine) (N = 499, F = 1.40, P = 0.01), elevation (N = 499, F = 1.45, P = 0.03) and the presence of L. humile (N = 499, F = 1.38, P = 0.05).
10

Fig. 5 Canonical Correspondence Analysis (CCA) of foliage invertebrates and the environmental variables for all vegetation types. We, western side; No, northern side; Ea, eastern side; So, southern side; Fyn, fynbos; NR, non-riverine forest; RF, riverine forest; H, higher; L, lower; PSF, Peninsula Sandstone Fynbos; PGF, Peninsula Granite Fynbos; RecFor, Recovering forest
Species richness and abundance of aerial invertebrates, when compared per site, showed that all the fynbos sites had a higher number of species and greater abundance than any of the forest sites (Fig. 6a). The western, northern and southern fynbos sites had a higher species richness and abundance than eastern and top fynbos sites. All the forest sites were very similar in species richness and abundance, with the southern forests marginally higher than the rest.
The species richness and abundance of the foliage invertebrates was similar for all the sites, although the forest sites were slightly more species rich and had a slightly higher abundance (Fig. 6b). The sites with the highest species richness and abundance were the southern forests, and the lowest were the southern fynbos sites. Only five individual European wasps were found during the course of this study. They were found in the EaFyn (2), SoFyn, EaRF and SoHRF, thus found in both forests and fynbos on the south and east sides of Table Mountain only.
11

Fig. 6 Mean number of species (grey bars) and abundance (open bars) per site for aerial (a) and foliage (b) invertebrates. Mean (±1 SE), different letters above bars represent significantly different means (5% level)
SeasonalvariationAerial invertebrates were most species rich and abundant from spring through to summer, and lowest in autumn (Fig. 7a). In contrast, the aerial forest invertebrates peaked in both species richness and abundance in spring, declined in summer and more so in autumn (Fig. 7b).
There were no significant pairwise differences in the foliage invertebrates between the various seasons for neither species richness nor abundance (Fig. 7c). The foliage invertebrates in forests with exception of spring, showed no significant differences in species richness or abundance (Fig. 7d). The seasons appeared not to follow any particular pattern for species richness and abundance, although summer abundance and species richness was relatively high in both years.
12

Fig. 7 Mean number of species (solid line) and abundance (dashed line) per season for aerial invertebrates in fynbos sites (a) and forest sites (b), and foliage invertebrates in fynbos sites (c) and forest sites (d). Mean (±1 SE), different letters above bars represent significantly different means (5% level)
Discussion
SpeciesrichnessandturnovercomparisonsbetweenforestsandfynbosAs none of the species accumulation curves reached an asymptote, the species estimates given here are an underestimate of the true value, despite a year and a half of intensive sampling. For all the aerial species estimators, the fynbos sites were consistently more species rich and had higher abundance than the forest sites. Furthermore, the forest sites were also very different in species composition (Fig. 2). This greater species richness of the fynbos did appear to be a result of greater beta‐diversity, as both fynbos and forest sites were equally spaced out on the ordination graph.
On the other hand, the species estimators for the foliage invertebrates showed that there was slightly greater invertebrate foliage species richness in the forests than in the fynbos. The beta‐diversities of both the fynbos and forest foliage invertebrates were similar, although very separate from each other (Fig. 5).
13

FactorsinfluencingfoliageandaerialbiodiversityThe species composition of the aerial invertebrates was strongly influenced by vegetation structure (fynbos or forest). It is unclear why the fynbos sites differed so much, and it maybe that other variables not investigated here may be involved. As most of the flying insects are pollinators, predators or parasitoids, the available resources for these insects such as nectar and available prey or hosts would greatly influence the composition of the these species, and may be responsible for the differences recorded here. Nevertheless, aspect appeared to play a role, with the cold and wet eastern and southern sites grouping together.
Species richness and abundance was influenced by the fynbos type and elevation. The northern and southern sides of the mountain had the highest overall species richness and abundance, and are both Peninsula Sandstone Fynbos. The western and eastern sites on Peninsula Granite Fynbos had lowest species richness and abundance, particularly when compared to sides of the mountain with similar climates. The sites on top of Table Mountain had the lowest overall species richness and abundance for all fynbos sites, suggesting that elevation is a significant factor.
Species composition in the forest sites was strongly influenced by elevation and, to a lesser degree, by aspect. The southern forests, for example, had slightly higher species richness and abundance than the eastern forests.
Foliage species composition was strongly influenced by the proximity of the forest to a river, by elevation and by the presence of the invasive Argentine ant. This ant is known to invade new habitats through water courses and roads (De Kock and Giliomee 1989; Human et al. 1998) and can displace local ant species (Human and Gordon 1999). Thus, the result of both the presence of this invasive ant and the proximity of forest sites to a water course is likely to be related.
Elevation strongly influenced the species composition of foliage invertebrates. Interestingly, the species richness and abundance increased with elevation for both fynbos and forest. This is in contrast to the epigaeic invertebrates in Pryke and Samways (2008), and the aerial invertebrates here, which decreased in species richness and abundance with increasing elevation.
The low numbers of the wasp V. germanica found during this study may be a result of the slow decline of this invasive from the Cape Peninsula (Tribe and Richardson 1994). The wasp was only found on the south and east side of the mountain, suggesting that it prefers cooler and wetter conditions. It also seems to utilise both the fynbos and forest on Table Mountain, which may be a reason why it has not spread farther into the CFR, where natural forests are scarcer.
SeasonalvariationFynbos aerial invertebrates were most abundant in summer and spring. Surprisingly few insects were flying in spring, the time of maximum flowering. Forest invertebrates peaked in species and abundance in spring and dropped in summer and, finally, to their lowest values in autumn. Foliage invertebrates varied very little throughout the year, possibly as resources are available all year.
Comparisonsindiversityofepigaeic,foliageandaerialinvertebratesThere was little to no correlation between the diversity levels of aerial insects and foliage invertebrates. They were also a poor reflection of epigaeic invertebrates (Table 3). The upshot of this is that aerial invertebrates are poor biodiversity indicators for foliage or epigaeic fauna. Although there was a significant correlation between epigaeic and foliage invertebrate biodiversity, this correlation was not very strong and was not strong enough for them to be considered absolute predictors of each other (Table 3).
Fynbos and forest sites had very different species composition, suggesting that the conservation of both types of habitat is important for maintaining overall diversity of invertebrates on the mountain. Elevation was also a major influence on species composition of epigaeic, foliage and aerial
14

invertebrates. Whichever sampling technique was used, spring and summer yielded the highest number of observed species and highest abundance.
ConclusionsandconservationmanagementrecommendationsOnly one local endemic butterfly species occurs on the peninsula, Thestor yildizae (Lycaenidae) (Picker and Samways 1996). As it was not recorded in this intensive study, there is great concern for its future.
As both fynbos and forests had high beta diversity of aerial and foliage invertebrates, it is essential to maintain as much of the remaining natural vegetation on Table Mountain as possible, especially as it is still unclear exactly which factors, environmental and biotic, are driving the huge spatial variation in fynbos invertebrates on the mountain. Certainly, it is important to maintain all the sub‐communities at all fynbos elevations and aspects.
Of concern is the low species richness and abundance of flying, but to some extent foliage, invertebrates on the eastern side of the mountain. Historically there has been afforestation on most of the eastern side of the mountain, which may account for this disparity. These results provide ample justification for the current removal of the alien tree plantations on the east side of the mountain. Hopefully, this will allow species to recolonise, as has been the case for dragonflies on top of the mountain and elsewhere in the CFR (Samways and Taylor 2004). With the invasive Argentine ant using the waterways on the mountain to invade forest and affecting forest invertebrate diversity, particularly in the eastern forests, it is essential to contain its spread. The evidence here suggests this would at best partially come about with restoration of the natural plant communities.
As was the case for epigaeic invertebrates (Pryke and Samways 2008), elevation appears to play an important role in the influencing diversity of both aerial and foliage invertebrates. That the higher elevation areas of the Cape Peninsula are well protected (Trinder‐Smith et al. 1996; Helme and Trinder‐Smith 2006) emphasises the importance that must be given to conservation at different elevations. The lower elevation areas in particular must be conserved as soon possible, both through protection of natural fragments and restoration of those formerly disturbed.
The lack of correlation in species richness, abundance and composition between aerial, foliage and epigaeic invertebrates has consequences for rapid biodiversity assessments and searches for indicators to monitor restoration of the mountain. The results here clearly suggest that it would not be sufficient to sample just one level of the habitat and assume that the others would share the same compositional biodiversity. Although epigaeic and foliage invertebrates followed relatively close spatial patterns of diversity in both fynbos and forest, there was not a close enough correlation to assume absolute similarity. Thus, although separate aerial and epigaeic‐foliage biodiversity indicators can be used to monitor biodiversity, it would be preferable to identify separate epigaeic, foliage and aerial invertebrate biodiversity indicators. Spring and summer is the time of year for sampling fynbos, and spring for forests. This would give the most robust results for rapid biodiversity assessments for epigaeic, foliage and aerial invertebrates.
Acknowledgements We thank the Table Mountain Fund (TMF) and the National Research Foundation (NRF) for financial support, South African National Parks (SANParks) and the City of Cape Town to for the use of their land, as well as Ansie Dippenaar‐ Schoeman, Charles Haddad, Lauren Spearman, Paul Brock, Carmen Boonzaaier, Henk Geertsma and Corey Bazelet for helping with the identification of various invertebrate groups. This is a Centre for Invasion Biology contribution in the case of the second author.
15

ReferencesAxmacher JC, Holtmann G, Scheuermann L, Brehm G, Muller-Hohenstein K, Fiedler K (2004) Diversity of geometrid moths (Lepidoptera: Geometridae) along an Afrotropical elevational rainforest transect. Divers Distrib 10:293–302. Benoit PLG (1951) La systématique des Trigonaloidae (Hym.) éthiopiens. Rev Zool Bot Afr 44:132–134 Chazdon RL, Colwell RK, Denslow JS, Guariguata MR (1998) Species richness of woody regeneration in primary and secondary rainforests of northeastern Costa Rica. In: Dallmeier F, Comiskey JA (eds) Forest biodiversity research, monitoring and modeling: conceptual background and old world case studies. Pathenon, Paris Cole FR, Medeiros AC, Loope LL, Zuehlke WW (1992) Effects of the Argentine ant on arthropod fauna of Hawaiian high-elevation shrubland. Ecology 73:1313–1322. Colwell RK (2006) EstimateS 8.0.0. http://viceroyeebuconnedu/EstimateS Colwell RK, Coddington JA (1994) Estimating terrestrial biodiversity through extrapolation. Philos Trans R Soc B 345:101–118. Cowling RM, Homes PM, Rebelo AG (1992) Plant diversity and endemism. In: Cowling RM (ed) The ecology of Fynbos. Nutrients, fire and diversity. Oxford University Press, Cape Town Cowling RM, Macdonald IAW, Simmons MT (1996) The Cape Peninsula, South Africa: physiographical, biological and historical background to an extraordinary hot-spot of biodiversity. Biodivers Conserv 5:527–550. De Kock AE, Giliomee JH (1989) A survey of the Argentine ant, Iridomyrmex humilis (Mayr), (Hymenoptera: Formicidae) in South Africa fynbos. J Entomol Soc S Afr 52:157–164 Dietrick EJ, Schlinger EI, Bosch RVD (1959) A new method for sampling arthropods using a suction collecting machine and modified Berlese funnel seperator. J Econ Entomol 52:1085–1091 Dobson A (2005) Monitoring global rates of biodiversity change: challenges that arise in meeting the Convention on Biological Diversity (CBD) 2010 goals. Philos Trans R Soc B 360:229–241. Donnelly D, Giliomee JH (1985) Community structure of epigaeic ants in a pine plantation and in newly burnt fynbos. J Entomol Soc S Afr 48:259–265 Gentry AH (1986) Endemism in tropical plant versus temperate plant communities. In: Soulé M (ed) Conservation biology. The science of scarcity and diversity. Sinauer Press, Sunderland, MA Goldblatt P (1997) Floristic diversity in the Cape Flora of South Africa. Biodivers Conserv 6:359–377. Helme NA, Trinder-Smith TH (2006) The endemic flora of the Cape Peninsula, South Africa. S Afr J Bot 72:205–210.
16

Henning SF, Henning GA (1989) South African red data book: butterflies, South African National Scientific Program Report No 158. Foundation for Research Development, Pretoria Hortal J, Borges PAV, Gaspar C (2006) Evaluating the performance of species richness estimators: sensitivity to sample grain size. J Anim Ecol 75:274–287. Human KG, Gordon DM (1996) Exploitation and interference competition between the invasive Argentine ant, Linepithema humile, and native ant species. Oecologia 105:405–412. Human KG, Gordon DM (1997) Effects of Argentine ants on invertebrate biodiversity in northern California. Conserv Biol 11:1242–1248. Human KG, Gordon DM (1999) Behavioral interactions of the invasive Argentine ant with native ant species. Insect Soc 46:159–163. Human KG, Weiss S, Weiss A, Sandler B, Gordon DM (1998) Effects of abiotic factors on the distribution and activity of the invasive Argentine ant (Hymenoptera: Formicidae). Environ Entomol 27:822–833 Hyvarinen E, Kouki J, Martikainen P (2006) A comparison of three trapping methods used to survey forest-dwelling Coleoptera. Eur J Entomol 103:397–407 Johnson SD (1996) Pollination, adaptation and speciation models in the Cape flora of South Africa. Taxon 45:59–66. Kearns CA, Inouye DW, Waser NM (1998) Endangered mutualisms: the conservation of plant-pollinator interactions. Annu Rev Ecol Syst 29:83–112. Legendre P, Legendre L (1998) Numerical ecology: developing in environmental modelling 20. Elsevier, Amsterdam Lomolino MV (2001) Elevation gradients of species-density: historical and prospective views. Glob Ecol Biogeogr 10:3–13. Manly BFJ (1990) Randomization and Monte Carlo methods in biology. Chapman and Hall, London McCoy ED (1990) The distribution of insects along elevational gradients. Oikos 58:313–322. Mittermeier RA, Gil PR, Hoffmann M, Pilgrim J, Brooks T, Mittermeier CG, Lamoreux J, Da Fonseca GAB (2004) Hotspots revisited. Cemex, Mexico City Novotny V, Basset Y (2000) Rare species in communities of tropical insect herbivores: pondering the mystery of singletons. Oikos 89:564–572. Olson DM (1994) The distribution of leaf-litter invertebrates along a neotropical altitudinal gradient. J Trop Ecol 10:129–150 Palmer MW (1993) Putting things in even better order—the advantages of Canonical correspondence-analysis. Ecology 74:2215–2230. Picker MD, Samways MJ (1996) Faunal diversity and endemicity of the Cape Peninsula, South Africa—a first assessment. Biodivers Conserv 5:591–606.
17

Pryke JS, Samways MJ (2008) Ecology and conservation management of epigaeic invertebrates of an iconic mountain in the Cape Floristic Region. In Preparation Quinlan J (1979) A revisionary classification of the Cynipoidea (Hymenoptera) of the Ethiopean zoogeographical region. Aspicerinae (Figitidae) and Oberthuerellinae (Liopteridae). Bull Br Mus Nat Hist (Entomol) 39:85–133 Ratsirarson H, Robertson HG, Picker MD, van Noort S (2002) Indigenous forests versus exotic eucalypt and pine plantations: a comparison of leaf-litter invertebrate communities. Afr Entomol 10:93–99 Richmond CA, Graham HM (1969) Two methods of operating a vacuum sampler to sample populations of the cotton fleahopper on wild hosts. J Econ Entomol 62:525–526 Rohr JR, Mahan CG, Kim KC (2007) Developing a monitoring program for invertebrates: guidelines and a case study. Conserv Biol 21:422–433. Romero-Alcaraz E, Avila JM (2000) Effect of elevation and type of habitat on the abundance and diversity of Scarabaeoid dung beetle (Scarabaeoidea) assemblages in a Mediterranean area from Southern Iberian Peninsula. Zool Stud 39:351–359 Samways MJ (2006) National red list of South African Odonata. Odonatologica 35:341–368 Samways MJ, Taylor S (2004) Impacts of invasive alien plants on Red-listed South African dragonflies (Odonata). S Afr J Sci 100:78–80 Southwood TRE, Henderson PA (2000) Ecological methods. Blackwell Science, Oxford Standen V (2000) The adequacy of collecting techniques for estimating species richness of grassland invertebrates. J Appl Ecol 37:884–893. Stevens GC (1992) The elevational gradient in altitudinal range—an extension of Rapoport latitudinal rule to altitude. Am Nat 140:893–911. Stiller M (2002) Leafhopper (Hemiptera: Cicadellidae) diversity in the fynbos biome of South Africa. Denisia 04, zugleich Kataloge des OÖ Landesmuseums. Neue Folge 179:379–400 Ter Braak CJF, Smilauer P (2002) CANOCO reference manual and user’s guide to Canoco for windows: software for canonical community ordination (version 4.5). Microcomputer Power, Ithaca, New York Ter Braak CJF, Verdonschot PFM (1995) Canonical correspondence-analysis and related multivariate methods in aquatic ecology. Aquat Sci 57:255–289. Tribe GD, Richardson DM (1994) The European was Vespula germanica (Fabricius) (Hymenoptera: Vespidae), in southern Africa and its potential distribution as predicted by ecoclimatic matching. Afr Entomol 2:1–6 Trinder-Smith TH, Lombard AT, Picker MD (1996) Reserve scenarios for the Cape Peninsula: high-, middle- and low-road options for conserving the remaining biodiversity. Biodivers Conserv 5:649–669.
18

Underwood AJ (1997) Experiments in ecology, their logical design and interpretation using analysis of variance. Cambridge University Press, Cambridge Wikars LO, Sahlin E, Ranius T (2005) A comparison of three methods to estimate species richness of saproxylic beetles (Coleoptera) in logs and high stumps of Norway spruce. Can Entomol 137:304–324 Wright MG (1993) Insect conservation in African Cape Fynbos, with special reference to endophagous insects. In: Gaston KJ, New NR, Samways MJ (eds) Perspectives on insect conservation. Intercept Limited, Andover, UK
19