conservation tillge
TRANSCRIPT

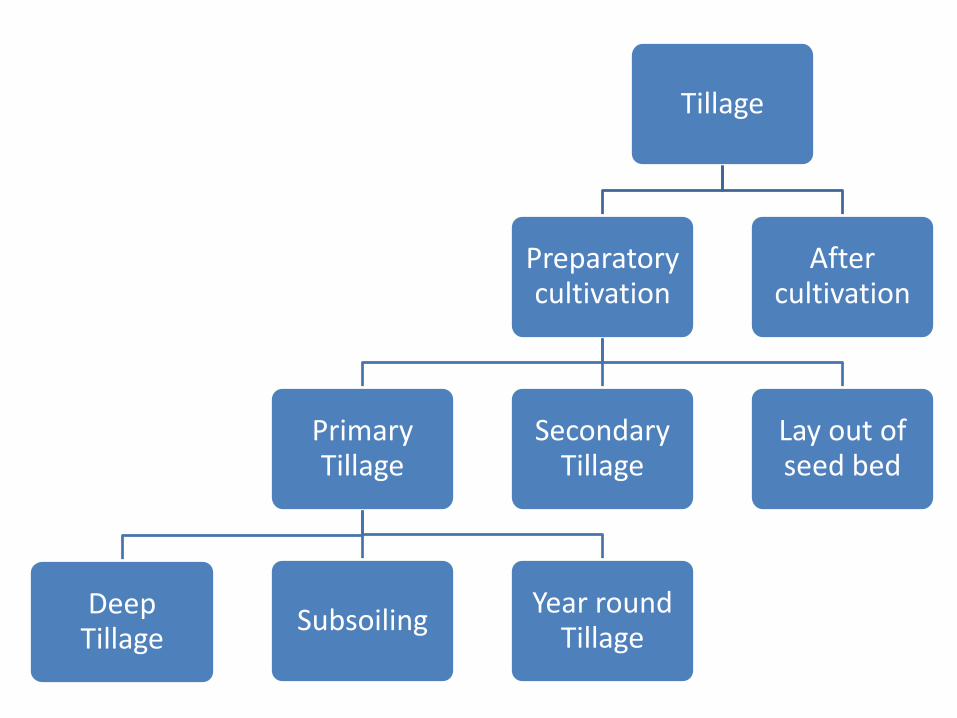
Tillage
Preparatory cultivation
Primary Tillage
Deep Tillage
SubsoilingYear round
Tillage
Secondary Tillage
Lay out of seed bed
After cultivation
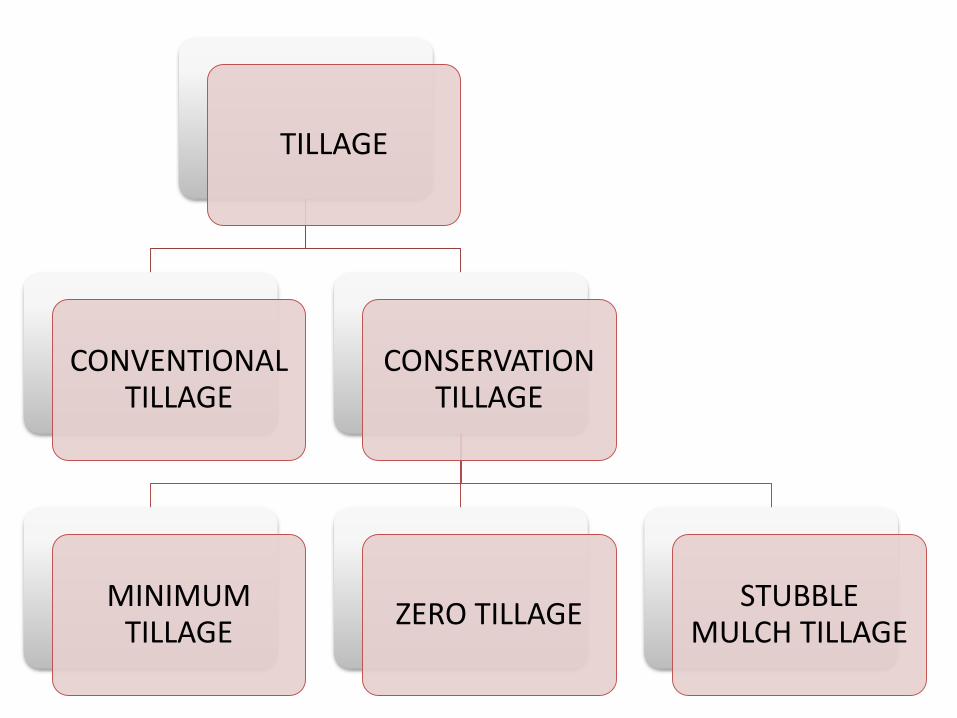
TILLAGE
CONVENTIONAL TILLAGE
CONSERVATION TILLAGE
MINIMUM TILLAGE
ZERO TILLAGESTUBBLE
MULCH TILLAGE
Why is it recommended to change from conventional Tillage to minimum tillage?
Due to repeated conventional tillage soil structure is destroyed and more soil is eroded
High cost of tillage due to Steep rise in oil
prices
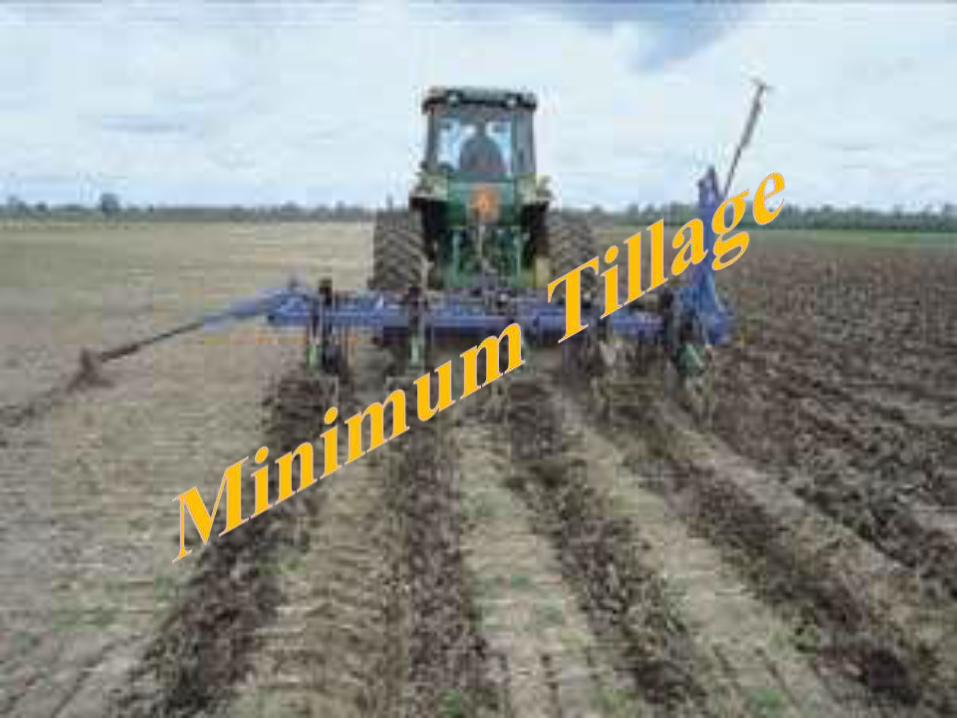
Minimum Tillage
Definition
Minimum Tillage is aimed at reducing Tillage to the
minimum necessary for ensuring a good seedbed, rapid
germination, a satisfactory stand and favourable
growing conditions
Advantages
Improved soil condition
Higher infiltration rate
Less resistance to root growth due to improved
structure
Less soil compaction
Disadvantages
Seed germination is lower with minimum tillage
In minimum tillage more Nitrogen has to be applied
Nodulation is effected in some leguminous crops like
peas and broad beans
Sowing operations are difficult with ordinary
implements
Continuous use of herbicides cause pollution problems
How tillage can be reduced
By omitting the tillage operations which do
not give much benefit when compared to
cost
By combining operations like seeding and
fertilizer application
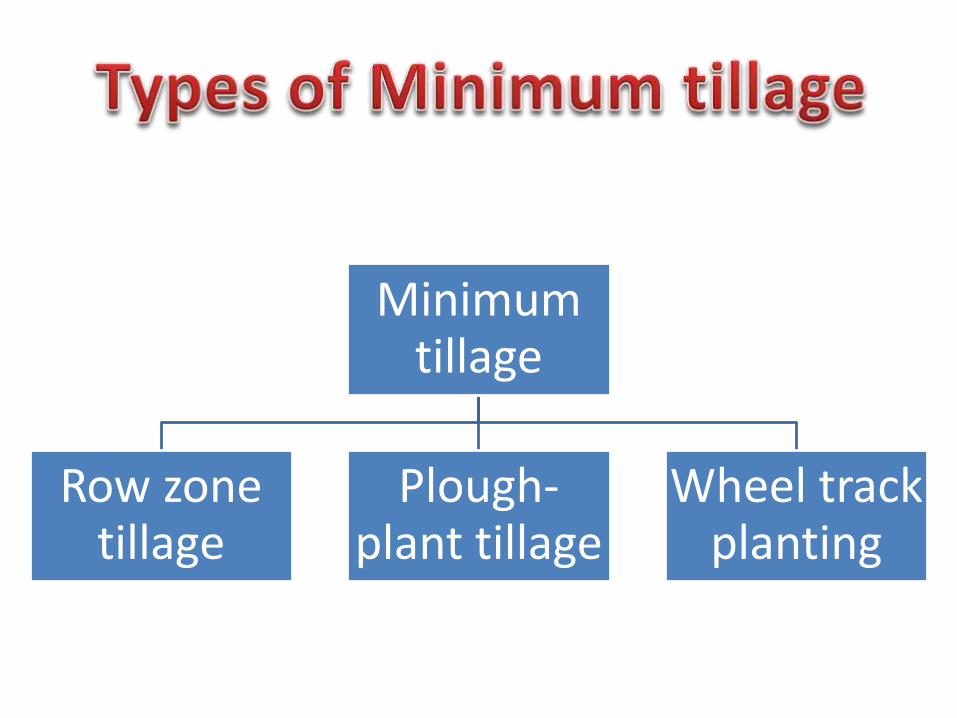
Minimum tillage
Row zone tillage
Plough-plant tillage
Wheel track planting
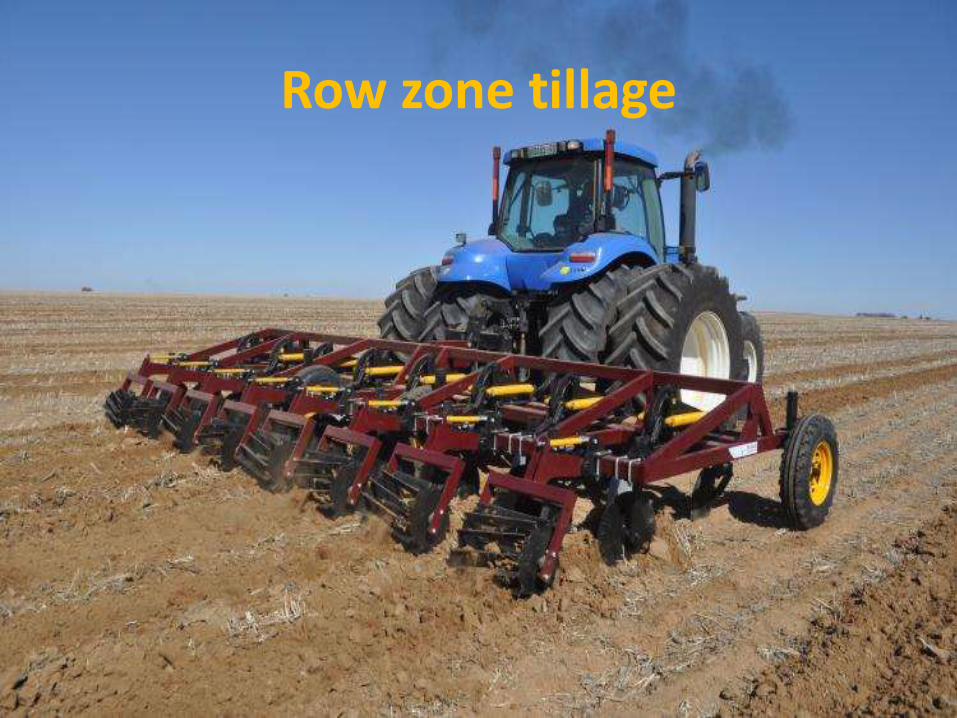
Row zone tillage
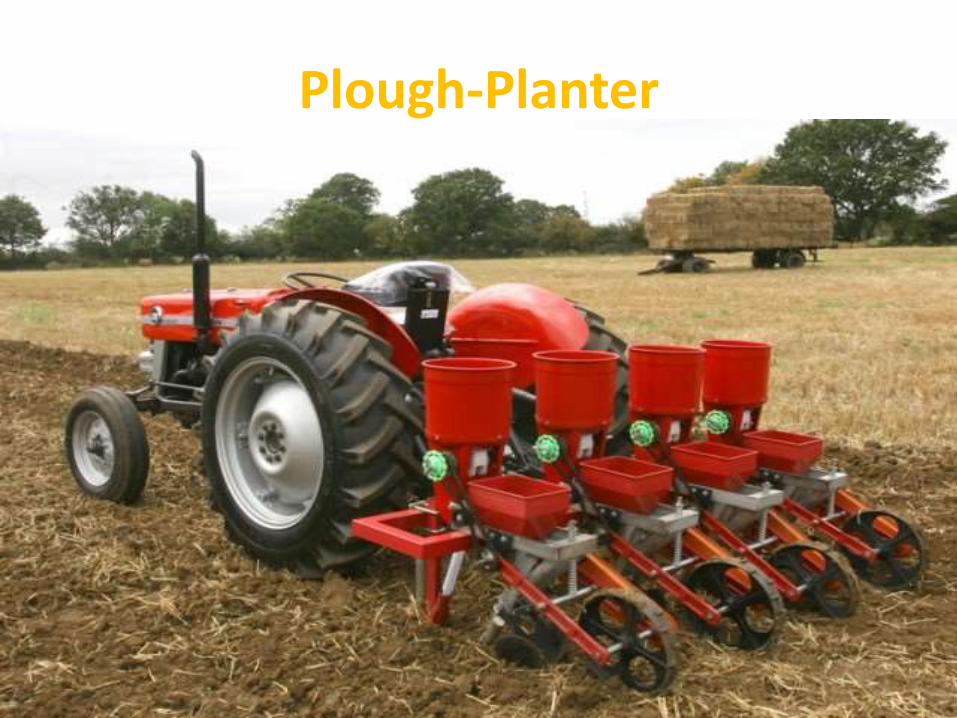
Plough-Planter
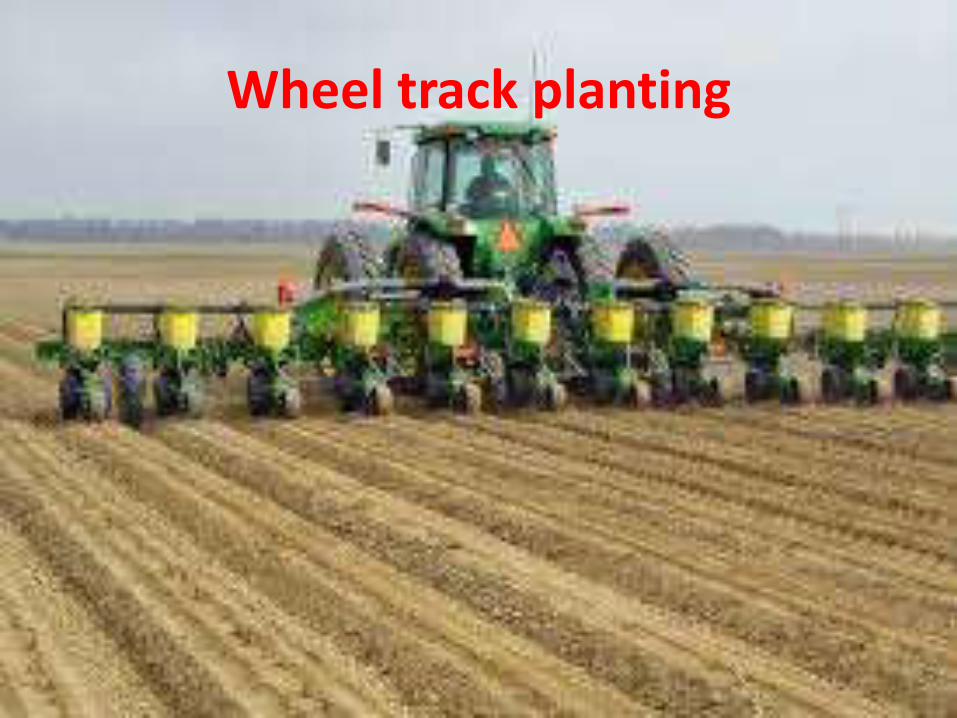
Wheel track planting
Effect of Tillage and Mulching on
Yield of Corn in the
Submontaneous Rainfed Region
of Punjab, India
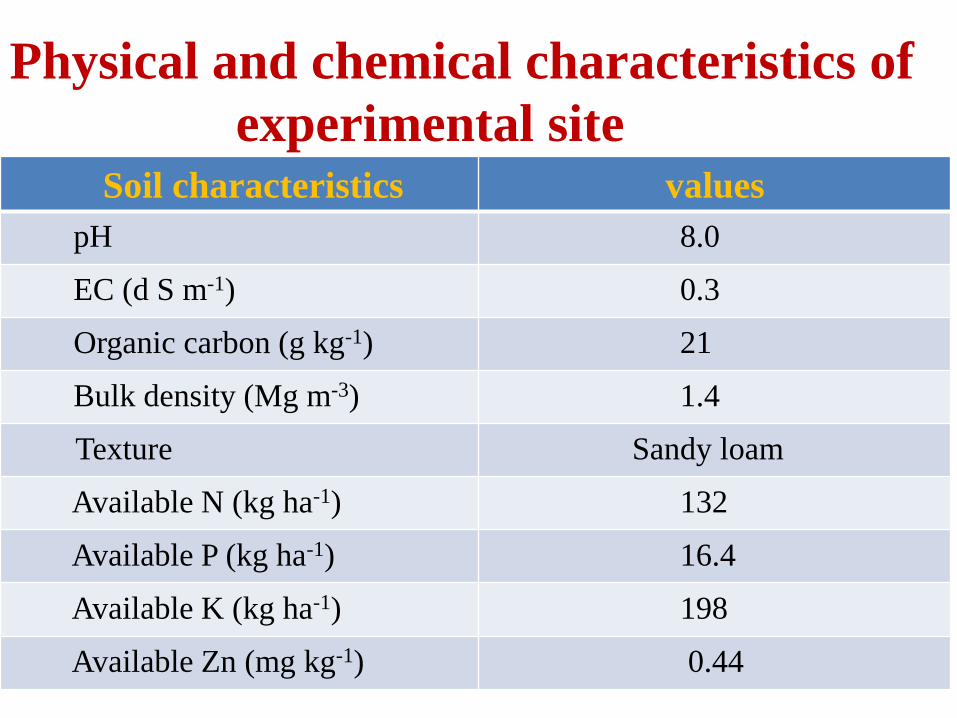
Soil characteristics values
pH 8.0
EC (d S m-1) 0.3
Organic carbon (g kg-1) 21
Bulk density (Mg m-3) 1.4
Texture Sandy loam
Available N (kg ha-1) 132
Available P (kg ha-1) 16.4
Available K (kg ha-1) 198
Available Zn (mg kg-1) 0.44
Physical and chemical characteristics of
experimental site
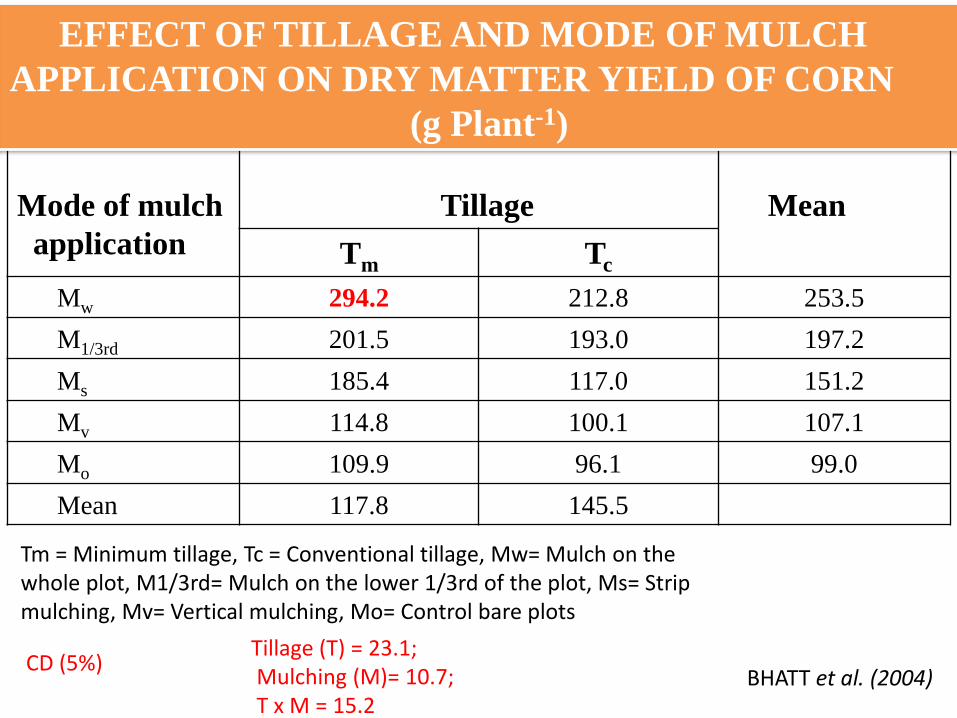
Mode of mulch
application
Tillage Mean
Tm Tc
Mw 294.2 212.8 253.5
M1/3rd 201.5 193.0 197.2
Ms 185.4 117.0 151.2
Mv 114.8 100.1 107.1
Mo 109.9 96.1 99.0
Mean 117.8 145.5
EFFECT OF TILLAGE AND MODE OF MULCH
APPLICATION ON DRY MATTER YIELD OF CORN
(g Plant-1)
Tm = Minimum tillage, Tc = Conventional tillage, Mw= Mulch on thewhole plot, M1/3rd= Mulch on the lower 1/3rd of the plot, Ms= Stripmulching, Mv= Vertical mulching, Mo= Control bare plots
BHATT et al. (2004)Tillage (T) = 23.1;Mulching (M)= 10.7;T x M = 15.2
CD (5%)
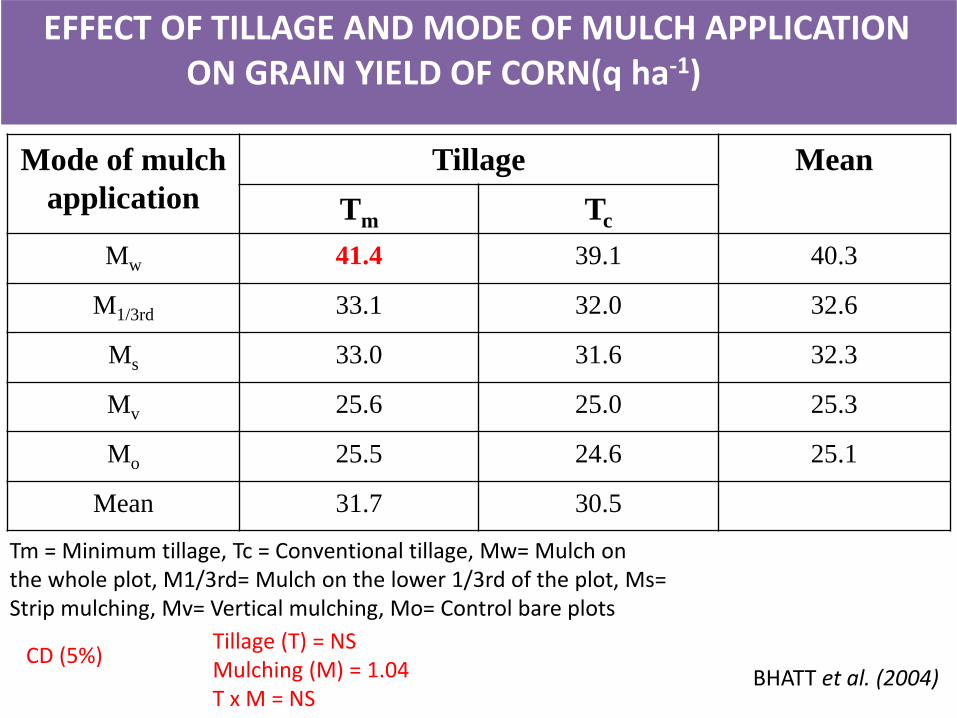
Mode of mulch
application
Tillage Mean
Tm Tc
Mw 41.4 39.1 40.3
M1/3rd 33.1 32.0 32.6
Ms 33.0 31.6 32.3
Mv 25.6 25.0 25.3
Mo 25.5 24.6 25.1
Mean 31.7 30.5
EFFECT OF TILLAGE AND MODE OF MULCH APPLICATIONON GRAIN YIELD OF CORN(q ha-1)
Tm = Minimum tillage, Tc = Conventional tillage, Mw= Mulch onthe whole plot, M1/3rd= Mulch on the lower 1/3rd of the plot, Ms=Strip mulching, Mv= Vertical mulching, Mo= Control bare plots
BHATT et al. (2004)
Tillage (T) = NS Mulching (M) = 1.04T x M = NS
CD (5%)
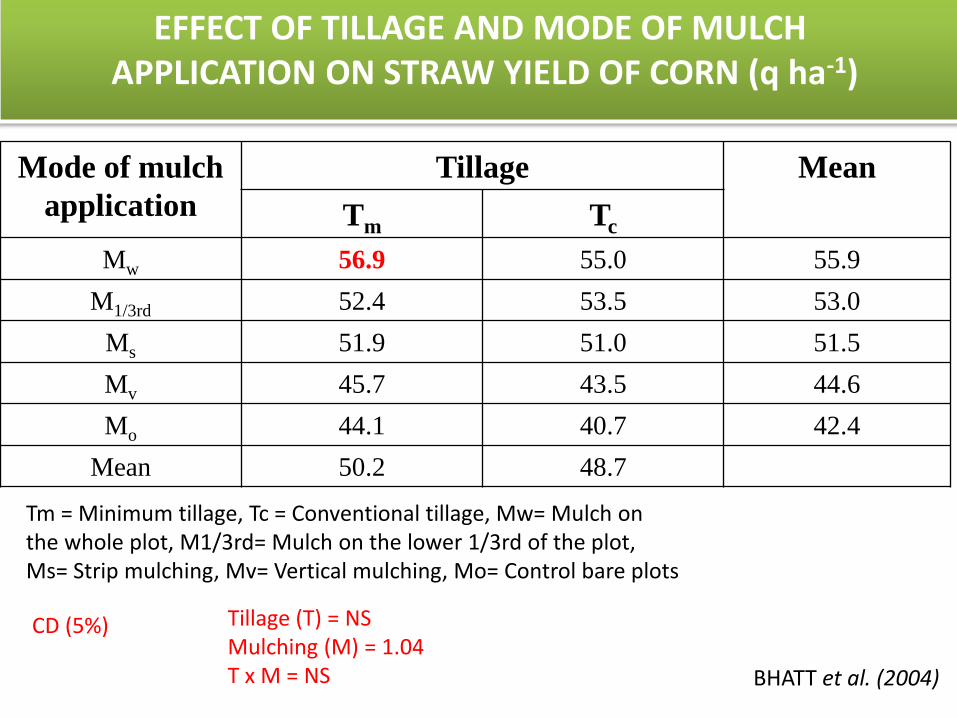
EFFECT OF TILLAGE AND MODE OF MULCHAPPLICATION ON STRAW YIELD OF CORN (q ha-1)
Mode of mulch
application
Tillage Mean
Tm Tc
Mw 56.9 55.0 55.9
M1/3rd 52.4 53.5 53.0
Ms 51.9 51.0 51.5
Mv 45.7 43.5 44.6
Mo 44.1 40.7 42.4
Mean 50.2 48.7
Tm = Minimum tillage, Tc = Conventional tillage, Mw= Mulch onthe whole plot, M1/3rd= Mulch on the lower 1/3rd of the plot,Ms= Strip mulching, Mv= Vertical mulching, Mo= Control bare plots
BHATT et al. (2004)
Tillage (T) = NSMulching (M) = 1.04T x M = NS
CD (5%)
Manjith Kumar at al. (2014)
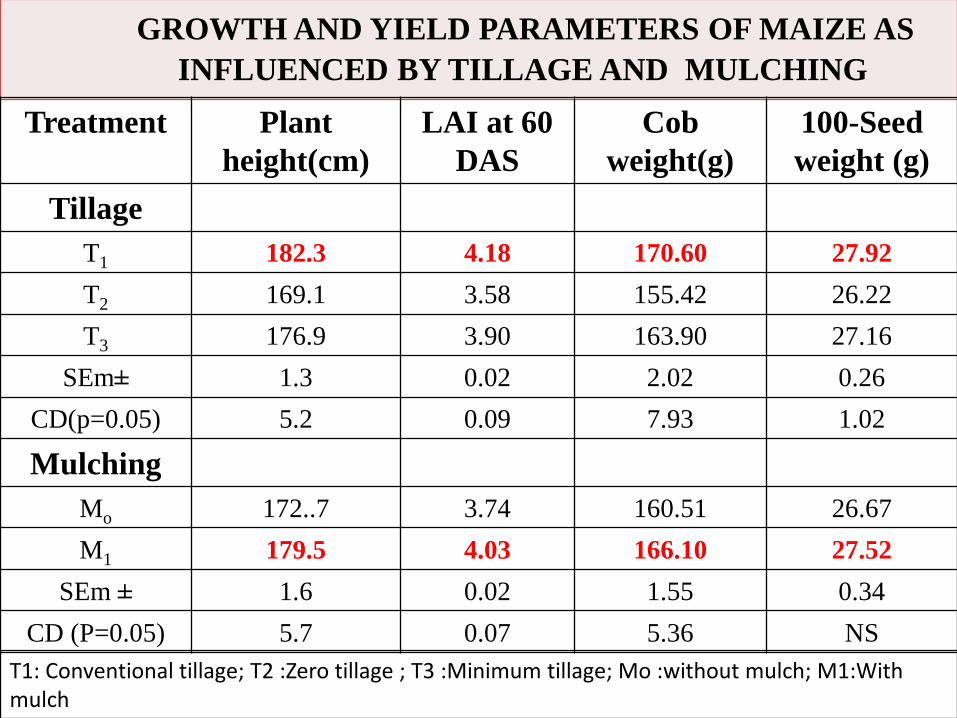
GROWTH AND YIELD PARAMETERS OF MAIZE AS
INFLUENCED BY TILLAGE AND MULCHING
Treatment Plant
height(cm)
LAI at 60
DAS
Cob
weight(g)
100-Seed
weight (g)
Tillage
T1 182.3 4.18 170.60 27.92
T2 169.1 3.58 155.42 26.22
T3 176.9 3.90 163.90 27.16
SEm± 1.3 0.02 2.02 0.26
CD(p=0.05) 5.2 0.09 7.93 1.02
Mulching
Mo 172..7 3.74 160.51 26.67
M1 179.5 4.03 166.10 27.52
SEm ± 1.6 0.02 1.55 0.34
CD (P=0.05) 5.7 0.07 5.36 NS
T1: Conventional tillage; T2 :Zero tillage ; T3 :Minimum tillage; Mo :without mulch; M1:With mulch
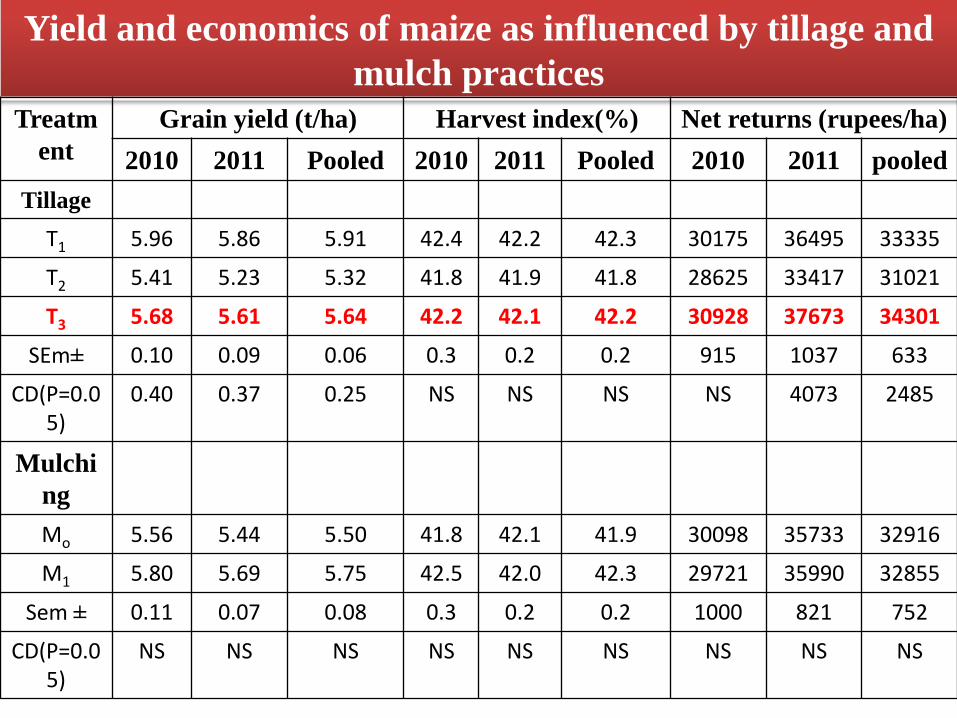
Yield and economics of maize as influenced by tillage and
mulch practices
Treatm
ent
Grain yield (t/ha) Harvest index(%) Net returns (rupees/ha)
2010 2011 Pooled 2010 2011 Pooled 2010 2011 pooled
Tillage
T1 5.96 5.86 5.91 42.4 42.2 42.3 30175 36495 33335
T2 5.41 5.23 5.32 41.8 41.9 41.8 28625 33417 31021
T3 5.68 5.61 5.64 42.2 42.1 42.2 30928 37673 34301
SEm± 0.10 0.09 0.06 0.3 0.2 0.2 915 1037 633
CD(P=0.05)
0.40 0.37 0.25 NS NS NS NS 4073 2485
Mulchi
ng
Mo 5.56 5.44 5.50 41.8 42.1 41.9 30098 35733 32916
M1 5.80 5.69 5.75 42.5 42.0 42.3 29721 35990 32855
Sem ± 0.11 0.07 0.08 0.3 0.2 0.2 1000 821 752
CD(P=0.05)
NS NS NS NS NS NS NS NS NS
Sonune et al. (2012)
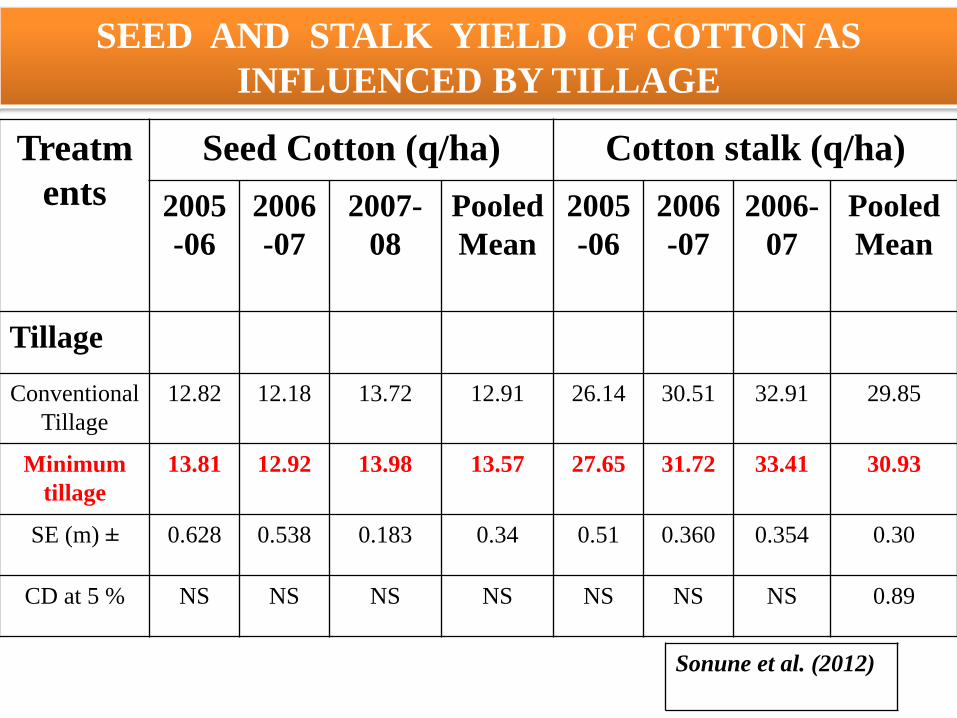
Treatm
ents
Seed Cotton (q/ha) Cotton stalk (q/ha)
2005
-06
2006
-07
2007-
08
Pooled
Mean
2005
-06
2006
-07
2006-
07
Pooled
Mean
Tillage
Conventional
Tillage
12.82 12.18 13.72 12.91 26.14 30.51 32.91 29.85
Minimum
tillage
13.81 12.92 13.98 13.57 27.65 31.72 33.41 30.93
SE (m) ± 0.628 0.538 0.183 0.34 0.51 0.360 0.354 0.30
CD at 5 % NS NS NS NS NS NS NS 0.89
SEED AND STALK YIELD OF COTTON AS
INFLUENCED BY TILLAGE
Sonune et al. (2012)
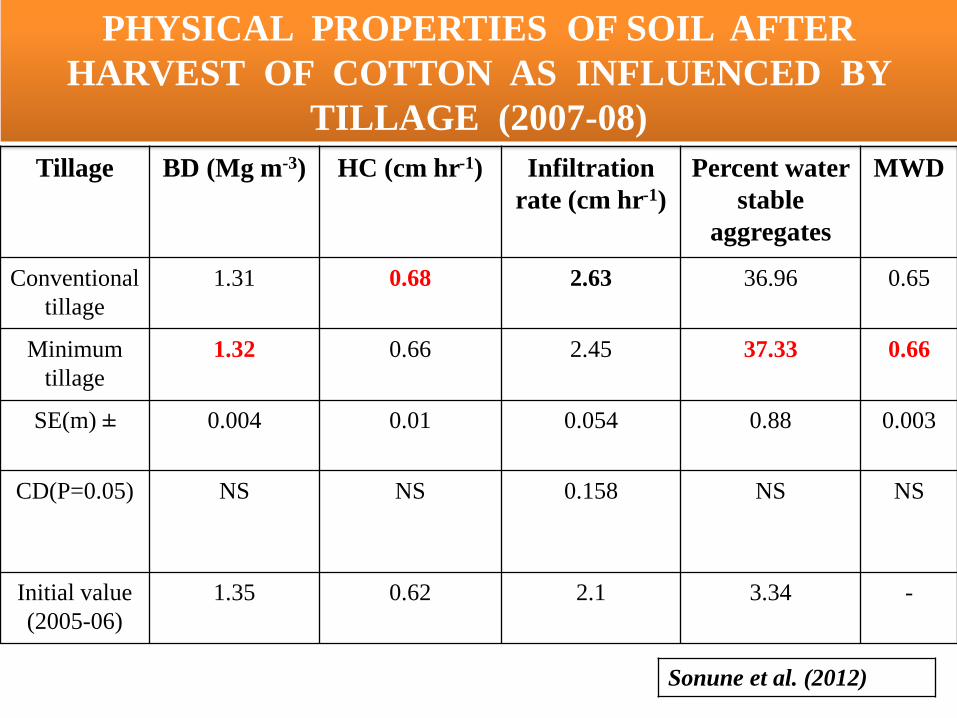
PHYSICAL PROPERTIES OF SOIL AFTER
HARVEST OF COTTON AS INFLUENCED BY
TILLAGE (2007-08)
Tillage BD (Mg m-3) HC (cm hr-1) Infiltration
rate (cm hr-1)
Percent water
stable
aggregates
MWD
Conventional
tillage
1.31 0.68 2.63 36.96 0.65
Minimum
tillage
1.32 0.66 2.45 37.33 0.66
SE(m) ± 0.004 0.01 0.054 0.88 0.003
CD(P=0.05) NS NS 0.158 NS NS
Initial value
(2005-06)
1.35 0.62 2.1 3.34 -
Sonune et al. (2012)
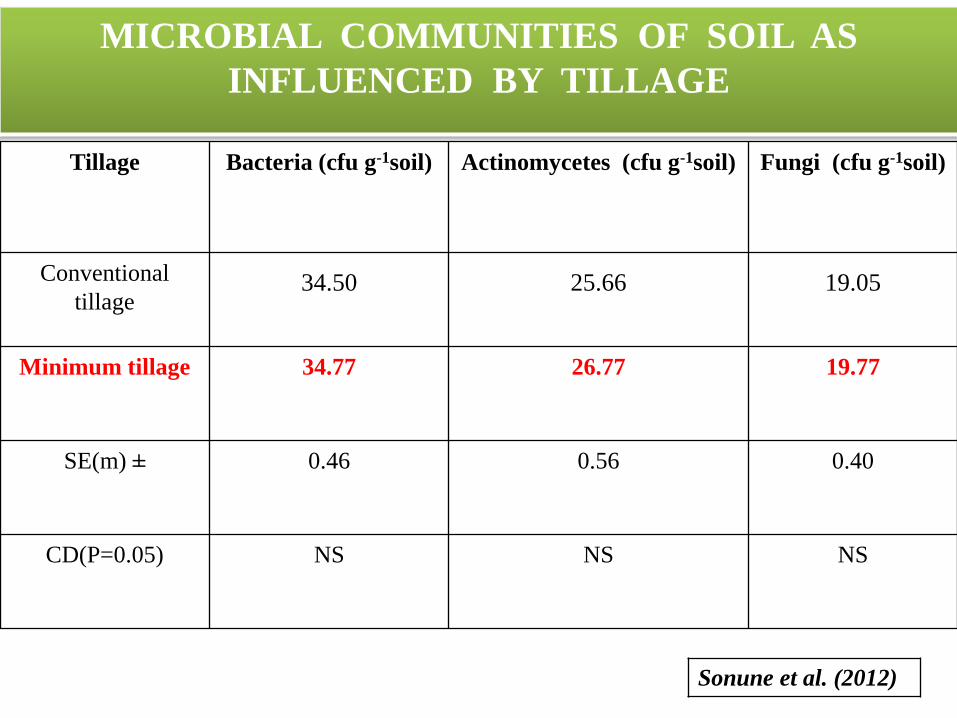
MICROBIAL COMMUNITIES OF SOIL AS
INFLUENCED BY TILLAGE
Tillage Bacteria (cfu g-1soil) Actinomycetes (cfu g-1soil) Fungi (cfu g-1soil)
Conventional
tillage34.50 25.66 19.05
Minimum tillage 34.77 26.77 19.77
SE(m) ± 0.46 0.56 0.40
CD(P=0.05) NS NS NS
Sonune et al. (2012)
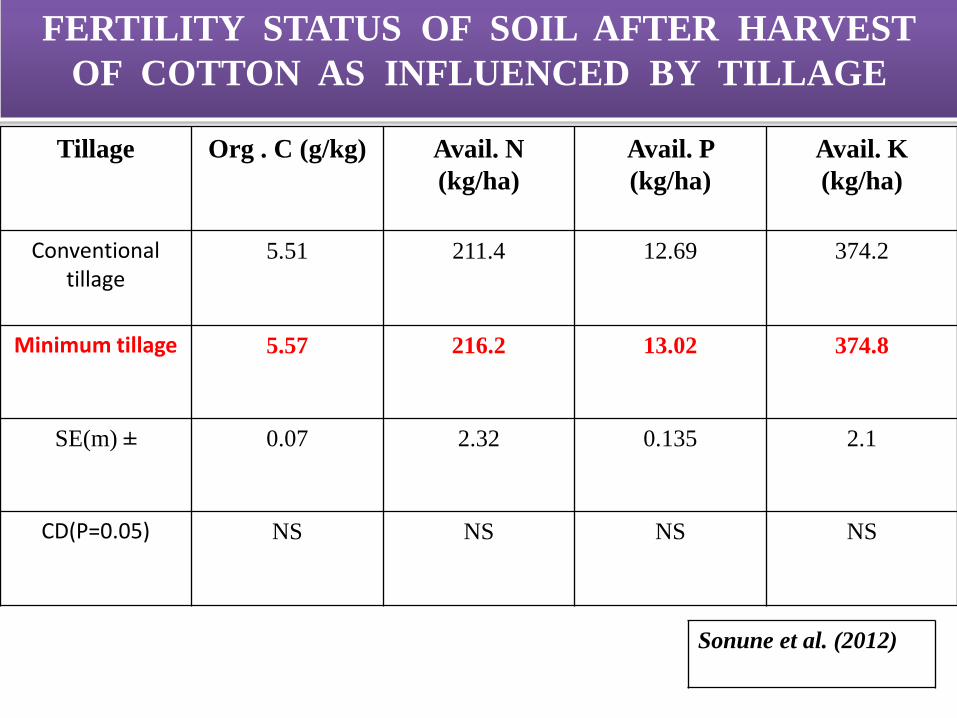
FERTILITY STATUS OF SOIL AFTER HARVEST
OF COTTON AS INFLUENCED BY TILLAGE
Tillage Org . C (g/kg) Avail. N
(kg/ha)
Avail. P
(kg/ha)
Avail. K
(kg/ha)
Conventionaltillage
5.51 211.4 12.69 374.2
Minimum tillage 5.57 216.2 13.02 374.8
SE(m) ± 0.07 2.32 0.135 2.1
CD(P=0.05) NS NS NS NS
Sonune et al. (2012)
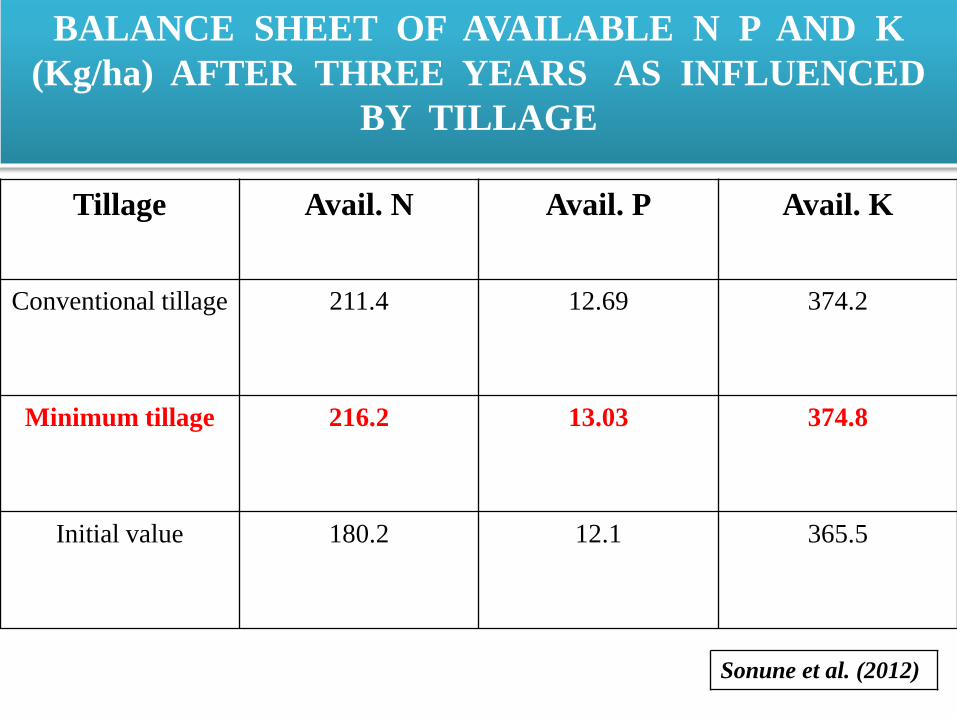
Tillage Avail. N Avail. P Avail. K
Conventional tillage 211.4 12.69 374.2
Minimum tillage 216.2 13.03 374.8
Initial value 180.2 12.1 365.5
BALANCE SHEET OF AVAILABLE N P AND K
(Kg/ha) AFTER THREE YEARS AS INFLUENCED
BY TILLAGE
Sonune et al. (2012)
DEFINITON
It is year round system of
managing plant residue with
implements that undercut
residue, loosen the soil and kill
weeds
Advantages:
Moisture conservation
Control of soil erosion
water holding capacity of soil
increases
Availability of nutrients increases
Good aeration
Disadvantages
residues left on the surface interfere
with seed bed preparation and sowing
operation
traditional tillage implements are
not suitable under these situations
this is practiced in developed
countries where agriculture is highly
mechanised
HUANG et al. (2012)
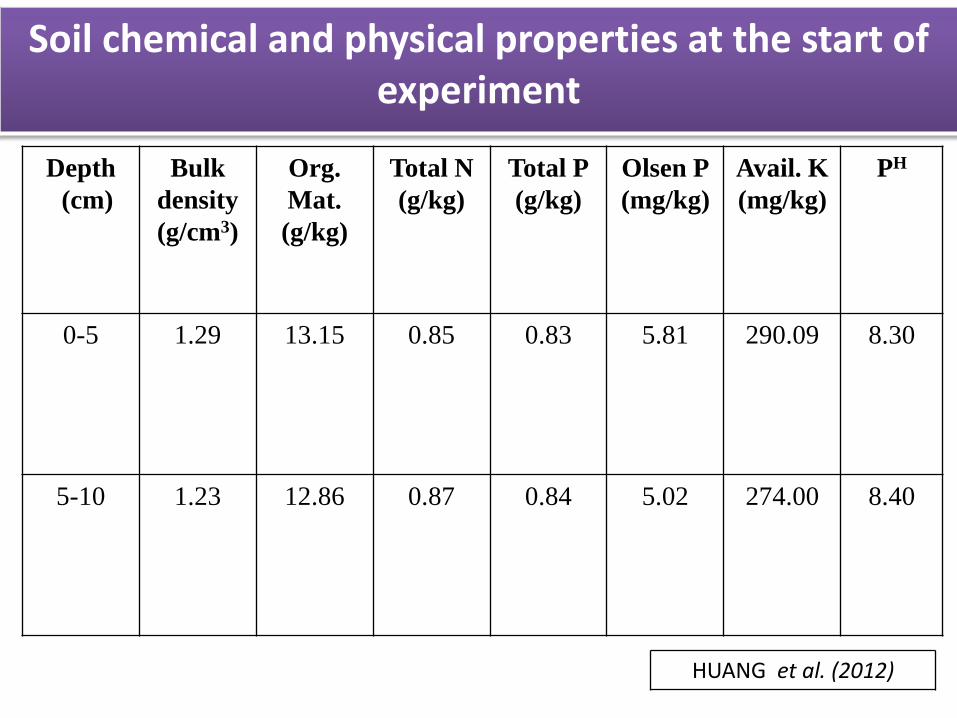
Soil chemical and physical properties at the start of experiment
Depth
(cm)
Bulk
density
(g/cm3)
Org.
Mat.
(g/kg)
Total N
(g/kg)
Total P
(g/kg)
Olsen P
(mg/kg)
Avail. K
(mg/kg)
PH
0-5 1.29 13.15 0.85 0.83 5.81 290.09 8.30
5-10 1.23 12.86 0.87 0.84 5.02 274.00 8.40
HUANG et al. (2012)
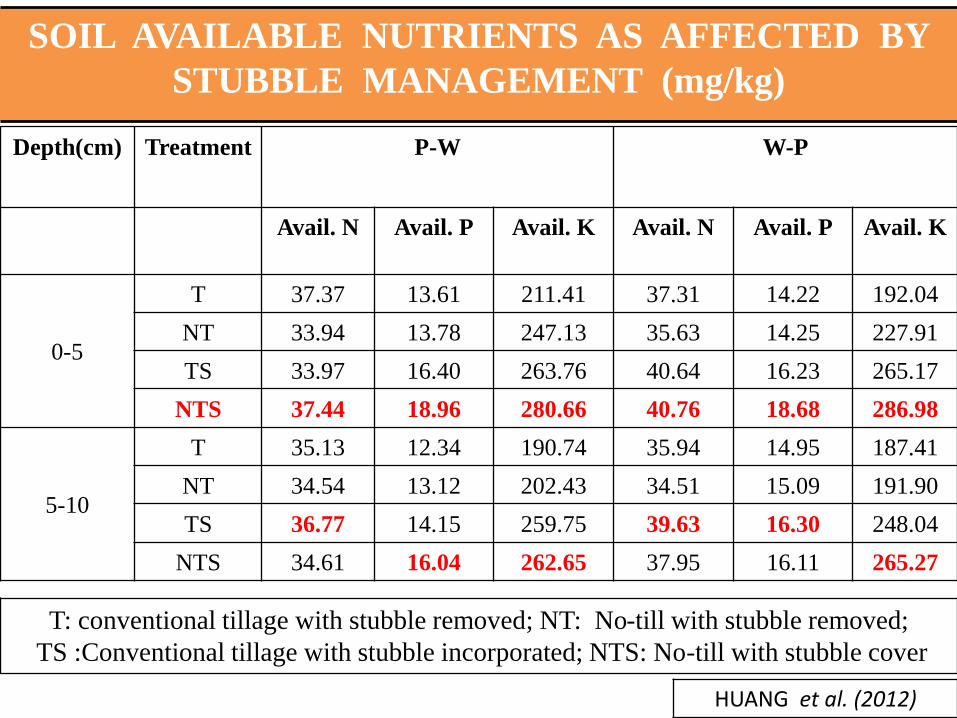
SOIL AVAILABLE NUTRIENTS AS AFFECTED BY
STUBBLE MANAGEMENT (mg/kg)
Depth(cm) Treatment P-W W-P
Avail. N Avail. P Avail. K Avail. N Avail. P Avail. K
0-5
T 37.37 13.61 211.41 37.31 14.22 192.04
NT 33.94 13.78 247.13 35.63 14.25 227.91
TS 33.97 16.40 263.76 40.64 16.23 265.17
NTS 37.44 18.96 280.66 40.76 18.68 286.98
5-10
T 35.13 12.34 190.74 35.94 14.95 187.41
NT 34.54 13.12 202.43 34.51 15.09 191.90
TS 36.77 14.15 259.75 39.63 16.30 248.04
NTS 34.61 16.04 262.65 37.95 16.11 265.27
T: conventional tillage with stubble removed; NT: No-till with stubble removed;
TS :Conventional tillage with stubble incorporated; NTS: No-till with stubble cover
HUANG et al. (2012)
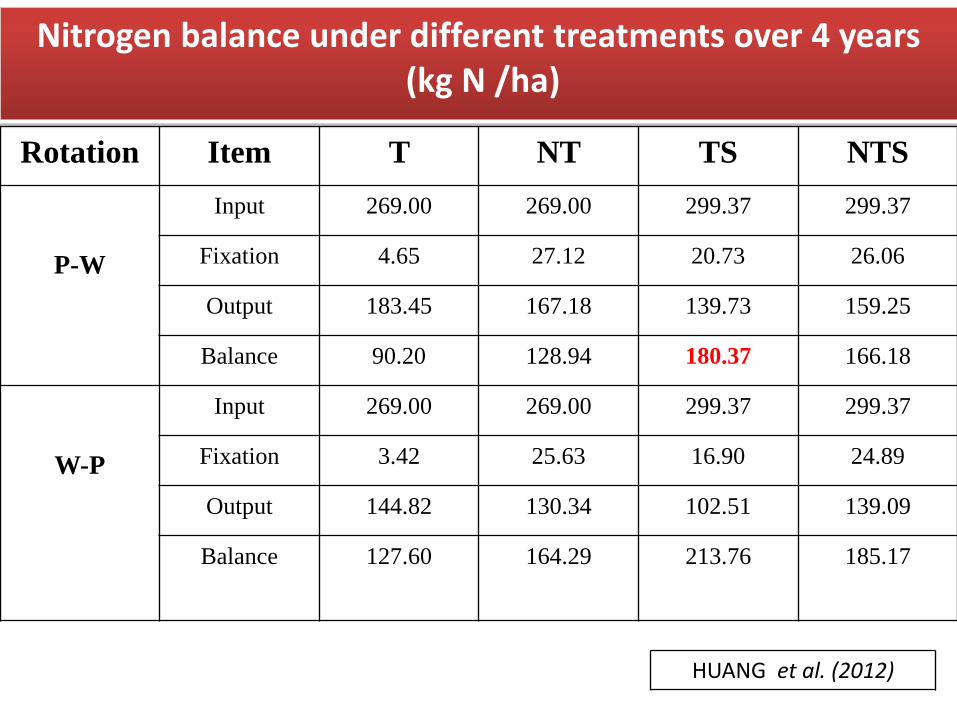
Nitrogen balance under different treatments over 4 years(kg N /ha)
Rotation Item T NT TS NTS
P-W
Input 269.00 269.00 299.37 299.37
Fixation 4.65 27.12 20.73 26.06
Output 183.45 167.18 139.73 159.25
Balance 90.20 128.94 180.37 166.18
W-P
Input 269.00 269.00 299.37 299.37
Fixation 3.42 25.63 16.90 24.89
Output 144.82 130.34 102.51 139.09
Balance 127.60 164.29 213.76 185.17
HUANG et al. (2012)
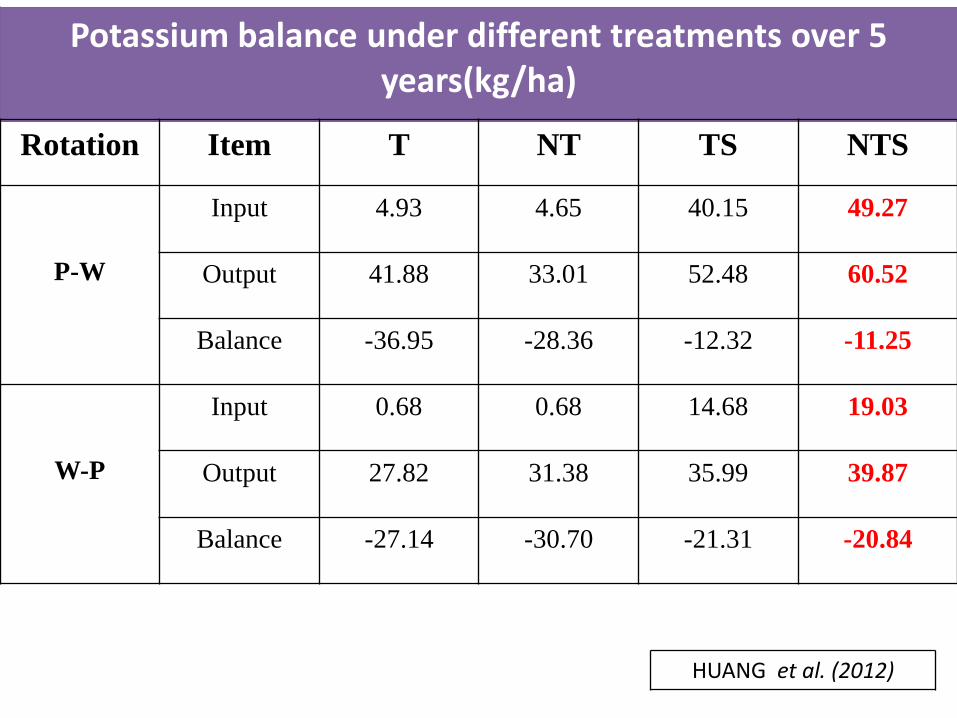
Potassium balance under different treatments over 5 years(kg/ha)
Rotation Item T NT TS NTS
P-W
Input 4.93 4.65 40.15 49.27
Output 41.88 33.01 52.48 60.52
Balance -36.95 -28.36 -12.32 -11.25
W-P
Input 0.68 0.68 14.68 19.03
Output 27.82 31.38 35.99 39.87
Balance -27.14 -30.70 -21.31 -20.84
HUANG et al. (2012)
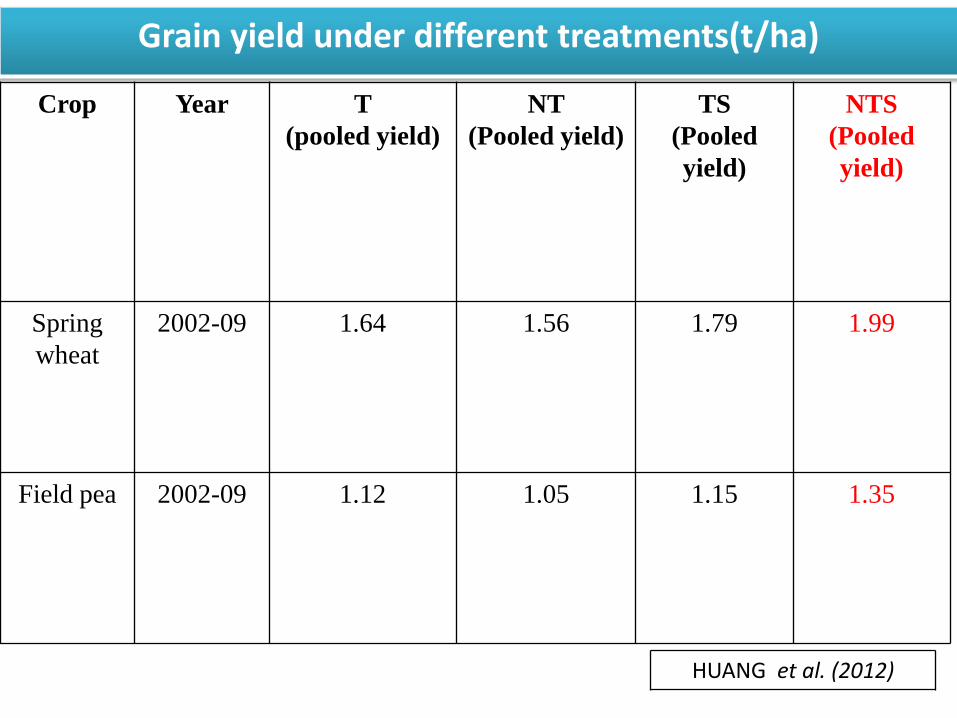
Grain yield under different treatments(t/ha)
Crop Year T
(pooled yield)
NT
(Pooled yield)
TS
(Pooled
yield)
NTS
(Pooled
yield)
Spring
wheat
2002-09 1.64 1.56 1.79 1.99
Field pea 2002-09 1.12 1.05 1.15 1.35
HUANG et al. (2012)