consideration of human behavior in...
TRANSCRIPT
CONSIDERATION OF HUMAN BEHAVIOR IN DESIGNINGA GREEN OFFICE SPACE FOR ENVIRONMENTALISTS
SPATIAL EFFICIENCY - ENERGY EFFICIENCY
Yasaman Haji EsmailiUniversity of Arizona
College of Architecture and Landscape ArchitectureSpring 2011
CONSIDERATION OF HUMAN BEHAVIOR IN DESIGNING A GREEN OFFICE SPACE FOR ENVIRONMENTALISTS
A SIMULATION STUDY
By: Yasaman Haji Esmaili
A Master’s Report Submitted to the Faculty of the Department of ArchitectureIn Partial Fulfillment of the Requirements For the Degree of Master of Architecture
in the Graduate College of The University of Arizona
University of ArizonaCollege of Architecture and Landscape Architecture
Summer 2011
01
TABLE OF CONTENT
1.0. ABSTRACT2.0. INTRODUCTION3.0. RELATED STUDIES
3.1. EFFECTIVE FACTORS 4.0. METHODOLOGY
4.1. STEPS OF THE METHODOLOGY4.1.2. POST OCCUPANCY EVALUATION4.1.2. POST OCCUPANCY EVALUATION4.1.3. BEHAVIORAL SIMULATION
4.2. THE QUESTIONNAIRE 5.0. OBSERVATION RESULTS AND BEHAVIORAL SIMULATION
5.1. TASK PERFORMANCE6.1.1. LOW TEMPERATURE IN THE HOT DESERT6.1.2. AVOIDING OR CHOOSING STAIRS OVER ELEVATORS6.1.3. EXCESSIVE ARTIFICIAL LIGHTING AND GLARE6.1.4. NOISY WORKSPACE6.1.5. LACK OF SPACE
5.2. WAY FINDING6.2.1. FINDING STAIRS AND ELEVATORS6.2.2. FINDING RECYCLES BINS6.2.3. FINDING THERMOSTATS AND LIGHT SWITCHES
5.3. SOCIAL TERRITORIALITY5.3.1. LACK OF COMMUNAL SPACE5.3.2. SHARED AND RANKED OFFICE SPACES5.3.3. FULL HEIGHT OPENINGS
5.4. CULTURAL EXPRESSION5.4.1. RIDING A BIKE OR WALKING TO WORK, USING THE STAIRS5.4.2. PERSONALIZATION OF WORKSPACE5.4.3. HAVING PLANTS5.4.4. VIEW OF MOUNTAINS5.4.5. THEMATIC EXPRESSION
5.5. VISUAL NON VISUAL AESTHETICS5.5.1. SENSE OF OPENNESS, 5.5.2. LACK OF NATURAL LIGHT AND VIEW, EXCESSIVE ARTIFICIAL LIGHTING 5.5.3. STAIRS: SUN AND THE SMOKERS5.5.4. NATURAL VENTILATION
6.0. POTENTIAL APPLICATION7.0. APPENDICES
7.1. INTERVIEW SAMPLE7.2. BIBLIOGRAPHY THANK YOU
02040709 1213131415
16
18202124293538
40414446
47485255
575859616263
6667 69 73757779828287

02
1.0. ABSTRACT
2.0. INTRODUCTION
3.0. RELATED STUDIES
4.0. METHODOLOGY
5.0. OBSERVATION RESULTS AND BEHAVIORAL SIMULATION
6.0. POTENTIAL APPLICATION
7.0. APPENDICES
8.0. BIBLIOGRAPHY

03
1.0. ABSTRACT
This research investigates how specific users’ preferences and behavior in-fluence long-term and short-term environmental performance of an office building that intends to be green and is designed for environmentalists. Here, short-term environmental performance is defined as issues that have an obvi-ous effect on the regular energy performance of the building and long-term environmental performance is described as the “Usability” of the building over time.
By looking into the existing literature some of the important issues that may be related both to energy performance and user’s behavior are recognized. These issues are used to create a questionnaire to interview some of the future users of a sample green building on University of Arizona campus which is not built yet. This building which is designed for Environmental and Natural Resourc-es Programs is dedicated to sustainable design and committed to achieving LEED[1] Platinum rating. The collected data helps the researcher simulate pos-sible behavioral patterns of the users in the new building and investigate how these behaviors can alter the selected building’s energy performance over time.
[1] Leadership in Energy Efficient Design

04
1.0. ABSTRACT
2.0. INTRODUCTION
3.0. RELATED STUDIES
4.0. METHODOLOGY
5.0. OBSERVATION RESULTS AND BEHAVIORAL SIMULATION
6.0. POTENTIAL APPLICATION
7.0. APPENDICES
8.0. BIBLIOGRAPHY

05Marshall Building, 5th floor, empty cubicles
2.0. INTRODUCTION
Today green architecture is a well known practice among most of the people who are producing architecture. Green design, should lead to environmental, economic and social sustainability. The first two goals of economic and en-vironmental sustainability are well understood; however the third goal, social sustainability, is less perceived during the design process and rarely imple-mented in the final product. This is probably because social aspects are harder to define and are often thought as “externalities” (Athens, 2009.)
The main focus of social sustainability is how individuals’ behaviors and at-titudes influence the society’s resources and economy, and if the future gen-erations will have equal access to resources as the current generation. As part of this larger stewardship of society, actual behavior in buildings can be a sig-nificant influence on resource use. Cultural backgrounds and personal beliefs lead to choices which significantly affect the sustainability of buildings and the way they are used over time. Other aspects of human behavior, which are not directed at other people, can alter more immediate aspects of the energy performance of a building. These aspects can include the way people perform their tasks, find their ways in a building, make decisions according to visual/non-visual aesthetics of a building.
As Wener and Carmalt suggest the sensitivity, or robustness, of the building in responding to user behavior can be an important dimension in determining the ability of a sustainable structure to meet its goals throughout its operational lifetime. Occupants make choices that affect buildings’ systems, such as when to maximize their personal comfort by adjusting thermostats, lowering or rais-ing blinds and drapes, and opening or closing windows (Wener & Carmalt, 2006).
These decisions, on one hand, alter the energy performance of an office build-ing by increasing its monthly and yearly energy use. On the other hand, they affect the way office buildings are occupied. Studies show, for example, that over half of individual workplaces are empty even at the busiest times of day and offices are used at most for half of their potential for only one third of their functional availability every working day (Duffy, 11). This means that even if a building which has low energy bills but is not well-occupied and doesn’t satisfy its users and their social needs, is still far from being a real sustainable building.
Figure 01. Marshall Building, Empty Cubicles
06
2.0. INTRODUCTION
Paying uneven attention to the energy performance of the superficial features of buildings, especially the ones that are easy to see, for example; double glazing, green roofs and walls, photovoltaic panels and wind mills may keeps designers away from exploring the way an office building performs as a whole and how it is used over time by its users.
There are several methods to verify if a building is environmentally responsible. Perhaps the most well known verification system is LEED (leadership in energy efficient design). LEED, which is in Duffy’s view a step by step, box-ticking methodology, is a green building rating system and a nationally accepted benchmark for the design, construction and operation of high performance green buildings. Duffy believes that these types of methodologies cannot be relied upon to stimulate strategic insights into the environmental specifications and physical features that matter most under specific circumstances. As Lucia Athens in her study of Seattle’s central library suggests, out of 69 total LEED credits only 20 credits directly benefit people and only 16 credits contain a stated intent related to the human species(Athens, 2009.) This means that LEED may underestimate the role of human behavior in the performance of green buildings and does not see the users as the center of the design.
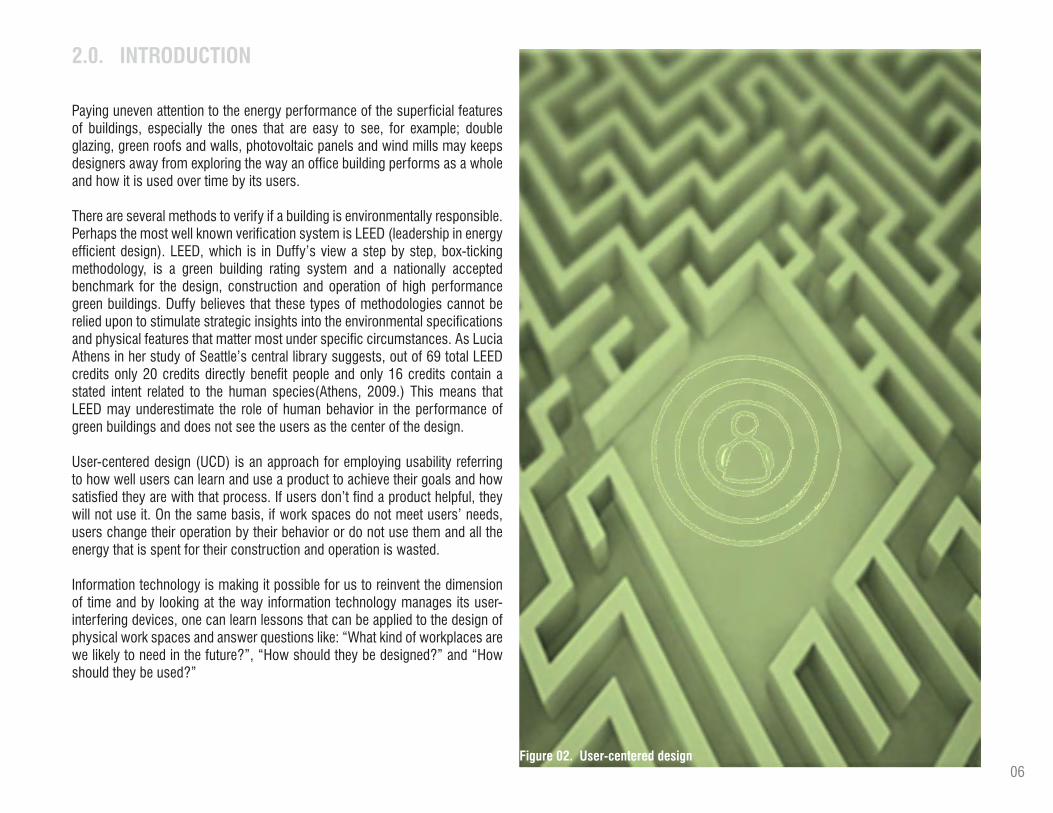
User-centered design (UCD) is an approach for employing usability referring to how well users can learn and use a product to achieve their goals and how satisfied they are with that process. If users don’t find a product helpful, they will not use it. On the same basis, if work spaces do not meet users’ needs, users change their operation by their behavior or do not use them and all the energy that is spent for their construction and operation is wasted.
Information technology is making it possible for us to reinvent the dimension of time and by looking at the way information technology manages its user-interfering devices, one can learn lessons that can be applied to the design of physical work spaces and answer questions like: “What kind of workplaces are we likely to need in the future?”, “How should they be designed?” and “How should they be used?”
Figure 02. User-centered design

07
1.0. ABSTRACT
2.0. INTRODUCTION
3.0. RELATED STUDIES
4.0. METHODOLOGY
5.0. OBSERVATION RESULTS AND BEHAVIORAL SIMULATION
6.0. POTENTIAL APPLICATION
7.0. APPENDICES
8.0. BIBLIOGRAPHY

08
3.0. RELATED STUDIES
Are buildings designed for lower environmental impacts better from the occupants’ point of view?
Based on methodology developed in the UK by Building Use Studies(BUS) and used for the Probe series of post-occupancy studies[1], green buildings are repeating past mistakes by creating unneeded and wasteful complexity, which can undermine their whole purpose. (Leaman and Bordass, 2007). Leaman and Bordass explore sources of occupant dissatisfaction, to discover whether or not green buildings are perceived as better by their users. They use oc-cupant surveys from 177 UK buildings for statistical comparisons between conventional and green buildings.
They find that most of these buildings are more sustainable in design intent, not necessarily in reality (Bordass, 2001). This happens for several reasons. It is found for example that once the building is occupied, operators and us-ers may find it difficult to understand the control systems and operate them. Therefore maintenance and energy management may not be up to standard and some control systems which irritate the occupants may be by-passed. The variables that they use to assess users’ satisfaction are: overall comfort (the variable which has the strongest association with the variable perceived productivity), temperature in summer and winter, ventilation/air in summer and winter, lighting and noise.
[1] PROBE - Post-occupancy Review of Buildings and their Engineering The Probe series of post-occupancy studies has reported individually on the performance of sixteen buildings in UK in 1999.

09
3.0. RELATED STUDIES
Gill and Tierney investigated the energy performance, as well as water con-sumption of 26 ‘low energy’ UK Eco Homes with an ‘excellent’ rating in addi-tion to comfort and satisfaction of users. Their methodology involved using a detailed post-occupancy evaluation with special focus on the performance– behavior relationship.
Results indicated that energy-efficiency behaviors account for 51%, 37%, and 11% of the variance in heat, electricity, and water consumption, respectively, between dwellings (M. Gill, 2010.) Their Case study results showed that occu-pant behavior has a significant impact on heat and electrical energy consump-tion and to a lesser extent on water consumption in this sample of low-energy dwellings. They concluded that human factor needs to be addressed more adequately as a standard practice in low-energy design.
Iwashita and Akasaka investigated the relationship between the occupants’ behavior in occupied dwellings in Kagoshima City in Japan and the energy consumption for air conditioning during the summer period. They asked the residents to complete a questionnaire survey assessing indoor environment and residents’ behavior (i.e. when they opened windows/doors, or operated air conditioners, and so on).
The results showed that there is a large difference between the ventilation rate during non-occupancy and with door/windows closed, and the ventilation rate during occupancy of the dwellings. For example they found that when occu-pants feel hot or warm, one occupant might turn on the air conditioner, while another might open windows to induce cross ventilation and as a result two similar buildings may have different energy use.
Williamson, Soebarto and Radford from University of Adelaide in Australia suggest that a building which is considered to have low energy performance, doesn’t necessarily meet its occupants’ individual aspirations and living re-quirements. In other words, regulations and standards can actually ‘fail’ peo-ples’ attempts to be more energy efficient precisely because these attempts do not align with conventions at the individual building level (Fionn, 2010.)
This means that these standards are not necessarily objective. As an example one study suggests that the desire for air-conditioned air is addictive, in other words, air-conditioning rapidly teaches the body to hate the heat. This means that the cultural as well as the technical origins of large scale conditioning of air are especially American and not a default scientific value (Gwyn, 1992.) On the contrary, as Iwashita and Akasaka suggest, most Japanese people believe that natural cooling is better for their health than air conditioning.
All these findings successfully demonstrate the relation between human be-havior and energy performance of an existing building and most of them are based on post occupancy studies. However, the main question is if it is pos-sible to find this relation when a building, (in this research an office building) is designed and not built yet. Can we predict how behavioral factors will change its energy performance after the building is occupied?
Another problem is that these studies often have a more general, less system-atic approach to users’ behavior and only include some aspects, mostly re-lated to task performance and most of them do not consider social and cultural aspects of users’ behavior.
3.1. EFFECTIVE FACTORS
To understand user’s preferences and choices, one should be able to catego-rize all theoretically different aspects of human behavior and find their relation to the physical environment. This will begin to solve the problem of open ended observations which are usually the result of common post occupancy evalua-tions. The five categories of Task Performance, Way Finding, Social Territorial-ity, Cultural Expression and Visual/non-Visual Aesthetics as defined by Dennis Doxtater, can include all kinds of things people do within the physical settings. These categories are defined as certain kinds of affordances, which within themselves “tend to experientially string together at larger scales” (Doxtater, 2008.)

10
3.0. RELATED STUDIES
“The categories of wayfinding and task performance are immediately under-standable in their function.” Way finding helps the individual maintain his or her orientation in the physical world. Task Performance involves experiences which include physical manipulation of objects and can include accommoda-tion or capacity (for example if the number of parking spaces is enough for the users), adjacency or distance (for example how far one has to walk to the elevators or stairs), physical safety (for example when stairs or railing cause people fall) and accessibility (for example steepness of entry ramps for the disabled).
Social territoriality includes concepts like privacy, personal space, human ter-ritoriality and defensible space; Cultural expression refers to shared, symbolic meanings that people attach to objects and scenes in an essentially extrinsic manner. Finally Visual and Non-Visual Aesthetics is defined as” those interest-ing moments of our sensory experiences when some intrinsic aspect of the physical setting captures our attention”(Doxtater, 2008.)
Energy related post occupancy evaluations which have tried to find out how user behavior influence short-term and long-term environmental performance of office buildings, usually focus primarily on issues like the way users interact with air conditioning, lighting and water consumption.
As identified by Leaman and Bordass, based on the PROBE series of POE studies, The main problems that cause users’ dissatisfactions and also effect energy performance of the building are high temperatures in the summer and low temperatures in winter, dryness, glare, excessive lighting, noise, unwanted interruptions, smell and unhealthy air, lack of control and finally slow response time which they name as the most important of all because people tend to be happiest in buildings where their basic needs are met relatively quickly.
On the other hand, some of the issues that improve both users’ satisfaction and energy performance of an office building, begin to expand the kinds of behavior considered, e.g. having workplaces near windows, with a view out, line of sight with immediate colleagues, place for uninterrupted work and good quality controllable natural light.
The issues identified by Leaman and Bordass are mostly related to task per-formance and immediately influence energy use of a building. By categorizing these issues and other behavioral aspects that may influence energy perfor-mance of an office building in the five mentioned behavioral categories, it is possible to map various things that people do in existing office buildings and simulate their future behavior in the ones that are not built yet. The result would be as following:
TASK PERFORMANCEIssues like the efficiency of artificial and natural lighting and glare fall in to this category. People tend to bring their own lighting and cover excessive lighting when they are not happy with what is provided resulting in higher energy bills. Other task related issues which may have similar results or may discourage the users from using their office are distracting noise, usefulness of furniture, desk area, storage space, meeting rooms, stairs and elevators, and finally tolerable temperatures in summer and winter.
WAY FINDINGIn general, feeling disoriented may usually be a problem for newcomers to a building and not for permanent users. However finding different staircases, elevators, recycle bins and thermostats is a problem for all the users and also influence energy performance of a building.
SOCIAL TERRITORIALITYIn this category, most of the issues influence the occupancy of the building. Because of problems like shared office spaces, ranked office spaces and lack of privacy, users don’t like staying in their offices for long hours and prefer to work in other spaces, like their homes, cafes or libraries. Also when users do not have much personal control over heating, cooling, ventilation, lighting and noise they feel discouraged from operating them.

11
3.0. RELATED STUDIES
CULTURAL EXPRESSIONThe image of the building is an important factor in forming users’ appreciation of it. Specific behaviors of the users ,according to their cultural background,can play an important role in the way an office building performs. Preferring the stairs or the elevators, having plants, natural light and view, the way users travel to work and how they personalize their workspace are some of the sig-nificant aspects that relate to the users’ cultural beliefs.
VISUAL AND NON VISUAL AESTHETICSUnpleasant temperature, scenes, smells and feelings in the building discourage the users from spending time in their offices. Other factors like lack of natural lighting, view, and natural ventilation directly influence energy performance of the building and also how it is occupied over time.
In addition to these question, other aspects of users’ background like age, sex, time they spend at work and at their desks, time they spend using computers, type of work they do and its requirement and their overall satisfaction of the building should also be considered in the evaluation.

12
1.0. ABSTRACT
2.0. INTRODUCTION
3.0. RELATED STUDIES
4.0. METHODOLOGY
5.0. OBSERVATION RESULTS AND BEHAVIORAL SIMULATION
6.0. POTENTIAL APPLICATION
7.0. APPENDICES
8.0. BIBLIOGRAPHY

13
4.0. METHODOLOGY
After investigating the related literature, it can be concluded that including be-havioral aspects in building’s energy studies is relatively new. Some research-ers have considered some aspects of users’ behavior in their post occupancy studies which usually do not include social and cultural aspects. Although their approaches scientifically demonstrate that human behavior is a key factor in altering energy performance of green office buildings, these findings are not usually utilized by architecture professionals and not applied to office build-ings’ designs.
Therefore, broad systematic behavioral post occupancy studies of current workplaces is broadly used in the design process of new green office build-ings. The result can help the designers avoid repeating past mistakes and can be used to assess new buildings before they are built. This Behavioral Simula-tion process is the main approach of this research which is an step towards demonstrating how behavioral issues can change the energy performance of a new green office building.
After choosing a specific group of users and a sample new building designed for them, the researcher tried to get the users feedback from their current workplaces and their expectations of the new design. The result was not used as an evaluation of the new building, as is usual, but to provide information to simulate experiences in the schematic design of the new building.
4.1. STEPS OF THE METHODOLOGY
The methodology is summarized in the following three steps:
4.1.1. CHOOSING SPECIFIC USERS AND A BUILDING WHICH IS DESIGNED FOR THEM BUT NOT BUILT YET,
The first step was to choose a sample office building which was designed but not built yet. The Environmental and Natural Resources Building at the University of Arizona (shown in green), which is now in its second design phase, was chosen. This building is designed for environmental sciences at the University of Arizona. The building aims to achieve LEED- Platinum rating. The projected Budget for the building is $68,000,000 and the gross square footage of the building is 128000 sq.ft.
The first step was to choose a sample green office building whichwas designed but not built yet. The Environmental and NaturalResources Building at the University of Arizona which is now in itssecond design phase was chosen. This building is designed forenvironmental sciences and four different environmental programsincluding :
Institute of the Environment (IE),School of Geography and Development (SGD),School of Natural Resources and the Environment (SNRE) andOffice of Arid Lands Studies
will be placed in this building. The building aims to achieve LEED-Platinum rating. The projected Budget for the building is$68,000,000 and the gross square fit of the building is128000 sq.ft.
3.0. METHODOLOGY
Figure 03. The Environmental and Natural Resources Building, University of Arizona

14
4.0. METHODOLOGY
4.1.2. POST OCCUPANCY EVALUATION
The next step was to collect data about the behavior of the future users of the building. This was achieved based on interviewing the future users of this building from four different environmental programs on campus and the re-searcher’s role as an observer of Users’ behavior.. These programs are:
Institute of the Environment (IE), School of Geography and Development (SGD), School of Natural Resources and the Environment (SNRE) and Office of Arid Lands Studies
Twenty six users including six professors, six staff members, eight graduate students and eight researchers, working in Harvill building (Figure 04), Mar-shall building (Figure 05) and Campus Christian Center (Figure 06), were in-terviewed, each for about thirty minutes (Figure 07) and the interviews’ result was used for a systematic behavioral post occupancy evaluation.
Half of the interviewees were male and half female (figure 08), eight were over forty and 18 under forty (figure 09.) Twelve people had worked in their office for one to five years, seven for five to ten years, five for less than a year and two for more than ten years. Only twenty five percent of the interviewees spent between thirty to forty hours in their office every week and more than fifty percent of them were there for less than twenty hours.
Figure 04. Harvill Building , Fourth Floor, School of Geography and Devel-opment (SGD), Built in 1981
Figure 05. Marshall Building, Fifth Floor, Institute of the Environment, Relatively a new building, Built
Figure 06. Campus Christian Center, Second Floor, Institute of the Environ-ment
Six ProfessorsEight Researchers
Eight GraduateStudents
Six Staff Members
Figure 07. Interviewees’ occupation
13 Women 13 Men
8 Over Forty
18 Under Forty
Figure 08. Sex distribution Figure 09. Age distribution

15
3.0. METHODOLOGY
HOURES SPENT AT WORK
YEARS SPENT IN THIS OFFICE4.0. METHODOLOGY
4.1.3. BEHAVIORAL SIMULATION IN THE ENVIRONMENTAL AND NATURAL RESOURCES BUILDING
The last step was to simulate users’ particular behavior in the Environmental and Natural Resources Building. By simulating users’ behavior in the new de-sign it would be possible to predict how the design would perform according to their needs.
Figure 10. Years worked in the office Figure 11. Hours spent at work weekly
3.0. METHODOLOGY
HOURES SPENT AT WORK
YEARS SPENT IN THIS OFFICE

16
The questions were asked in four different categories:
•Task Performance•Way Finding•Social territoriality•Visual non Visual aesthetics•Cultural expression
One of the studies that helped in creating the questionnaire for theinterviews was “The Usable Buildings Trust (UBT)”. UBT is anindependent charity, registered in the United Kingdom whichpromotes better buildings through the more effective use offeedback on how they actually work (usablebuildings.co.uk.) In theirwebsite they define their goal as following:“We want to improve buildings through better understanding of theirperformance in use, and more care with their design, constructionand management. We promote independent post-occupancy studiesand the management of feedback. We try to make findings availableto everyone, where this is possible.”
The main difference of this study with UBT is that UBT mainly dealswith issues related to task performance; however this research, asmentioned before, takes four other categories in to account.
3.0. METHODOLOGY
4.0. METHODOLOGY
4.2. THE QUESTIONNAIRE
As discussed before, different questions were asked in five behavioral catego-ries. The questions are as bellow:
TASK PERFORMANCE
Furniture:How do you rate the usability of furniture provided for you? Have you brought any other furniture yourself to augment what was provided for you?
Windows and Doors:Can you open any windows in your office? Do you have a balcony and a door which can be opened to it? How long do you leave them open? Is the air conditioning on while the window/door is open? Are doors/windows kept closed during heating and cooling season?
Air conditioning:What do the rating of this building’s heating/cooling, temperature and air qual-ity in winter and summer? Is it possible for you to work well in your office temperatures? Do you have control over air conditioning in your office? Are you happy with the placement of vents in your office?
Lighting:Do you have enough natural light in your office that let you work without using artificial lighting?How long a day are artificial lights on? Do you have control over them?Do you turn your office’s lights off when you leave your workplace? How about the lights of corridors, meeting rooms, kitchen and rest rooms?Does the lighting cause you glare? How do you solve this problem?Is lighting on after hours & weekends or is it used only when needed?Do you have stickers to remind people to turn off lights?
Noise:Are there any noises from inside or outside that disturb your work?

17
4.0. METHODOLOGY
SmellAre there any unpleasant or pleasant smells in your office that disturb your work or help you work better? Where are they coming from?
Computer and other equipment:What kind of electric equipment do you use daily? Do you turn the computers and other equipment off before leaving?
Storage Space:Do you have enough storage space? If not how did you solve this problem? Do you prefer to work somewhere that you have more or less storage space?
Elevator, stairs:Do you use the elevator or stairs? Why?
Recycling:Do you recycle paper in your office?Are the recycle bins located near your desk?
WAY FINDING
How many people come to your office wrongly each day? Can visitors find you easily?Can all the users easily find light switches? recycle bins? Which one is easier to locate: elevator or stairs?
SOCIAL TERRITORIALITY
Where do you meet and socialize with other people who are in your depart-ment? How often do you see them?How many hours a day do you work with your colleagues? Where do you work together? Where do you meet or work with outside visitors?How much space do you have for you own? What separates your workspace from others? Do you think there should be windows for everybody?
VISUAL-NON VISUAL AESTHETICS
What makes your workspace unpleasant for you?Is your office space noisy? Are there good sounds, smellsDo you like the lighting in your office space? Quality? Are you happy with the ventilation?
CULTURAL EXPRESSION
How do you make your office more pleasant to work? For example do you bring in your personal items? Are energy awareness materials displayed throughout the building? Are you encouraged in any ways to be more active in conservation of energy in your office?Would you like additional energy conservation educational materials (Posters, Light stickers) within your building? Have you ever been told about energy sav-ing in the office space and the ways you could achieve it? Do you think this building can express a good image of the program? If yes how?

18
1.0. ABSTRACT
2.0. INTRODUCTION
3.0. RELATED STUDIES
4.0. METHODOLOGY
5.0. OBSERVATION RESULTS AND BEHAVIORAL SIMULATION
6.0. POTENTIAL APPLICATION
7.0. APPENDICES
8.0. BIBLIOGRAPHY

19
7.1. THE NEW BUILDING
5.0. OBSERVATION RESULTS
In this section, the results of the interview series are presented for all behav-ioral categories. Important post occupancy issues are selected according to the interview results (See appendix for full-length interviews.)
After demonstrating how important each issue can be in long-term and short-term environmental performance of an office building, the current work spaces of the users in Harvill building, Marshall building and Campus Christian center are evaluated from their point of view.
Finally user behavior is simulated in the Environmental and Natural Sciences building using schematic design documents of the building. The new five-story building has similar plans in different floors including a central open space and two wings on North and South. Therefore by looking at office spaces of one wing in a typical floor, it is possible to predict user behavior in the whole building.
Figure 12. Typical floor plan of the new building

20
6.1.1. Low temperature in the hot desert
6.1.2. Avoiding steep stairs and taking the elevators instead
6.1.3. Stairs: No access
6.1.4. Excessive artificial lighting and glare
6.1.5. Noisy workspace
6.1.6. Lack of space
6.1.5.1.1. LOW TEMPERATURE IN THE HOT DESERT“Sometimes we bring heaters to our offices when it gets very cold…..”“I don’t like working in here because it get too cold, one we measured the tem-perature and it was …. We had to wear gloves to be able to use our hands…”“We had put a cardboard on the vent because it was so cold, and now it is more tolerable….”“I actually blocked off the air coming in my office because it would get too cold in the summer. I put a piece of cardboard on the vent and it has been much better. I did that several years ago...”
5.1.2. AVOIDING OR CHOOSING STAIRS OVER ELEVA-TORS“The stairs are too steep and therefore I prefer to use the elevator…”
5.1.3. EXCESSIVE ARTIFICIAL LIGHTING AND GLARE“These fluorescents are awful, we have covered them with this piece of cloth
to reduce the glare ...”
“The excessive lighting gives me a terrible headache...”
5.1.4. NOISY WORKSPACE“It is impossible to focus in here; I can’t focus, can’t read or write…”
5.1.5. LACK OF SPACE“I don’t have enough space to bring my books and what I need for doing re-search, I prefer to go home and work there…”
5.1.

21
5.1.1. LOW TEMPERATURE IN THE HOT DESERT
Using a central control for the HVAC system may seem to reduce the initial cost of the equipment. However users’ preferred temperature in summer and winter might be higher or lower than the comfort temperature predicted by the control system. As a result some of the cooled or heated spaces are left empty because the users are unproductive in uncomfortable temperatures and eventually a lot of money and energy is wasted.
In 1989 National Public Health institute of Finland, studied the association of symptoms and complaints with mechanical ventilation and other indoor air factors in a modern eight floor office building with 2150 workers. There was an excess of “Sick Building Syndrome” symptoms, both when the tempera-ture was considered to be too cold and too warm. The study concluded that individual control of room temperature will increase the satisfaction with the temperature and also decrease the “Sick Building Syndrome” symptoms because part of the symptoms were associated with the dissatisfaction with the room temperature.
The term “sick building syndrome” (SBS) is used to describe situations in which building occupants experience acute health and comfort effects that appear to be linked to time spent in a building, but no specific illness or cause can be identified (EPA 1991.) One of the major causes af SBS is working in hot or cold work environment which can lead to physical discomfort and disrupt work operations. “A cold office environment may cause a decrease in sensitiv-ity and dexterity of the fingers. Very cold temperatures may also exacerbate existing conditions such as fatigue, and diseases of the blood circulation sys-tem (nyspef.org.)”
SOURCE: http://www.environmentalprojectsolutions.com/sick-building-syndrome-is-it-a-joke/Figure 13. Sick Building Syndrome

22
The lack of temperature control and low temperature set-points inthe studied buildings have created cold and unpleasant workspacesthat discourage the users from working in them. An excessiveamount of energy is used to keep all the offices extremely coldwhich has resulted in user’s dissatisfaction.
The only users that felt fully comfortable in their offices where thosewho had access to thermostat and could control the temperature intheir offices. One of the users who had this option described herselfas “one of the luckiest people in the building”. She also mentionedthat before finding the thermostat she used to wear gloves at workbecause her office was so cold. out off 24 studied offices only 4had access to a thermostat. Offices which couldn’t be controlled bya thermostat but had a window were the next desirable officesbecause solar radiation could reduce the harshness of excessivecooling.
In offices with no access to thermostat or natural light, some of theusers had tried to warm up their workspace by:
1- Covering the registers which means wasting energy,“We had put a cardboard on the vent because it was so cold, andnow it is more tolerable….”2- Bringing in heaters and turning them on while the cooling systemof the building is working which means using more energy,“Sometimes we bring heaters to our offices when it gets verycold…..”
Others, who don’t have to stay in their offices during the workingday, simply leave their workspace and work in other places wherethey have a better control of their environment.
6.1.1. LOW TEMPERATURE IN THE HOT DESERT
5.1.1. LOW TEMPERATURE IN THE HOT DESERT
The lack of temperature control and low temperature set-points in the studied buildings have created cold and unpleasant work spaces that discourage the users from working in them. An excessive amount of energy is used to keep all the offices extremely cold which has resulted in user’s dissatisfaction.
The only users that felt fully comfortable in their offices where those who had access to a thermostat and could control the temperature in their offices. One of the users who had this option described herself as “one of the luckiest people in the building”. She also mentioned that before finding the thermostat she used to wear gloves at work because her office was so cold. Out of 24 studied offices only 4 had access to a thermostat. Offices which couldn’t be controlled by a thermostat but had a window were the next desirable offices because solar radiation could reduce the harshness of excessive cooling.
In offices with no access to a thermostat or natural light, some of the users had tried to warm up their workspace by:
1- Covering the registers which means wasting energy,“We had put a cardboard on the vent because it was so cold, and now it is more tolerable….”2- Bringing in heaters and turning them on while the cooling system of the building is working which means using more energy,“Sometimes we bring heaters to our offices when it gets very cold…..”
Others, who don’t have to stay in their offices during the working day, simply leave their workspace and work in other places where they have a better con-trol of their environment.
Figure 14. Warming up workspaces

23
5.1.1. LOW TEMPERATURE IN THE HOT DESERT
SIMULATION
As mentioned in the new building schematic design sustainablity chapter (part of the schematic design documents) “the work environment maximizes com-fort, putting the user in control of their temperature and light levels in offices”. This means that all individual offices will have control of the temperature which will increases user satisfaction and productivity. However, it does not mention any strategies about shared work spaces. According to the American Society of Heating, Refrigerating, and Air-conditioning Engineers (ASHRAE), Standard 55-2004 titled, “Thermal Environmental Conditions for Human Occupancy, shared work spaces should provide “conditions in which 80% or more of the occupants will find the environment thermally acceptable.” Temperature set-tings should be discussed among coworkers and settings adjusted to satisfy the maximum number of people.
Another issue is about the design of the temperature control devices. Usually these systems are planned and constructed without a realistic view of their us-ers, who are supposed to have the knowledge they don’t have.
In an Finnish study, to understand the user problems with individual temperature control, a total of 27 office occupants in 13 office buildings were interviewed. The result showed that temperature controls should be clearly visible and easily reachable. There should only be one user control for temperature in every office and it should adjust both heating and cooling. After moving to a new office, us-ers should be advised on the use of the controls and the effect the controls give. The temperature control should clearly indicate whether it is currently in use or not, and give instant feedback after a user control action so that the user knows the system is working to fulfil the request (the rate of temperature change is slow because of the thermal inertia) (Karjalainen, 2006.)
Private offices with temperature controlShared work space, no temperature control
Figure 15. Low temperature in the new building

24
5.1.2. AVOIDING OR CHOOSING STAIRS OVER ELEVA-TORS
Perhaps understanding the relation of using the stairs and the energy perfor-mance of the building is very obvious. There are two main types of lifts: hy-draulic which are used in low-rise buildings (less than 7 stories), and traction lifts for mid to high rise buildings. Hydraulic lifts are considered to be around 25% less energy efficient than traction lifts.
According to ACEEE (American Council for an Energy-Efficient Economy), there are around 700,000 lifts in the US, more than two thirds of which are hydraulic lifts. It is reasonably safe to assume that most offices are low to mid rise buildings (the majority will have fewer than 7 storeys) and so will use the less efficient hydraulic systems (URL 7.)
it is possible to get an idea of the amount of energy consumed by lifts by us-ing averaged data available from lift manufacturers. “A 15 second lift journey consumes as much energy as a 60W light bulb does in an hour. It is worth mentioning that Hydraulic lifts are typically slower than traction lifts. Accord-ing to lift manufacturer Kone, a lift uses an average of 30W of energy per start (where per 'start' is per door opening, so two starts per complete journey).
An elevator just on standby can consume about 10,000 kWh per year if we assume that it is left on for 5000 hours per year. This would waste over half a ton of carbon just by being on standby. Standby consumption can account for between 25% to 80% of a lift’s total energy consumption (URL 7.)
Traction elevator Hydraulic elevator
>>
Figure 16.

25
Perhaps understanding the relation of using the stairs and theenergy performance of the building is one of the more obvious ones.About 90 percent of the users think that using the stairs is healthierthan going up and down with the elevators. However, some of thestaircases are not user friendly. It is also worth to mention that byusing the stairs no energy is used for running the elevators.
In Harvill, even though the department of Geography is located in thefourth floor, the users prefer to use the stairs. The building has threestaircases and two of them are located on the north side and southside of the building and the third one is in the center of the plan.
The steepness of staircases in Harvill and Campus Christian Centeris the most important obstacle for the users which results in anincrease in the use of the elevator.“The stairs are too steep and therefore I prefer to use theelevator…”
6.1.2. STAIRS: STEEPNESS
5.1.2. AVOIDING OR CHOOSING STAIRS OVER ELEVATORS
STAIRS: STEEPNESS
In the studied buildings, about 90 percent of the users think that using the stairs is healthier than going up and down with the elevators. This may be considered as a part of the cultural beliefs of environmentalists but the usability of the stairs is a Task Performance issue. It is also worth mentioning that by using the stairs no energy is used for running the elevators.
In Harvill, even though the department of Geography is located in the fourth floor, the users prefer to use the stairs. The building has three staircases and two of them are located on the north side and south side of the building and the third one is in the center of the plan.
The steepness of staircases in Harvill and Campus Christian Center is the most important obstacle for the users which results in an increase in the use of the elevator.“The stairs are too steep and therefore I prefer to use the elevator…”
Perhaps understanding the relation of using the stairs and theenergy performance of the building is one of the more obvious ones.About 90 percent of the users think that using the stairs is healthierthan going up and down with the elevators. However, some of thestaircases are not user friendly. It is also worth to mention that byusing the stairs no energy is used for running the elevators.
In Harvill, even though the department of Geography is located in thefourth floor, the users prefer to use the stairs. The building has threestaircases and two of them are located on the north side and southside of the building and the third one is in the center of the plan.
The steepness of staircases in Harvill and Campus Christian Centeris the most important obstacle for the users which results in anincrease in the use of the elevator.“The stairs are too steep and therefore I prefer to use theelevator…”
6.1.2. STAIRS: STEEPNESS
Campus Christian center Harvill>
<Figure 17. Stairs’ steepness

26
In Marshall building, using the stairs is impossible because the doorof the staircase can not be opened when going up the stars.
6.1.3. STAIRS: NO ACCESS
5.1.2. AVOIDING OR CHOOSING STAIRS OVER ELEVATORS
STAIRS: NO ACCESS
In Marshall building, using the stairs is impossible because the door of the staircase can not be opened to gain access to the stairs.
In Marshall building, using the stairs is impossible because the doorof the staircase can not be opened when going up the stars.
6.1.3. STAIRS: NO ACCESS
Figure 18. Access to the stairs, Marshall Building

27
7.3. STAIRS AND ELEVATORS
5.1.2. AVOIDING OR CHOOSING STAIRS OVER ELEVATORS
SIMULATION
In the new building, it seems that the designers have tried to create easy ac-cess to different staircases for the users which can encourage them to use the stairs. Both elevators are located next to two staircases (green areas) and therefore people have equal access to the stairs and elevators. Additionally the central staircase (orange area) has an interesting form which visually may en-courage the users to use it (Visual non Visual Aesthetics issue.) However being located in the center of the building this staircase may be less visible to new-comers and less used when people arrive to the building (Way Finding issue.)
The use of separate staircases (yellow areas) that only connect certain floors to each other can also decrease the use of elevators for short trips.
Figure 19. Using the stairs in the new building

28
5.1.2. AVOIDING OR CHOOSING STAIRS OVER ELEVA-TORS
PRECEDENT
Although the new building seems to respond relatively well in offering dif-ferent choices to users for going up and down in the building, there may be some other innovative energy saving ideas in designing vertical access which also increase users satisfaction of the building.
In the new European engineering Google headquarters in Zurich, there are fire-man poles to allow easy access between floors and also a slide to ensure that people can get to the cafeteria as quickly as possible. By using these elements more negative Task Performance experiences are replaced by more positive kinesthetic or visual ones. Users love the slide and fireman poles and these are some of the design elements that have made this building an ideal workspace for many people.
Figure 20. Google Headquarters, Zurich , Positive Kines-thetic and Visual ways of Moving Between Floors

29
5.1.3. EXCESSIVE ARTIFICIAL LIGHTING AND GLARE
Based on Department of Energy classification, artificial lighting counts for 21.7% of the total energy used in commercial buildings. Excessive artificial lighting not only results in wasting energy but also reduces satisfaction of the users and decreases their visual comfort. In general visual comfort relates to the quantity and size of illumination, contrast, glare and shadowing. The glare caused by this type of lighting can cause headaches and discourage the users from staying in their offices.
This glare usually occurs because of large differences in the field of view. On the other hand, a work environment with no luminance differences would be flat, dull and make eyes tired. “Optimally, an interior should be lighted to strike a balance between totally uniform luminance and glare-producing extremes (Chalfoun, 28)”.
A comfortable level of lighting for different individuals in an office space is not a constant value and may be different according to users’ age, vision, habits and other factors. Therefore the controllability of task lighting in office space is very essential.
Figure 21. Commercial energy end-use splits, by fuel type, Source: DOE
LightingSpace HeatingSpace CoolingVentilationRefrigerationWater HeatingElectronicsComputersCookingOther(2)Adjust to SEDS(3)TOTAL
NOTES:1) Comprised of biomass, solar water heating, solar PV, and wind. 2) Includes service station equip-ment, ATMs, telecommunications equipment, medical equipment, pumps, emergency electric gen-erators, combined heat and power in commercial buildings, and manufacturing performed in com-mercial buildings. 3) Energy adjustment EIA uses to relieve discrepancies between data sources. Energy attributable to the commercial buildings sector, but not directly to specific end-uses.
NATURAL FUEL OTHER RENW. SITE PRIMARY GAS OIL LPG FUEL En.(1) ELECTRIC TOTAL PERCENT

30
Excessive artificial lighting not only results in wasting energy butalso reduces satisfaction of the users. The glare caused by this typeof lighting can cause headaches and discourage the users fromstaying in their offices.
The typical lighting of all three buildings are fixtures with two linearfluorescents hung from the ceiling. All the users believed that thosefluorescents lights are very harsh and glary. As one of the userssaid: “Even though I try to avoid the glare by not looking at theceiling, the glare reflecting from the computer screen is stillbothering..”
“These fluorescents are awful, we have covered them with thispiece of cloth to reduce the glare and weaken the excessive light ..”
Some users had called the service to take one of the bulbs outbecause even one, could provide more than enough artificial light forthem. However they had been told that it would cost almost 300dollars to take one of the bulbs. This is why one of staff membermentioned: “There are ways to save; people are not thinking how todo it.”
Others had tried to resolve this issue by bringing their own desklamps and some incandescent lamps which obviously use moreenergy, or simply covering the fluorescents with a piece of fabric.
6.1.4. EXCESSIVE LIGHTING AND GLARE
5.1.3. EXCESSIVE ARTIFICIAL LIGHTING AND GLARE
The typical lighting of all three buildings are fixtures with two linear fluorescent bulbs hung from the ceiling. All the users believe that these fixtures are very harsh and glary for performing their tasks, specifically for reading and working with computers. These extremely bright light fixtures are placed against a dark background and this huge difference causes discomfort.
As one of the users said: “Even though I try to avoid the glare by not looking at the ceiling, the glare reflecting from the computer screen is still bothering..”
“These fluorescents are awful, we have covered them with this piece of cloth to reduce the glare and weaken the excessive light ..”
Some users had called the building service to take one of the bulbs out be-cause even one, could provide more than enough artificial light for them. How-ever they had been told that it would cost almost 300 dollars to take one of the bulbs. This is why one of staff member mentioned: “There are ways to save; people are not thinking how to do it.”
Others had tried to resolve this issue by bringing their own desk lamps, with incandescent bulbs which obviously use more energy, or simply covering the fixtures with a piece of fabric.
Figure 22. Artificial Lighting in Harvill and Campus Christian Center

31
5.1.3. EXCESSIVE ARTIFICIAL LIGHTING AND GLARE
SIMULATION
In the new building, both private and shared office spaces have the typical linear fluorescent light fixtures which are hung from the ceiling. These fixtures are very similar to the ones used in studied buildings and do not seem to be the best solution for the users. Figure 23. Artificial lighting in the new building

32
5.1.3. EXCESSIVE ARTIFICIAL LIGHTING AND GLARE
SIMULATION
As mentioned before glare on the computer screen is a common problem for office users. In the new building, using overhead linear fixtures is one of the factors which will cause glare on the computer screens. This can be eliminated by reducing overhead lighting and adding task lighting.
Positioning of desks parallel to the windows, which is used in the whole layout of the new building, can also cause glare problems for the users. To avoid this problem the monitors should be positioned perpendicular to the windows.
Figure 24. Correct positioning of monitor according to window Source: Apple ergonomics
Figure 25. New building positioning of monitors >
>

33
5.1.3. EXCESSIVE ARTIFICIAL LIGHTING AND GLARE
SIMULATION
In the simulated building, this strategy would result in breaking down the pro-posed lighting to two different types of lighting, one for individual task lighting for each user and another one as general energy efficient ambient lighting. Various energy efficient fixtures exist in the market which could be chosen by the users themselves and be more flexible.
Ambient side lighting+Task lighting
Ambient ceiling spot lighting + Task lighting
Figure 26.
Figure 27.

34
5.1.3. EXCESSIVE ARTIFICIAL LIGHTING AND GLARE
PRECEDENT
To solve the problems regarding inefficient artificial lighting, the best solution as used in Google headquarters is to use natural lighting as the main source of ambient lighting during the day and have two source of artificial lighting for other times, one for ambient lighting and one for task lighting. Using individual task lighting instead of excessive overhead lighting can help with visual comfort of the users and increase their satisfaction and also decrease energy use. The ambient indirect lighting would be turned on only when natural light is not enough and task light-ing would be individually controlled.
Ambient LightingIndividual Task lighting
Task lightingAmbient Lighting
Figure 28. Task lighting and ambient lighting in Google Headquarters

35
In an office building mainly designed for researchers, the creation ofspaces that stimulate research and help researchers to think,analyze and create, is probably the main goal of the designers. Toachieve this, goal quiet spaces which can help the researchersfocus should be provided.
Some of the users of Harvill fourth floor including students andfaculty members, come to their offices rarely, because they can’tfocus in their offices. They found them very noisy because manystudents who are waiting for their classes talk outside loud andmake noises and it seems that they are not aware that some peopleare working nearby.
“It is impossible to focus in here; I can’t focus, can’t read orwrite…”
Besides that the users can hear almost all the noises from adjacentoffices and therefore they prefer to just perform those kind ofactivities that don’t need complete focus like grading or talking tostudents, in their offices.
As a result, most of the researchers prefer to leave their offices andperform their premier task which is research in other places liketheir homes or the library.
6.1.5. NOISY WORKSPACE5.1.4. NOISY WORKSPACE
In an office building mainly designed for researchers, the creation of spaces that stimulate research and help researchers to think, analyze and create, is probably the main goal of the designers. To achieve this goal, quiet spaces which can help the researchers focus should be provided.
As the European Agency for Safety and Health at Work reports, occupational noise, even when it is not at a level that requires action to prevent hearing loss, can be a stressor (e.g. the frequent ringing of a tel phone or the persistent hum of an air-conditioning unit), contributing to work-related stress that increases the cognitive load, increasing the likelihood of errors.
Some of the users of Harvill fourth floor including students and faculty mem-bers, come to their offices rarely, because they can’t focus in their offices. They found them very noisy because many students who are waiting for their classes talk outside loud and make noises and it seems that they are not aware that some people are working nearby.
“It is impossible to focus in here; I can’t focus, can’t read or write…”
Besides that the users can hear almost all the noises from adjacent offices and therefore they prefer to only perform those kind of activities that don’t need complete focus like grading or talking to students, in their offices.
As a result, most of the researchers prefer to leave their offices and perform their premier task which is research in other places like their homes or the library.
Figure 29. Noise in Harvill and Campus Christian Center

36
5.1.4. NOISY WORKSPACE
SIMULATION
In the new building, individual offices are completely enclosed and if the de-signers take acoustic considerations in selecting construction materials and details, they can perform very well for the faculty and researchers. However shared spaces of cubicles which will be mostly used by PhD students may not satisfy them and they will not be able to focus and work. They will hear sounds from their colleagues and people who walk or talk in the corridors and this may be very distracting for them.
Figure 30. Shared office spaces in the new building

37
5.1.4. NOISY WORKSPACE
PRECEDENT
To solve the problem of noise is small shared offices many designers includ-ing Buratti + Battiston from Italy have used glass partition walls to separate different spaces. In Vetreria Airoldi Office and Showroom in Milan, all office enclosures are constructed using a glass partition system, which maintains transparency and optimizes daylight while reducing noise and achieving the required degree of sound transmission for working teams (URL 12.)
Another strategy could be creating smaller shared office spaces, each for two or three graduate students, assuming that they can work out a schedule where only one occupies it at a time.
Figure 31. Vetreria Airoldi Office and Showroom, Milan

38
5.1.5. LACK OF SPACE
The square footage of space designated for each user, plays a significant role in their satisfaction of their office. Different tasks require different sizes of spaces and some people need more space to have small meetings in their office or need more storage space.
Sharing small offices in Harvill and working in the small cubicles of Marshall, makes it hard for the researchers and students to look at these spaces as their main offices. Even faculty members who work in private offices of Harvill find them very small to store the books that they need and to have small meetings. Therefore, they mostly prefer working in their home offices where they have more space for their belongings and usually go to nearby cafes for small meet-ings.
“I don’t have enough space to bring my books and what I need for doing re-search, I prefer to go home and work there…”
The faculty members who worked in Marshall fifth floor were the only group satisfied with their office size.
A typical office in Marshall fifth floor
Sharing small offices in Harvill and working in the small cubicles ofMarshall, makes it hard for researchers, students and faculty to lookat these spaces as their main offices. They mostly preferred workingin their home offices where they had more space for their belongingsand could better perform their tasks.
“I don’t have enough space to bring my books and what I need fordoing research, I prefer to go home and work there…”
6.1.6. LACK OF SPACE
Small faculty office, Harvill
Shared student office
Figure 33. A decently sized faculty office, Marshall
Figure 32. Shared offices and private offices of Harvill

39
5.1.5. LACK OF SPACE
SIMULATION
By comparing office sizes of the new building with Harvill and Marshll offices, it is possible to predict if the users will be satisfied with their new offices. The private offices of new building are very similar to the Harvill private office in size and are much smaller than Marshall typical offices. As a result users may not be satisfied with their new offices’ size.
Harvill
Marshall
The new building
Figure 34. Comparing office sizes of Harvill, Marshall, and the new building