considerations for mass spectrometry based protein therapeutic … · 2018-04-02 · • 38 peptide...
TRANSCRIPT

Considerations for Mass Spectrometry Based Protein
Therapeutic Control Methodology
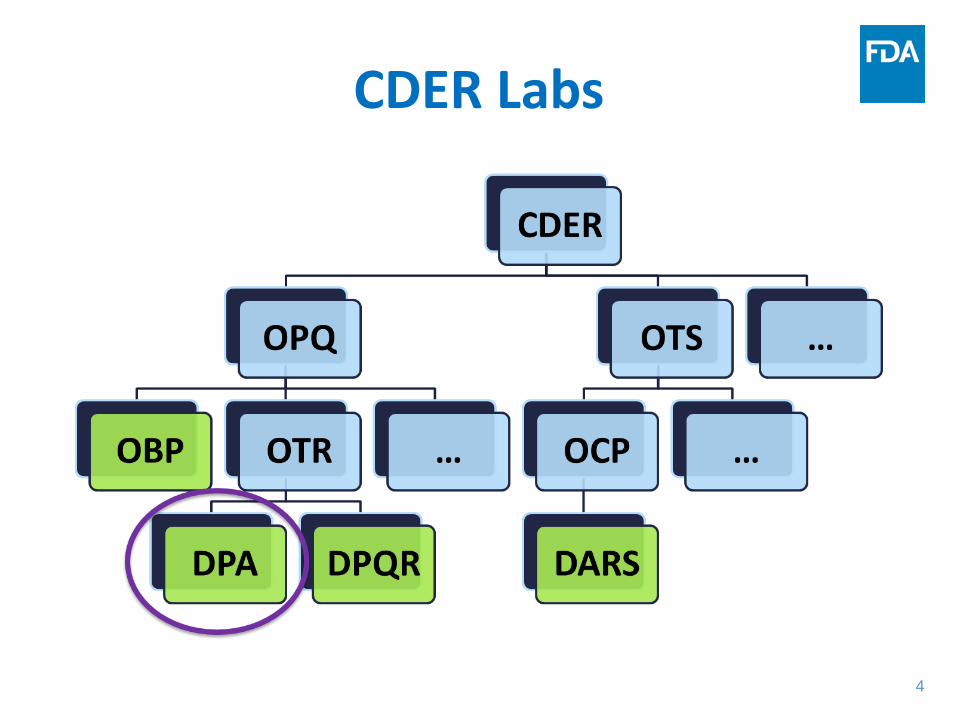
Sarah Rogstad FDA/CDER/OPQ/OTR/DPA
September 22, 2017

2
This presentation reflects the views of the author and should not be construed to represent FDA’s
views or policies
2

3
Seminar Overview
• Introduction to CDER Labs/OTR • Mass spectrometry (MS) for protein therapeutics • MS for peptide therapeutics • MS as a release assay • System suitability • Guidances • Multi-attribute method
4
CDER Labs

5
Office of Testing and Research (OTR)
• IMPROVE the FDA's capacity for evaluating and monitoring drug quality, safety, and efficacy.
• HELP modernize current regulatory pathways or INDICATE a new regulatory pathway where there is currently none.
• ADDRESS regulatory science issues that are mission critical and/or cannot or will not be done by other government agencies or industry.
• MAINTAIN a state of 'research readiness' that anticipates potential regulatory needs while allowing for rapid response to emergent regulatory issues.
6
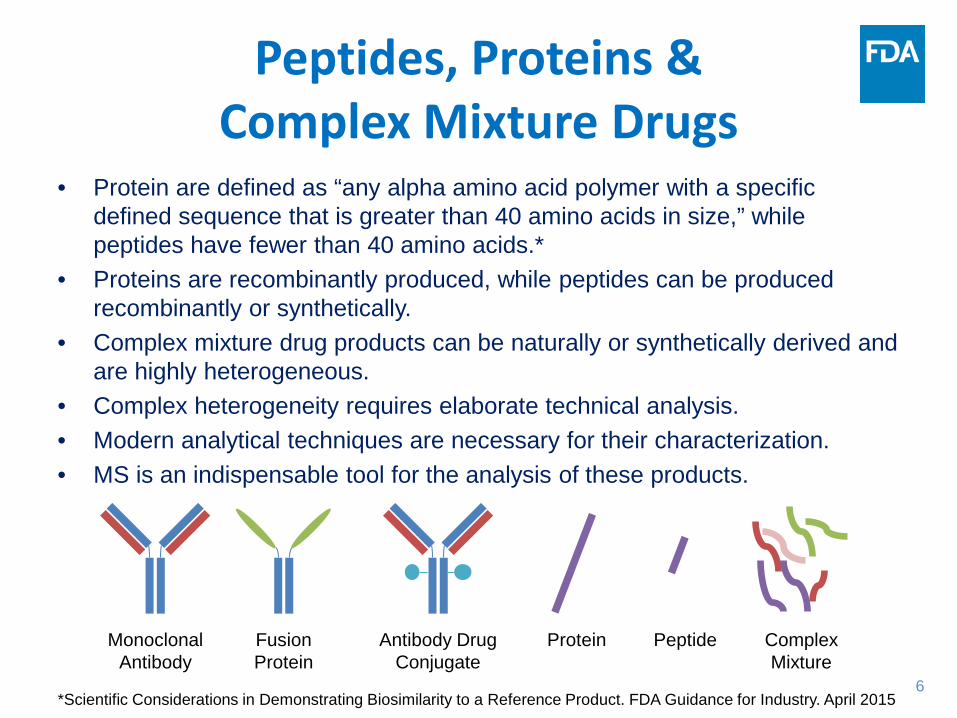
Peptides, Proteins & Complex Mixture Drugs
• Protein are defined as “any alpha amino acid polymer with a specific defined sequence that is greater than 40 amino acids in size,” while peptides have fewer than 40 amino acids.*
• Proteins are recombinantly produced, while peptides can be produced recombinantly or synthetically.
• Complex mixture drug products can be naturally or synthetically derived and are highly heterogeneous.
• Complex heterogeneity requires elaborate technical analysis. • Modern analytical techniques are necessary for their characterization. • MS is an indispensable tool for the analysis of these products.
Monoclonal Antibody
Fusion Protein
Antibody Drug Conjugate
Protein
*Scientific Considerations in Demonstrating Biosimilarity to a Reference Product. FDA Guidance for Industry. April 2015
Peptide Complex Mixture

7
Emerging MS Techniques • High resolution accurate mass (HRAM) instrumentation allows for
advanced comparative analyses.
• HRAM instrumentation combined with advanced separation techniques allows for new qualitative and quantitative MS approaches.
• Advanced techniques such as ion mobility – mass spectrometry (IM-MS), hydrogen-deuterium exchange mass spectrometry (HDX-MS) allow for higher-order structure analysis and can be used for characterization and similarity analyses.
• HRAM instrumentation also opens the door for MS as a release method.

8
MS Usage in Protein Therapeutic Characterization

9
Protein BLA Overview
50%
36%
11% 3%
Type of BLA (electronic only)
Antibody
Protein
Fusion protein
Antibody Drug Conjugate
• 90 protein BLAs were approved from 2000 – 2015. • 80 were submitted electronically. • 79 out of 80 electronic BLAs used MS for DS characterization.
0
2
4
6
8
10
12
14
# of
BLA
s
Biotherapeutic BLA Approvals
Electronic Approvals Paper Approvals

10 10
Quality Attribute Targets Analyzed via MS
MS Target % of MS BLAs MS Target % of
MS BLAs Amino Acid Sequence Analysis 97.5 Sequence Variants (Amino Acid Substitutions) 8.9
Molecular Mass 92.4 Covalent Dimers 7.6
Disulfide bonds 77.2 Methionine/Cysteine Formylation 7.6
Glycosylation 70.9 Phosphorylation 5.1
Sequence Variants (C-term) 64.6 Truncation 5.1
Sequence Variants (N-term) 64.6 Acetylation 3.8
Deamidation 58.2 Aggregation 3.8
Oxidation 57.0 Folding/HOS 3.8
Size Variants 27.8 Host Cell Proteins 3.8
Free Thiols 25.3 Partial Reduction 3.8
Glycation 22.8 PEGylation 3.8
Charge Variants 19.0 Translucent Particles 3.8
Other Impurities 17.7 Zinc 3.8
Proteolysis/ Fragmentation 13.9 Glutathionylation 1.3
Succinimidation 12.7 Methylation 1.3
Isomerization 10.1 Norleucine Incorporation 1.3
Other 10.1 Phosphogluconylation 1.3

11
MS in Peptide Therapeutics
0
2
4
6
8
10
2003
2004
2005
2006
2007
2008
2009
2010
2011
2012
2013
2014
2015
2016
2017
# of
App
rova
ls
Approved Peptide Applications
NDA ANDA
• 38 peptide NDAs and 40 peptide ANDAs have been approved since 2003. • 20 Type 1 NDAs (NME) were analyzed for MS usage. • All NDAs used some MS analysis.
Manufacturing method Percentage of NDAs
SPPS alone 65%
SPPS and LPPS 15%
LPPS alone 10%
Recombinant 10%

12
MS in Peptide Therapeutics
MS Target % of NDAs MS Target % of
NDAs
Molecular Mass 100% Disulfide Bonds 20%
Amino Acid Sequence Analysis 85% Incomplete Deprotection 20%
Amino Acid Deletion/Insertion 60% Dehydration 15%
Terminus Modification 55% Aggregation 10%
Racemisation/Diastereomer 50% Side Chain Modification Caused by Solvent 10%
Amino Acid Enantiomeric Purity by GC-MS 45% Cyclisation 10%
Oxidation 45% Residual Solvents by GC-MS 10%
Metals 40% Thioether 5%
Deamidation 40% Free Thiols 5%
Fragmentation/Truncation 35% Trisulfide 5%
Dimerization/Trimerization 30% PEGylation 5%
Succinimidation/Asu 30% Palmiotoyl 5%
iso-Asp/beta-Asp 30% Glycosylation 5%
Acetylation 25% Mutations 5%
13
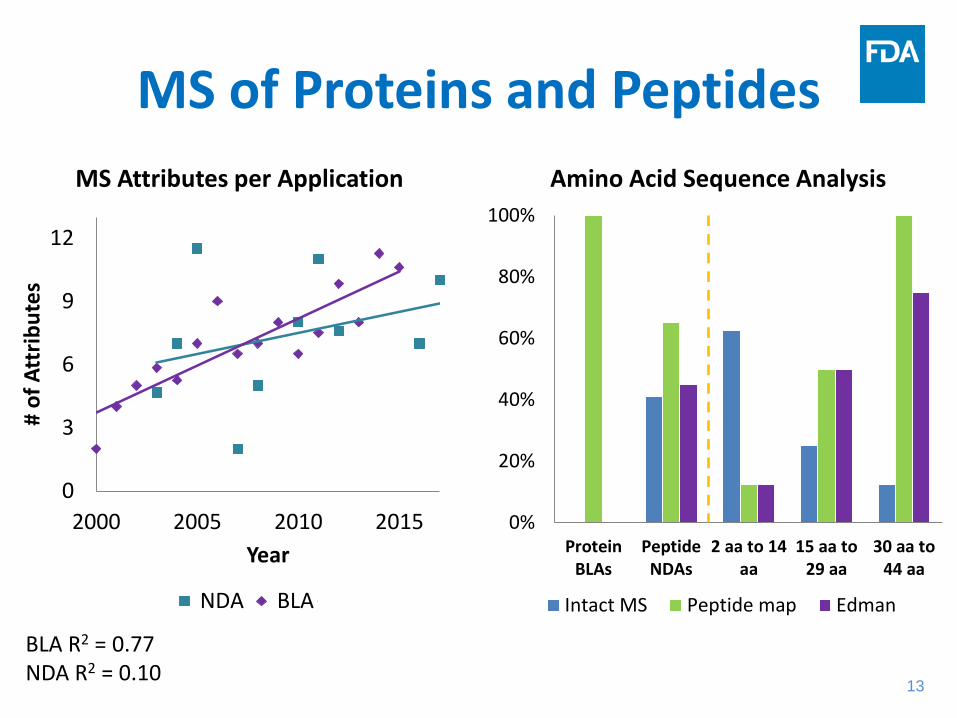
MS of Proteins and Peptides
0
3
6
9
12
2000 2005 2010 2015
# of
Att
ribut
es
Year
MS Attributes per Application
NDA BLA Linear (NDA)
0%
20%
40%
60%
80%
100%
ProteinBLAs
PeptideNDAs
2 aa to 14aa
15 aa to29 aa
30 aa to44 aa
Amino Acid Sequence Analysis
Intact MS Peptide map Edman
BLA R2 = 0.77 NDA R2 = 0.10

14
MS as a Release Assay
MS is commonly used for lot release of small molecules and peptide therapeutics.
– Molecular mass measurements only for peptide NDAs
n=7 n=4
n=6
n=3
0102030405060708090
100
2003-2006 2007-2010 2011-2014 2015-2017
% o
f Pep
tide
NDA
s
MS Usage for Control
MS Usage Protein BLAs
Peptide NDAs
Characterization 100% 100%
Control 0 65%

15
MS for Control of Protein Therapeutics
• Recent improvements in instrumentation have led to a push toward MS for protein therapeutic control
• Concerns associated with this usage: – Reproducibility – Robustness – Cost – Expertise – Speed
• Specific considerations: – System suitability – Method validation – Comparisons with traditional methods
16
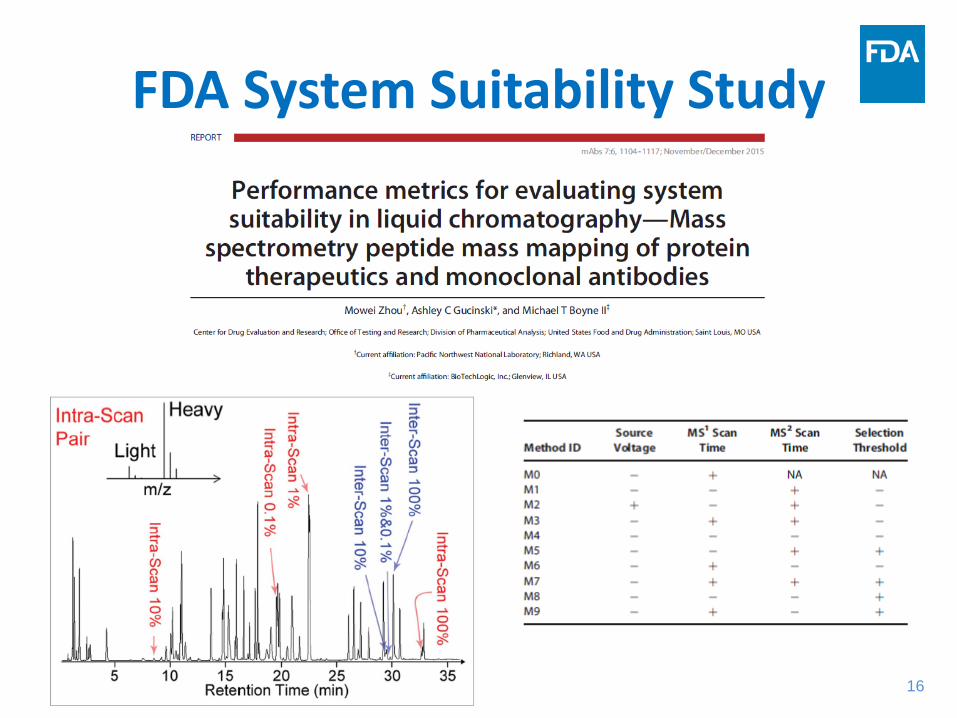
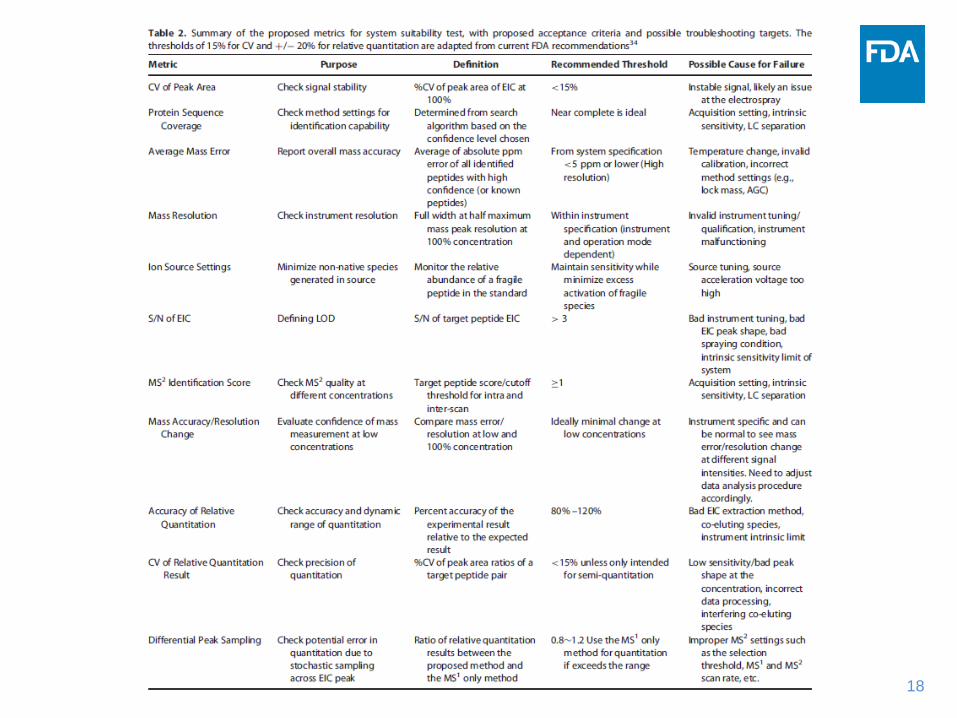
FDA System Suitability Study
17
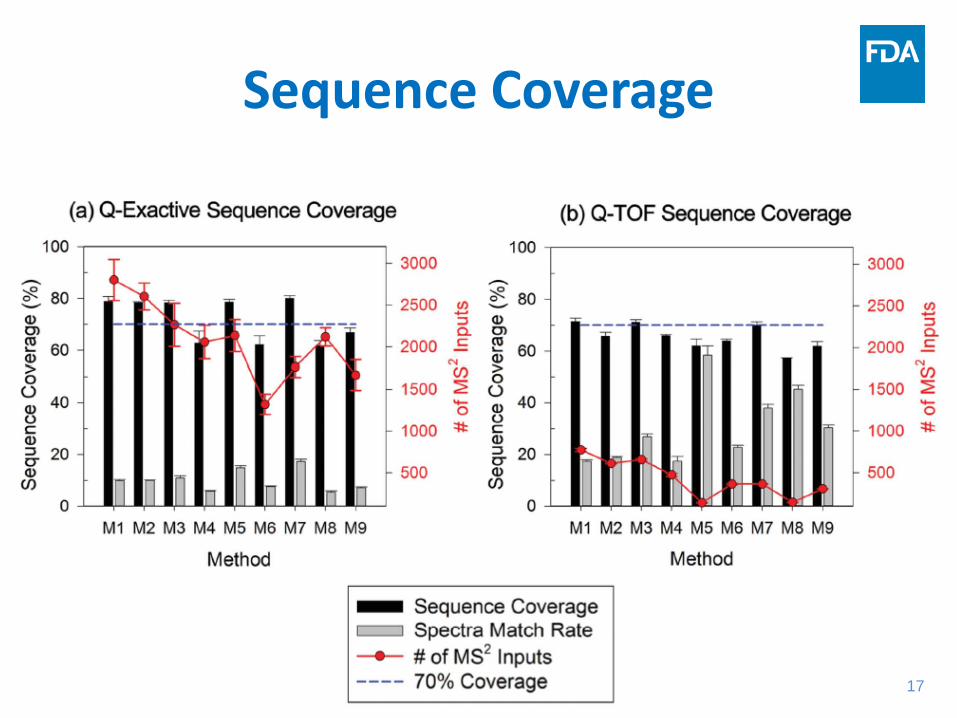
Sequence Coverage
18

19
Proposed System Suitability Workflow

20
ICH Guidelines
ICH Q2 (R1) Validation of Analytical Procedures:
– Accuracy – Precision
• Repeatability • Intermediate Precision
– Specificity – Detection Limit – Quantitation Limit – Linearity Range
ICH Q6B Specifications: Test Procedures and Acceptance Criteria for Biotechnological/Biological Products: - Characterization - Analytical Considerations
- Reference standards - Validation
- Process Controls

21
FDA Guidance
Analytical Procedures and Methods Validation for Drugs and Biologics “Data must be available to establish that the analytical procedures used in testing meet proper standards of accuracy, sensitivity, specificity, and reproducibility and are suitable for their intended purpose.”
22
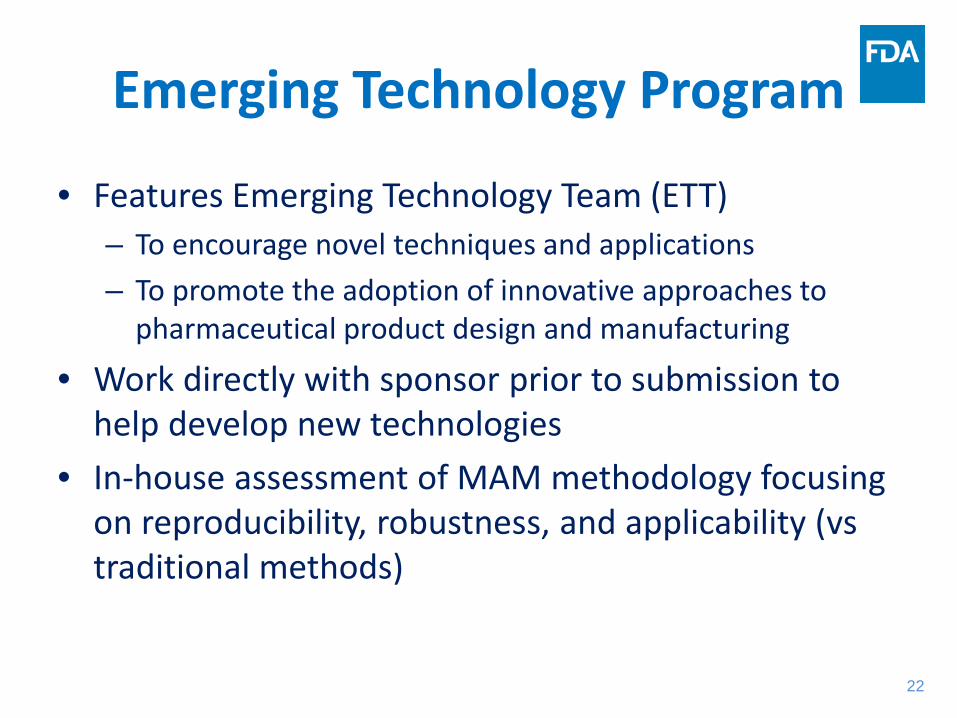
Emerging Technology Program
• Features Emerging Technology Team (ETT) – To encourage novel techniques and applications – To promote the adoption of innovative approaches to
pharmaceutical product design and manufacturing
• Work directly with sponsor prior to submission to help develop new technologies
• In-house assessment of MAM methodology focusing on reproducibility, robustness, and applicability (vs traditional methods)
23
Emerging Technology Program Examples of Emerging Technologies Considered by ETT • Emerging technologies for small molecules
– Continuous manufacturing of drug substance – Continuous manufacturing of drug product – Model-based control strategy for continuous manufacturing – Continuous aseptic spray drying – 3D printing manufacturing – Ultra-long-acting oral formulation
• Emerging technologies for biological molecules – Controlled ice nucleation for lyophilization processes – Advanced process control such as predictive modeling for process monitoring and close loop bioreactor
control – Multi-attribute method – Next generation sequencing – Continuous manufacturing for a upstream process – Pharmacy on demand (a small manufacturing platform for continuous bioprocesses)
• Emerging technologies for multiple products – Closed aseptic filling system – Isolator and robotic arm for aseptic filling – Novel container and closure systems for injectable products
https://www.fda.gov/AboutFDA/CentersOffices/OfficeofMedicalProductsandTobacco/CDER/ucm523228.htm

24
Multi-Attribute Method
Fast Tryptic Digestion
Liquid Chromatography
HRAM MS Protein Product Peptide Mixture
Database Search (Initial Characterization)
LC-MS/MS Data Targeted Peak
Detection and Quantitation
Untargeted (New) Peak Detection
LC-MS Data
Semi-Automated Software Package

25
MAM vs Traditional Methods
• Specific vs general measurements – How to compare?
• Fit for purpose – Demonstrate that new QC method is monitoring all
relevant CQAs – Which PQAs are CQAs and need to be monitored is
product specific
MAM Target Traditional Target
HILIC Glycan Profiling Glycopeptides Released Glycans
CEX Specific Acidic Modifications All Acidic Species
rCE-SDS Specific Clipped Species All Clipped Species

26
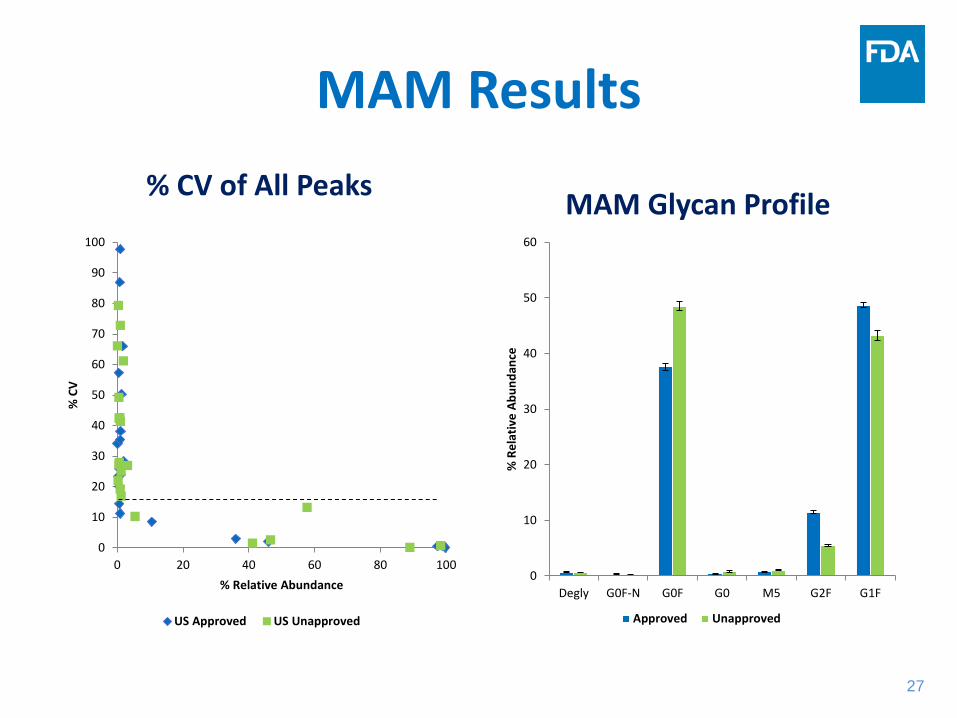
MAM at FDA
• OPQ is working to establish in-house MAM capabilities at FDA in order to explore and better evaluate usage of the approach.
• Two major concerns: 1. Is MAM suitable as a replacement for current methods? 2. Is MAM sufficiently reproducible/robust?
• Initial testing will compare US approved and unapproved rituximab through MAM, CEX, rCE-SDS and released glycan HILIC analyses.
27
MAM Results % CV of All Peaks MAM Glycan Profile
0
10
20
30
40
50
60
Degly G0F-N G0F G0 M5 G2F G1F
% R
elat
ive
Abun
danc
e
Approved Unapproved
0
10
20
30
40
50
60
70
80
90
100
0 20 40 60 80 100
% C
V
% Relative Abundance
US Approved US Unapproved

28
MAM Glycan Profiling MAM vs HILIC Comparison
(Unapproved vs Unapproved) MAM vs HILIC Comparison (Approved vs Unapproved)
R² = 0.6921
0
10
20
30
40
50
60
0 10 20 30 40 50 60
% R
elat
ive
Abun
danc
e - M
AM
% Relative Abundance - HILIC
R² = 0.9089
0
10
20
30
40
50
60
0 10 20 30 40 50 60
% R
elat
ive
Abun
danc
e - M
AM
% Relative Abundance - HILIC

29
Summary
• MS is currently used as a release assay for peptide therapeutics, but not protein therapeutics.
• Emerging MS techniques such as MAM show promise for the future of MS in QC.
• Before MS moves into the protein QC environment, additional work needs to be done demonstrating proper standards (system suitability), reproducibility, robustness and method fit for purpose.
30
Acknowledgements
• OTR – Xiaoshi Wang – Deepali Rathore – Brandon Kim – Anneliese Faustino – Sau (Larry) Lee – David Keire – Jason Rodriguez – Michael Boyne – Hongping Ye – Hongbin Zhu
• OBP – Kurt Brorson – Cyrus Agarabi – David Powers – Ramesh Venna – Jun Park
• Emerging Technology Team • MAM Consortium
