consistent assessment of biomarker and subgroup identification methods h.d. hollins showalter
DESCRIPTION
Consistent Assessment of Biomarker and Subgroup Identification Methods H.D. Hollins Showalter. Outline. Background Data Generation Performance Measurement Example Operationalization Conclusion. Outline. Background Data Generation Performance Measurement Example Operationalization - PowerPoint PPT PresentationTRANSCRIPT

1
Consistent Assessment of Biomarker and Subgroup Identification Methods
H.D. Hollins Showalter
5/20/2014 (MBSW)

2
Outline
1. Background2. Data Generation3. Performance Measurement4. Example5. Operationalization6. Conclusion
5/20/2014 (MBSW)

3
Outline
1. Background2. Data Generation3. Performance Measurement4. Example5. Operationalization6. Conclusion
5/20/2014 (MBSW)

4
Tailored Therapeutics
A medication for which treatment decisions are based on the molecular profile of the patient, the disease, and/or the patient’s response to treatment.
• A tailored therapeutic allows the sponsor to make a regulatory approved claim of an expected treatment effect (efficacy or safety)
• “Tailored therapeutics can significantly increase value—first, for patients—who achieve better outcomes with less risk and, second, for payers—who more frequently get the results they expect.”*
5/20/2014 (MBSW)
*Opening Remarks at 2009 Investor Meeting, John C. Lechleiter, Ph.D.
Adapted from slides presented by William L. Macias, MD, PhD, Eli Lilly

5
Achieving Tailored Therapeutics
• Data source: clinical trials (mostly)• Objective: identify biomarkers and subgroups• Challenges: complexity, multiplicity• Need: modern statistical methods
5/20/2014 (MBSW)

6
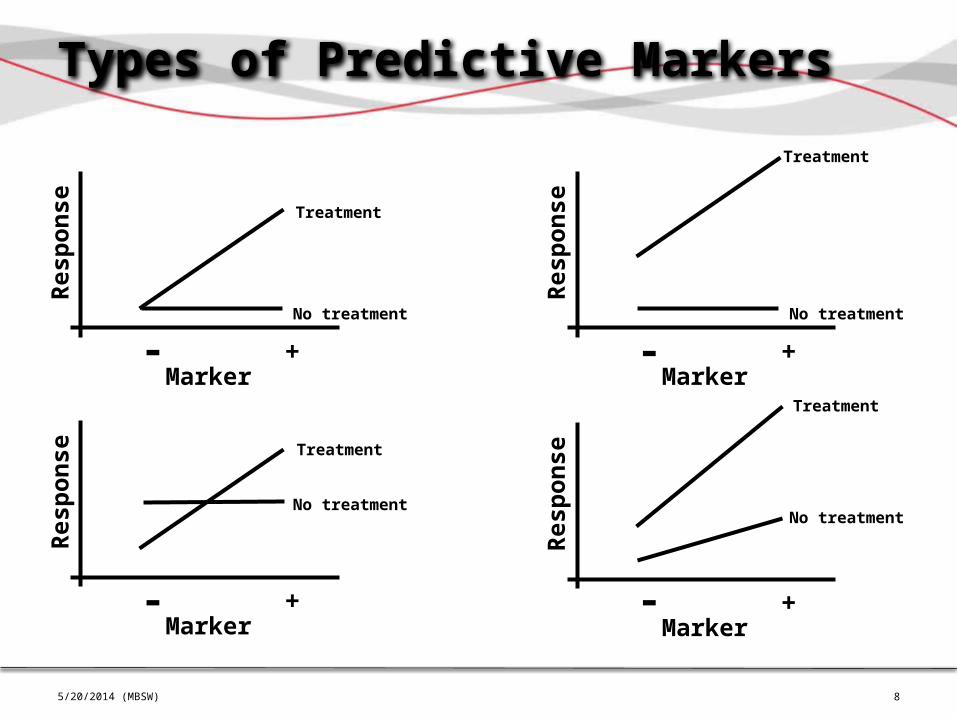
Prognostic vs. Predictive Markers
Prognostic MarkerSingle trait or signature of traits that identifies different groups of patients with respect to the risk of an outcome of interest in the absence of treatment
Predictive MarkerSingle trait or signature of traits that identifies different groups of patients with respect to the outcome of interest in response to a particular treatment
5/20/2014 (MBSW)

7
Statistical Interactions
Marker
Res
pons
e
- +
No treatment
Treatment
Marker Effect
TreatmentTreatment Effect
Treatment by Marker Effect
Y = 0 + 1*M + 2*T + 3*M*T + 5/20/2014 (MBSW)
8
Types of Predictive Markers
Marker
Res
pons
e
- +No treatment
Treatment
Marker
Res
pons
e
- +No treatment
Treatment
Marker
Res
pons
e
- +
No treatment
Treatment
Marker
Res
pons
e
- +
No treatment
Treatment
5/20/2014 (MBSW)

9
Entire Population
Subgroup of Interest
Group size: 50%
M+
Trt response: -1.17Pl response: -0.09
Treatment effect: -1.08
x1 = 1 x1 = 0
M−
Entire Population
Group size: 25%
M+
Trt response: -1.39Pl response: -0.19
Treatment effect: -1.20
x1 = 1 x1 = 0
M−
x 2 =
1x 2
= 0
Trt response: -0.33Pl response: -0.20
Treatment effect: -0.13
Predictive Marker Example
5/20/2014 (MBSW)
Subgroup of Interest
Group size: 75%Trt response: -0.23Pl response: -0.13
Treatment effect: -0.1

10
BSID vs. “Traditional” Analysis
• Traditional subgroup analysiso Interaction testing, one at a timeo Many statistical issueso Many gaps for tailoring
• Biomarker and subgroup identification (BSID)o Utilizes modern statistical methodso Addresses issues with subgroup analysiso Maximizes tailoring opportunities
5/20/2014 (MBSW)

11
Simulation to Assess BSID Methods
ObjectiveConsistent, rigorous, and comprehensive calibration and comparison of BSID methods
Value• Further improve methodology
o Identify the gaps (where existing methods perform poorly)
o Synergy/combining ideas from multiple methods• Optimize application for specific clinical trials
5/20/2014 (MBSW)
12
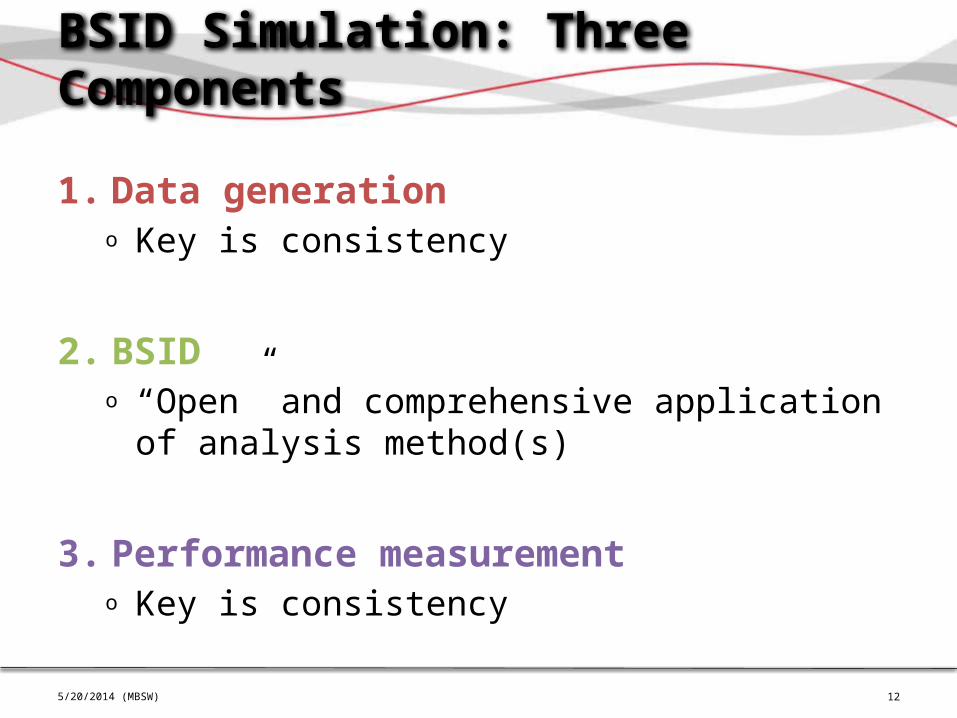
BSID Simulation: Three Components
1. Data generationo Key is consistency
2. BSIDo “Open” and comprehensive application of
analysis method(s)
3. Performance measuremento Key is consistency
5/20/2014 (MBSW)

13
Perf
orm
ance
M
easu
rem
ent
BSI
DD
ata
Gen
erat
ion
BSID Simulation: Visual Representation
5/20/2014 (MBSW)
Dataset 1
Results 1
Performance Metrics 1
Overall Performance
Metrics
Truth
Dataset 2
Results 2
Performance Metrics 2
Dataset …
Results …
Performance Metrics …
Dataset n
Results n
Performance Metrics n

14
Outline
1. Background2. Data Generation3. Performance Measurement4. Example5. Operationalization6. Conclusion
5/20/2014 (MBSW)

15
Data Generation
• Creating virtual trial datao Make assumptions in order to emulate real trial datao Knowledge of disease and therapies, including
historical datao Specific to BSID: must embed markers and
subgroups• In order to measure the performance of BSID
methodology the “truth” is neededo This is challenging/impossible to discern using real
trial data
5/20/2014 (MBSW)

16
Data Generation Survey
5/20/2014 (MBSW)
Attribute SIDES (2011)1 SIDES (2014)2 VT3 GUIDE4 QUINT5 IT6
n 900 300, 900 400 - 2000 100 200 - 1000 300, 450
p 5 - 20 20 - 100 15 - 30 100 5 - 20 4
response type continuous continuous binary binary continuous TTE
predictor type binary binary continuous categorical continuous ordinal, categorical
predictor correlation 0, 0.3 0, 0.2 0, 0.7 0 0, 0.2 0
treatment assignment 1:1 1:1 ? ~1:1 ~1:1 ?
# predictive markers 0 - 3 2 0, 2 0, 2 1 - 3 0, 2
predictive effect(s) higher order higher order higher order N/A, simple, higher order
simple, higher order simple
predictive M+ group size (% of n) 15% - 20% 50% N/A, ~25%, ~50% N/A, ~36% ~16% - ~50% N/A, ~25%, ?
# prognostic markers 0 0 3 0 - 4 1 - 3 0, 2
prognostic effect(s) N/A N/A simple, higher order N/A, simple, higher order
simple, higher order simple
“contribution model”logit model (w/o and with subject-specific effects
linear model (on probability
scale)“tree model” exponential
model

17
Data Generation: Recommendations
• Clearly identify attributes and modelso Transparencyo Traceability of analysis
• Make sure to capture the “truth” in a way that facilitates performance measurement
• Derive efficiency and synergistic value (more on this later!)
5/20/2014 (MBSW)

18
Data Generation: Specifics
• Identify key attributeso Sample sizeo Number of predictorso Response typeo Predictor type/correlationo Subgroup sizeo Sizes of effects: placebo response, overall treatment
effect, predictive effect(s), prognostic effect(s)o Others: Missing data, treatment assignment
• Specify model
5/20/2014 (MBSW)

19
Data Generation: Recommendations
• Clearly identify attributes and modelso Transparencyo Traceability of analysis
• Make sure to capture the “truth” in a way that facilitates performance measurement
• Derive efficiency and synergistic value (more on this later!)
5/20/2014 (MBSW)

20
Data Generation: Reqs
• Format data consistently• Make code flexible enough to accommodate
any/all attributes and models• Ensure that individual datasets can be
reproduced (i.e., various seeds for random number generation)
The resulting dataset(s) should always have the same look and feel
5/20/2014 (MBSW)

21
Outline
1. Background2. Data Generation3. Performance Measurement4. Example5. Operationalization6. Conclusion
5/20/2014 (MBSW)

22
Performance Measurement
• Quantifying the ability of BSID methodology to recapture the “truth” underlying the (generated) data
• If done consistently, allows calibration and comparison of BSID methods
5/20/2014 (MBSW)

23
Performance Measurement: Survey
5/20/2014 (MBSW)
SIDES (2011)1 VT3 GUIDE4 QUINT5SIDES (2014)2 IT6
Selection rate
Complete match rate
Partial match rate
Confirmation rate
Treatment effect fraction
Pr(complete match)
Pr(partial match)
Pr(selecting a subset)
Treatment effect fraction (updated def.)
Pr(selecting a superset)
Finding correct X’s
Closeness of to the true
Closeness of the size of to the size of the
true
Properties of as an estimator
of
Power
Pr(selection at 1st or 2nd
level splits of trees)
Accuracy
Pr(nontrivial tree)
(RP1a) Pr(type I errors)
(RP1b) Pr(type II errors)
(RP2) Rec. of tree
complexity
(RP4) Rec. of assignments of observations to
partition classes
(RP3) Rec. of splitting vars
and split points.
Frequencies of the final tree sizes
Bias assessment via likelihood
ratio and logrank tests
Frequency of (predictor)
“hits”

24
Marker Level
Subject Level
Subgroup Level
Performance Measurement: Recommendations
5/20/2014 (MBSW)
predictionestimation
testing

25
SIDES (2011)1 VT3 GUIDE4 QUINT5SIDES (2014)2 IT6
Selection rate
Complete match rate
Partial match rate
Confirmation rate
Treatment effect fraction
Pr(complete match)
Pr(partial match)
Pr(selecting a subset)
Treatment effect fraction (updated def.)
Pr(selecting a superset)
Finding correct X’s
Closeness of to the true
Closeness of the size of to the size of the
true
Properties of as an estimator
of
Power
Pr(selection at 1st or 2nd
level splits of trees)
Accuracy
Pr(nontrivial tree)
(RP1a) Pr(type I errors)
(RP1b) Pr(type II errors)
(RP2) Rec. of tree
complexity
(RP4) Rec. of assignments of observations to
partition classes
(RP3) Rec. of splitting vars
and split points.
Frequencies of the final tree sizes
Bias assessment via likelihood
ratio and logrank tests
Frequency of (predictor)
“hits”
Perf. Measurement: Survey Revisited
5/20/2014 (MBSW)
SIDES (2011)1
VT3
GUIDE4
QUINT5SIDES (2014)2
IT6
Selection rate
Complete match rate
Partial match rate
Confirmation rate
Treatment effect fraction
Pr(complete match)
Pr(partial match)
Pr(selecting a subset)
Treatment effect fraction (updated def.)
Pr(selecting a superset)
Finding correct X’s
Closeness of to the true
Properties of as an estimator
of
Closeness of the size of to the size of the
true
Power
Pr(selection at 1st or 2nd
level splits of trees)
Accuracy
Pr(nontrivial tree)
(RP1a) Pr(type I errors)
(RP1b) Pr(type II errors)
(RP2) Rec. of tree
complexity (RP4) Rec. of assignments of observations to
partition classes
(RP3) Rec. of splitting vars
and split points.
Frequencies of the final tree sizes
Bias assessment via likelihood
ratio and logrank tests
Frequency of (predictor)
“hits”
Marker Level Subgroup Level Subj. Level
(testing)
(estimation) (prediction)

26
Contingency Table: Marker Level
5/20/2014 (MBSW)
Predictive BiomarkerId
entif
ied
as
Pred
ictiv
eTrue False
No
Yes True
PositiveFalse
Positive
True Negative
False Negative
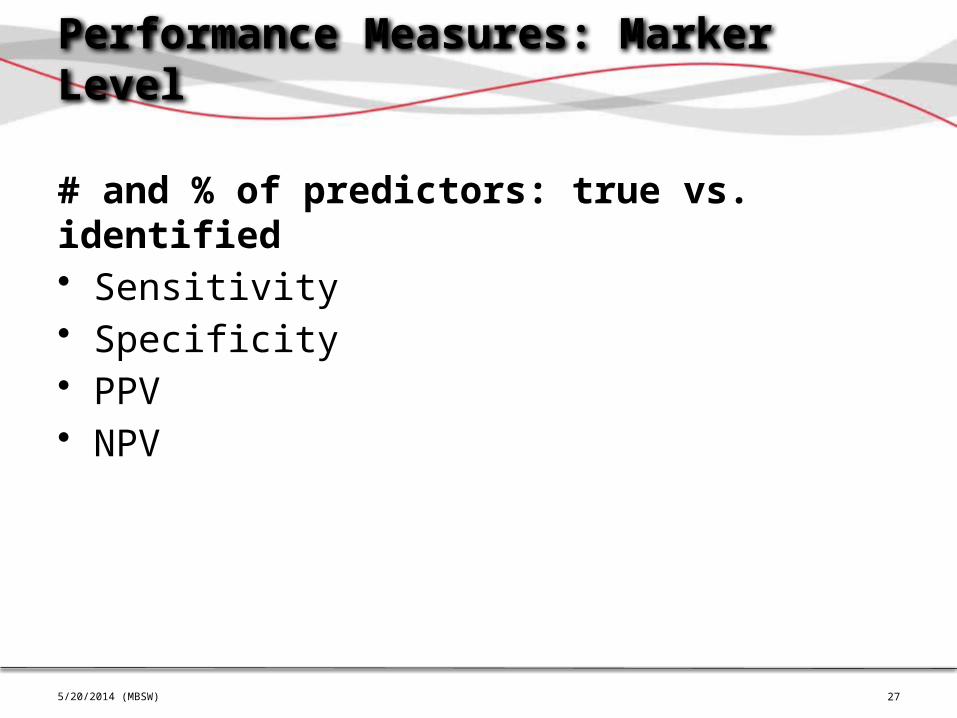
• Sensitivity = True Positive / True Predictive Biomarkers• Specificity = True Negative / False Predictive Biomarkers• PPV = True Positive / Identified as Predictive• NPV = True Negative / Not Identified as Predictive
27
Performance Measures: Marker Level
# and % of predictors: true vs. identified• Sensitivity• Specificity• PPV• NPV
5/20/2014 (MBSW)

28
Performance Measures: Subgroup Level
• Size of identified subgroup• Treatment effect in the identified subgroup
o Average the true “individual” treatment effects under potential outcomes framework
• Accuracy of estimated treatment effecto Difference (both absolute and direction) between
estimate and true effect
5/20/2014 (MBSW)

29
Perf. Measures: Subgroup Level, cont.
• Implications on sample size/time/cost of future trialso Given true treatment effect, what is the number of
subjects needed in the trial for 90% power?o What is the cost of the trial? (mainly driven by #
enrolled)o How much time will the trial take? (mainly driven
by # screened)
5/20/2014 (MBSW)

30
Contingency Table: Subject Level
5/20/2014 (MBSW)
Mem
bers
hip
Cla
ssifi
catio
n
Potential to Realize Enhanced Treatment Effect*
True FalseM
-M
+ True Positive
False Positive
True Negative
False Negative
• Sensitivity = True Positive / True Enhanced Treatment Effect• Specificity = True Negative / False Enhanced Treatment Effect• PPV = True Positive / Classified as M+ • NPV = True Negative / Classified as M-
*at a meaningful or desired level

31
Performance Measures: Subject Level
Compare subgroup membership on the individual level: true vs. identified• Sensitivity• Specificity• PPV• NPV
5/20/2014 (MBSW)

32
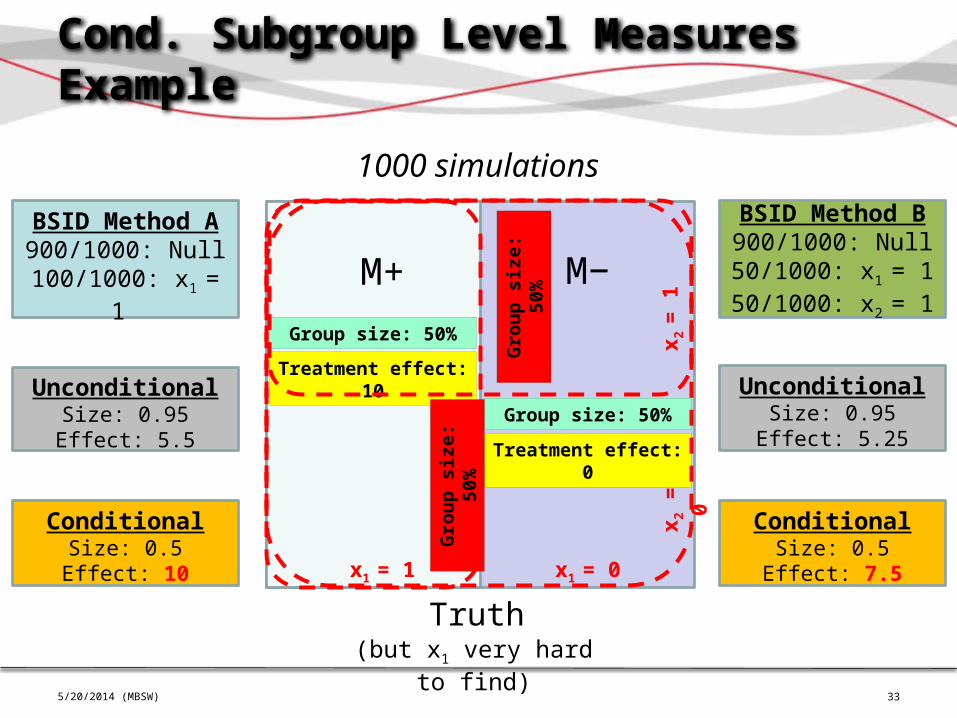
Conditional Performance Measures
• Same metrics with Null submissions removed
Markers/subgroups can be very difficult to find. When a method DOES find something, how accurate is it?
Hard(er) to compare multiple methods when all performance measures are washed out by Null submissions
5/20/2014 (MBSW)
33
Cond. Subgroup Level Measures Example
5/20/2014 (MBSW)
M+
Treatment effect: 10
x1 = 1 x1 = 0
M−
Treatment effect: 0
Group size: 50%
Group size: 50%
x 2 =
1x 2
= 0
BSID Method A900/1000: Null
100/1000: x1 = 1
Truth(but x1 very hard to find)
1000 simulationsBSID Method B900/1000: Null50/1000: x1 = 1 50/1000: x2 = 1
UnconditionalSize: 0.95Effect: 5.5
UnconditionalSize: 0.95
Effect: 5.25
ConditionalSize: 0.5Effect: 10
ConditionalSize: 0.5
Effect: 7.5
Gro
up s
ize:
50%
Gro
up s
ize:
50%

34
Performance Measurement: Reqs
For each application of BSID user proposes:• List of predictive biomarkers• The one subgroup for designing the next study• Estimated treatment effect in this subgroup
In conjunction with the “truth” underlying the generated data, all of the recommended performance measures can be calculated using these elements
5/20/2014 (MBSW)

35
Considering the “Three Levels”
What are the most important and relevant measures of a result? Depends on the objective…
5/20/2014 (MBSW)
Marker Level
Invest further in
the marker(s)
Subgroup Level
Tailor the next
study/design
Subject Level
Impact in clinical practice
36
Outline
1. Background2. Data Generation3. Performance Measurement4. Example5. Operationalization6. Conclusion
5/20/2014 (MBSW)

37
Data Generation Example
5/20/2014 (MBSW)
Attribute Valuesimulations (datasets) 200
n 240
p 20
response type continuous ( errors)
predictor type ordinal (“genetic”)
predictor correlation 0
treatment assignment 1:3 (pl:trt)
placebo response -0.1 (in weakest responding subgroup)
treatment effect -0.1 (in weakest responding subgroup)
# predictive markers 1
predictive effect size(s) (type) -0.45 (dominant)
predictive M+ group size ~50% of n
# prognostic markers 0
prognostic effect size(s) N/A
linear model

38
Data Generation Example, cont.
5/20/2014 (MBSW)

39
Data Generation Example, concl.
5/20/2014 (MBSW)
Dataset 1Trt 0: -0.141Trt 1: -0.407Effect: -0.266
x_1_1_1
- +-0.5
-0.45-0.4
-0.35-0.3
-0.25-0.2
-0.15-0.1
-0.050
trt 0trt 1
Dataset 21Trt 0: -0.018Trt 1: -0.427Effect: -0.409
- +-0.5
-0.45-0.4
-0.35-0.3
-0.25-0.2
-0.15-0.1
-0.050
trt 0trt 1
x_1_1_1

40
BSID Methods Applied to Example
5/20/2014 (MBSW)
Alpha controlled at 0.1
Approach Traditional Virtual Twin3 TSDT7
Handling treatment-by-subgroup interaction Model Transformation Sequential
Searching for candidate subgroups Exhaustive Recursive Partitioning Recursive Partitioning
Addressing multiplicity Simple (Sidak Correction)
Permutation Sub-sampling + Permutation

41
Performance Measurement Example
5/20/2014 (MBSW)
Truth Proposal+
= Performance Measures

42
Perf. Measurement Example, cont.
5/20/2014 (MBSW)

43
Perf. Measurement Example, concl.
5/20/2014 (MBSW)
Measure Traditional Virtual Twin3 TSDT7
Marker Level Uncond. Cond. Uncond. Cond. Uncond. Cond.
Sensitivity 0.025 0.227 0.135 0.614 0.39 0.929
Specificity 0.995 0.957 0.996 0.980 0.998 0.996
PPV 0.227 0.227 0.614 0.614 0.929 0.929
NPV 0.951 0.959 0.957 0.980 0.969 0.996
Subgroup Level
Non-Identification (Null) 89% 78% 58%
Subgroup Size 93.6% 41.4% 88.8% 48.9% 79.2% 50.4%
Trt Effect in Subgroup -0.335 -0.388 -0.359 -0.466 -0.416 -0.535
Subject Level
Sensitivity 0.947 0.518 0.956 0.798 0.986 0.966
Specificity 0.076 0.689 0.180 0.820 0.406 0.966
PPV 0.523 0.639 0.576 0.814 0.702 0.967
NPV 0.592 0.592 0.805 0.805 0.965 0.965

44
Outline
1. Background2. Data Generation3. Performance Measurement4. Example5. Operationalization6. Conclusion
5/20/2014 (MBSW)
45
Strategy
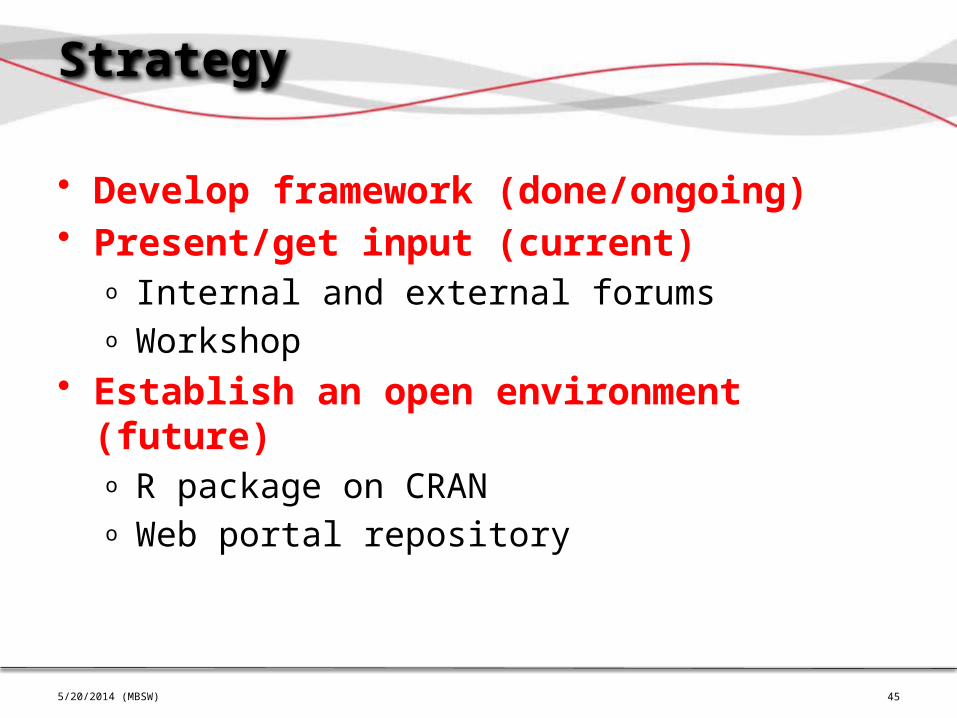
• Develop framework (done/ongoing)• Present/get input (current)
o Internal and external forumso Workshop
• Establish an open environment (future)o R package on CRANo Web portal repository
5/20/2014 (MBSW)

46
Predictive Biomarker Project: Vision
• Access Web Portalo Reads open description (objective, models, formats etc.)
• Access web interface for Data Generationo Generate data under specified scenarios, or utilize
“standard”/pre-existing scenarios• Apply BSID methodology to datasets
o Express results in the specified format• Access web interface for Performance Measurement
o Compare performance• Encouraged to contribute to Repository
o Open sharing of results, descriptions, programs
5/20/2014 (MBSW)
47
Pros and Cons
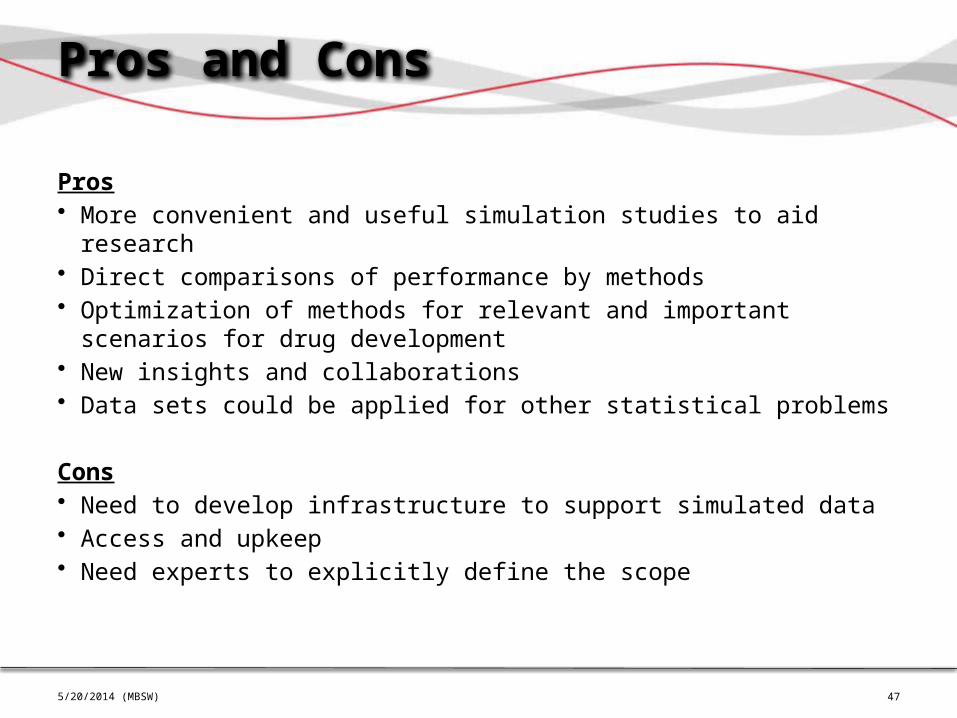
Pros• More convenient and useful simulation studies to aid research• Direct comparisons of performance by methods• Optimization of methods for relevant and important scenarios for
drug development• New insights and collaborations• Data sets could be applied for other statistical problems
Cons• Need to develop infrastructure to support simulated data• Access and upkeep• Need experts to explicitly define the scope
5/20/2014 (MBSW)

48
Outline
1. Background2. Data Generation3. Performance Measurement4. Example5. Operationalization6. Conclusion
5/20/2014 (MBSW)

49
Conclusion
• Simulation studies are a common approach to assessing BSID methods but there is a lack of consistency in data generation and performance measurement
• The presented framework enables consistent, rigorous, comprehensive calibration and comparison of BSID methods
• Collaborating on this effort will result in efficiency and synergistic value
5/20/2014 (MBSW)

50
Acknowledgements
• Richard Zink• Lei Shen• Chakib Battioui• Steve Ruberg• Ying Ding• Michael Bell
5/20/2014 (MBSW)

51
References
1. Lipkovich I, Dmitrienko A, Denne J, Enas, G. Subgroup identification based on differential effect search — a recursive partitioning method for establishing response to treatment in patient subpopulations. Statistics in Medicine 2011; 30:2601–2621. doi:10.1002/sim.4289.
2. Lipkovich I, Dmitrienko A. Strategies for Identifying Predictive Biomarkers and Subgroups with Enhanced Treatment Effect in Clinical Trials Using SIDES. Journal of Biopharmaceutical Statistics 2014; 24:130-153. doi:10.1080/10543406.2013.856024.
3. Foster JC, Taylor JMG, Ruberg SJ. Subgroup identification from randomized clinical trial data. Statistics in Medicine 2011; 30:2867–2880. doi:10.1002/sim.4322.
4. Loh, WY, He X, Man M. A regression tree approach to identifying subgroups with differential treatment effects. Presented at Midwest Biopharmaceutical Statistics Workshop 2014.
5. Dusseldorp E, Van Mechelen I. Qualitative interaction trees: a tool to identify qualitative treatment-subgroup interactions. Statistics in Medicine 2014; 33:219–237. doi:10.1002/sim.5933.
6. Su X, Zhou T, Yan X, Fan J, Yang S. Interaction trees with censored survival data. International Journal of Biostatistics 2008; 4(1):Article 2. doi:10.2202/1557-4679.1071.
7. Battioui C, Shen L, Ruberg S. A Resampling-based Ensemble Tree Method to Identify Patient Subgroups with Enhanced Treatment Effect. Proceedings of the 2013 Joint Statistical Meetings.
8. Zink R, Shen L, Wolfinger R, Showalter H. Assessment of Methods to Identify Patient Subgroups with Enhanced Treatment Response in Randomized Clinical Trials. Presented at the 2013 ICSA Applied Statistical Symposium.
9. Shen L, Ding Y, Battioui C. A Framework of Statistical Methods for Identification of Subgroups with Differential Treatment Effects in Randomized Trials. Presented at the 2013 ICSA Applied Statistical Symposium.
5/20/2014 (MBSW)

52
Backup Slides
5/20/2014 (MBSW)

53
Data Generation: SIDES (2011)1
5/20/2014 (MBSW)
Attribute Valuesimulations (datasets) 5000
n 900 (then divided into 3 equal – 1 training, 2 test)
p 5, 10, 20
response type continuous ( errors)
predictor type binary (dichotomized from continuous)
predictor correlation 0, 0.3
treatment assignment 1:1 (pl:trt)
placebo response 0
treatment effect 0
# predictive markers 0, 1, 2, 3*
predictive effect size(s) not explicitly stated
predictive M+ group size 15% - 20% of n (but not explicitly stated)
# prognostic markers 0
prognostic effect size(s) N/A
model “contribution model”

54
Data Generation: SIDES (2014)2
5/20/2014 (MBSW)
Attribute Scenario 1 Scenario 2 Scenario 3 Scenario 4
simulations (datasets) 10000 10000 10000 10000
n 300 300 900 900
p 20, 60, 100 20, 60, 100 20, 60, 100 20, 60, 100
response type continuous ( errors) continuous ( errors) continuous ( errors) continuous ( errors)
predictor type binary (dichotomized from continuous)
binary (dichotomized from continuous)
binary (dichotomized from continuous)
binary (dichotomized from continuous)
predictor correlation 0 0.2* 0 0.2*
treatment assignment 1:1 (pl:trt) 1:1 (pl:trt) 1:1 (pl:trt) 1:1 (pl:trt)
placebo response 0 0 0 0
treatment effect 0 0 0 0
# predictive markers 2** 2** 2** 2**
predictive effect size(s) 0.35 0.35 0.6 0.6
predictive M+ group size
0.5 * n = 150 0.5 * n = 150 0.5 * n = 450 0.5 * n = 450
# prognostic markers 0 0 0 0
prognostic effect size(s) N/A N/A N/A N/A
model “contribution model” “contribution model” “contribution model” “contribution model”

55
Data Generation: Virtual Twins3
5/20/2014 (MBSW)
Attribute Null Base Modifications*
simulations (datasets) 100 100
n 1000 1000 400 and 2000
p 15 15 30
response type binary binary
predictor type continuous ( errors) continuous ( errors)
predictor correlation 0 0 0.7**
treatment assignment ? ?
placebo response -1 -1
treatment effect 0.1 0.1
# predictive markers 0 2
predictive effect size(s) 0 0.9 for X1*X2 1.5 for X1*X2
predictive M+ group size N/A ~0.25 * n = ~250 ~0.5 * n = ~500
# prognostic markers 3 3
prognostic effect size(s) 0.5, 0.5, -0.5 for X1, X2, X70.5 for X2*X7
0.5, 0.5, -0.5 for X1, X2, X70.5 for X2*X7
model logit model logit model logit model with subject-specific effects ai and (ai, bi)
56
Data Generation: GUIDE4
5/20/2014 (MBSW)
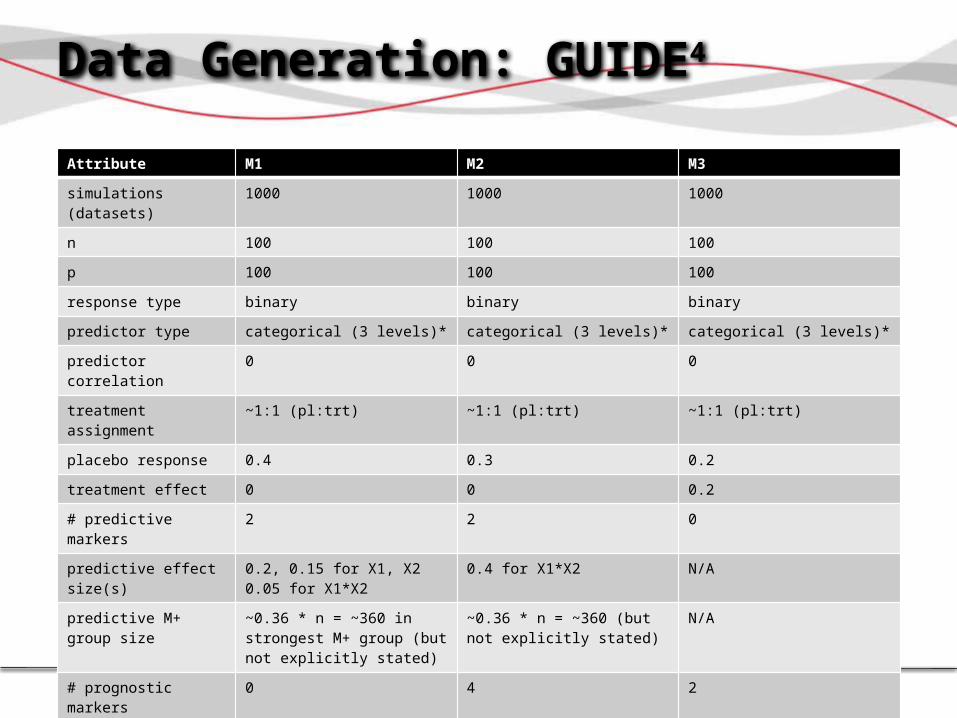
Attribute M1 M2 M3
simulations (datasets) 1000 1000 1000
n 100 100 100
p 100 100 100
response type binary binary binary
predictor type categorical (3 levels)* categorical (3 levels)* categorical (3 levels)*
predictor correlation 0 0 0
treatment assignment ~1:1 (pl:trt) ~1:1 (pl:trt) ~1:1 (pl:trt)
placebo response 0.4 0.3 0.2
treatment effect 0 0 0.2
# predictive markers 2 2 0
predictive effect size(s) 0.2, 0.15 for X1, X20.05 for X1*X2
0.4 for X1*X2 N/A
predictive M+ group size
~0.36 * n = ~360 in strongest M+ group (but not explicitly stated)
~0.36 * n = ~360 (but not explicitly stated)
N/A
# prognostic markers 0 4 2
prognostic effect size(s) N/A 0.2 for X3, X4-0.2 for X1*X2
0.2 for X1, X2
model linear model (on probability scale)
linear model (on probability scale)
linear model (on probability scale)

57
Data Generation: QUINT5
5/20/2014 (MBSW)
Attribute Model A Model B*** Model C*** Model D*** Model E
simulations (datasets) 100 100 100 100 100
n 200, 300, 400, 500, 1000
200, 300, 400, 500, 1000
200, 300, 400, 500, 1000
200, 300, 400, 500, 1000
200, 300, 400, 500, 1000
p 5, 10, 20 5, 10, 20 5, 10, 20 5, 10, 20 5, 10, 20
response type continuous* continuous* continuous* continuous* continuous*
predictor type continuous (multivariate normal)**
continuous (multivariate normal)**
continuous (multivariate normal)**
continuous (multivariate normal)**
continuous (multivariate normal)**
predictor correlation 0, 0.2 0, 0.2 0, 0.2 0, 0.2 0, 0.2
treatment assignment ~1:1 (trt 1:trt 2) ~1:1 (trt 1:trt 2) ~1:1 (trt 1:trt 2) ~1:1 (trt 1:trt 2) ~1:1 (trt 1:trt 2)
treatment 1 response 20*** 20*** 20*** 18.33*** 30***
treatment 2 effect -2.5, -5, -10*** -2.5, -5, -10*** -2.5, -5, -10*** -2.5, -5, -10*** 0***
# predictive markers 1 2 3 3 1
predictive effect size(s) 5, 10, 20*** 5, 10, 20*** 5, 10, 20*** 5, 10, 20*** 2.5, 5, 10***
predictive M+ group size ~0.16 * n (but not explicitly stated)***
~0.16 * n (but not explicitly stated)***
~0.38 * n (but not explicitly stated)***
~0.16 * n (but not explicitly stated)***
~0.5 * n (but not explicitly stated)***
# prognostic markers 1*** 2*** 3*** 3*** 1***
prognostic effect size(s) 20*** 20*** 20*** 21.67*** 10***
model “tree model” “tree model” “tree model” “tree model” “tree model”

58
Data Generation: Interaction Trees6
5/20/2014 (MBSW)
Attribute Model A Model B Model C Model D
simulations (datasets) 100 100 100 100
n 450 test sample method (300 for learning sample, 150 for validation sample), 300 bootstrap method
450 test sample method (300 for learning sample, 150 for validation sample), 300 bootstrap method
450 test sample method (300 for learning sample, 150 for validation sample), 300 bootstrap method
450 test sample method (300 for learning sample, 150 for validation sample), 300 bootstrap method
p 4 4 4 4
response type TTE (censoring rates = 0%, 50%)
TTE (censoring rates = 0%, 50%)
TTE (censoring rates = 0%, 50%)
TTE (censoring rates = 0%, 50%)
predictor type ordinal for X1 and X3, categorical for X2 and X4
ordinal for X1 and X3, categorical for X2 and X4
ordinal for X1 and X3, categorical for X2 and X4
ordinal for X1 and X3, categorical for X2 and X4
predictor correlation 0 0 0 0
treatment assignment ? ? ? ?
placebo response 0.135 0.135 0.135 0.135
treatment effect 2* 2* 2* 2*
# predictive markers 0 2 2 2
predictive effect size(s) N/A 0.223 for X1*4.482 for X2*
0.741 to 0.050 for X1* **1.350 to 20.086 for X2* **
0.5 for X1*2 for X2*
predictive M+ group size N/A ~0.25 * n in strongest M+ group (but not explicitly stated)
not explicitly stated** ~0.25 * n in strongest M+ group (but not explicitly stated)
# prognostic markers 2 0 0 0
prognostic effect size(s) 0.223 for X1*4.482 for X2*
N/A N/A N/A
model exponential model exponential model exponential model exponential model

59
Perf. Measurement: SIDES (2011)1
• Selection rate, that is, the proportion of simulation runs in which >1 subgroup was identified.o Complete match rate: Proportion of simulation runs in which the ideal subgroup
was selected as the top subgroup (computed over the runs when at least one subgroup was selected).
o Partial match rate: Proportion of simulation runs in which the top subgroup was a subset of the ideal subgroup (computed over the runs when at least one subgroup was selected).
• Confirmation rate, that is, the proportion of simulation runs that yielded a confirmed subgroup (which is not necessarily identical to the ideal subgroup). In each run, the top subgroup was identified in terms of the treatment effect p-value in the training data set (if at least one subgroup was selected). The subgroup was classified as ‘confirmed’ if the treatment effect in this subgroup was significant at a two-sided 0.05 level in both test data sets.
• Treatment effect fraction defined as the fraction of the treatment effect (per patient) in the ideal group, which was retained in the top selected or confirmed subgroup. The fraction was defined as follows:
5/20/2014 (MBSW)

60
Perf. Measurement: SIDES (2014)2
• Probability of a complete match• Probability of a partial match
o Probability of selecting a subseto Probability of selecting a superset
• Treatment effect fraction (updated definition, not weighted by group sizes):
5/20/2014 (MBSW)

61
Perf. Measurement: Virtual Twins3
• Finding correct X’s• Closeness of to the true . This is measured
using sensitivity, specificity, positive predictive value (PPV), negative predictive value (NPV), and area under the ROC curve (AUC).
• Closeness of the size of to the size of the true • Power. Another quantity of interest is the
percentage of times methods find a null when and when .
• Properties of as an estimator of
5/20/2014 (MBSW)

62
Performance Measurement: GUIDE4
• Probabilities that (predictive markers) are selected at first and second level splits of trees
• Accuracy. Let n(t, y, z) denote the number of training samples in node t with Y = y and Z = z and define n(t,+, z) = and nt =. Let be the subgroup defined by t. The value of is estimated by = |n(t, 1, 1)/n(t,+, 1) − n(t, 1, 0)/n(t,+, 0)|. The estimate of is the subgroup such that is maximum among all terminal nodes. If is not unique, is taken as their union. The “accuracy” of is defined to be / if and 0 otherwise.⊂
• Pr(nontrivial tree)
5/20/2014 (MBSW)

63
Performance Measurement: QUINT5
• (RP1a) Probability of type I errors• (RP1b) Probability of type II errors• (RP2) Recovery of tree complexity. Given an underlying true
tree with a qualitative treatment–subgroup interaction that has been correctly detected, the probability of successfully identifying the complexity of the true tree.
• (RP3) Recovery of splitting variables and split points. Given an underlying true tree with a qualitative treatment–subgroup interaction that has been correctly detected, probability of recovering the true tree in terms of the true splitting variables and the true split points
• (RP4) Recovery of the assignments of the observations to the partition classes
5/20/2014 (MBSW)

64
Perf. Measurement: Interaction Trees6
• Frequencies of the final tree sizes• Frequency of (predictor) “hits”• Bias assessment: the following were calculated for
the pooled training and test samples and the validation samples o the likelihood ratio test (LRT) for overall interactiono the logrank test for treatment effect within the terminal
node that showed maximal treatment efficacy(for presentation convenience, the logworth of the p-value, which is defined as -log10 (p-value), was used).
5/20/2014 (MBSW)

65
Predictive Biomarker Project
Data Generation
• Web interface• Standard
datasets
BSID
• Open methods• Standard
output
Performance Measurement
• Web interface• Standard
summary
5/20/2014 (MBSW)