consistent features in the forelimb representation of ... · consistent features in the forelimb...
TRANSCRIPT
Consistent Features in the Forelimb Representation of PrimaryMotor Cortex in Rhesus Macaques
Michael C. Park,1 Abderraouf Belhaj-Saıf,1 Michael Gordon,2 and Paul D. Cheney1
1Department of Molecular and Integrative Physiology and Mental Retardation Research Center, and 2Departments ofPharmacology and Surgery, University of Kansas Medical Center, Kansas City, Kansas 66160
The purpose of this study was to systematically map the forelimbarea of primary motor cortex (M1) in rhesus macaques in an effortto investigate further the organization of motor output to distal andproximal muscles. We used stimulus-triggered averaging (StTAing)of electromyographic activity to map the cortical representation of24 simultaneously recorded forelimb muscles. StTAs were ob-tained by applying 15 mA stimuli to M1 sites while the monkeyperformed a reach and prehension task. Motor output to bodyregions other than the forelimb (e.g., face, trunk, and hindlimb)was identified using repetitive intracortical microstimulation toevoke movements. Detailed, muscle-based maps of M1 revealeda central core of distal (wrist, digit, and intrinsic hand) musclerepresentation surrounded by a “horseshoe”-shaped zone ofproximal (shoulder and elbow) muscle representation. The core
distal and proximal zones were separated by a relatively largeregion representing combinations of both distal and proximalmuscles. On the basis of its size and characteristics, we argue thatthis zone is not simply the result of stimulus-current spread, butrather a distinct zone within the forelimb representation containingcells that specify functional synergies of distal and proximal mus-cles. Electrode tracks extending medially from the medial arm ofthe proximal muscle representation evoked trunk and hindlimbresponses. No distal or proximal muscle poststimulus effects werefound in this region. These results argue against the existence of asecond, major noncontiguous distal or proximal forelimb repre-sentation located medially within the macaque M1 representation.
Key words: forelimb; muscles; stimulus-triggered averaging;poststimulus facilitation; EMG; macaque; primary motor cortex
Using intracortical microstimulation (ICMS) (Asanuma andSakata, 1967) to evoke movements or electromyographic (EMG)responses in monkeys, several studies have described a centralcore of distal forelimb muscle representation surrounded by aproximal forelimb muscle representation in the primary motorcortex (M1) (Kwan et al., 1978a,b; Strick and Preston, 1978,1982a; Gould et al., 1986; Hepp-Raymond, 1988; Nudo et al.,1992, 1996; Stepniewska et al., 1993; Karrer et al., 1995; Nudo andMilliken, 1996). In macaque monkeys, Kwan et al. (1978a,b)concluded that the M1 representation of forelimb muscles isorganized as concentric rings in which the intrinsic hand musclesare represented as a central core surrounded by rings of increas-ing diameter representing the wrist, elbow, and shoulder muscles.
After injecting the fluorescent tracers fast blue and diamidinoyellow into different segmental levels of spinal cord in pig-tailedmacaques to label forelimb corticospinal neurons supplying prox-imal (C2–C4 injections) and distal (C7–T1 injections) motoneu-ron pools, He et al. (1993) found evidence consistent with theexistence of a central core of distal (wrist, digit, and intrinsichand) muscle representation, largely contained within the wall ofthe precentral gyrus, surrounded by a “horseshoe”-shaped prox-imal (shoulder and elbow) muscle representation that was open atthe area 3a/4 boundary. In addition, they suggested the existenceof noncontiguous second representations of distal and proximalforelimb muscles in M1 (He et al., 1993, their Fig. 18). These
second representations appeared to be located medial to themedial arm of the core proximal forelimb representation. How-ever, there currently is no electrophysiological evidence of majornoncontiguous distal and proximal forelimb representationswithin M1 of macaque monkeys. Multiple representations havebeen demonstrated electrophysiologically within the core primarydistal forelimb representation in squirrel monkeys as alternatingbands of wrist and digit muscles with differing sensory input. Thecaudal bands of wrist and digit representation receive inputpredominantly from cutaneous receptors, whereas the rostralbands receive input from deep receptors (Strick and Preston,1978, 1982a,b).
Therefore, the purpose of this study was to systematicallymap the forelimb area of M1 in an effort to further investigatemotor output organization and the issue of multiple noncon-tiguous representations of distal and proximal muscles. Tomaximize the potential for detecting multiple representations,we recorded EMG activity from 24 different forelimb musclessimultaneously while the monkey performed a movement task(Park et al., 2000). Stimulus-triggered averaging (StTAing) ofEMG activity was used to detect the latency and strength ofoutput effects on individual muscles (Cheney and Fetz, 1985;Cheney, 1996). The resulting motor output maps of M1 show acentral core of distal muscle representation surrounded by ahorseshoe-shaped proximal muscle representation, confirmingthe findings from corticospinal labeling studies (He et al.,1993). However, there was no evidence of a second, majordistal or proximal forelimb representation within M1 of rhesusmacaques. In addition, a large zone producing effects in bothproximal and distal muscles separated the pure distal musclecore from the surrounding pure proximal muscle zone.
Received July 31, 2000; revised Jan. 16, 2001; accepted Jan. 24, 2001.This work was supported by National Institute of Neurological Disorders and
Stroke Grant NS39023 and National Institute of Child Health and Human Devel-opment Grant HD02528.
Correspondence should be addressed to Dr. Paul D. Cheney, Mental RetardationResearch Center, University of Kansas Medical Center, Kansas City, KS 66160-7336. E-mail: [email protected] © 2001 Society for Neuroscience 0270-6474/01/212784-09$15.00/0
The Journal of Neuroscience, April 15, 2001, 21(8):2784–2792

MATERIALS AND METHODSBehavioral task. Data were collected from two male rhesus monkeys(Macaca mulatta; ;9 kg, 6 years old). The monkeys were trained toperform a reach and prehension task requiring coactivation of multipleproximal and distal forelimb muscles in natural, functional synergies.Training procedures and the behavioral task have been described indetail previously (Belhaj-Saıf et al., 1998; McKiernan et al., 1998).Briefly, during each data collection session, the monkey was seated in acustom primate chair and placed in a sound-attenuating chamber. Theleft forelimb of the monkey was restrained during task performance,whereas the right forelimb had freedom of movement. The monkey wasguided in performance of the task by audio and video cues provided byan IBM-compatible computer. The monkey initiated the task by placingits right hand on a pressure plate located at waist height directly in frontof him. Having the hand on the plate for a preprogrammed length of timetriggered the release of a food reward and a “go” signal. The monkeythen reached out to a small food well located at shoulder level, a little lessthan one arm length away and oriented ;20° from vertical. The monkeyused a precision grip to extract a food pellet from the well and bring thepellet to its mouth. The task was completed by returning the hand to thepressure plate.
Surg ical procedures. On completion of training, each monkey wasimplanted with a cortical recording chamber and EMG electrodes. Forall implant surgeries, the monkeys were tranquilized initially with ket-amine, administered atropine, and subsequently anesthetized withisoflurane gas. Both monkeys received prophylactic antibiotic before andafter surgery and analgesic medication postoperatively (Park et al., 2000).All surgeries were performed in a facility accredited by the Associationfor Assessment and Accreditation of Laboratory Animal Care using fullsterile procedures. All procedures conformed to the Guide for the Careand Use of Laboratory Animals, published by the United States Depart-ment of Health and Human Services and the National Institutes ofHealth.
A magnetic resonance imaging (MRI)-compatible plastic chamberallowing exploration of a 30-mm-diameter area (see Fig. 3 A, B) wasstereotaxically implanted over the forelimb area on the left hemisphere
of each monkey as described previously (Kasser and Cheney, 1985;Mewes and Cheney, 1991; McKiernan et al., 1998). The chambers werecentered at anterior 21.6 mm, lateral 11.4 mm (monkey M), and anterior16.0 mm, lateral 7.4 mm (monkey D), at a 30° angle to the midsagittalplane. For MRI compatibility, titanium screws (Bioplate, Los Angeles,CA) and titanium restraining nuts (McMaster-Carr, Chicago, IL) wereused. In addition, a titanium screw (Synthes, Monument, CO) in contactwith the dura served as a reference ground for electrophysiology.
EMG activity from 24 muscles of the forelimb was recorded using pairsof multistranded stainless steel wires (Cooner Wire, Chatsworth, CA)implanted during a sterile surgical operation. One monkey was implantedusing a modular subcutaneous implant technique, and the other wasimplanted using a cranial subcutaneous implant technique. These pro-cedures were described in detail previously by Park et al. (2000). Briefly,for both techniques, pairs of wires for each muscle were tunneledsubcutaneously to their target muscles. The modular subcutaneous im-plant technique used four connector (ITT Canon, New Britain, CT)modules, two placed above and two below the elbow. The cranial sub-cutaneous implant technique used one circular connector (Wire Pro Inc.,Salem, NJ) module placed near the cortical recording chamber. The wireinsertion points for specific muscles were identified on the basis ofexternal landmarks and palpation of the muscle belly. The wires of eachpair were bared of insulation for ;2 mm at the tip and inserted into themuscle with a separation of ;5 mm. We tested proper placement bystimulating electrically through the wires with short trains or singlepulses while observing the evoked movements. The wires were removedand reinserted if necessary.
EMGs were recorded from five shoulder muscles: pectoralis major(PEC), anterior deltoid (ADE), posterior deltoid (PDE), teres major(TMAJ), and latissimus dorsi (LAT); seven elbow muscles: biceps shorthead (BIS), biceps long head (BIL), brachialis (BRA), brachioradialis(BR), triceps long head (TLON), triceps lateral head (TLAT), anddorso-epitrochlearis (DE); five wrist muscles: extensor carpi radialis(ECR), extensor carpi ulnaris (ECU), flexor carpi radialis (FCR), flexorcarpi ulnaris (FCU), and palmaris longus (PL); five digit muscles: ex-tensor digitorum communis (EDC), extensor digitorum 2 and 3 (ED23),
Figure 1. Examples of stimulus-triggered aver-ages of rectified EMG activity (15 mA at 15 Hz)illustrating the criteria used for categorizing thestrength of poststimulus facilitation (PStF ) ef-fects. Time 0 corresponds to the stimulus eventused as a trigger for averaging. A pretriggerperiod of 12.5 msec (baseline) was used to de-termine mean baseline activity (mean) and SDfor each average. A, Peaks ,2 SD of baselineand peaks that remained .2 SD for ,0.75 msecperiod were considered insignificant, and theaverage was categorized as having no effect. B,Weak effects had peaks .2 SD of mean baselineactivity but #5 SD of mean baseline activity. C,Moderate and strong effects had peaks .5 SDof mean baseline activity. LAT, Latissimus dor-si; FDI, first dorsal interosseus; APB, abductorpollicis brevis. The number of trigger events isgiven in parentheses.
Park et al. • Forelimb Representation in M1 J. Neurosci., April 15, 2001, 21(8):2784–2792 2785

extensor digitorum 4 and 5 (ED45), flexor digitorum superficialis (FDS),and flexor digitorum profundus (FDP); and two intrinsic hand muscles:abductor pollicis brevis (APB) and first dorsal interosseus (FDI). Atregular intervals, the monkeys were tranquilized with ketamine, and theimplants were tested to confirm electrode location.
Data recording. For cortical recording and stimulation, we used glass-and mylar-insulated platinum–iridium electrodes with typical imped-ances between 0.7 and 1.5 MV (Frederick Haer & Co., Bowdoinham,ME). Electrode penetrations were made systematically in precentral andpostcentral cortex in a 1 mm grid interval. In some areas, electrode trackswere placed in the center of the 1 mm square formed by four adjacenttracks to achieve greater spatial resolution. The electrode was advancedwith a manual hydraulic microdrive, and stimulation was performed at0.5 mm intervals, starting from the first cortical electrical activity en-countered. In some tracks, stimulation was performed at 0.25 mm inter-vals. Cortical electrical activity and EMG activity were simultaneouslymonitored along with task-related signals.
While the monkey performed the reach and prehension task, stimuli(15 mA at 15 Hz) were applied through the electrode and served astriggers for computing StTAs. Individual stimuli were symmetrical bi-phasic pulses: a 0.2 msec negative pulse followed by a 0.2 msec positivepulse. EMGs were digitized at a rate of 4 kHz, and averages weregenerally compiled over a 60 msec epoch, including 20 msec before thetrigger to 40 msec after the trigger. Stimuli were applied throughout allphases of the reach and prehension task, and the assessment of effectswas based on StTAs of at least 500 trigger events. Segments of EMGactivity associated with each stimulus were evaluated and accepted foraveraging only when the average of all EMG data points over the entire60 msec epoch was $5% of full-scale input. This prevented averagingsegments in which EMG activity was minimal or absent (McKiernan etal., 1998).
At some stimulation sites, averages were computed at 30 mA if nopoststimulus effects (PStEs) were obtained at 15 mA. When no PStEswere detected with 30 mA, repetitive ICMS (R-ICMS) was performed todetermine the motor output representation, if any, from that site.R-ICMS consisted of a train of 10 symmetrical biphasic stimulus pulses(negative–positive with total duration of 0.4 msec) at a frequency of 330Hz (Asanuma and Rosen, 1972) and intensity of 15 and/or 30 mA.Evoked movements and muscle contractions detected with palpationwere noted.
Data analysis. At each stimulation site, averages were obtained from all24 muscles. Poststimulus facilitation (PStF) and suppression (PStS) ef-fects were computer-measured as described in detail by Mewes andCheney (1991). The focus of this study was on maps of PStF effects;hence, PStS effects were excluded. Nonstationary, ramping baseline ac-tivity (Lemon et al., 1986) was routinely subtracted from StTAs usingcustom analysis software. Mean baseline activity and SD were deter-mined for the average of EMG activity in the pretrigger period consistingof the first 12.5 msec of each average. StTAs were considered to have asignificant PStF effect if the envelope of the StTA crossed a levelequivalent to 2 SD of the mean of the baseline EMG for a period $0.75msec. Onset and offset latencies of PStF were defined as the points atwhich the envelope of the StTA crossed a level equivalent to 2 SD of themean of the baseline EMG. The peak of each effect was defined as thehighest point in PStF between the onset and offset latencies.
The strengths of PStF effects were categorized as follows. Peaks ,2SD of baseline and peaks that remained .2 SD for ,0.75 msec periodwere considered insignificant, and the average was categorized as havingno effect (Fig. 1 A). Weak PStF effects had peaks .2 SD of mean baselineactivity but #5 SD of mean baseline activity (Fig. 1 B). Moderate andstrong effects had peaks .5 SD and, for the purposes of this study, werelumped together (Fig. 1C). Our maps were based on either moderate andstrong effects alone or moderate and strong effects combined with weakeffects.
Magnetic resonance imaging and analysis. MRI was used for confirma-tion of electrode track locations rather than actual histology, because themonkeys are part of another ongoing study. MRI studies were performed;5 months after the cortical recording chamber implant but before theEMG implant. The monkeys were tranquilized with ketamine and atro-pine and subsequently anesthetized with isoflurane gas. To give themagnetic resonance (MR) images a reference framework, a custom-designed chamber cap filled with MR opaque marker (liquid vitamin E)was used to identify the x and y axes [anterior–posterior (A-P) andmedial–lateral (M-L) axes, respectively] of the cortical recording cham-ber (see Fig. 3 A, B) as a cross.
Figure 2. Method for flattening and unfolding cortical layer V in theanterior bank of the central sulcus for two-dimensional representation. A,Parasagittal diagram representing the stimulated cortex, constructed fromelectrode tracks with the same M-L coordinate (4L) organized in ananterior-to-posterior order. Identification of white matter–gray matterborder (thin line), central sulcus (CS), and sensory cortex were based onelectrophysiological observations. Then, reference lines (dashed lines),similar to those used by Sato and Tanji (1989), were placed onto thediagram to represent cortical layer V. A horizontal reference line (h) wasplaced at 1.5 mm depth, and a vertical reference line (v) was placed at 1.5mm from the estimated central sulcus to approximate the position of layerV. The intersection of the reference lines (asterisk) was defined to be theconvexity of the precentral gyrus. Projecting the selected stimulation sites(F) onto the reference lines, when necessary, flattened the curvature oflayer V. In the case of track 2P, stimulation at a depth of 1.0 mm (F) isprojected onto the reference line h (E). In this track, the 1.5 mm site wasnot used because the effects at 1.0 mm were much stronger. B, Flattenedand unfolded two-dimensional map of cortical layer V. Layer V wasunfolded by rotating the reference line v with respect to the convexity ofthe precentral gyrus (asterisk). This straightened the two reference linesinto one line (dashed line). Completing this manipulation for all tracksyielded a two-dimensional map of M1. C, Tracing of an MR imagethrough the same parasagittal plane as 4L with overlaid electrode tracksand stimulation sites corresponding to layer V (F). A, Anterior; P,posterior; L, lateral; M, medial.
2786 J. Neurosci., April 15, 2001, 21(8):2784–2792 Park et al. • Forelimb Representation in M1
MRI studies were performed using a 1.5 Tesla Siemens 63SPA system(Siemens, Iselin, NJ) with a circularly polarized knee coil. Three-dimensional Magnetization Prepared Rapid Gradient Echo (3D-MPRAGE) sequence was acquired with the following parameters: rep-etition time 5 10 msec, echo time 5 4 msec, inversion time 5 750 msec,flip angle 10, matrix 192 3 256, slice thickness 1.5 mm, and field of view250 mm. MR images were transferred by local area network to anHP9000 C360 computer system (Hewlett-Packard, Palo Alto, CA) withan FX-4 graphics subsystem. MR image analysis was performed usingOmniview 2D and 3D visualization software (3D Biomedical Imaging,Inc., Shawnee Mission, KS). The 3D-MPRAGE protocol was used toobtain axial images with a slice thickness of 1.0 mm. This protocoltypically yielded 100–130 MR axial images and offered excellent spatialresolution because of thin slice thickness, minimizing volume-averagingeffects. The thin slice thickness made it possible to maintain adequateresolution after multiplanar image reformations.
MR image analysis software allowed visualization of an acquiredimage set in any plane of interest. Thus, computer-assisted multiplanarimage reformations were performed with respect to the reference frame-work previously highlighted with vitamin E marker. The resulting
oblique parasagittal images were orthogonal to the M-L axis and inregister with the chamber coordinate system. The images were parallel toa series of electrode tracks having the same M-L coordinate. For exam-ple, an oblique parasagittal image at lateral 4 would represent a slicethrough the cortex showing all electrode tracks for which the M-Lchamber coordinate was lateral 4. The reformed images were then tracedto highlight gray matter, white matter, and the central sulcus (Fig. 2C).
Unfolding the cortex . A two-dimensional rendering of cortical layer Vin the anterior bank of the central sulcus required flattening and unfold-ing its curvature. First, all electrode tracks were grouped according totheir M-L coordinate. Within each group, the tracks were then orderedaccording to their A-P coordinate. On the basis of electrophysiologicaldata and observations, a parasagittal diagram was constructed to repre-sent the cortex that was explored and stimulated (Fig. 2 A). White matterwas identified by a sharp decrease or loss of background cell activity.Sensory cortex was identified by the presence of distinctive spike activityand characteristic receptive fields (Widener and Cheney, 1997). For eachelectrode track, sites corresponding to cortical layer V were identifiedusing a combination of electrode depth, strength of PStF effects, andreconstruction of precentral geometry in relation to MRI sections. Elec-
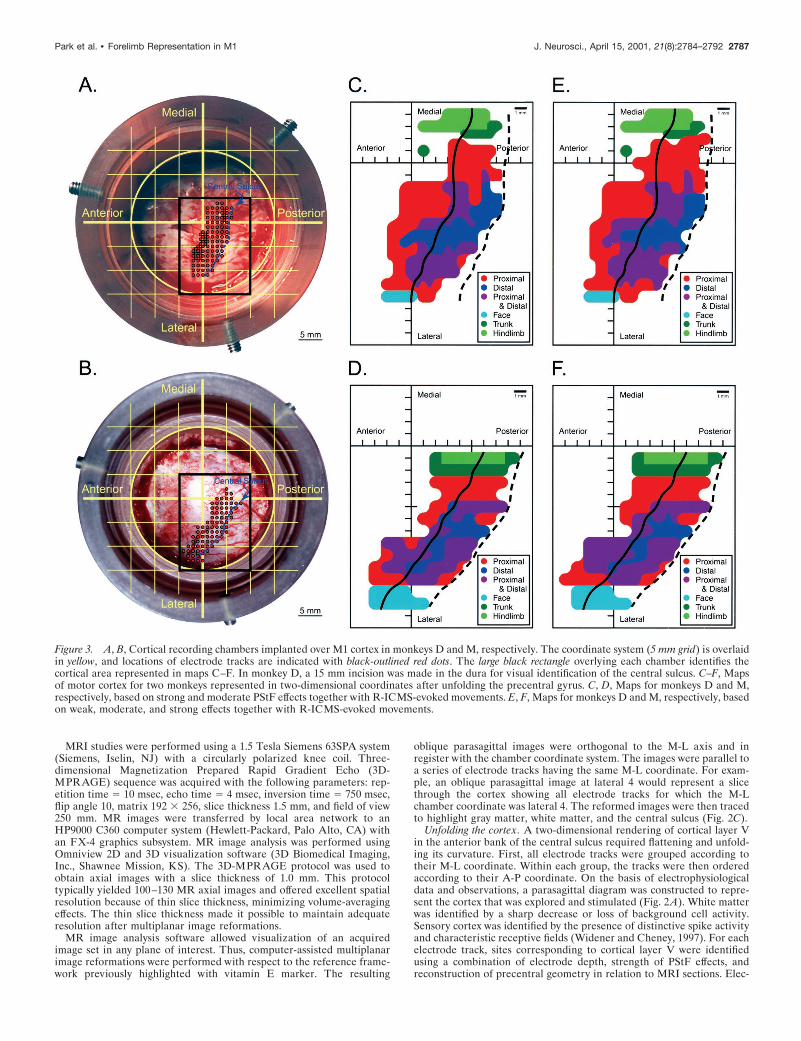
Figure 3. A, B, Cortical recording chambers implanted over M1 cortex in monkeys D and M, respectively. The coordinate system (5 mm grid) is overlaidin yellow, and locations of electrode tracks are indicated with black-outlined red dots. The large black rectangle overlying each chamber identifies thecortical area represented in maps C–F. In monkey D, a 15 mm incision was made in the dura for visual identification of the central sulcus. C–F, Mapsof motor cortex for two monkeys represented in two-dimensional coordinates after unfolding the precentral gyrus. C, D, Maps for monkeys D and M,respectively, based on strong and moderate PStF effects together with R-ICMS-evoked movements. E, F, Maps for monkeys D and M, respectively, basedon weak, moderate, and strong effects together with R-ICMS-evoked movements.
Park et al. • Forelimb Representation in M1 J. Neurosci., April 15, 2001, 21(8):2784–2792 2787

trode penetrations on the convexity of the gyrus traversed cortical layersperpendicularly, and in these cases, it was relatively easy to identify thestimulation site closest to layer V. For electrode penetrations traversingthe depth of the precentral gyrus and extending roughly parallel to thecortical layers, it was more difficult to identify layer V sites. In these cases,output effects from sites at the same depth from different electrode tracksalong the A-P axis were compared. Selection of sites closest to layer Vwas based on the strength of PStF and reconstruction of the position ofthe sites in relation to MRI parasagittal sections oriented along the sameA-P axis as the electrode tracks. This analysis yielded a series ofreconstructed parasagittal cortical sections oriented along the A-P axis ofthe chamber in the plane of the electrode tracks (Fig. 2 A, C).
Reference lines, similar to those used by Sato and Tanji (1989), werethen placed on the diagram to represent cortical layer V. A horizontalreference line (h) was placed at a depth of 1.5 mm, and a verticalreference line (v) was placed typically at 1.5 mm anterior to the estimatedlocation of central sulcus (Fig. 2 A). The intersection of the referencelines, marked with an asterisk in Figure 2 A, defined the convexity of theprecentral gyrus. Stimulation data (PStEs) from sites corresponding tocortical layer V were projected onto the reference lines (Fig. 2 A). Then,layer V was unfolded by rotating the reference line v with respect to theconvexity of the precentral gyrus. This straightened the two referencelines into one line. The resulting unfolded reference line then gave riseto the coordinates for each stimulation site on the two-dimensional map(Fig. 2 B).
RESULTSData were collected from the left M1 in two rhesus monkeys.There were a total of 248 electrode tracks, 115 tracks in monkeyD (Fig. 3A) and 133 tracks in monkey M (Fig. 3B). StTAing (15mA) of rectified EMG activity from 24 forelimb muscles was
performed at 2477 sites, 1072 (43.3% of total) sites in monkey Dand 1405 (56.7% of total) sites in monkey M, resulting in a totalof 59,448 StTA records. In addition, R-ICMS was performed at359 sites, 210 in monkey D and 149 in monkey M. R-ICMS wasperformed at sites where no PStEs were observed with StTAingat intensities up to 30 mA. On the basis of the criteria describedearlier, stimulation sites corresponding to cortical layer V wereselected, and only their PStEs and evoked movements were usedfor mapping. This yielded a total of 361 sites and 8664 StTArecords (209 sites in monkey D and 152 sites in monkey M).Forty-eight percent of PStF effects were in extensor muscles, and52% were in flexor muscles (excludes intrinsic hand muscles).Forty-nine percent of sites facilitated a combination of at leastone flexor muscle and one extensor muscle at the same joint(cofacilitation site). Overall, effects in distal muscles were twotimes greater than effects in proximal muscles. StTAs were ob-tained from all 24 muscles at each stimulation site. An example ofPStEs obtained at one layer V site is shown in Figure 4. In thiscase, clear PStF effects were observed in both proximal and distalforelimb muscles. Accordingly, this site was categorized as oneproducing effects in both proximal and distal muscles.
Ninety (25.1%) of the total R-ICMS sites (45 sites in monkeyD and 45 sites in monkey M) were judged as corresponding tolayer V. R-ICMS was used mainly to identify sites that did notproduce any poststimulus effects, i.e., representations of trunk,hindlimb, and face. However, in one monkey, evoked movements
Figure 4. Distribution of PStF effects in forelimb muscles from a PDC site. Time 0 corresponds to the stimulus event used for the average. Stimulationwas 15 mA at 15 Hz. Moderate and strong PStF effects were observed in both proximal (BIS, BIL, BRA, BR, TLON, PEC) and distal (APB, FDI, FDP,ED23) forelimb muscles. The range of number of trigger events for different channels is given in parentheses.
2788 J. Neurosci., April 15, 2001, 21(8):2784–2792 Park et al. • Forelimb Representation in M1

from R-ICMS were also used to define some forelimb sites.Specifically, 14 of 71 sites (20%) mapped as proximal sites weredefined solely by R-ICMS. However, these sites were locatedbetween sites already defined by PStE (for example in the centerof the 1 3 1 mm grid defined by StTA). Because the site categorybased on R-ICMS matched the category of adjacent sites basedon PStE, many of these sites did not affect the map boundaries.Only 8 of 71 sites (11%) helped to define the anterior (6 sites)and medial (2 sites) borders of the proximal muscle representa-tion. Also, only 1 of 47 sites (2%) was categorized as producingeffects in both proximal and distal muscles solely on the basis ofR-ICMS data.
Motor output maps (Fig. 3C–F) constructed from effects at alllayer V sites revealed a central core of distal forelimb musclerepresentation contained largely within the wall of the precentralgyrus. This core distal representation extended mediolaterallyalong the caudal border of M1 and was surrounded on all sides,except at the area 4/3a border, by a horseshoe-shaped zone ofproximal forelimb muscle representation. The medial and lateralarms of the horseshoe extend posteriorly down the wall of theprecentral gyrus and terminate at the area 4/3a border. Also,there was a substantial region separating the core distal andproximal representations at which StTAing produced effects in
both proximal and distal forelimb muscles. On the basis of argu-ments presented in Discussion, we believe this area is not simplythe result of current spread to the core distal and proximal repre-sentations. Accordingly, we will refer to it as the proximal–distalcofacilitation (PDC) zone. In a few places, the proximal musclerepresentation is fragmented into small islands by the PDC zone.Similarly, in both monkeys, the PDC zone is fragmented intononcontiguous medial and lateral components by the distal repre-sentation. The inclusion of weak PStF effects in the motor outputmaps (Fig. 3E,F) did not significantly alter the general features ofthe maps (Fig. 3C,D). However, when weak effects were included,the PDC zone did appear as one contiguous representation, al-though small islands of proximal muscle representation remained.
The boundary of the core forelimb representation was deter-mined carefully. Stimulation sites immediately anterior to theprimary forelimb representation yielded no PStE with StTA at 15and 30 mA, and no movements were evoked with R-ICMS at 15and 30 mA. Stimulation sites posterior to the primary forelimbrepresentation or deep in the sulcus were characterized as beingeither sensory cortex or white matter. Stimulation sites extendinglaterally from the horseshoe also produced no PStE with StTA at15 and 30 mA. However, at these sites, R-ICMS at both 15 and 30mA evoked movements of the upper and lower lips, thus revealing
Figure 5. Stimulus-triggered averages of rectified EMG activity (15 mA at 15 Hz) of a proximal muscle, biceps shorthead (BIS), for monkey D plottedon a two-dimensional map of M1. Each record is color coded for strength of PStF according to the number of SDs above pre-trigger baseline activity(color bar at top of Figure). The color-shaded motor representation map is taken from Figure 3E. Yellow line, Convexity of the precentral gyrus; blackdashed line, fundus.
Park et al. • Forelimb Representation in M1 J. Neurosci., April 15, 2001, 21(8):2784–2792 2789

a face representation. Similarly and most notably, stimulationsites extending medially from the medial arm of proximal musclerepresentation produced no PStE with StTA at 15 and 30 mA.However, at these sites, R-ICMS at both 15 and 30 mA revealedcomponents of a trunk and hindlimb representation. No evidenceof a second noncontiguous distal or proximal forelimb represen-tation was found (Fig. 3C–F).
Figures 5 and 6 illustrate the StTAs obtained from sites in M1for a proximal muscle, BIS, and for a distal muscle, EDC. Eachrecord in these figures is color-coded for strength of the PStF (seecolor key at the top of the Figures). The distribution of PStFeffects for BIS and EDC revealed multiple foci of strong effects(SD . 5.0) for individual muscles represented over the forelimbarea of M1. In the case of BIS, these multiple foci are separatedby sites that yielded no effects, whereas in the case of EDC, themultiple foci represent peaks in output separated by valleys inwhich weaker but clear effects were present. Most importantly,the sites with EDC PStF effects are contained completely withinthe distal muscle zones. This includes both the distal-only zone(dark blue) and the PDC zone ( purple). Similarly, the sites withBIS PStF effects are contained completely within the proximalmuscles zones. This includes both the proximal-only zone ( pink)
and sites yielding effects on both distal and proximal muscles( purple).
DISCUSSIONFigure 7 summarizes the consistent features of M1 intra-arealforelimb muscle representation in the rhesus macaque based onour StTAing data. A central core of distal forelimb muscle rep-resentation, oriented mediolaterally along the caudal border ofM1, is surrounded by a horseshoe-shaped zone of proximal fore-limb muscle representation. The proximal muscle representationis discontinuous at the area 4/3a border. This pattern of repre-sentation is consistent with the work of others using R-ICMS instumptail macaques (Kwan et al., 1978a,b) and squirrel monkeys(Strick and Preston, 1978, 1982a; Nudo et al., 1992, 1996; Nudoand Milliken, 1996). Separating the core distal representationfrom the surrounding core proximal representation is a zoneyielding effects in both distal and proximal muscles (PDC zone).A small zone of overlap between the distal and proximal corerepresentations would be expected because of the spread ofstimulus current at the boundary separating the two representa-tions. However, the width of the PDC zone suggests that it is agenuine, separate field with neurons that represent combinations
Figure 6. Stimulus-triggered averages of rectified EMG activity (15 mA at 15 Hz) of a distal muscle, extensor digitorum communis (EDC), for monkeyD plotted on a two-dimensional map of M1. Each record is color coded for strength of PStF according to the number of SDs above pre-trigger baselineactivity (color bar at top of Figure). The color-shaded motor representation map is taken from Figure 3E. Yellow line, Convexity of the precentral gyrus;black dashed line, fundus.
2790 J. Neurosci., April 15, 2001, 21(8):2784–2792 Park et al. • Forelimb Representation in M1
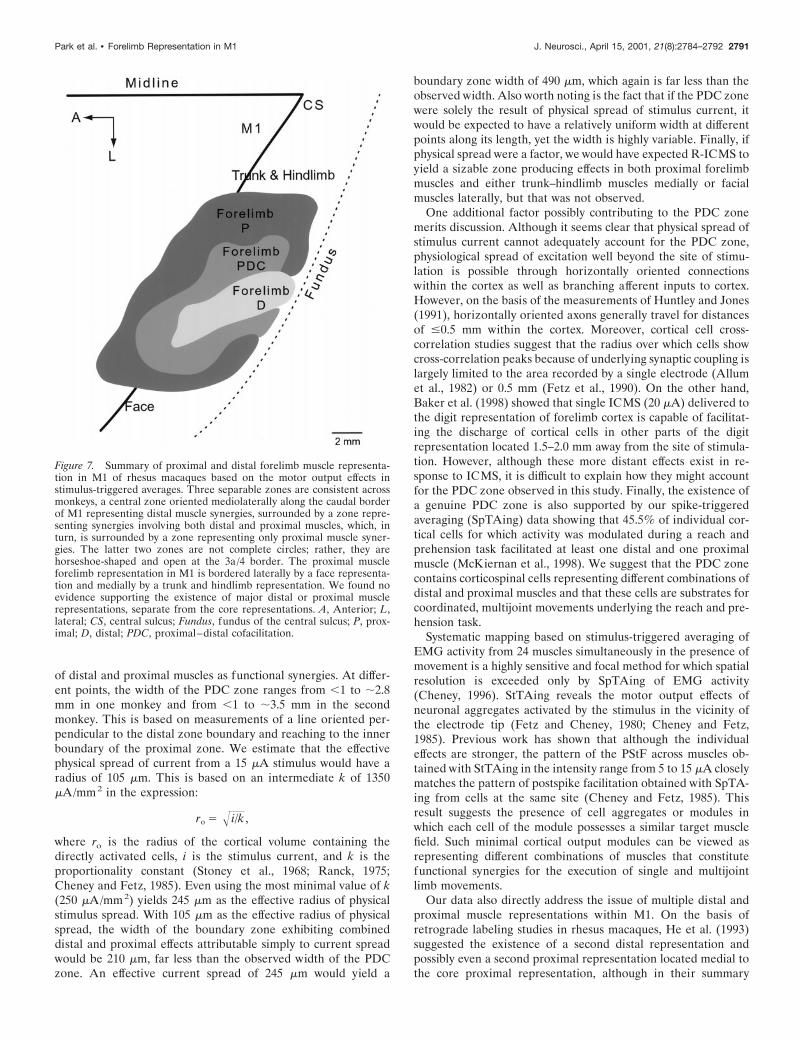
of distal and proximal muscles as functional synergies. At differ-ent points, the width of the PDC zone ranges from ,1 to ;2.8mm in one monkey and from ,1 to ;3.5 mm in the secondmonkey. This is based on measurements of a line oriented per-pendicular to the distal zone boundary and reaching to the innerboundary of the proximal zone. We estimate that the effectivephysical spread of current from a 15 mA stimulus would have aradius of 105 mm. This is based on an intermediate k of 1350mA/mm2 in the expression:
ro 5 Î i/k ,
where ro is the radius of the cortical volume containing thedirectly activated cells, i is the stimulus current, and k is theproportionality constant (Stoney et al., 1968; Ranck, 1975;Cheney and Fetz, 1985). Even using the most minimal value of k(250 mA/mm2) yields 245 mm as the effective radius of physicalstimulus spread. With 105 mm as the effective radius of physicalspread, the width of the boundary zone exhibiting combineddistal and proximal effects attributable simply to current spreadwould be 210 mm, far less than the observed width of the PDCzone. An effective current spread of 245 mm would yield a
boundary zone width of 490 mm, which again is far less than theobserved width. Also worth noting is the fact that if the PDC zonewere solely the result of physical spread of stimulus current, itwould be expected to have a relatively uniform width at differentpoints along its length, yet the width is highly variable. Finally, ifphysical spread were a factor, we would have expected R-ICMS toyield a sizable zone producing effects in both proximal forelimbmuscles and either trunk–hindlimb muscles medially or facialmuscles laterally, but that was not observed.
One additional factor possibly contributing to the PDC zonemerits discussion. Although it seems clear that physical spread ofstimulus current cannot adequately account for the PDC zone,physiological spread of excitation well beyond the site of stimu-lation is possible through horizontally oriented connectionswithin the cortex as well as branching afferent inputs to cortex.However, on the basis of the measurements of Huntley and Jones(1991), horizontally oriented axons generally travel for distancesof #0.5 mm within the cortex. Moreover, cortical cell cross-correlation studies suggest that the radius over which cells showcross-correlation peaks because of underlying synaptic coupling islargely limited to the area recorded by a single electrode (Allumet al., 1982) or 0.5 mm (Fetz et al., 1990). On the other hand,Baker et al. (1998) showed that single ICMS (20 mA) delivered tothe digit representation of forelimb cortex is capable of facilitat-ing the discharge of cortical cells in other parts of the digitrepresentation located 1.5–2.0 mm away from the site of stimula-tion. However, although these more distant effects exist in re-sponse to ICMS, it is difficult to explain how they might accountfor the PDC zone observed in this study. Finally, the existence ofa genuine PDC zone is also supported by our spike-triggeredaveraging (SpTAing) data showing that 45.5% of individual cor-tical cells for which activity was modulated during a reach andprehension task facilitated at least one distal and one proximalmuscle (McKiernan et al., 1998). We suggest that the PDC zonecontains corticospinal cells representing different combinations ofdistal and proximal muscles and that these cells are substrates forcoordinated, multijoint movements underlying the reach and pre-hension task.
Systematic mapping based on stimulus-triggered averaging ofEMG activity from 24 muscles simultaneously in the presence ofmovement is a highly sensitive and focal method for which spatialresolution is exceeded only by SpTAing of EMG activity(Cheney, 1996). StTAing reveals the motor output effects ofneuronal aggregates activated by the stimulus in the vicinity ofthe electrode tip (Fetz and Cheney, 1980; Cheney and Fetz,1985). Previous work has shown that although the individualeffects are stronger, the pattern of the PStF across muscles ob-tained with StTAing in the intensity range from 5 to 15 mA closelymatches the pattern of postspike facilitation obtained with SpTA-ing from cells at the same site (Cheney and Fetz, 1985). Thisresult suggests the presence of cell aggregates or modules inwhich each cell of the module possesses a similar target musclefield. Such minimal cortical output modules can be viewed asrepresenting different combinations of muscles that constitutefunctional synergies for the execution of single and multijointlimb movements.
Our data also directly address the issue of multiple distal andproximal muscle representations within M1. On the basis ofretrograde labeling studies in rhesus macaques, He et al. (1993)suggested the existence of a second distal representation andpossibly even a second proximal representation located medial tothe core proximal representation, although in their summary
Figure 7. Summary of proximal and distal forelimb muscle representa-tion in M1 of rhesus macaques based on the motor output effects instimulus-triggered averages. Three separable zones are consistent acrossmonkeys, a central zone oriented mediolaterally along the caudal borderof M1 representing distal muscle synergies, surrounded by a zone repre-senting synergies involving both distal and proximal muscles, which, inturn, is surrounded by a zone representing only proximal muscle syner-gies. The latter two zones are not complete circles; rather, they arehorseshoe-shaped and open at the 3a/4 border. The proximal muscleforelimb representation in M1 is bordered laterally by a face representa-tion and medially by a trunk and hindlimb representation. We found noevidence supporting the existence of major distal or proximal musclerepresentations, separate from the core representations. A, Anterior; L,lateral; CS, central sulcus; Fundus, fundus of the central sulcus; P, prox-imal; D, distal; PDC, proximal–distal cofacilitation.
Park et al. • Forelimb Representation in M1 J. Neurosci., April 15, 2001, 21(8):2784–2792 2791

diagram (He et al., 1993, their Fig. 18), the existence of thesesecond representations is qualified by question marks. We wereunable to find clear evidence for the existence of a major non-contiguous second representation of either distal or proximalmuscles within primary motor cortex, despite running additionalelectrode tracks to increase the spatial resolution in regions inwhich we anticipated the presence of second representationsbased on the maps of He et al. (1993). Stimulation sites locatedmedial to the medial arm of the proximal muscle representationyielded no effects in StTAs, but using R-ICMS to evoke move-ments revealed a representation of trunk and hindlimb muscles.Similarly, tracks located laterally to the lateral component of theproximal forelimb representation yielded no effects in StTAs offorelimb muscle activity, but R-ICMS revealed a representationof facial muscles. Although it is true that islands of proximalmuscle representation are present along the lateral and caudalborders of the forelimb representation, these islands are relativelysmall, and their position is inconsistent with the second represen-tations described by He et al. (1993). Moreover, the distal repre-sentation in our maps appeared as one continuous representationlacking even small noncontiguous islands. Given the sensitivity ofthe StTA method, we consider it unlikely that major second rep-resentations of distal or proximal muscles exist within M1.
The accuracy of motor output maps depends on the spatialresolution of the assessment technique. Most of the data for ourmaps was based on an electrode track spacing of 1 mm. Althougha 0.5 mm surface grid interval would have provided finer spatialresolution, it would have required four times the number ofelectrode penetrations. We could not justify this disproportionalincrease in the number of additional electrode penetrations. How-ever, to increase spatial resolution in critical regions, additionalelectrode penetrations were placed in the center of the squaresformed by the 1 mm grid. Stimulation was performed at 0.5 mmintervals over the depth of our electrode penetrations, providinghigher resolution for sites located in the bank of the precentralgyrus. Given that a 15 mA stimulus current should have a 105–245mm radius of physical spread, coupled with our spacing of stim-ulation sites, it seems improbable that we missed possible secondrepresentations within M1.
REFERENCESAllum JHJ, Hepp-Reymond M-C, Gysin R (1982) Cross-correlation
analysis of interneuronal connectivity in the motor cortex of the mon-key. Brain Res 231:325–334.
Asanuma H, Rosen I (1972) Topographical organization of cortical ef-ferent zones projecting to distal forelimb muscles in the monkey. ExpBrain Res 14:243–256.
Asanuma H, Sakata H (1967) Functional organization of a cortical ef-ferent system examined with focal depth stimulation in cats. J Neuro-physiol 30:35–54.
Baker SN, Oliver E, Lemon RN (1998) An investigation of the intrinsiccircuitry of the motor cortex of the monkey using intra-cortical micro-stimulation. Exp Brain Res 123:397–411.
Belhaj-Saıf A, Hill Karrer J, Cheney PD (1998) Distribution and char-acteristics of poststimulus effects in proximal and distal forelimb mus-cles from red nucleus in the monkey. J Neurophysiol 79:1777–1789.
Cheney PD (1996) Electrophysiological methods for mapping brain mo-tor circuits. In: Brain mapping: the methods (Toga AW, Mazziotta JC,eds), pp 277–307. New York: Academic.
Cheney PD, Fetz EE (1985) Comparable patterns of muscle facilitationevoked by individual corticomotoneuronal (CM) cells and by singleintracortical microstimuli in primates: evidence for functional groupsof CM cells. J Neurophysiol 53:786–804.
Fetz EE, Cheney PD (1980) Postspike facilitation of forelimb muscleactivity by primate corticomotoneuronal cells. J Neurophysiol44:751–772.
Fetz EE, Toyama K, Smith W (1990) Synaptic interactions betweencortical neurons. In: Cerebral cortex, Vol 9, Normal and altered statesof function (Jones EG, Peters A, eds), pp 1–47. New York: Plenum.
Gould III HJ, Cusick CG, Pons TP, Kaas JH (1986) The relationship ofcorpus callosum connections to electrical stimulation maps of motor,supplementary motor, and the frontal eye fields in owl monkeys.J Comp Neurol 247:297–325.
He SQ, Dum RP, Strick PL (1993) Topographic organization of corti-cospinal projections from the frontal lobe: motor areas on the lateralsurface of the hemisphere. J Neurosci 13:952–980.
Hepp-Raymond M-C (1988) Functional organization of motor cortexand its participation in voluntary movements. In: Comparative primatebiology, Vol 4, Neurosciences (Steklis HD, Erwin J, eds), pp 501–624.New York: Liss.
Huntley GW, Jones EG (1991) Relationship of intrinsic connections toforelimb movement representations in monkey motor cortex: a correl-ative anatomical and physiological study. J Neurophysiol 66:390–413.
Karrer JH, McKiernan BJ, Marcario JK, Belhaj-Saıf A, Cheney PD(1995) Mapping motor cortex output zones with stimulus triggeredaveraging of EMG activity: distal and proximal forelimb muscle rep-resentations in the rhesus monkey. Soc Neurosci Abstr 21:2074.
Kasser RJ, Cheney PD (1985) Characteristics of corticomotoneuronalpostspike facilitation and reciprocal suppression of EMG activity in themonkey. J Neurophysiol 53:959–978.
Kwan HC, Mackay WA, Murphy JT, Wong YC (1978a) An intracorticalmicrostimulation study of output organization in precentral cortex ofawake primates. J Physiol (Paris) 74:231–233.
Kwan HC, Mackay WA, Murphy JT, Wong YC (1978b) Spatial organi-zation of precentral cortex in awake primates. II. Motor outputs.J Neurophysiol 41:1120–1131.
Lemon RN, Mantel GWH, Muir RB (1986) Corticospinal facilitation ofhand muscles during voluntary movement in the conscious monkey.J Physiol (Lond) 381:497–527.
McKiernan BJ, Marcario JK, Hill Karrer J, Cheney PD (1998) Cortico-motoneuronal postspike effects in shoulder, elbow, wrist, digit, andinstrinsic hand muscles during a reach and prehension task. J Neuro-physiol 80:1961–1980.
Mewes K, Cheney PD (1991) Facilitation and suppression of wrist anddigit muscles from single rubromotoneuronal cells in the awake mon-key. J Neurophysiol 66:1965–1977.
Nudo RJ, Milliken GW (1996) Reorganization of movement represen-tations in primary motor cortex following focal ischemic infarcts inadult squirrel monkeys. J Neurophysiol 75:2144–2149.
Nudo RJ, Jenkins WM, Merzenich MM, Prejean T, Grenda R (1992)Neurophysiological correlates of hand preference in primary motorcortex of adult squirrel monkeys. J Neurosci 12:2918–2948.
Nudo RJ, Milliken GW, Jenkins WM, Merzenich MM (1996) Use-dependent alterations of movement representations in primary motorcortex of adult squirrel monkeys. J Neurosci 16:785–807.
Park MC, Belhaj-Saıf A, Cheney PD (2000) Chronic recording of EMGactivity from large numbers of forelimb muscles in awake macaquemonkeys. J Neurosci Methods 96:153–160.
Ranck JB (1975) Which elements are excited in electrical stimulation ofmammalian central nervous system: a review. Brain Res 98:417–440.
Sato KC, Tanji J (1989) Digit-muscle responses evoked from multipleintracortical foci in monkey precentral motor cortex. J Neurophysiol62:959–970.
Stepniewska I, Preuss TM, Kaas JH (1993) Architectonics, somatotopicorganization, and ipsilateral cortical connections of the primary motorarea (M1) of owl monkeys. J Comp Neurol 330:238–271.
Stoney Jr SD, Thompson WD, Asanuma H (1968) Excitation of pyra-midal tract cells by intracortical microstimulation: effective extent ofstimulating current. J Neurophysiol 31:659–669.
Strick PL, Preston JB (1978) Multiple representation in the primatemotor cortex. Brain Res 154:366–370.
Strick PL, Preston JB (1982a) Two representations of the hand in area 4of a primate. I. Motor output organization. J Neurophysiol 48:139–149.
Strick PL, Preston JB (1982b) Two representations of the hand in area 4of a primate. II. Somatosensory input organization. J Neurophysiol48:150–159.
Widener GL, Cheney PD (1997) Effects on muscle activity from micro-stimuli applied to somatosensory and motor cortex during voluntarymovement in the monkey. J Neurophysiol 77:2446–2465.
2792 J. Neurosci., April 15, 2001, 21(8):2784–2792 Park et al. • Forelimb Representation in M1