consolidated banking data: introducing enhanced statistics ... · 70 consolidated banking data:...
TRANSCRIPT
70
Consolidated Banking Data: Introducing Enhanced Statistics for IrelandKenneth Devine, Jennifer Dooley, Ciaran Meehan and Aisling Menton.1
Abstract
The financial crisis highlighted a need for enhanced statistics to allow for a more in-depth financial stability analysis. The Bank for International Settlements (BIS) consolidated banking data, which measures banks' country risk exposures, is one dataset that facilitates a worldwide evaluation. It captures the global consolidated claims of international banks headquartered in BIS reporting countries and has been expanded to address data gaps identified following the financial crisis. The benefits of these more granular data are demonstrated through the analysis of foreign claims by Irish banks, international claims on Ireland by foreign banks and linkages between BIS reporting countries, both pre and post crisis. A network analysis of the exposures of banking sectors in BIS reporting countries on vulnerable EU states and sovereigns is also presented.
1 Authors are an Economist, Data Analyst, Data Analyst and Senior Economist, respectively, in the Money & Banking Team of the Statistics Division of the Central Bank of Ireland. The views expressed in this article are solely the views of the authors and are not necessarily those held by the Central Bank of Ireland or the European System of Central Banks. The authors would like to thank Joe McNeill and Tiernan Heffernan for their helpful comments.

71Quarterly Bulletin 03 / July 17Consolidated Banking Data: Introducing Enhanced Statistics for Ireland
1. Introduction
This article discusses the Bank for International Settlements (BIS) consolidated banking data, and introduces a breakdown of data not previously published by the Central Bank of Ireland.2 The expanded data breakdowns are based on an update to the BIS reporting template in December 2013. The article analyses foreign claims by Irish headquartered banks (hereafter Irish banks) by country and sector, and shows how these have declined substantially since the onset of the financial crisis.3 International claims on Ireland by foreign banks, and how these compare to other vulnerable economies, are also examined. Network analysis is used to examine linkages between BIS reporting countries and vulnerable countries before and after the financial crisis, particularly in relation to claims on the official sector.
The paper is structured as follows: Section 2 provides an overview of the enhanced statistics. In section 3 we deal with the analysis of foreign claims by Irish banks, while section 4 explores the enhanced sector breakdown of claims. Section 5 explores claims by international banks on Ireland. Section 6 looks at contingent claims of Irish banks, while Section 7 concludes.
2. Overview of the Enhanced Statistics
The BIS consolidated banking statistics (CBS) dataset collects detailed information on sector and maturity breakdowns, according to where the lending takes place. Individual country data are available for 216 countries, territories and international organisations.4 The data are collected both on an immediate risk and on
an ultimate risk basis, for those banks that are headquartered and owned in the reporting country.5 Data on an immediate risk basis shows claims on the first counterpart country and sector, whereas data on an ultimate risk basis are based on the country and sector where the ultimate risk or obligor resides, after taking into account risk transfers (BIS, 2013). For example, if a bank in Ireland lends to an affiliate of an American headquartered company based in Luxembourg, this loan is considered as a claim against Luxembourg in the immediate risk statistics. However, on an ultimate risk basis, this is considered as a claim against the US, as this is where the final risk resides.6 Data are collected on inward and outward risk transfers, to show how risk is transferred from the immediate risk country to the ultimate risk country.
The BIS initiated enhancements to the consolidated banking statistics after the financial crisis. In 2012, the Committee on the Global Financial System (CGFS), which oversees the collection of the BIS international banking statistics (IBS), approved a major set of enhancements to the IBS aimed at filling long-standing data gaps and better capturing the financial landscape (CGFS, 2012). The initiative by the CGFS was a part of the G20 Data Gaps Initiative, which recommended improvements in a broad range of statistics (FSB-IMF, 2009). These changes to the BIS statistics were introduced in two stages. Stage 1 related to Locational Banking Statistics (LBS) only, whereas stage 2 addressed enhancements to both the LBS and CBS.7
The main enhancement to the CBS was the inclusion of domestic positions for the first time, whereas previously the CBS only included foreign claims. While domestic Irish
2 The data tables are available at: https://centralbank.ie/statistics/data-and-analysis/credit-and-banking-statistics/consolidated-banking-statistics
3 In most of the analysis in this paper, unless otherwise stated, the banks used in the analysis are the three Irish headquartered banks. This is to allow for a comparison of data across time periods, and to control for bank population changes.
4 Some very small countries are included in a ‘residual’ figure for geographic regions. The reporting form, is available at:
http://www.centralbank.ie/statistics/statistical-reporting-requirements/credit-institutions/maturity-and-sectoral-return-(mts)
5 Data are also collected for those banks that are headquartered in Ireland, but are not Irish owned, for example, Depfa Bank. Depfa is headquartered in Ireland, and Ireland is the ultimate location for consolidation, but as it is owned by a German non-financial corporate, it is not included in foreign claims by Irish banks. There are a number of banks of this entity type located in Ireland, and they complete a different reporting template than Irish owned banks.
6 Further examples can be found at: https://www.bis.org/statistics/bankstatsguide_faq.pdf
7 Locational banking statistics measure claims and liabilities, including inter-office positions, of banking offices resident in reporting countries. These statistics are reported using principles that are consistent with balance of payments methodology.

72 Quarterly Bulletin 03 / July 17Consolidated Banking Data: Introducing Enhanced Statistics for Ireland
claims in local currency are not addressed in this paper, their availability allows for the reporting of total assets of the consolidated balance sheet of domestic banks. Additionally, it allows for the balanced reporting of net risk transfers between immediate and ultimate risk data. Table 1 outlines the different claims categories covered in the data.
A further enhancement to the data was the inclusion of an expanded sector breakdown (see Table 3). The revised series sub-divides the non-bank private sector into non-bank financial institutions, non-financial corporations, and households.
Data enhancements are also available for the funding side of the banks’ consolidated balance sheet, with total liabilities disaggregated by instrument. These data are only available as a total, rather than on an individual country basis.
3. Analysis of Foreign Claims byIrish Banks
3.1 Overview – Foreign Claims over Total Assets
The proportion of foreign lending over total assets shows the importance of foreign lending to Irish banks. While this lending improves diversification, it also provides an indication of their vulnerability to spillover effects from other countries’ banks.8 The ratio of Irish banks’ foreign lending to total assets has remained relatively stable, starting at 31 per cent in Q4 2013, increasing to 35 per cent in Q2 2015, and falling back to 31 per cent in Q4 2016 (See Chart 1). For the UK, which accounts for the largest amount of foreign claims by Irish banks, the ratio of UK claims to total assets dropped to a low of 21 per cent in Q4 2016, having peaked at 26 per cent in Q2 2015. The scale of foreign claims against the UK highlights the vulnerability of Irish banks to any downturn in that economy.
Chart 2 shows that Irish banks’ foreign claims as a proportion of total assets, at 31 per cent, are close to the average for all reporting countries in Q4 2016. This would indicate that Irish banks are not overly exposed to
8 Total assets are only available since December 2013, with the inclusion of Ireland in the new data collection.
0
5
10
15
20
25
30
35
40
2014 2015 20162013
Q4 Q1 Q2 Q3 Q4 Q1 Q2 Q3 Q4 Q1 Q2 Q3 Q4
UK ClaimsAll Foreign Claims
Source: Central Bank of Ireland.
Chart 1: Foreign Claims over Total Assets;Total & UK
%
Table 1: Definition of breakdown of Claims
Foreign Claims (A+B+C)
International claims + Local claims in local currency
International Claims (A+B) Cross-border claims booked by banking offices outside of Ireland (A) + local claims booked by banking offices in Ireland in foreign currency (B)
Local Claims in Local Currency (C) Local claims booked by banking offices outside Ireland in local currency (C)
Domestic Claims
(D+E)
Cross-border claims booked by banking offices outside Ireland on residents in Ireland (D) + local claims booked by banking offices in Ireland on Irish residents (E)
Source: www.bis.org.

73Quarterly Bulletin 03 / July 17Consolidated Banking Data: Introducing Enhanced Statistics for Ireland
60%50%40%30%20%10%0%
Source: www.bis.org.
Chart 2: Proportion of Foreign Claims over TotalAssets, Q4 2016
TurkeyIndia
South KoreaItaly
Chinese Taipei
USFinland
AustraliaDenmark
GreeceIreland
All reporting countriesFrance
CanadaBelgium
UKNetherlands
Sweden
AustriaSingapore
Switzerland
0
50
100
150
200
250
‘16‘15‘14‘13‘12‘11‘10‘09‘08‘07‘06‘05‘04‘03‘02‘01‘00‘99
Q4 Q4 Q4 Q4 Q4 Q4 Q4 Q4 Q4 Q4 Q4 Q4 Q4 Q4 Q4 Q4 Q4 Q4
Source: Central Bank of Ireland.
Chart 3: Total Foreign Claims, Immediate Risk forIrish Banks, Q4 1999-Q4 2016
€ billion
foreign claims, in comparison to their peers in other countries. Countries with financial centres where domestic banks have large international operations, such as Singapore and Switzerland, have the highest proportion of claims over total assets.9 While Ireland has a large financial centre which hosts many foreign owned banks, the activities of Irish banks are more domestically focused.
3.2 Geographical Risk
Data on an immediate risk basis shows claims on counterparties and countries on a first counterpart basis. These data show how Irish banks have reduced their foreign exposures on a first counterpart basis, from a peak of €217 billion in Q3 2008 to just €79 billion in Q4 2016 (See Chart 3). Over the same period, the level of foreign claims fell consistently, with Q2 2011 recording the largest quarter-on-quarter decline of €31 billion.
In Q4 2008 there were claims against 129 territories on an immediate risk basis and 128 on an ultimate risk basis, but this had contracted to 108 territories in both categories by Q4 2016.10 However, the composition of these territories had undergone some changes between the two reporting periods. As can be seen from Chart 4, claims of Irish banks were overwhelmingly on the Developed Countries grouping, which accounted for 91 per cent pre-crisis and 95 per cent post-crisis on both an immediate and ultimate risk basis.11 While other exposures were relatively minor, pre-crisis data shows that Developing Europe was the next significant country grouping, but by Q4 2016 this had declined in importance. Conversely, International Organisations increased in significance on an immediate risk basis since 2013, reflecting the establishment of the European Financial Stability Facility and the European Financial Stability Mechanism.12
The same countries account for the largest declines in claims on an ultimate risk basis as for immediate claims. In both cases, the UK
9 Data for total assets is not freely available for all reporting countries.
10 Territories include a ‘residual’ for geographical regions, for example residual Europe. It also includes international organisations.
11 The country groupings of Developed Countries, Developing Europe, etc. are grouped according to the BIS reporting template, and follow closely those country groupings used by the Bank of England:
http://www.bankofengland.co.uk/statistics/Pages/iadb/notesiadb/consolidated_foreign_claims.aspx.
12 International Organisations does not include the ECB, which is resident in Germany, or the BIS, which is resident in Switzerland, for the purposes of the BIS Consolidated Banking Statistics.

74 Quarterly Bulletin 03 / July 17Consolidated Banking Data: IntroducingEnhanced Statistics for Ireland
recorded the highest falls between Q4 2008 and Q4 2016, with declines of €57 billion on immediate claims and €53 billion on ultimate claims. Despite this, the UK remains the predominant claims destination for Irish banks, as shown in Table 2. The equivalent figures for the US were €17 billion in both cases, while significant declines were also recorded for Poland, Spain, France and Germany.
Table 2 shows that total foreign claims fell by 61 per cent between the two reporting periods, with declines across all geographical areas with the exception of International Organisations and Developing Latin America & Caribbean countries on an immediate risk basis, and Offshore centres on an ultimate risk basis. The country grouping to record the largest percentage decline between the two periods was Developing Europe, much of which was attributable to the disposal by AIB of its operations in Poland.
Countries where Irish banks no longer have foreign claims on either risk bases include British Overseas Territories, Macau Sar and Kazakhstan. For immediate risks, San Marino and Honduras also no longer have claims, while Chile ceased to feature on an ultimate risk basis. However, exposures to these countries were small in Q4 2008, at around €260 million for immediate claims and €270 million for ultimate claims.
Conversely, when compared with Q4 2008, new exposures were recorded against Uruguay and Georgia in Q4 2016 for both risk bases. Trinidad & Tobago also provided exposures at the immediate risk level while Burkina Faso featured with regard to ultimate risk claims. Evidence of consolidation and deleveraging are shown in the fact that 29 countries that had an ultimate risk claim recorded against them in 2008, no longer appear in the data in Q4 2016. Again, the amounts were small, adding up to just under €20 million for immediate claims and €35 million for ultimate claims.
86
91
96
100
Q4 2016Q4 2008
Developed CountriesDeveloping Africa & Middle EastDeveloping Asia & PacificDeveloping EuropeDeveloping Latin America & CaribbeanInternational OrganisationsOffshore centres
Source: Central Bank of Ireland.
Chart 4: Proportional Country Groupings, 2008and 2016
%
-2000
-1500
-1000
-500
0
500
1000
1500
2000
2014 2015 20162013
Q4 Q1 Q2 Q3 Q4 Q1 Q2 Q3 Q4 Q1 Q2 Q3 Q4
Source: www.bis.org.
Chart 5: Risk Transfers Between Countries
€ billion
INWARD
OUTWARD
Germany Isle of Man United KingdomUnited States Other

75Quarterly Bulletin 03 / July 17Consolidated Banking Data: Introducing Enhanced Statistics for Ireland
13 While claims on Ireland are excluded from most of the analysis in this paper, it makes sense to include Ireland in risk transfer analysis, as risk transfers will sum to zero once claims on Ireland are included.
14 Cross-border claims on Uruguay disappear entirely when comparing immediate risk with ultimate risk, albeit, the volume is low at €17 million.
3.3 Risk Transfer
The collection of data on both an immediate risk basis and an ultimate risk basis allows users to analyse risk transfers between countries. The data shows how claims by Irish banks on foreign countries are transformed from immediate risk to ultimate risk, with reporting institutions submitting data on net risk transfers, broken down between inward transfers and outward transfers. Outward risk transfers reduce exposure to a given counterparty country, while the reverse is true for inward transfers. Using the example in Section 2, of a loan to an affiliate of an American headquartered company based in Luxembourg, an outward transfer would be recorded for Luxembourg and an inward transfer to the US where the ultimate risk resides. As the data includes Ireland since end-2013, it allows for a more meaningful analysis of this information, as all risk transfers, inward and outward, now sum to zero.13
An analysis of geographical regions of foreign claims by Irish banks shows that, between December 2013 and June 2015, offshore centres record mostly inward risk transfers, but from June 2015 onwards these became significant outward risk transfers. Conversely,
developed countries have recorded sizeable inward risk transfers from June 2015 onwards.
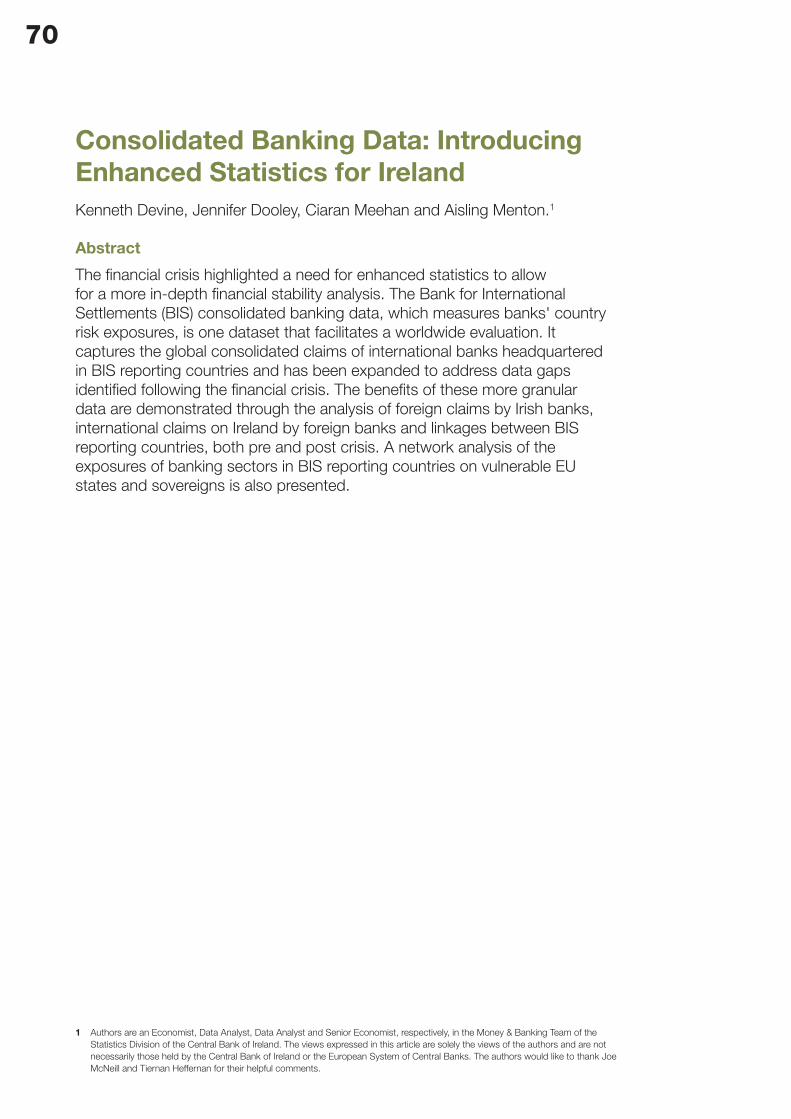
Chart 5 provides a breakdown by country highlighting that, since December 2013, the UK has recorded the biggest outward risk transfer each quarter. Another country of note is the Isle of Man. The recipients of these risk transfers are, in the most part, the US and Germany. These data are only available at the country level, without any sector breakdown. The scale of gross transfers (inward plus outward) indicates the importance of countries in terms of risk transfer. As can be seen from Chart 6, the UK, the US, Ireland, Belgium and Switzerland were the most active countries in terms of inward and outward risk transfer from Q4 2013-Q4 2016.
D’Avino (2016) examined the difference between claims from non-residents by location of residence on an ultimate risk basis and on an immediate risk basis for US banks. Replicating this analysis for Ireland in Q4 2016, reveals that Malta and Luxembourg are intermediary borrowers. Claims on these borrowers fall by €144 million (99 per cent) and €151 million (63 per cent), respectively, on an ultimate risk basis.14 For counterpart countries Switzerland and Germany, ultimate
Table 2: Risk Data by Geographic Region
Immediate Risk Ultimate Risk
Geographic Region Q4 2008 Q4 2016 % change
Q4 2008 Q4 2016 % change
Developed Countries 185,283 75,054 -59 187,729 75,215 -60
Of which:
United Kingdom 110,424 53,453 -52 105,965 52,492 -50
United States 23,207 6,004 -74 23,584 6,387 -73
Developing Africa and Middle East 447 151 -66 452 193 -57
Developing Asia and Pacific 318 20 -94 335 42 -87
Developing Europe 13,315 412 -97 13,189 412 -97
Developing Latin America and Caribbean 189 196 4 188 180 -4
International organisations 1,077 2,450 127 1,077 2,450 127
Offshore centres 4,002 1,009 -75 2,795 854 -69
Total 204,631 79,293 -61 205,765 79,347 -61
Source: Central Bank of Ireland.
76 Quarterly Bulletin 03 / July 17Consolidated Banking Data: IntroducingEnhanced Statistics for Ireland
risk positions are greater than immediate risk positions. Irish banks’ claims on Swiss residents total €222 million, while €269 million is due indirectly through transfers from other countries. Similarly, €628 million is due directly from German residents while almost €948 million is due from Germany via counterparties located in other countries. There are no noteworthy changes between ultimate risk and immediate risk for Canada and Italy, indicating that these claims are due directly to Irish banks without the involvement of a third country intermediary. According to D’Avino, company structures can be important as funding decisions are typically made at the group level. For instance, banks located in Offshore centres are mainly branches or subsidiaries of large-scale global banks and can act as intermediary borrowers.
4. Sector Breakdown of Claims
4.1 Immediate Risk
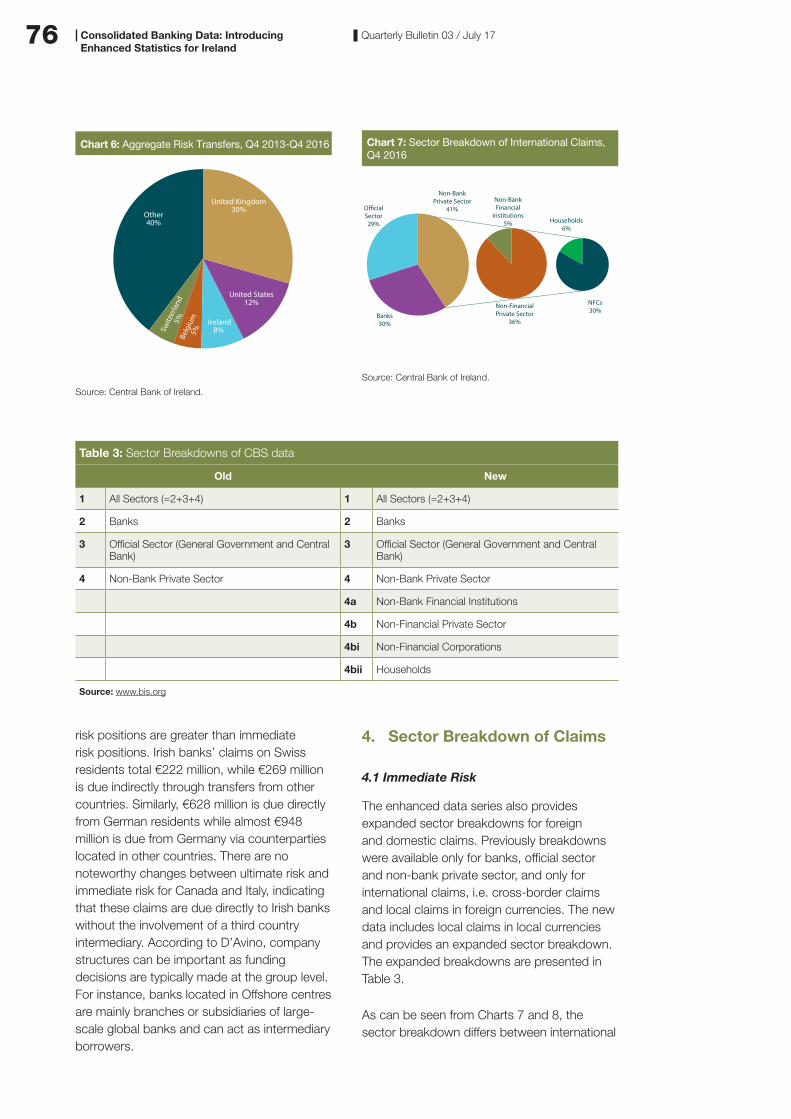
The enhanced data series also provides expanded sector breakdowns for foreign and domestic claims. Previously breakdowns were available only for banks, official sector and non-bank private sector, and only for international claims, i.e. cross-border claims and local claims in foreign currencies. The new data includes local claims in local currencies and provides an expanded sector breakdown. The expanded breakdowns are presented in Table 3.
As can be seen from Charts 7 and 8, the sector breakdown differs between international
Other40%
Switz
erla
nd5%
Be
lgiu
m5%
Ireland8%
United States12%
United Kingdom30%
Source: Central Bank of Ireland.
Chart 6: Aggregate Risk Transfers, Q4 2013-Q4 2016
Banks30%
O�cialSector29%
Non-BankPrivate Sector
41%Non-BankFinancial
Institutions5%
Non-FinancialPrivate Sector
36%
Households6%
NFCs30%
Source: Central Bank of Ireland.
Chart 7: Sector Breakdown of International Claims,Q4 2016
Table 3: Sector Breakdowns of CBS data
Old New
1 All Sectors (=2+3+4) 1 All Sectors (=2+3+4)
2 Banks 2 Banks
3 Official Sector (General Government and Central Bank)
3 Official Sector (General Government and Central Bank)
4 Non-Bank Private Sector 4 Non-Bank Private Sector
4a Non-Bank Financial Institutions
4b Non-Financial Private Sector
4bi Non-Financial Corporations
4bii Households
Source: www.bis.org

77Quarterly Bulletin 03 / July 17Consolidated Banking Data: Introducing Enhanced Statistics for Ireland
Banks1%
O�cialSector
9%
Other90%
Non-BankFinancial
Institutions9%
Non-FinancialPrivate Sector
81%
Households54%
NFCs26%
Source: Central Bank of Ireland.
Chart 8: Sector Breakdown of Local Claims, Q4 2016
claims (accounting for €30 billion in Q4 2016) and local claims in local currencies (accounting for €50 billion in Q4 2016). In Q4 2016, the non-bank private sector accounted for 41 per cent of international claims, of which 36 per cent were vis-à-vis the non-financial private sector. Lending to the official sector and banks accounted for the remaining 59 per cent.
In contrast, local claims in local currencies has a different profile, with 90 per cent of exposures recorded against the non-bank private sector (Chart 8). Of this, the non-financial private sector accounts for 81 per cent of total claims, of which 54 per cent was attributable to households, compared to just 6 per cent for international claims. This shows that local claims in local currencies, tend to have more interaction with domestic, non-financial business within the country where the banking office is located. The data for local claims in local currency is composed of just five countries, namely, Jersey, Isle of Man, France, UK and US.
At country level, the largest claims of Irish banks’ are on the UK and US. However, the sectoral composition of these claims differs between the two countries. As can be seen
in Chart 9, 88 per cent of claims on the UK were against the non-bank private sector in Q4 2016 compared to 78 per cent of claims on the US.15 Within the non-bank private sector, 52 per cent of claims on the UK are vis-à-vis households, while 62 per cent of claims on the US relate to non-financial corporations. The high level of claims on households in the UK most likely reflects the presence of Bank of Ireland in the UK mortgage market, through their partnership with the UK Post Office (BOI, 2015).
4.2 Ultimate Risk
Chart 10 shows developments in ultimate risk data since Q1 2008 broken down by sector. The expanded data available since Q4 2013 indicates that the household and NFC sectors are the most significant components of the non-bank private sector breakdown. These data are only available for total claims, and are not split between local and international claims. Comparing total immediate risk sectors against ultimate risk sectors, there is no difference in sector breakdown, therefore banks are not transferring risk between sectors.
15 Chart 10 shows sectors as a subset of main sectors. Banks, official sector and non-bank private sector add to 100 per cent. Non-bank financial institutions and non-financial private sector are a subset of non-bank private sector. Non-financial corporations and households are a subset of non-financial private sector.
United Kingdom United States
5% 3%9%
19%
7%
62%
7%
9%
28%51%
Source: Central Bank of Ireland.
Chart 9: Sector Claims on UK and US, Q4 2016
BanksOfficial SectorNon-Bank Financial InstitutionsNon-Financial CorporationsHouseholds

78 Quarterly Bulletin 03 / July 17Consolidated Banking Data: IntroducingEnhanced Statistics for Ireland
4.3 Maturity Breakdown
A remaining maturity breakdown is available for international claims, but not for local claims in local currency. As can be seen from Chart 11, international claims peaked in Q3 2007, at €145 billion.16 This had declined significantly by Q4 2016 to €30 billion. The chart shows that the remaining maturity of foreign claims has been predominantly in the over two years category. However, the remaining maturity of international claims has lengthened in recent times, with 73 per cent in the over two years category in Q4 2016, compared to just 54 per cent at the peak. The remaining maturity profile of Irish banks is significantly longer than that reported by all countries. For all countries, residual maturity of up to one year accounts for the majority of international claims.
5. Analysis of InternationalClaims on Ireland
International Claims on Ireland
The largest lenders to Irish residents on an ultimate risk basis among BIS reporting countries have typically been the UK and Germany, with France, the US, Belgium, the Netherlands and Japan (Chart 12) also being significant. However, the composition of these lenders has changed over the last number of years. It is important to note that international claims on Ireland are vis-à-vis all sectors of the economy, not just the banking sector.
In the period 2006 to 2008, substantial increases were observed for UK, US, German and French and claims on Ireland. This represented a period of strong growth in foreign claims on Ireland, which peaked in June 2008. During the period of the financial crisis, i.e. from Q1 2009 to end-2012, while overall claims declined, claims of German and UK banking groups declined substantially, by 56 per cent and 31 per cent respectively. Over
16 This data does not include local claims in local currencies, so the peak mentioned here will differ than that of total claims.
0
10
20
30
40
50
60
70
80
90
100
31/1
2/20
0831
/03/
2009
30/0
6/20
0930
/09/
2009
31/1
2/20
0931
/03/
2010
30/0
6/20
1030
/09/
2010
31/1
2/20
1031
/03/
2011
30/0
6/20
1130
/09/
2011
30/1
2/20
1130
/03/
2012
29/0
6/20
1228
/09/
2012
31/1
2/20
1228
/03/
2013
28/0
6/20
1330
/09/
2013
31/1
2/20
1331
/03/
2014
30/0
6/20
1430
/09/
2014
31/1
2/20
1431
/03/
2015
30/0
6/20
1530
/09/
2015
31/1
2/20
1531
/03/
2016
30/0
6/20
1630
/09/
2016
30/1
2/20
16
Official SectorNon-Bank Private SectorNon-Bank Financial InstitutionsNFCs
Banks
Households
Source: Central Bank of Ireland.
Chart 10: Sector Breakdown on Ultimate Risk Basis
%
0
20
40
60
80
100
120
140
160
2005 2006 2007 2008 2009 2010 2011 2012 2013 2014 2015 2016
Q2 Q4 Q2 Q4 Q2 Q4 Q2 Q4 Q2 Q4 Q2 Q4 Q2 Q4 Q2 Q4 Q2 Q4 Q2 Q4 Q2 Q4 Q2 Q4
Chart 11: Maturity Breakdown of InternationalClaims
€ billion
1 year to 2 years Over 2 yearsUp to 1 year
Source: Central Bank of Ireland.

79Quarterly Bulletin 03 / July 17Consolidated Banking Data: Introducing Enhanced Statistics for Ireland
the same period, Japanese banks’ claims increased by 23 per cent. Post 2012, German and UK banks’ claims on Ireland continued to decline, and had fallen by 68 per cent and 35 per cent, respectively, by end-Q4 2016. Japanese and US banking groups took their place, as the outstanding claims of each increased by 75 per cent and 44 per cent, respectively, over the same period. Japanese banks have increased their cross-border claims
since the financial crisis, and a large share of this is attributed to growing overseas loans by major Japanese banks (Lam, 2013).
Claims on Ireland are predominantly on the non-bank private sector (Chart 13). In 2006, 58 per cent of claims were against the non-bank private sector, and 40 per cent of claims were against Irish resident banks. The proportion of claims against Irish resident banks declined
0
100
200
300
400
500
600
700
2006 2008 2010 2012 2014 2016
Germany US France BelgiumUKJapanNetherlands
Source: www.bis.org.
Chart 12: Ultimate Lenders to Ireland
€ billion
0
100
200
300
400
500
600
2006 2008 2010 2012 2014 2016
Official Sector Non-Bank Private SectorBanks
Source: www.bis.org.
Chart 13: Ultimate Lending to Ireland by Sector
€ billion
Table 4: Liabilities of Irish Residents to Foreign Banks and Foreign Claims of Irish banks, by Country, Q4 2016, € million, Ultimate Risk
Nationality Liabilities Claims
United Kingdom 74,930 52,492
United States 63,586 6,387
Japan 38,942 82
France 36,079 3,914
Germany 25,129 948
Switzerland 16,209 269
Belgium 12,991 1,130
Netherlands 9,545 1,703
Italy 6,594 1,306
Source: BIS Consolidated Banking Statistics, Table B.4 and Central Bank of Ireland Consolidated Banking Statistics.

80 Quarterly Bulletin 03 / July 17Consolidated Banking Data: IntroducingEnhanced Statistics for Ireland
to just 10 per cent by Q4 2016, reflecting the global exposure reduction in the midst of the financial crisis, while the non-bank private sector increased, as a proportion, to over 83 per cent. The increase in claims on Ireland by Japanese and US banks has largely been vis-à-vis the non-bank private sector, principally to multinational corporations.
On an immediate risk basis, the countries whose banks had the largest claims on Irish residents, pre-crisis, were the UK and Germany (Chart 14). Belgium, France and the Netherlands also held large claims on Ireland in the pre-crisis period. Following the onset of the financial crisis, the US became an important player in early 2009, with Japanese claims becoming more significant since early 2013. By Q4 2016, the US and Japan accounted for 20 per cent and 12 per cent, respectively, of total immediate claims on Irish residents. The UK remained the country with the largest immediate claim, accounting for 22 per cent, while Germany held approximately 11 per cent.
Table 4 compares the foreign claims of Irish banks with liabilities of Irish residents to foreign banks. Given the international nature of the Irish economy through foreign multinational companies and the International Financial Services Centre (IFSC), it is not surprising that the liabilities of Irish residents to foreign banks
are significantly higher than the foreign claims of Irish banks. However, liabilities outstrip assets for most reporting countries. Examining the geography of international banking balance sheets liabilities is of vital importance, as their magnitude is likely to be much more important than that of claims (D’Avino, 2016). Total foreign claims of Irish Banks stood at €79 billion at end-Q4 2016, while total liabilities were significantly higher at €315 billion. Irish banks’ foreign claims on the US, on an ultimate risk basis, amounted to €6.4 billion as at end-Q4 2016. However, total liabilities of Irish residents to US banks’ worldwide equalled €63.6 billion. D’Avino's assertion is, therefore, particularly relevant in the case of Ireland.
5.1 Local Liabilities in Local Currencies
The data also includes a breakdown of local liabilities in local currencies. This details liabilities of Irish bank offices abroad, in the domestic currency, to counterparties located in the host country. Therefore, data is only available for those countries where Irish banks operated a local office. In the period since Q2 1999, this amounted to eight countries. However, at end-2014, local liabilities are reported for only two countries, namely the UK and the US. The UK accounted for the vast majority of local liabilities in local currencies.
5.2 Exposure to Vulnerable EU Countries
The total ultimate claims by BIS reporting countries on vulnerable EU countries17 amounted to €2.3 trillion at end-Q4 2008, with 22 per cent of these claims on Irish residents. Chart 15 illustrates the exposures of banking sectors in BIS reporting countries on vulnerable EU states using network analysis. Network analysis is useful for presenting the scale and depth of exposures figures. It also provides a set of tools and concepts for undertaking the analysis of relations and patterns (Driscoll, 2010). Charts 15 and 16 show claims by BIS reporting banks on vulnerable EU Countries in Q4 2008 and Q4 2016. The thickness of the lines represents the size of the claims, with the line between France and Italy representing a €337 billion claim and the line between the UK and Italy representing a €54 billion claim. Both charts are weighted to the largest claims, which were held by France in Q4 2008. In
0
100
200
300
400
500
2006 2008 2010 2012 2014 2016
Germany US Belgium FranceUKNetherlandsJapan
Source: www.bis.org.
Chart 14: Immediate Lenders to Ireland
€ billion

81Quarterly Bulletin 03 / July 17
addition to France, Germany and UK were also significant holders of vulnerable EU debt, as represented by the size of the nodes for these countries in Chart 15. The national banking groups of France the UK and Germany had claims of between 2 to 6 per cent of their total foreign lending activity on Irish residents as at end-Q4 2008, discernible from the thickness of the lines from these countries to Ireland. As stated above, 57 per cent of this total exposure on Ireland was to the non-bank private sector, which includes non-bank financial institutions, non-financial corporations (NFCs), households and non-profit institutions serving households (NPISHs). The remainder was lent to Irish banks.
Vulnerable EU borrowings from BIS reporting banks decreased substantially by €1.2 trillion from Q4 2008 to Q4 2016, causing a number of countries to fall out of the network and bring the outstanding amount of claims to €1.3
trillion (Chart 16). The top lenders to this group now included the US. Nearly one quarter of this decline related to claims on Ireland, which stood at just €315 billion at Q4 2016. The line between France and Italy represents a reduced claim of €264 billion, while the line between Spain and Italy highlights a claim of €50 billion. On a sector basis, claims on banks resident in vulnerable countries recorded the largest declines, yet claims on the non-bank sector also recorded substantial declines.
5.3 Exposure to Vulnerable EU Sovereigns
Exposure to the vulnerable EU sovereigns of Ireland, Italy, Spain, Portugal and Greece, amounted to €511 billion, or 18 per cent of all outstanding claims on the official sector for the BIS reporting countries at end-Q4 2008.18 The national banking sectors with the largest exposures were France, Belgium, Ireland,
Consolidated Banking Data: Introducing Enhanced Statistics for Ireland
17 Greece, Ireland, Italy, Portugal and Spain.
18 Institutions report data for Official sector, which includes the general government sector, central bank sector and international organisations. This is the proxy for sovereign debt used in this paper.
Chart 15: Network Analysis of Claims on Vulnerable EU Countries, Q4 2008
Claims € billionFrance � Italy 337Germany � Spain 182Germany � Italy 149Germany � Ireland 145UK � Ireland 137
Note: Created with NodeXL (http://nodexl.codeplex.com/). Only claims greater than €40 billion were included in this chart. Source: www.bis.org.
Chart 16: Network Analysis of Claims on Vulnerable EU Countries, Q4 2016
Claims € billionFrance � Italy 264France � Spain 96Germany � Italy 77UK � Ireland 75Spain � Portugal 73
Note: Only claims greater than €40 billion were included in this chart.Source: www.bis.org.

82 Quarterly Bulletin 03 / July 17Consolidated Banking Data: Introducing Enhanced Statistics for Ireland
Japan and the UK (note the size of the nodes in Chart 17). Italy was the most indebted sovereign to BIS reporting banks, accounting for 60 per cent of the total vulnerable EU sovereign debt. France held claims of €129 billion on Italy, as depicted by the thickness of the line between the two nations. Ireland’s public sector share was just two per cent (€11 billion), with French (€2.6 billion) and UK (€2.9 billion) banks together holding just under half of this exposure. However, this represented a relatively small proportion of the total exposures of these two national banking groups. Belgium, Switzerland and Japan also held 6 per cent, 6 per cent and 5 per cent of claims on the Irish sovereign debt, respectively.
Total exposure to the vulnerable EU sovereigns fell to €332 billion by Q4 2016, with euro area countries holding the majority of the claims. While claims of France on Italy had fallen significantly, they remained substantial, at €53 billion. Irish domestic banks significantly
reduced their exposure to this sector between Q4 2008 and Q4 2016. However, holdings of Irish sovereign debt by all BIS reporting banks had increased significantly to €23 billion in Q4 2016, from €11 billion in Q4 2008. The UK and US were the major holders of these claims on the Irish official sector in Q4 2016, whereas French domestic banks had reduced their exposure between the two periods (Chart 19).
6 Contingent Claims
Contingent claims include credit commitments and guarantees outstanding of all the worldwide offices of Irish resident banks. The data are collected on an ultimate risk basis. Guarantees and credit commitments represent the unutilised portions of binding contractual obligations and any other irrevocable commitments. A more detailed definition of guarantees and credit commitments is available in Table 5 (BIS, 2013). Only
Chart 17: Network Analysis of Claims on EU Periphery Sovereigns, Q4 2008
Claims € billionFrance � Italy 129Belgium � Italy 27France � Spain 25Ireland � Italy 25Japan � Italy 24
Note: Only claims greater than €7 billion are included in this chart.Source: www.bis.org.
Chart 18: Network Analysis of Claims on EU Periphery Sovereigns, Q4 2016
Claims € billionFrance � Italy 53Spain � Italy 34Germany � Italy 32Italy � Spain 28Germany � Spain 23
Note: Only claims greater than €7 billion are included in this chart.Source: www.bis.org.

83Quarterly Bulletin 03 / July 17Consolidated Banking Data: Introducing Enhanced Statistics for Ireland
commitments which, if utilised, would qualify as a cross-border claim and local claim in any currency, are included.
Contingent claims reached their peak in Q4 2005, at €13.8 billion, vis-à-vis 64 countries. This had fallen to €2.9 billion in Q4 2016, vis-à-vis 64 countries, although the composition has changed during the period. Credit commitments represent the largest proportion of foreign contingent claims, accounting for €2.4 billion in Q4 2016, compared to just €0.5 billion for guarantees. The UK accounted for
the largest proportion of credit commitments, at €1.4 billion, followed by the US. A similar pattern is evident for guarantees extended.
0
20
40
60
80
100
Q4 2016Q4 2008
US Germany France JapanUKBelgium
Source: www.bis.org.
Chart 19: Exposure of BIS Reporting Countries toIrish Sovereign, 2008 v 2016
%
US27%
France7%
Germany4%
Other8%
UK54%
Source: Central Bank of Ireland.
Chart 20: Contingent Claims Q4 2016
Table 5: Contingent Liabilities Definition
Guarantees extended Contingent liabilities arising from an irrevocable obligation to pay a third-party beneficiary when a client fails to perform certain contractual obligations. They include secured, bid and performance bonds, warranties and indemnities, confirmed documentary credits, irrevocable and standby letters of credit, acceptances and endorsements. Guarantees extended also include the contingent liabilities of the protection seller of credit derivatives instruments.
Credit commitments Arrangements that irrevocably obligate an institution, at a client’s request, to extend credit in the form of loans, participation in loans, lease financing receivables, mortgages, overdrafts or other loan substitutes or commitments to extend credit in the form of the purchase of loans, securities or other assets, such as backup facilities including those under note issuance facilities and revolving underwriting facilities.
Source: www.bis.org.

84 Quarterly Bulletin 03 / July 17Consolidated Banking Data: Introducing Enhanced Statistics for Ireland
7 Conclusion
This article discussed the BIS consolidated banking data, introducing geographic and sectoral breakdowns for Ireland, not previously published by the Central Bank of Ireland. The enhanced dataset shows how foreign claims by Irish banks have declined substantially since the onset of the financial crisis, both on an immediate and an ultimate risk basis. Claims are overwhelmingly on developed economies with the UK predominant. While international claims span all sectors, local claims by foreign offices of Irish banks are principally with households and NFCs. The article also compares the foreign claims of Irish banks with liabilities of Irish residents to foreign banks. Liabilities clearly outstrip claims of Irish banks, reflecting the globalised nature of the Irish economy. Finally, exposures to vulnerable EU countries, including Ireland, are examined using network analysis. Vulnerable borrowings have declined significantly since the onset of the crisis, with claims on banks recording the largest decrease. While overall claims on vulnerable country sovereigns have also fallen since 2008, the reverse is true for Ireland. The enhanced data provide very valuable information in terms of analysing vulnerabilities from foreign exposures of national banks, and in assessing the indebtedness of domestic entities to foreign banks.

85Quarterly Bulletin 03 / July 17Consolidated Banking Data: Introducing Enhanced Statistics for Ireland
References
Bank for International Settlements. 2013. “Guidelines for reporting BIS international banking statistics” http://www.bis.org/statistics/bankstatsguide.pdf
Bank of Ireland. 2015. “Annual Report for the Year Ended 31 December 2015”. http://investorrelations.bankofireland.com/wp-content/assets/BOI-Annual-Report-2015.pdf
Committee on the Global Financial System. 2012. “Improving the BIS International Banking Statistics” CGFS Publications, No. 47, November 2012. http://www.bis.org/publ/cgfs47.htm
D’Avino, Carmela. 2016. “US banks’ international balance sheet linkages: a data survey”, Journal of Financial Economic Policy, Vol. 8 Issue: 4, pp.514-531. https://doi.org/10.1108/JFEP-02-2016-0015
Driscoll, Áine. 2010. “Monitoring Systemic Risk to the Irish Banking System Through Network Analysis Using Consolidated Banking Statistics”. Master of Arts in Policy Evaluation and Planning, University College Galway.
Financial Stability Board and International Monetary Fund. 2009. “The Financial Crisis and Information Gaps”, Report to the G20 Financial Ministers and Central Bank Governors, 20 October 2009. https://www.imf.org/external/np/g20/pdf/102909.pdf
Lam, Waikei, Raphael. 2013. “Cross-border Activity of Japanese Banks”. International Monetary Fund Working Paper, WP/13/235. http://www.imf.org/external/pubs/ft/wp/2013/wp13235.pdf