(consolidated) doosan heavy industries & construction co ... · doosan heavy industries &...
TRANSCRIPT
DOOSAN HEAVY INDUSTRIES & CONSTRUCTION CO., LTD. AND SUBSIDIARIES
Consolidated Financial Statements As of and For the Year Ended December 31, 2016
ATTACHMENT: Independent Auditor’s Report
DOOSAN HEAVY INDUSTRIES & CONSTRUCTION CO., LTD.
DOOSAN HEAVY INDUSTRIES & CONSTRUCTION CO., LTD. AND SUBSIDIARIESConsolidated Financial Statem
ents Decem
ber 31, 2016

INDEPENDENT AUDITOR’S REPORT
English Translation of Independent Auditor’s Report Originally Issued in Korean on March 23,
2017
To the Shareholders and Board of Directors of
Doosan Heavy Industries & Construction Co., Ltd.
We have audited the accompanying consolidated financial statements of Doosan Heavy Industries
& Construction Co., Ltd. (the “Company”) and its subsidiaries (the “Group”), which comprise
the consolidated statements of financial position as of December 31, 2016 and the consolidated
statements of income, consolidated statements of comprehensive income, consolidated statements
of changes in shareholders’ equity and consolidated statements of cash flows, all expressed in
Korean won, for the year ended December 31, 2016 and a summary of significant accounting
policies and other explanatory information.
Management’s Responsibility for the Consolidated Financial Statements
Management is responsible for the preparation and fair presentation of these consolidated
financial statements in accordance with Korean International Financial Reporting Standards (“K-
IFRS”) and for such internal control as management determines is necessary to enable the
preparation of consolidated financial statements that are free from material misstatement, whether
due to fraud or error.
Auditor’s Responsibility
Our responsibility is to express an audit opinion on these consolidated financial statements based
on our audits. We conducted our audits in accordance with Korean Standards on Auditing
(“KSAs”). Those standards require that we comply with ethical requirements and plan and
perform the audit to obtain reasonable assurance about whether the consolidated financial
statements are free from material misstatement.
An audit involves performing procedures to obtain audit evidence about the amounts and
disclosures in the consolidated financial statements. The procedures selected depend on the
auditor’s judgment, including the assessment of the risks of material misstatement of the
consolidated financial statements, whether due to fraud or error. In making those risk assessments,
the auditor considers internal control relevant to the entity’s preparation and fair presentation of
the consolidated financial statements in order to design audit procedures that are appropriate in
the circumstances, but not for the purpose of expressing an opinion on the effectiveness of the
entity’s internal control. An audit also includes evaluating the appropriateness of accounting
policies used and the reasonableness of accounting estimates made by management, as well as
evaluating the overall presentation of the consolidated financial statements.
We believe that the audit evidence we have obtained is sufficient and appropriate to provide a
basis for our audit opinion.
Deloitte Anjin LLC9F., One IFC,10, Gukjegeumyung-ro,Youngdeungpo-gu, Seoul07326, Korea
Tel: +82 (2) 6676 1000Fax: +82 (2) 6674 2114www.deloitteanjin.co.kr
Deloitte refers to one or more of Deloitte Touche Tohmatsu Limited, a UK private company limited by guarantee (“DTTL”), its network of member firms, and their related entities. DTTL and each of its member firms are legally separate and independent entities. DTTL (also referred to as “Deloitte Global”) does not provide services to clients. Please see www.deloitte.com/kr/about for a more detailed description of DTTL and its member firms.
© 2017. For information, contact Deloitte Anjin LLC
Opinion
In our opinion, the consolidated financial statements present fairly, in all material respects, the
financial position of the Doosan Heavy Industries & Construction Co., Ltd as of December 31,
2016 and its financial performance and its cash flows for the year ended December 31, 2016 in
accordance with K-IFRS.
Emphasis of matter
Although our opinion is not modified in respect of this matter, we draw attention to the note 26
to the financial statements on the following matters.
(1) Emphasis matters related to production to order industry and others
In accordance with ‘Auditing practice guidance 2016-1’ in the Republic of Korea, we noted
this matter requires significant attention per our professional judgement and from
communication with those charged with governance. These matters were addressed in respect
to our review of the interim consolidated financial statements as a whole, and we do not
provide a separate opinion on these matters.
In forming an audit opinion on the consolidated financial statements of Doosan Heavy
Industries & Construction Co., Ltd., we incorporated the results of the audit procedures
performed on the significant audit areas as follows:
1) General matters
The general matters applicable to order industry described in this report that requires
significant attention are as follows.
The Group recognizes contract revenue and contract cost associated with the construction
contract when the outcome of a contract can be reliably measured by stage of completion
of the contract activity at the end of the reporting year. However, when the outcome of a
construction contract cannot be estimated reliably, revenue is recognized only to the extent
the contract costs have incurred that is probable that it will be recoverable and contract
costs is recognized as expenses in the period in which they are incurred. When the
uncertainties that prevented the outcome of the contract being estimated reliably no longer
exist, revenue and expenses associated with the construction contract shall be recognized
as revenue and expenses respectively by stage of completion of the contract activity at the
end of the reporting period. When an uncertainty arises on the collectability of an amount
already included in contract revenue, and already recognized in profit or loss, the
uncollectible amount or the amount of which the is no longer probable is recognized as an
expense rather than as an adjustment to the amount of contract revenue.
In case the Group is able to estimate the outcome of a construction contract reliably, the
Group shall determine the stage of completion of a contract. The Group uses the method
that reliably measures the work performed, depending on the nature of the contract. As of
December 31, 2016, the Group determined that using the rate of accumulated costs incurred
until the end of the reporting period in comparison with total estimated costs per individual
contract is the most reliable method to measure the work performed, and therefore the
Group uses the stage of completion to calculate the contract costs incurred to date and
recognizes contract revenue and contract cost accordingly.
When contract costs incurred to date plus recognized profits(less recognized losses) exceed
the progress billing, the surplus is shown as amounts due from customers for contract work.
For contracts where progress billings exceed contract the costs incurred to date plus
recognized profits(less recognized losses), the surplus is shown as the amounts due to
customers for contract work.
2) Adequacy of revenue recognition based on the stage of contract completion by input
method
In case the Group recognizes revenues and costs based on the stage of contract completion
when the outcome of a construction contract cannot be estimated reliably, there is a risk of
misstatement on revenues and costs. Additionally, when the Group uses the method to
measure stage of completion which does not reflect the work performed, there is a risk of
material misstatement on revenues and costs. Therefore, we determined revenue
recognition based on the stage of contract completion by input method to require
significant attention.
We conducted the following main procedures to review the adequacy of revenue
recognition based on the stage of contract completion by input method.
• We inquired and documented our inspection whether major projects meet all criteria to
measure the outcome of a construction contract can be estimated reliably.
• We performed inquiries about whether the input method that the Group used is able to
reliably measure the work performed.
• We performed inquiries whether the outcome of a construction contract can still be
estimated reliably for delaying projects exist.
• We performed inquiries and analytical procedures to confirm whether the outcome of a
construction contract can still be reliably estimate a project that the Group recognizes
allowances of accounts receivable or due from the customers for contract work.
3) The uncertainty of the estimated total contract cos
As disclosed in notes 26 to the financial statements, the impact on current and future profit
and loss due to changes in estimated total contract cost is KRW 118,995 million and KRW
128,912 million respectively and impact on the balance of due from (to) customers for
contract work amounts to KRW 118,995 million. As such, in case the Group changes
estimates of total contract cost, the stage of contract completion could be revised resulting
in changes in current and future profit and loss and the balance of due from (to) the
customers for contract work. As such, we determined that the uncertainty of the estimated
total contract cost that reflects management's judgment requires significant attention.
We performed the following main audit procedures in order to identify the impact on
financial statements due to the uncertainty of estimate of the estimated total contract cost.
• We performed inspection about the summation logic of entity’s system and procedures
to measure the estimated total contract costs.
• We performed inspection about the interface by verifying whether the actual costs are
equal to the estimated total contract costs which is calculated by Group’s system or not.
• We performed inspection about the interface by comparing the Group’s system with the
contract party’s system.

• We performed inquiries about reason for projects that the proportion that estimated total
contract costs bear to the total contract revenue has been changed significantly compared
to prior period.
• We performed inquiries about reason for significant change of the estimated total
contract cost compared to prior period.
• We performed inquiries for a reason for projects that are finalized during current period
and actual cost to revenue ratio is departed from estimated cost to revenue ratio.
• We have compared the estimated total contract costs at the end of this period against
estimated total contract costs in the Group’s system about major project.
• We have performed comparison and analytical procedures between estimated total
contract costs at the end of this period and estimated total contract costs after the end of
this period about major project.
• We performed comparison and analytical procedures between future estimated costs in
the end of this period and the detail of awarding contract after the end of this period
about a part of project.
4) Adequacy of the calculation of stage of contract completion.
As disclosed in notes 3 to the financial statements (significant accounting judgements and
key sources of estimation uncertainties), there is a risk of misstatements that could adjust
the future balance of assets and liabilities if the Group recognizes revenue based on the
stage of contract completion. Additionally, when the Group measures the stage of
completion of a contract based on the proportion that contract costs incurred for work
performed to date bear to the estimated total contract costs, there is a risk of misstatements
on revenue and cost if the Group includes costs those contract costs that does not reflect
work performed when the Group measure the stage of contract completion resulting in
inadequate calculation. Therefore we determined that adequacy of the calculation of stage
of contract completion requires significant attention.
We performed the following main audit procedures to identify adequacy of the calculation
of stage of contract completion.
• We performed recalculation of the stage of contract completion.
• We performed inquiries about whether contract costs reflect work performed were
included in costs incurred to date and policies implemented to identify contract costs
which should be excluded in calculation of stage of contract completion.
• We performed inquiries about projects that the stage of contract completion changed
significantly compared to prior period.
• We performed comparative review between the stage of contract completion and the
stage of progress completion about major projects.
• We documented our inspection results about the sample extracted from major projects
about contract cost incurred.

5) Collectability of amount due from customers for contract work
The amount due from customers is KRW 1,930,663 million and KRW 1,898,305 million,
as of December 31, 2016 and 2015, respectively, which is increased by 1.7% compared to
the end of prior period. We determined that the collectability of amount due from
customers for contract work requires significant attention, given there are overstatement
risks of misstatement on the amount of due from customers in case the Group fails to
recognize appropriate amount of allowance resulting from inappropriate collectability
valuation. Since there is an uncertainty over the estimation of collectable amount due from
customers for contract work, we determined that collectability of amount due from
costumers for contract work requires significant attention.
We performed the following main audit procedures to identify the collectable amount due
from customers for contract work.
• We performed inquiries and analytic procedures on slow-moving due from the
customers for contract work.
• We documented our inspection results on long-term due from the customers for contract
work.
• We performed inquiries and analytical procedures about collectability in case there are
projects which the Group recognized allowances on the account receivable and have
outstanding due from customers for contract work.
• We performed inquiries and analytical procedures about collectability of due from
customers for contract work related to delaying projects.
6) Adequacy of accounting treatment of variations in contract work
The Group includes the impact of variations in contract work to contract revenue only if it
is probable that the customer will approve the variation and the amount of revenue arising
from the variation and the amount of revenue can be reliably measured. And the revenue
could be increased by a claim that is an amount that the contractor seeks to collect from
the customer or another party as reimbursement for costs not included in the contract price.
The Group only includes the impact of a claim to the contract revenue when negotiations
have reached an advanced stage such that it is probable that the customer will accept the
claim and it is probable the amount will be accepted by the customer and such can be
measured reliably. Additionally, the amount of contract revenue may decrease as a result
of penalties arising from delays caused by the contractor in the completion of the contract
when it is probable that the penalty will incur and the penalty can be reasonably measured.
Since there is a risk of misstatement of revenue when the Group reflect change orders,
claims and penalty to the contract revenue inappropriately, we determined that the
accounting treatment of variations in contract work requires significant attention.
We performed the following main audit procedures to identify adequacy of accounting
treatment of variations in contract work
• We performed inquiries about adequacy of accounting treatment of variations in contract
work and penalties.
• We performed inquiries about reason for significant variation of the estimated total
contract revenue.

• We performed inquiries about reason for projects that the proportion that estimated total
contract costs bear to the total contract revenue has been changed significantly compared
to prior period.
• We performed analytical procedure and document inspection for cut-off related
significant variation of contract revenue after December 31, 2016.
• We performed inquiries and analytical procedures for projects that the Group recognizes
penalties.
• We performed inquiries about whether there are any exposures to liquidated damages
for late delivery of contract works.
Others
The accompanying consolidated statements of financial position as of December 31, 2015, and
the consolidated statements of income, comprehensive income, changes in equity and cash flows
for the year then ended were audited by other auditors in accordance with the KSAs and an
unqualified opinion was expressed on March 17, 2016.
March 23, 2017
Notice to Readers
This report is effective as of March 23, 2017, the independent auditors’ review report date.
Certain subsequent events or circumstances may have occurred between the independent auditors’
review report date and the time independent auditors’ review report is read. Such events or
circumstances could significantly affect the accompanying consolidated financial statements and
may result in modifications to the independent auditors’ review report.
DOOSAN HEAVY INDUSTRIES & CONSTRUCTION CO.,
LTD. AND SUBSIDIARIES (the “Group”) CONSOLIDATED FINANCIAL STATEMENTS
As of and For the Years Ended December 31, 2016 and 2015
The accompanying consolidated financial statements, including all footnote disclosures, were
prepared by, and are the responsibility of, the Group.
Ji Taik Chung
Chief Executive Officer
DOOSAN HEAVY INDUSTRIES & CONSTRUCTION CO., LTD.
-1-

DOOSAN HEAVY INDUSTRIES & CONSTRUCTION CO., LTD. AND SUBSIDIARIES
CONSOLIDATED STATEMENTS OF FINANCIAL POSITION
AS OF DECEMBER 31, 2016 AND 2015
ASSETS Notes December 31, 2016 December 31, 2015
(In Korean won)
CURRENT ASSETS:
Cash and cash equivalents 4,5,10 ₩1,369,500,991,930 ₩1,893,007,747,878
Short-term financial instruments 4,5,10,34 213,506,823,569 475,822,932,100
Short-term investments in securities 4,6,10 141,391,168,087 440,994,129
Trade receivables, net 4,7,10,26,34,35 2,077,740,448,109 2,512,793,814,167
Due from customers for contract work, net 7,26 1,930,663,406,075 1,898,305,160,818
Other receivables, net 4,7,10,35 310,731,723,694 389,866,374,113
Prepayments 7 509,753,411,844 617,000,416,576
Prepaid expenses 101,614,362,264 80,051,592,909
Short-term loans, net 4,7,10,35 114,094,313,691 178,384,058,498
Derivative financial assets 4,9,10 24,494,373,789 24,409,004,032
Firm commitment assets 9 108,462,686,041 111,500,155,075
Inventories, net 8,34 1,730,606,651,053 2,196,491,764,508
Assets classified as held-for-sale 37 164,771,988,116 119,220,470,226
Other current assets 4,7,10 237,819,498,203 227,111,159,002
Total Current Assets 9,035,151,846,465 10,724,405,644,031
NON-CURRENT ASSETS:
Long-term financial instruments 4,5,7,10 31,395,752,125 77,402,476,564
Long-term investments in securities 4,6,10,34 286,332,778,653 190,420,094,063
Investments in associates and joint ventures 11,34 80,681,100,934 62,411,138,388
Long-term loans, net 4,7,10,35 910,287,291,842 1,019,229,605,248
Property, plant and equipment, net 12,34 6,381,539,477,026 7,206,578,365,565
Intangible assets, net 13 6,646,199,554,028 6,657,774,324,948
Investment properties 14 270,299,018,663 30,516,385,496
Derivative financial assets 4,9,10 80,958,564,225 63,996,129,207
Firm commitment assets 9 80,039,145,810 73,771,115,605
Guarantee deposits, net 4,5,7,10 320,258,434,073 253,322,937,601
Deferred tax assets 31 641,043,930,920 782,988,943,041
Other non-current assets 4,7,10 68,381,295,591 117,323,450,501
Total Non-Current Assets 15,797,416,343,890 16,535,734,966,227
TOTAL ASSETS ₩24,832,568,190,355 ₩27,260,140,610,258
(Continued)
-2-

DOOSAN HEAVY INDUSTRIES & CONSTRUCTION CO., LTD. AND SUBSIDIARIES
CONSOLIDATED STATEMENTS OF FINANCIAL POSITION
AS OF DECEMBER 31, 2016 AND 2015
LIABILITIES AND EQUITY Notes December 31, 2016 December 31, 2015
(In Korean won)
CURRENT LIABILITIES:
Trade payables 4,10,35 ₩2,452,138,916,210 ₩2,259,960,866,728
Short-term borrowings 4,10,15,34 2,892,687,287,708 3,943,165,035,852
Asset-backed loans 4,10,15 432,987,691,317 394,044,438,739
Other payables 4,10,35 853,291,882,847 797,731,063,373
Advanced received 358,558,830,351 346,939,985,983
Due to customers for contract work 26 905,668,479,628 1,200,598,386,238
Withholdings 71,843,985,942 84,990,443,174
Accrued expenses 10 491,867,768,087 579,421,166,491
Income tax payable 31 47,638,985,415 35,923,644,791
Current portion of long-term debt 4,10,15,34 2,531,345,860,669 2,252,663,857,555
Derivative financial liabilities 9,10 174,733,740,322 217,439,689,022
Firm commitment liabilities 9 11,617,547,945 16,325,825,501
Other provisions 17 118,561,044,391 130,417,938,027
Debt classified as held-for-sale 37 24,706,942,176 -
Other current liabilities 4,10 214,167,916,135 195,873,537,768
Total Current Liabilities 11,581,816,879,143 12,455,495,879,242
NON-CURRENT LIABILITIES:
Bonds 4,10,15 1,753,691,202,152 2,547,984,215,918
Long-term borrowings 4,10,15,34 2,534,990,813,266 3,282,290,330,730
Long-term asset-backed loans 4,10,15 246,974,997,243 150,408,282,978
Long-term other payables 4,10 35,611,850,491 41,882,360,478
Employee benefits liability 16 866,404,829,367 900,192,936,968
Deposits received 10 189,263,467,929 152,617,695,614
Derivative financial liabilities 9,10 128,882,334,708 147,638,954,643
Firm commitment liabilities 9 18,966,908,638 28,734,919,118
Deferred tax liabilities 31 183,072,101,886 118,224,240,213
Other provisions 17 233,110,602,232 244,242,092,508
Other non-current liabilities 4,10 236,951,287,264 164,321,029,716
Total Non-current Liabilities 6,427,920,395,176 7,778,537,058,884
Total Liabilities ₩18,009,737,274,319 ₩20,234,032,938,126
(Continued)
-3-

DOOSAN HEAVY INDUSTRIES & CONSTRUCTION CO., LTD. AND SUBSIDIARIES
CONSOLIDATED STATEMENTS OF FINANCIAL POSITION
AS OF DECEMBER 31, 2016 AND 2015
Notes December 31, 2016 December 31, 2015
(In Korean won)
EQUITY:
Equity attributable to owners of the Parent:
Capital stock 1,18 ₩596,808,980,000 ₩596,808,980,000
Capital surplus 19 1,652,835,160,666 1,563,917,672,526
Other components of equity 20 (17,273,121,037) (105,157,160,978)
Accumulated other comprehensive income 9,10,21 538,782,208,792 512,011,506,902
Retained earnings 22 704,507,685,246 1,013,088,220,397
Subtotal 3,475,660,913,667 3,580,669,218,847
Non-controlling interests
Hybrid equity instruments 23 841,535,153,252 841,695,963,991
Other non-controlling interests 23 2,505,634,849,117 2,603,742,489,294
Subtotal 3,347,170,002,369 3,445,438,453,285
Total Equity 6,822,830,916,036 7,026,107,672,132
TOTAL LIABILITIES AND EQUITY
₩24,832,568,190,355 ₩27,260,140,610,258
(Concluded)
See Notes
-4-
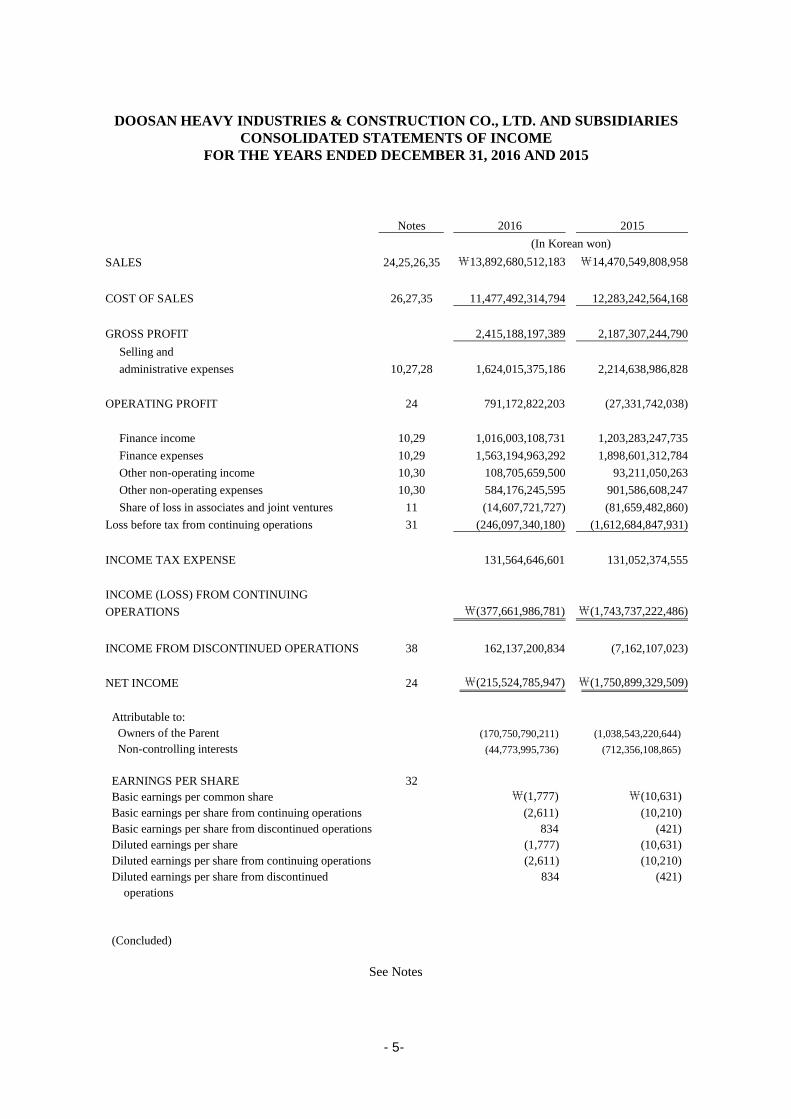
DOOSAN HEAVY INDUSTRIES & CONSTRUCTION CO., LTD. AND SUBSIDIARIES
CONSOLIDATED STATEMENTS OF INCOME
FOR THE YEARS ENDED DECEMBER 31, 2016 AND 2015
Notes 2016 2015
(In Korean won)
SALES 24,25,26,35 ₩13,892,680,512,183 ₩14,470,549,808,958
COST OF SALES 26,27,35 11,477,492,314,794 12,283,242,564,168
GROSS PROFIT 2,415,188,197,389 2,187,307,244,790
Selling and
administrative expenses 10,27,28 1,624,015,375,186 2,214,638,986,828
OPERATING PROFIT 24 791,172,822,203 (27,331,742,038)
Finance income 10,29 1,016,003,108,731 1,203,283,247,735
Finance expenses 10,29 1,563,194,963,292 1,898,601,312,784
Other non-operating income 10,30 108,705,659,500 93,211,050,263
Other non-operating expenses 10,30 584,176,245,595 901,586,608,247
Share of loss in associates and joint ventures 11 (14,607,721,727) (81,659,482,860)
Loss before tax from continuing operations 31 (246,097,340,180) (1,612,684,847,931)
INCOME TAX EXPENSE 131,564,646,601 131,052,374,555
INCOME (LOSS) FROM CONTINUING
OPERATIONS ₩(377,661,986,781) ₩(1,743,737,222,486)
INCOME FROM DISCONTINUED OPERATIONS 38 162,137,200,834 (7,162,107,023)
NET INCOME 24 ₩(215,524,785,947) ₩(1,750,899,329,509)
Attributable to:
Owners of the Parent (170,750,790,211) (1,038,543,220,644)
Non-controlling interests (44,773,995,736) (712,356,108,865)
EARNINGS PER SHARE 32
Basic earnings per common share ₩(1,777) ₩(10,631)
Basic earnings per share from continuing operations (2,611) (10,210)
Basic earnings per share from discontinued operations 834 (421)
Diluted earnings per share (1,777) (10,631)
Diluted earnings per share from continuing operations (2,611) (10,210)
Diluted earnings per share from discontinued
operations
834 (421)
(Concluded)
See Notes
-5-

DOOSAN HEAVY INDUSTRIES & CONSTRUCTION CO., LTD. AND SUBSIDIARIES
CONSOLIDATED STATEMENTS OF COMPREHENSIVE INCOME
FOR THE YEARS ENDED DECEMBER 31, 2016 AND 2015
Note 2016 2015
(In Korean won)
NET INCOME ₩(215,524,785,947) ₩(1,750,899,329,509)
OTHER COMPREHENSIVE INCOME (LOSS) 21 (28,495,650,754) 319,962,397,817
Items that will not be reclassified subsequently to profit or loss: (96,116,788,148) 378,588,917,167
Remeasurements of net defined benefit liabilities 16 (68,268,654,681) 18,841,106,569
Net gain (loss) on revaluation of land 12 (27,848,133,467) 359,747,810,598
Items that may be reclassified subsequently to profit or loss: 67,621,137,394 (58,626,519,350)
Net change in unrealized fair value of available-for-sale
financial assets 10 19,919,849,838 (3,104,626,549)
Effective portion of changes in fair value of cash flow
hedges 9,10 20,130,625,897 12,063,776,264
Equity adjustments in equity method (debit) (108,837,338) 1,340,919,348
Net loss on translation of foreign operations 27,679,498,997 (68,926,588,413)
Total other comprehensive income (loss) ₩(244,020,436,701) ₩(1,430,936,931,692)
COMPREHENSIVE INCOME (LOSS) ATTRIBUTABLE TO:
Owners of the Parent (191,711,547,908) (726,791,363,904)
Non-controlling interests (52,308,888,793) (704,145,567,788)
(Concluded)
See Notes
-6-

DOOSAN HEAVY INDUSTRIES & CONSTRUCTION CO., LTD. AND SUBSIDIARIES
CONSOLIDATED STATEMENTS OF CHANGES IN SHAREHOLDERS’ EQUITY
FOR THE YEARS ENDED DECEMBER 31, 2016 AND 2015
Capital stock Capital surplus
Other components of
equity
Accumulated
other comprehensive
income Retained earnings
Non-controlling
interests Total
(In Korean won)
Balance at January 1, 2015 ₩596,808,980,000 ₩1,828,284,636,585 ₩(101,795,674,821) ₩220,918,859,061 ₩2,115,202,768,057 ₩3,017,582,151,050 ₩7,677,001,719,932
Total comprehensive income:
Loss of the period - - - - (1,038,543,220,644) (712,356,108,865) (1,750,899,329,509)
Remeasurement of the net defined benefit liabilities - - - - 3,500,483,847 15,340,622,722 18,841,106,569
Net change in unrealized fair value of AFS financial assets - - - (30,340,636,819) - 27,236,010,270 (3,104,626,549)
Effective portion of changes in fair value of cash flow hedges - - - 55,555,208,269 - (43,491,432,005) 12,063,776,264
Equity adjustments in equity method (debit) - - - 2,183,896,859 - (842,977,511) 1,340,919,348
Net loss on translation of foreign operations - - - (16,612,368,911) - (52,314,219,502) (68,926,588,413)
Net gain on revaluation of land - - - 280,306,548,443 17,158,725,052 62,282,537,103 359,747,810,598
Subtotal - - - 291,092,647,841 (1,017,884,011,745) (704,145,567,788) (1,430,936,931,692)
Dividends - - - - (84,230,535,915) - (84,230,535,915)
Stock option - 2,100,996,093 (1,116,157,779) - - - 984,838,314
Changes in the scope of consolidation - - - - - 1,080,996,843 1,080,996,843
Capital increase by issuing new shares of subsidiaries - - (231,156,754) - - 916,908,916,650 916,677,759,896
Dividends of the subsidiaries - - - - - (85,494,554,491) (85,494,554,491)
Stock option of the subsidiaries - 1,928,367,105 (1,731,065,518) - - 315,353,901 512,655,488
Transactions of treasury stock by subsidiaries - 23,860,561,032 - - - (33,858,304,362) (9,997,743,330)
Issuance and exercise of convertible bonds by subsidiaries - (65,478,549,444) - - - 105,988,016,531 40,509,467,087
Transfer of business between subsidiaries - - (283,106,106) - - 283,106,106 -
Changes of the non-controlling interest - (226,778,338,845) - - - 226,778,338,845 -
Balance at December 31, 2015 ₩596,808,980,000
₩1,563,917,672,526 ₩(105,157,160,978) ₩512,011,506,902 ₩1,013,088,220,397 ₩3,445,438,453,285 ₩7,026,107,672,132
(Continued)
-7-
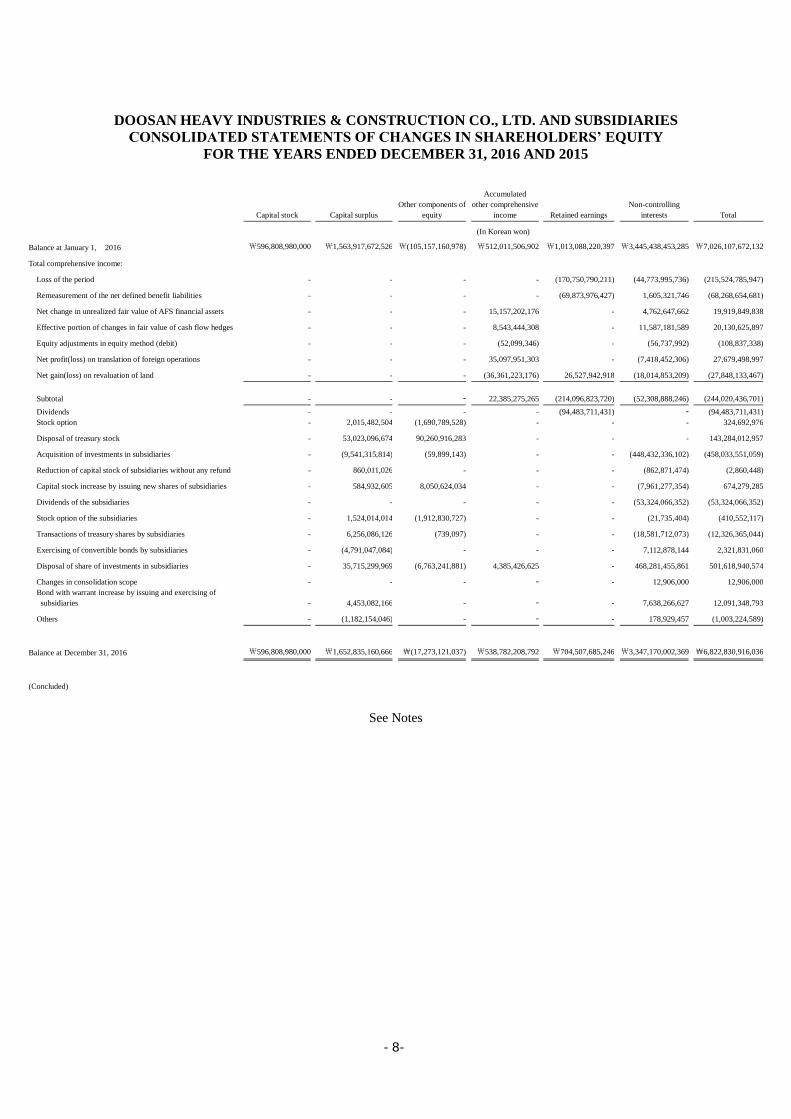
DOOSAN HEAVY INDUSTRIES & CONSTRUCTION CO., LTD. AND SUBSIDIARIES
CONSOLIDATED STATEMENTS OF CHANGES IN SHAREHOLDERS’ EQUITY
FOR THE YEARS ENDED DECEMBER 31, 2016 AND 2015
Capital stock Capital surplus
Other components of
equity
Accumulated
other comprehensive
income Retained earnings
Non-controlling
interests Total
(In Korean won)
Balance at January 1, 2016 ₩596,808,980,000 ₩1,563,917,672,526 ₩(105,157,160,978) ₩512,011,506,902 ₩1,013,088,220,397 ₩3,445,438,453,285 ₩7,026,107,672,132
Total comprehensive income:
Loss of the period - - - - (170,750,790,211) (44,773,995,736) (215,524,785,947)
Remeasurement of the net defined benefit liabilities - - - - (69,873,976,427) 1,605,321,746 (68,268,654,681)
Net change in unrealized fair value of AFS financial assets - - - 15,157,202,176 - 4,762,647,662 19,919,849,838
Effective portion of changes in fair value of cash flow hedges - - - 8,543,444,308 - 11,587,181,589 20,130,625,897
Equity adjustments in equity method (debit) - - - (52,099,346) - (56,737,992) (108,837,338)
Net profit(loss) on translation of foreign operations - - - 35,097,951,303 - (7,418,452,306) 27,679,498,997
Net gain(loss) on revaluation of land - - - (36,361,223,176) 26,527,942,918 (18,014,853,209) (27,848,133,467)
Subtotal - - - 22,385,275,265 (214,096,823,720) (52,308,888,246) (244,020,436,701)
Dividends - - - - (94,483,711,431) - (94,483,711,431)
Stock option - 2,015,482,504 (1,690,789,528) - - - 324,692,976
Disposal of treasury stock - 53,023,096,674 90,260,916,283 - - - 143,284,012,957
Acquisition of investments in subsidiaries - (9,541,315,814) (59,899,143) - - (448,432,336,102) (458,033,551,059)
Reduction of capital stock of subsidiaries without any refund - 860,011,026 - - - (862,871,474) (2,860,448)
Capital stock increase by issuing new shares of subsidiaries - 584,932,605 8,050,624,034 - - (7,961,277,354) 674,279,285
Dividends of the subsidiaries - - - - - (53,324,066,352) (53,324,066,352)
Stock option of the subsidiaries - 1,524,014,014 (1,912,830,727) - - (21,735,404) (410,552,117)
Transactions of treasury shares by subsidiaries - 6,256,086,126 (739,097) - - (18,581,712,073) (12,326,365,044)
Exercising of convertible bonds by subsidiaries - (4,791,047,084) - - - 7,112,878,144 2,321,831,060
Disposal of share of investments in subsidiaries - 35,715,299,969 (6,763,241,881) 4,385,426,625 - 468,281,455,861 501,618,940,574
Changes in consolidation scope - - - - - 12,906,000 12,906,000
Bond with warrant increase by issuing and exercising of
subsidiaries - 4,453,082,166 - - - 7,638,266,627 12,091,348,793
Others - (1,182,154,046) - - - 178,929,457 (1,003,224,589)
Balance at December 31, 2016 ₩596,808,980,000
₩1,652,835,160,666
₩(17,273,121,037)
₩538,782,208,792
₩704,507,685,246 ₩3,347,170,002,369
₩6,822,830,916,036
(Concluded)
See Notes
-8-

DOOSAN HEAVY INDUSTRIES & CONSTRUCTION CO., LTD. AND SUBSIDIARIES
CONSOLIDATED STATEMENTS OF CASH FLOWS
FOR THE YEARS ENDED DECEMBER 31, 2016 AND 2015
Notes 2016 2015
(In Korean won)
CASH FLOWS FROM OPERATING ACTIVITIES:
Cash generated from operations 36 ₩1,491,876,388,986 ₩565,940,588,916
Net income(loss) (215,524,785,947) (1,750,899,329,509)
Adjustments 1,667,514,803,768 2,796,807,824,518
Changes in operating assets and liabilities 39,886,371,165 (479,967,906,093)
Interest received 39,862,994,719 41,862,736,122
Interest paid (495,762,417,342) (576,553,756,935)
Dividends received 303,597,150 1,716,215,002
Income tax paid (68,713,777,552) (107,337,929,391)
Net cash flows provided by (used in) operating activities 967,566,785,961 (74,372,146,286)
CASH FLOWS FROM INVESTING ACTIVITIES:
Cash inflows from investing activities:
Decrease in short-term financial instruments 297,898,738,398 202,203,565,224
Disposal of short-term investment in securities - 80,499,361,714
Collection of short-term loans 65,275,787,851 103,894,172,141
Disposal of long-term financial instruments 63,611,006,170 11,158,450,670
Disposal of long-term investment in securities 2,435,824,713 15,745,912,830
Collection of long-term loans 229,701,707,401 132,493,369,838
Disposal of investment in subsidiaries - 5,999,506,443
Disposal of investments in associates - 126,667,468,493
Disposal of property, plant and equipment 69,257,010,540 30,891,342,577
Disposal of intangible assets 1,636,717,701 2,863,652,101
Disposal of investment property 1,173,000,000 1,577,382,829
Disposal of non-current assets classified as held-for-sale 84,419,819,225 -
The sales of business unit 1,154,821,544,576 128,317,226,465
Subtotal 1,970,231,156,575 842,311,411,325
Cash outflows for investing activities:
Increase in short-term financial instruments (95,091,693,985) (79,222,803,135)
Acquisition of short-term investments in securities (127,937,629,145) (3,955,604,933)
Increase in short-term loans (27,800,272,132) (155,702,429,216)
Acquisition of long-term financial instruments (16,895,446,044) (56,094,727,889)
Acquisition of long-term investments in securities (131,466,690,976) (12,416,609,062)
Increase in long-term loans (179,347,198,041) (212,259,140,998)
Acquisition of investments in associates and joint ventures (9,791,807,060) (1,108,000,000)
Acquisition of shares in subsidiaries (31,841,144,402) (54,940,467,860)
Acquisition of property, plant and equipment (290,902,622,062) (388,747,759,099)
Acquisition of intangible assets (248,694,126,605) (253,851,630,523)
Acquisition of investment property (1,122,000,000) (3,727,430,450)
The sales of business unit (4,573,742,849) -
Subtotal (1,165,464,373,301) (1,222,026,603,165)
Net cash provided by (used in) investing activities ₩804,766,783,274 ₩(379,715,191,840)
(Continued)
-9-

DOOSAN HEAVY INDUSTRIES & CONSTRUCTION CO., LTD. AND SUBSIDIARIES
CONSOLIDATED STATEMENTS OF CASH FLOWS
FOR THE YEARS ENDED DECEMBER 31, 2016 AND 2015
2016 2015
(In Korean won)
CASH FLOWS FROM FINANCING ACTIVITIES:
Cash inflows from financing activities:
Net increase in short-term borrowings ₩- ₩1,172,995,994,644
Increase in short-term bonds 180,000,000,000 -
Increase in asset-backed loans 714,113,619,260 1,294,518,541,269
Issuance of bonds 735,232,370,028 710,193,878,690
Increase in long-term borrowings 886,199,800,000 742,556,421,012
Disposals of treasury stock 160,218,812,676 -
Disposals of investment stock in subsidiaries 365,449,720,215 -
Capital increase by issuing new shares of subsidiaries 694,701,094 916,677,759,896
Changes in non-controlling interests - 1,080,996,843
Subtotal 3,041,909,023,273 4,838,023,592,354
Cash outflows for financing activities:
Net decrease in short-term borrowings (865,054,268,013) -
Repayment of current portion of long-term debt (2,189,786,666,558) (1,255,456,228,592)
Decrease in asset-backed loans (682,900,000,000) (1,203,450,000,000)
Repayment of bonds (300,602,677,526) (45,694,643,604)
Repayment of long-term borrowings (636,852,572,778) (1,094,394,528,323)
Repayment of financial lease liabilities (149,982,177) (660,278,141)
Acquisition of additional shares in subsidiaries (458,033,551,059) -
Dividend (94,483,711,431) (84,230,535,915)
Dividend of subsidiaries (53,324,066,352) (85,494,554,491)
Acquisition of treasury stock by subsidiaries (12,326,365,036) (9,997,743,330)
Capital increase with consideration in subsidiaries (11,253,730) -
Fees paid in capital stock reduction without consideration in subsidiaries (2,860,448) -
Subtotal (5,293,527,975,108) (3,779,378,512,396)
Net cash provided by (used in) financing activities (2,251,618,951,835) 1,058,645,079,958
EFFECT OF EXCHANGE RATE CHANGES IN CASH AND CASH EQUIVALENTS (41,177,184,921) (9,110,207,916)
CLASSIFICATION AS HELD FOR SALE ASSETS (3,044,188,427) -
NET INCREASE (DECREASE) IN CASH AND CASH EQUIVALENTS (523,506,755,948) 595,447,533,916
CASH AND CASH EQUIVALENTS AT THE BEGINNING OF THE YEAR 1,893,007,747,878 1,297,560,213,962
CASH AND CASH EQUIVALENTS AT THE END OF THE YEAR ₩1,369,500,991,930 ₩1,893,007,747,878
(Concluded)
See Notes
-10-

DOOSAN HEAVY INDUSTRIES & CONSTRUCTION CO., LTD. AND SUBSIDIARIES
NOTES TO CONSOLIDATED FINANCIAL STATEMENTS
FOR THE YEARS ENDED DECEMBER 31, 2016 AND 2015
1. ORGANIZATION AND DESCRIPTION OF THE BUSINESS:
(1) The Parent company
Doosan Heavy Industries & Construction Co., Ltd. (the “Company”) was incorporated
on September 20, 1962, with its headquarters in Changwon, Korea. Since its
incorporation, the Company has grown to become one of the leading global
manufacturers of advanced power generation equipment. The Company engages in
manufacturing a range of thermal and nuclear power generation equipment including
boilers, turbines and generators. It also engages in engineering, procurement and
construction of thermal power plants. The Company also supplies seawater desalination
and water treatment solutions to its clients.
(2) Consolidated subsidiaries
The details of consolidated subsidiaries as of December 31, 2016 and 2015 are as follows:
Ownership ratio of the
Group (%) (*1) Financial
closing
date(*2) Subsidiary Type of business
Location
December
31, 2016
December
31, 2015
Doosan Asset Management Company Co., Ltd. Property development Korea 100 100 December 31
Doosan Heavy Industries Vietnam Co., Ltd. Manufacturing of
machinery & equipment
Vietnam
100 100 December 31
HF Controls Corp. Manufacturing USA 100 100 December 31
Doosan HF Controls Asia Co.,Ltd. Manufacturing Korea 100 100 December 31
PT. Doosan Heavy Industries Indonesia Manufacturing Indonesia 55 55 December 31
Doosan Heavy Industries Japan Corp. Sales Japan 100 100 December 31
S.C Doosan IMGB S.A. Manufacturing Romania 99.86 99.85 December 31
Doosan Enpure Ltd. Engineering & Services UK 100 100 December 31
Doosan Construction Site Solutions Vietnam Co., Ltd. Equipment lease Vietnam 100 100 December 31
Doosan Power Systems India Private Ltd. Engineering & Services India 100 100 March 31
Doosan Heavy Industries Muscat LLC Manufacturing Oman 70 70 December 31
Doosan Power Systems Arabia Company Limited Manufacturing services Saudi Arabia 51 51 December 31
Azul Torre Construction Corporation (*3) Manufacturing Philippines 40 - December 31
Doosan Heavy Industries America Holdings LLC Holdings Company USA 100 100 December 31
Doosan Hydro Technology LLC Manufacturing USA 100 100 December 31
Doosan Engineering & Services LLC Engineering & Services USA 100 100 December 31
Doosan Heavy Industries America LLC Sales USA 100 100 December 31
Doosan ATS America, LLC Engineering & Services USA 100 100 December 31
Doosan Power Service America, LLC Engineering & Services USA 100 - December 31
Doosan GridTech Inc. Software & System
engineering
USA
100 - December 31
Doosan GridTech LLC Software & System
engineering
USA
100 - December 31
Doosan GridTech CA LLC Software & System
engineering
USA
100
- December 31
Doosan Skoda Power s.r.o Manufacturing Czech 100 100 December 31
Skoda Power Private Ltd. Engineering India 100 100 March 31
Doosan Power Systems Pension Trustee Company Ltd. Professional services UK 100 100 December 31
Doosan Power Systems Overseas Investments Ltd. Holdings Company UK 100 100 December 31
Doosan Babcock Ltd. Engineering & Services UK 100 100 December 31
-11-

Ownership ratio of the
Group (%) (*1) Financial
closing
date(*2) Subsidiary Type of business
Location
December
31, 2016
December
31, 2015
Doosan Power Systems Holdings Ltd. Holdings Company UK 100 100 December 31
Doosan Power Systems Europe Limited GmbH Engineering & Services Germany 100 100 December 31
Doosan Power Systems Americas LLC Engineering & Services,
Sales
USA
100 100 December 31
Doosan Lentjes UK Limited Professional services UK 100 100 December 31
Doosan Lentjes GmbH Engineering & Services Germany 99.04 99.04 December 31
Doosan Power Systems S.A. (“DPS S.A.”) Holdings Company Luxembourg 100 100 December 31
Doosan Babcock Energy Technologies (Shanghai) Ltd. Engineering & Services China 100 100 December 31
Doosan Babcock Energy Services (Overseas) Ltd. Engineering & Services UK 100 100 December 31
Doosan Babcock Energy Polska Sp z.o.o Engineering & Services Poland 98.91 98.91 December 31
Doosan Babcock Energy Germany GmbH Engineering & Services Germany 100 100 December 31
Doosan Lentjes Czech s.r.o Professional services Czech 100 100 December 31
AE & E Lentjes Belgie N.V. Dormant Belgium 100 100 December 31
Doosan Power Systems (Scotland) Ltd. Partnership Real estate UK 100 100 December 31
Doosan Babcock General Maintenance Services LLC (*3) Professional services UAE 49 49 December 31
Doosan Babcock WLL(*3) Professional services Qatar 49 49 December 31
KDPP 1st Co.,Ltd. (*4) Asset Securitization Korea - - December 31
KDPP 2nd Co.,Ltd. (*4) Asset Securitization Korea - - December 31
KDPP 3rd Co.,Ltd. (*4) Asset Securitization Korea - - December 31
Happy Tomorrow 20th Co., Ltd.(*4) Asset Securitization Korea - - December 31
Happy Tomorrow 25th Co., Ltd.(*4) Asset Securitization Korea - - December 31
Happy Tomorrow 27th Co., Ltd.(*4) Asset Securitization Korea - - December 31
Doosan Cuvex Co., Ltd.(*5)
Operation of resort and
golf club
Korea
71.37 100 December 31
Doosan Infracore Co., Ltd. (“DI”) and subsidiaries (*6)
Manufacturing of
machinery & equipment
Korea, etc.
36.40 36.40 December 31
Doosan Engineering & Construction Co., Ltd.
(“DEC”) and subsidiaries
Construction
and manufacturing
Korea, etc.
80.41 80.01 December 31
Doosan Engine Co., Ltd. (“DE”) and subsidiaries (*6)
Manufacturing of
machinery & equipment
Korea, etc.
42.66 42.66 December 31
(*1) The ownership percentage represents the equity interest held by the Company
(theparent) in each respective subsidiary, except Doosan Heavy Industries Vietnam
Co., Ltd. of which 24.76% of equity interest are owned by Doosan Engineering &
Construction Co., Ltd. (DEC) and Doosan Cuvex Co., Ltd. of which 19.87%,
22.22%, 2.99% of equity interest are owned by Doosan Infracore Co., Ltd. (“DI”),
Doosan Engineering & Construction Co., Ltd. (DEC), Doosan Engine Co., Ltd.
(“DE”), respectively. Overall, the Group has an effective ownership interest of 95.15%
of the Doosan Heavy Industries Vietnam Co., Ltd. and 52.66% of Doosan Cuvex.,
Ltd.
(*2) Where the reporting date of subsidiaries is not consistent with that of the Company
based on local laws, adjustments have been made to conform to the Company’s
reporting date for preparation of consolidated financial statements.
(*3) Although the Company’s ownership does not exceed 50%, it is classified as a
consolidated subsidiary since the Group is considered to have the voting rights in
the equity’s board of directors, and others.
(*4) The Company assessed that it exercises control over the special purpose entity as
the entity’s activities are substantively governed by the Company.
(*5) Doosan Cuvex Co., Ltd., subsidiary of DEC, is reclassified as the Company’s direct
subsidiaries by stock trading within the Group for the year ended December 31, 2016.
(*6) Although the Company’s ownership interest in the investee is less than a majority,
the Company assessed that it exercises control over the investee based on its
holdings relative to the size and dispersion of ownership interests held by other
equity holders and the voting patterns in previous shareholders’ meetings.
-12-

(3) Main subsidiary’s financial information
Condensed financial information of the Group’s significant consolidated subsidiaries (or
intermediate parent) as of and for the year ended December 31, 2016, is as follows (in
millions of Korean won):
Subsidiary Assets Liabilities Sales
Net
income(loss)
Total
comprehensive
income(loss)
Doosan Heavy Industries Vietnam Co., Ltd. ₩516,090 ₩455,022 ₩263,323 ₩(8,553) ₩(8,553)
HF Controls Corp. 24,296 9,347 14,167 334 334
Doosan Heavy Industries Japan Corp. 26,496 23,458 2,497 150 150
S.C. Doosan IMGB S.A. 141,736 101,666 86,136 (2,335) (2,335) Doosan Construction Site Solutions Vietnam Co., Ltd. 10,564 110 709 (1,833) (1,833)
Doosan Power Systems India Private Ltd. 467,389 365,088 249,454 1,223 1,508
Doosan Heavy Industries Muscat LLC 22,090 22,136 31,552 (409) (409) Doosan Heavy Industries America Holdings LLC 207,432 38,770 2,060 6,529 6,529
Doosan Hydro Technology LLC 34,704 63,572 28,517 (4,595) (4,595)
Doosan Heavy Industries America Corp. 16,248 10,242 3,464 403 403 Doosan Skoda Power s.r.o 611,326 150,003 376,168 66,719 64,873
Doosan Power Systems Overseas Investments Ltd. 75,586 88,747 - (2,865) (2,865)
Doosan Babcock Ltd. 1,044,213 410,554 611,507 (24,578) (86,361) Doosan Power Systems Europe Limited GmbH 185,553 130,467 - (2,042) (2,042)
Doosan Lentjes GmbH 71,833 58,151 32,988 (26,810) (29,488)
DPS S.A. 1,319,255 791,265 - 22,786 22,786 Doosan Babcock Energy Polska Sp z.o.o. 17,959 9,312 29,159 (2,419) (2,540)
Doosan Power Systems (Scotland) Ltd. Partnership 32,174 1,735 - 1,878 1,878
Doosan Cuvex Co., Ltd. 219,043 79,613 27,242 173 (100) Doosan Infracore Co., Ltd. (“DI”) and subsidiaries 10,026,809 6,578,432 5,729,550 115,985 140,897
Doosan Engineering & Construction Co., Ltd. (“DEC”)
and subsidiaries
3,030,035 1,965,359 1,274,566 (357,034) (347,450)
Doosan Engine Co., Ltd. (“DE”) and subsidiaries 1,356,450 822,185 802,917 (181,226) (40,406)
(4) Changes in the scope of consolidation
Changes in the scope of consolidation for the year ended December 31, 2016, are as
follows:
Description Reason
Doosan Power Service America, LLC
Incorporation of new
connections
Establishment of new
corporation
Azul Torre Construction Corporation
Incorporation of new
connections
Establishment of new
corporation
KDPP 2nd Co., Ltd.
Incorporation of new
connections
Establishment of new
corporation
KDPP 3rd Co., Ltd.
Incorporation of new
connections
Establishment of new
corporation
Happy Tomorrow 25th Co., Ltd.
Incorporation of new
connections
Establishment of new
corporation
Happy Tomorrow 27th Co., Ltd.
Incorporation of new
connections
Establishment of new
corporation
Yongin Samga Project 1st LLC Incorporation of new
connections
Establishment of new
corporation
DM BEST 2nd Co., Ltd.
Incorporation of new
connections
Establishment of new
corporation
DM BEST 3rd Co., Ltd.
Incorporation of new
connections
Establishment of new
corporation
DM BEST 4th Co., Ltd.
Incorporation of new
connections
Establishment of new
corporation
-13-
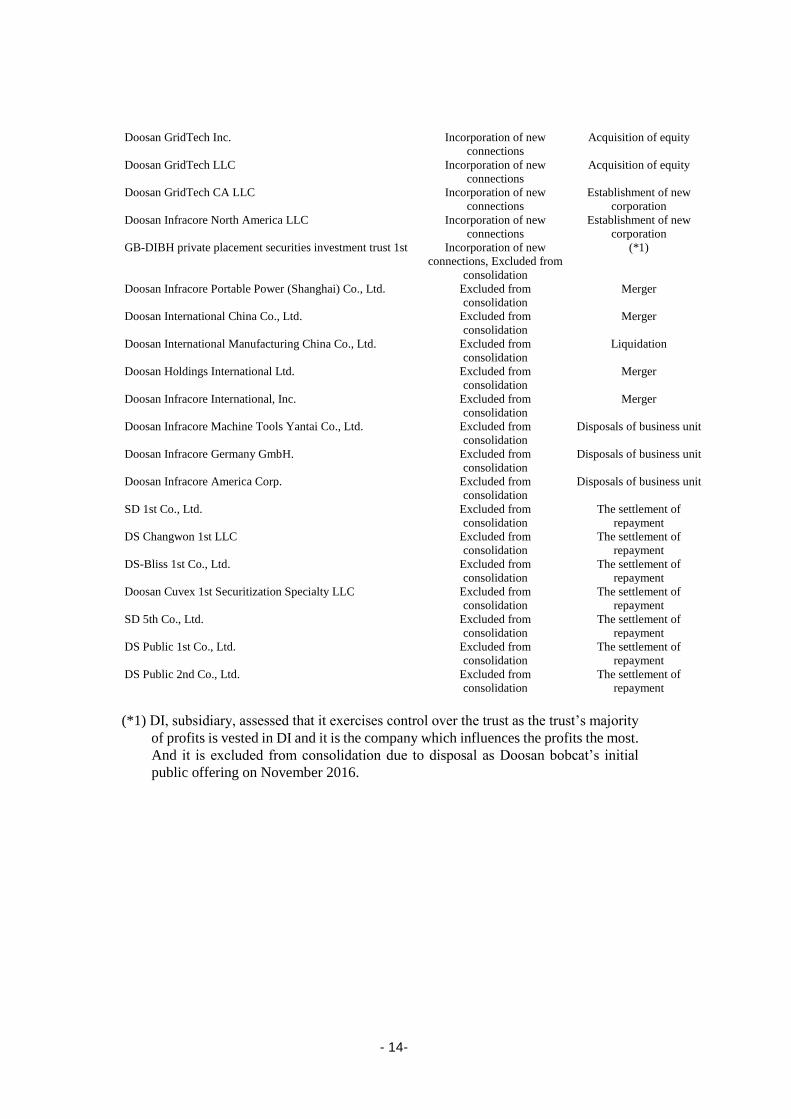
Doosan GridTech Inc.
Incorporation of new
connections
Acquisition of equity
Doosan GridTech LLC
Incorporation of new
connections
Acquisition of equity
Doosan GridTech CA LLC
Incorporation of new
connections
Establishment of new
corporation
Doosan Infracore North America LLC
Incorporation of new
connections
Establishment of new
corporation
GB-DIBH private placement securities investment trust 1st
Incorporation of new
connections, Excluded from
consolidation
(*1)
Doosan Infracore Portable Power (Shanghai) Co., Ltd.
Excluded from
consolidation
Merger
Doosan International China Co., Ltd.
Excluded from
consolidation
Merger
Doosan International Manufacturing China Co., Ltd.
Excluded from
consolidation
Liquidation
Doosan Holdings International Ltd.
Excluded from
consolidation
Merger
Doosan Infracore International, Inc.
Excluded from
consolidation
Merger
Doosan Infracore Machine Tools Yantai Co., Ltd.
Excluded from
consolidation
Disposals of business unit
Doosan Infracore Germany GmbH.
Excluded from
consolidation
Disposals of business unit
Doosan Infracore America Corp.
Excluded from
consolidation
Disposals of business unit
SD 1st Co., Ltd.
Excluded from
consolidation
The settlement of
repayment
DS Changwon 1st LLC
Excluded from
consolidation
The settlement of
repayment
DS-Bliss 1st Co., Ltd.
Excluded from
consolidation
The settlement of
repayment
Doosan Cuvex 1st Securitization Specialty LLC
Excluded from
consolidation
The settlement of
repayment
SD 5th Co., Ltd.
Excluded from
consolidation
The settlement of
repayment
DS Public 1st Co., Ltd.
Excluded from
consolidation
The settlement of
repayment
DS Public 2nd Co., Ltd.
Excluded from
consolidation
The settlement of
repayment
(*1) DI, subsidiary, assessed that it exercises control over the trust as the trust’s majority
of profits is vested in DI and it is the company which influences the profits the most.
And it is excluded from consolidation due to disposal as Doosan bobcat’s initial
public offering on November 2016.
-14-

(5) Significant non-controlling interests
Financial information of subsidiaries attributable to significant non-controlling interests
is as follows (in millions of Korean won):
Subsidiary
Net loss attributable
to non-controlling
interests
Cumulative non-
controlling interests
Dividends allocated to
non-controlling
interests Doosan Infracore Co., Ltd.
and subsidiaries
₩67,511
₩2,749,591
₩(18,289)
Doosan Engineering &Construction Co., Ltd.
and subsidiaries
(71,266)
108,064
(26,000)
Doosan Engine Co., Ltd. and subsidiaries.
(49,562)
119,127
-
Doosan Cuvex Co., Ltd. 254 66,091 -
(6) Cash flow information for subsidiaries with significant non-controlling interests
Cash flow information for subsidiaries with significant non-controlling interests is as
follows (in millions of Korean won):
2016
DI and
subsidiaries
DEC and subsidiaries
DE and
subsidiaries Doosan Cuvex
Ⅰ. Net cash flows provided by (used in)
operating activities
₩512,993
₩(100,498)
₩4,542
₩963
Ⅱ. Net cash flow provided by (used in)
investing activities
909,634
537,365
41,426
496
Ⅲ. Net cash flows provided (used in) by
financing activities
(1,454,380)
(465,268)
(18,651)
(11,997)
Ⅳ. Net foreign exchange difference 10,328 86 22 -
Ⅴ. Net increase (decrease) in cash and cash
equivalents (Ⅰ+Ⅱ+Ⅲ+Ⅳ)
(21,425)
(28,315)
27,339
(10,538)
Ⅵ. Cash and cash equivalents as at January 1 560,003 108,204 45,482 19,077
Ⅶ. Cash and cash equivalents as at December 31 ₩538,578 ₩79,889 ₩72,821 ₩8,539
-15-

2. SUMMARY OF SIGNIFICANT ACCOUNTING POLICIES:
The Group maintains its official accounting records in Korean won and prepares consolidated
financial statements in conformity with Korean International Financial Reporting Standards
(“K-IFRS”), in the Korean language (Hangul).
(1) Basis of consolidated financial statements
The Company and its subsidiaries (the “Group”) has prepared the consolidated financial
statements in accordance with the Korean International Financial Reporting Standards
(“K-IFRS”).
The principal accounting policies are set out below. Except for the effect of the
Amendments to K-IFRS and new interpretations set out below, the principal accounting
policies used to prepare the consolidated financial statements as of and for the year ended
December 31, 2016 are consistent with the accounting policies used to prepare the
consolidated financial statements as of and for the year ended December 31, 2015.
The accompanying consolidated financial statements have been prepared on the historical
cost basis except for certain non-current assets and financial instruments that are measured
at fair values, as explained in the accounting policies below. Historical cost is based on
the fair values of the consideration given.
1) Accounting standards and interpretations that were newly applied for the year ended
December 31, 2016, and changes in the Group’s accounting policies are as follows:
Amendments to K-IFRS 1110 – Consolidated Financial Statements & K-IFRS 1112
Disclosure of interests in other entities & K-IFRS 1028 Investment in associates
The amendments clarify that in applying the equity method of accounting to an
associate or a joint venture that is an investment entity, an investor may retain the fair
value measurements that the associate or joint venture used for its subsidiaries. The
application of these amendments has no material impact on the disclosures or the
amounts recognized in the Group’s consolidated financial statements.
Amendments to K-IFRS 1111 – Accounting for Acquisitions of Interests in Joint
Operations
The amendments to K-IFRS 1111 provide guidance on how to account for the
acquisition of a joint operation that constitutes a business as defined in K-IFRS 1103
Business Combinations. A joint operator is also required to disclose the relevant
information required by K-IFRS 1103 and other standards for business combinations.
The application of these amendments has no material impact on the disclosures or the
amounts recognized in the Group’s consolidated financial statements.
-16-

Amendments to K-IFRS 1001—Presentation of Financial Statements
The amendments to K-IFRS 1001 clarify the concept of applying materiality in
practice and restrict an entity reducing the understandability of its financial statements
by obscuring material information with immaterial information or by aggregating
material items that have different natures or functions. The application of these
amendments has no material impact on the disclosures or the amounts recognized in
the Group’s consolidated financial statements.
Amendments to K-IFRS 1016 – Property, Plant and Equipment
The amendments to K-IFRS 1016 prohibit the Group from using a revenue-based
depreciation method for items of property, plant and equipment. The application of
these amendments has no material impact on the disclosures or the amounts
recognized in the Group’s consolidated financial statements.
Amendments to K-IFRS 1038 – Intangible Assets
The amendments to K-IFRS 1038 do not allow presumption that revenue is an
appropriate basis for the amortization of intangible assets, which the presumption can
only be limited when the intangible asset is expressed as a measure of revenue or when
it can be demonstrated that revenue and consumption of the economic benefits of the
intangible asset are highly correlated. The application of these amendments has no
material impact on the disclosures or the amounts recognized in the Group’s
consolidated financial statements.
Amendments to K-IFRS 1016 – Property, Plant and Equipment
The amendments to K-IFRS 1016 prohibit the Group from using a revenue-based
depreciation method for items of property, plant and equipment. The application of
these amendments has no material impact on the disclosures or the amounts
recognized in the Group’s consolidated financial statements.
Annual Improvements to K-IFRS 2012-2014 Cycle
The annual improvements include amendments to a number of K-IFRS. The
amendments introduce specific guidance in K-IFRS 1105 Non-current Assets Held for
Sale and Discontinued Operations when an entity reclassifies an asset (or disposal
group) from held for sale to held for distribution to owners (or vice versa); such a
change is considered as a continuation of the original plan of disposal, and not as a
change to a plan of sale. Other amendments in the annual improvements include K-
IFRS 1107 Financial Instruments: Disclosures, K-IFRS 1019 Employee Benefits, and
K-IFRS 1034 Interim Financial Reporting. The application of these amendments has
no material impact on the disclosures or the amounts recognized in the Group’s
consolidated financial statements.
-17-

2) New and revised K-IFRS in issue but not yet effective as of December 31, 2016 are
as follows:
The Group has not applied the following new and revised standards and
interpretations that have been issued, but are not yet effective:
Amendments to K-IFRS 1109 – Financial Instruments
The amendments to K-IFRS 1109 contain the requirements for the classification and
measurement of financial assets and financial liabilities based on a business model
whose objective is achieved both by collecting contractual cash flows and selling
financial assets and based on the contractual terms that give rise on specified dates to
cash flows, impairment methodology based on the expected credit losses, broadened
types of instruments that qualify as hedging instruments, the types of risk components
of non-financial items that are eligible for hedge accounting and change in the hedge
effectiveness test. The amendments are effective for annual periods beginning on or
after January 1, 2018
With respect to the forthcoming implementation of K-IFRS 1109, in the first half year
the Group’s accounting team, through joint efforts with external accounting
specialists, will likely perform a preliminary assessment of the impact of the K-IFRS
1109 on the Group’s consolidated financial statements. In the second half year, the
Group also plans to perform a detailed analysis to test the implementation of K-IFRS
1109 and, if necessary, modifies the existing internal control processes and
accounting systems to fit for the purpose of K-IFRS 1109.
As part of the above process, the Group is in preliminarily assessing the potential
impacts at the date of initial application of K-IFRS 1109 based on the Group’s
financial statements as at December 31, 2016 and the basis of the facts and
circumstances that exist at that date. The Group, therefore, will provide disclosures
in the financial statements as of and for the year ending December 31, 2017 for the
estimated impacts in details.
General impacts per each major category under K-IFRS 1109on the Group’s
consolidated financial statements are as follows:
- The classification of financial instruments by category and expected volatility in
the carrying value of financial instruments (Note 10)
- Expected volatility in loss allowance for account receivables and other
receivables (Note 7)
-18-

Amendments to K-IFRS 1115 – Revenue from Contracts with Customers
The core principle under K-IFRS 1115 is that an entity should recognize revenue to
depict the transfer of promised goods or services to customers in an amount that
reflects the consideration to which the entity expects to be entitled in exchange for
those goods or services. The amendments introduce a five-step approach to revenue
recognition and measurement: 1) Identify the contract with a customer, 2) Identify
the performance obligations in the contract, 3) Determine the transaction price, 4)
Allocate the transaction price to the performance obligations in the contract and 5)
Recognize revenue when (or as) the entity satisfies a performance obligation. This
standard will supersede K-IFRS 1011 - Construction Contracts, K-IFRS 1018 -
Revenue, K-IFRS 2113 - Customer Loyalty Programmes, K-IFRS 2115 - Agreements
for the Construction of Real Estate, K-IFRS 2118 - Transfers of Assets from
Customers and K-IFRS 2031 - Revenue-Barter Transactions Involving Advertising
Services. The amendments are effective for annual periods beginning on or after
January 1, 2018.
As part of the above process, the Group is in preliminarily assessing the potential
impacts at the date of initial application of K-IFRS 1115 based on the Group’s
financial statements as at December 31, 2016 and the basis of the facts and
circumstances that exist at that date. The Group, therefore, will provide disclosures
in the financial statements as of and for the year ending December 31, 2017 for the
estimated impacts in details.
General impact per each major category under K-IFRS 1115 on the Group’s
consolidated financial statements is as follows:
- The timing of revenue to be recognized and expected volatility in amount of
revenue
As at December 31, 2016, meanwhile, sales revenue amounting KRW 4,705,321
million, due from customers for construction work amounting KRW 1,503,395
million, and due to customers for construction work amounting to KRW 667,763
million, respectively, would be affected by the implementation of K-IFRS 1115.
-19-

Amendments to K-IFRS 1102—Share-based Payment
The amendments include: 1) when measuring the fair value of share-based payment,
the effects of vesting and non-vesting conditions on the measurement of cash-settled
share-based payment should be consistent with the measurement of equity-settled
share-based payment, 2) Share-based payment transaction in which the Group settles
the share-based payment arrangement net by withholding a specified portion of the
equity instruments per statutory tax withholding requirements would be classified as
equity-settled in its entirety, if otherwise would be classified as equity-settled without
the net settlement feature, and 3) when a cash-settled share-based payment changes
to an equity-settled share-based payment because of modifications of the terms and
conditions, the original liability recognized is derecognized and the equity-settled
share-based payment is recognized at the modification date fair value. Any difference
between the carrying amount of the liability at the modification date and the amount
recognized in equity at the same date would be recognized in profit and loss
immediately. The amendments are effective for annual periods beginning on or after
January 1, 2018.
Amendments to K-IFRS 1007 – Statement of Cash Flows
The amendments require that changes in liabilities arising from financial activities
are disclosed. The amendments are effective for annual periods beginning on or after
January 1, 2017
Amendments to K-IFRS 1012 – Income Taxes
The amendments clarify that unrealized losses on fixed-rate debt instruments
measured at fair value and measured at cost for tax purposes give rise to a deductible
temporary difference regardless of whether the holder expects to recover the carrying
amount of the debt instrument by sale or by use and that the estimate of probable
future taxable profit may include the recovery of some of assets for more than their
carrying amount. When the Group assesses whether there will be sufficient taxable
profit, the Group should compare the deductible temporary differences with future
taxable profit that excludes tax deductions resulting from the reversal of those
deductible temporary differences. The amendments are effective for annual periods
beginning on or after January 1, 2017.
The group is reviewing the impact on the financial statement from above amendments.
-20-

(2) Basis of Consolidation
The consolidated financial statements comprise the financial statements of the Company
and its subsidiaries as at December 31, 2016. Control is achieved when the Group is
exposed, or has rights, to variable returns from its involvement with the investee and has
the ability to affect those returns through its power over the investee. Specifically, the
Group controls an investee if and only if the Group has:
- Power over the investee (i.e. existing rights that give it the current ability to direct the
relevant activities of the investee)
- Exposure, or rights, to variable returns from its involvement with the investee, and
- The ability to use its power over the investee to affect its returns
When the Group has less than a majority of the voting or similar rights of an investee, the
Group considers all relevant facts and circumstances in assessing whether it has power
over an investee, including:
- The contractual arrangement with the other vote holders of the investee
- Rights arising from other contractual arrangements
- The Group’s voting rights and potential voting rights
The Group re-assesses whether or not it controls an investee if facts and circumstances
indicate that there are changes to one or more of the three elements of control.
Consolidation of a subsidiary begins when the Group obtains control over the subsidiary
and ceases when the Group loses control of the subsidiary. Assets, liabilities, income and
expenses of a subsidiary acquired or disposed of during the year are included in the
statement of profit or loss and the statement of comprehensive income from the date the
Group gains control until the date the Group ceases to control the subsidiary.
Profit or loss and each component of other comprehensive income (OCI) or loss are
attributed to the equity holders of the parent of the Group and to the non-controlling
interests, even if this results in the non-controlling interests having a deficit balance. When
necessary, adjustments are made to the financial statements of subsidiaries to bring their
accounting policies into line with the Group’s accounting policies. All intra-group assets
and liabilities, equity, income, expenses and cash flows relating to transactions between
members of the Group are eliminated in full on consolidation.
-21-
A change in the ownership interest of a subsidiary, without a loss of control, is accounted
for as an equity transaction. If the Group loses control over a subsidiary, the Group:
- Derecognizes the assets (including goodwill) and liabilities of the subsidiary
- Derecognizes the carrying amount of any non-controlling interests
- Derecognizes the cumulative translation differences recorded in equity
- Recognizes the fair value of the consideration received
- Recognizes the fair value of any investment retained
- Recognizes any surplus or deficit in profit or loss
- Reclassifies the parent’s share of components previously recognized in OCI to profit
or loss or retained earnings, as appropriate, as would be required if the Group had
directly disposed of the related assets or liabilities
(3) Investments in associates and joint ventures
An associate is an entity over which the Group has significant influence, and is neither a
subsidiary nor an investment in a joint venture. The Group generally holds, directly or
indirectly through subsidiaries, between 20% and 50% of the voting power of the entity.
A joint venture is a type of joint arrangement whereby the parties that have joint control
of the arrangement have rights to the net assets of the joint venture. Joint control is the
contractually agreed sharing of control of an arrangement, which exists only when
decisions about the relevant activities require unanimous consent of the parties sharing
control.
The Group’s investments in its associate and joint venture accounted for using the equity
method. Under the equity method, the investment in an associate or a joint venture is
initially recognized at cost. Goodwill relating to the associate or joint venture is included
in the carrying amount of the investment and is neither amortized nor individually tested
for impairment.
After acquisition, the Group's share of the profit or loss and other comprehensive income
or loss of the associates and jointly controlled entities are recognized as profit or loss and
other comprehensive income or loss and the Group's share of the changes in retained
earnings of the associates and joint ventures are recognized as retained earnings. When
the Group's share of losses of an associates and joint ventures exceeds the Group's interest
in those entities (which includes any long-term interests that, in substance, form part of
the Group's net investment in the associate), the Group discontinues recognizing its share
of further losses. Additional losses are recognized only to the extent that the Group has
incurred legal or constructive obligations or made payments on behalf of the associates
and joint ventures.
Unrealized gains from transactions between the Group and its associates and joint
ventures are eliminated up to the interests in those entities. Unrealized losses are also
eliminated unless evidence of impairment in assets transferred is provided.
When necessary, the Group may revise associates’ and joint ventures’ financial statements,
to apply consistent accounting policies as the Group, prior to applying the equity method
of accounting for its investments in the associates and joint ventures.
-22-

For overseas investees whose financial statements are prepared in foreign currencies, the
equity method of accounting is applied after assets and liabilities are translated in
accordance with the accounting treatments for the translation of the financial statements
of overseas’ subsidiaries for consolidated financial statements. The Group’s proportionate
share of the difference between assets net of liabilities and equity after translating into
Korean Won is accounted for as “increase (decrease) in equity adjustments in equity
method investments” included in accumulated other comprehensive income (loss).
(4) Foreign currency translation
1) Functional currency and presentation currency
The Group’s financial statements are presented in the currency of the primary
economic environment in which it operates (its functional currency). The functional
currency and the presentation currency for the consolidated financial statements of the
Group are Korean won.
2) Transactions and balances
Transactions in currencies other than the entity’s functional currency are recognized
at the rates of exchange prevailing at the dates of the transactions. Foreign currency
gain (loss) from settlements of foreign currency transactions or translation of
monetary items denominated in foreign currencies are recognized in profit or loss
whereas the gain (loss) from qualified cash flow hedge and net investment hedge for
foreign operations is deferred as an equity item.
3) Group companies For the purpose of presenting consolidated financial statements, the assets and
liabilities of the Group’s foreign operations with different functional currencies are
translated into presentation currency of the Group using exchange rates prevailing at
the end of the reporting period. Income and expense items are translated using the
average exchange rates for the period, unless exchange rates fluctuated significantly
during that period, in which case the exchange rates at the dates of the transactions are
used. Exchange differences, if any, are recognized in other comprehensive income or
loss and accumulated in equity (attributed to non-controlling interests as appropriate).
Exchange differences from the net investment in the foreign operation, and
borrowings and other foreign currency instruments designated as hedging instrument
for the net investment in the foreign operation are recognized in other comprehensive
income or loss. On the disposal of a foreign operation resulting in loss of control, all
of the accumulated exchange differences in respect of that operation are reclassified
to profit or loss. Goodwill and fair value adjustments arising from the acquisition of a
foreign operation are treated as assets and liabilities of the foreign operation and
translated at the closing rate.
(5) Cash and cash equivalents
Cash and cash equivalents include cash on hand, demand deposits, short-term, highly
liquid investments with maturities (or date of redemption) of three months or less upon
acquisition. Bank overdraft is classified as short-term borrowings on the consolidated
statements of financial position.
-23-

(6) Financial assets
1) Initial recognition and measurement
Financial assets are classified into the following specified categories: ‘financial assets
at fair value through profit or loss’, ‘loans and receivables’, ‘available-for-sale (“AFS”)
financial assets’, ‘held-to-maturity financial assets’. The classification depends on the
nature and purpose of the financial assets and is determined at the time of initial
recognition.
a) Financial assets at fair value through profit or loss
Financial assets at fair value through profit or loss include financial assets classified
as held for trading and financial assets designated at financial assets at fair value
through profit or loss upon initial recognition. A financial asset is classified as held
for trading financial assets, if it has been acquired principally for the purpose of
selling or repurchasing in near term. All derivative assets including an embedded
derivative separated from the host contract and accounted for as derivative are
classified as held for trading financial assets unless they are designated as effective
hedging instruments. These categories of assets are classified as current assets or
non-current assets depending on the timing of settlement.
b) Loans and receivables
Loans and receivables are non-derivative financial assets with fixed or
determinable payments that are not quoted in an active market. Loans and
receivables, with maturities of more than 12 months from the end of the reporting
period, are classified as non-current assets. Otherwise they are classified as current
assets.
c) Available-for-sale financial investments
AFS financial investments are non-derivative financial assets that are designated as
available for sale or are not classified as loans and receivables, held-to-maturity
financial assets or financial assets at fair value through profit or loss. AFS financial
investments are classified as non-current assets unless management has intention
to sell them within 12 months from the end of the reporting period.
d) Held-to-maturity financial assets
Held-to-maturity financial assets are non-derivative financial instruments with
fixed or determinable payments and fixed maturity for which the Group has the
positive intention and ability to hold to maturity. Held-to-maturity financial assets,
with maturities of more than 12 months from the end of the reporting period, are
classified as non-current assets. Otherwise they are classified as current assets.
2) Subsequent measurement
Financial assets are generally recognized on the trade date, which is the date the Group
becomes a party to a contract to purchase or sale of a financial asset. Except for
financial assets at fair value through profit or loss, all financial assets are initially
measured at fair value, plus transaction costs. In the case of financial assets at fair
value through profit or loss, they are initially measured at fair value and related
transaction costs are recognized as expense in the consolidated statement of profit or
loss.
-24-

Financial assets at fair value through profit or loss and AFS financial investments are
subsequently measured at fair value. Loans and receivables and held-to-maturity
investments are measured at amortized cost using the effective interest method
(“EIR”).
Gains or losses arising from changes in fair value of financial assets at fair value
through profit or loss are recognized in the other non-operating income and expense
line item in the consolidated statement of profit or loss. Dividends on financial assets
at fair value through profit or loss are recognized in the finance income when the
Group’s right to receive the dividends is established.
Changes in fair value of monetary and non-monetary financial assets which are
classified as AFS financial investments are recognized in other comprehensive
income or loss. When the investment is disposed of or is determined to be impaired,
the cumulative gain or loss previously accumulated in the equity in reclassified into
other non-operating income and expense in the statement of profit or loss.
Interest from AFS financial investments calculated using the EIR is recognized in
finance income in the consolidated statement of profit or loss. Dividends on AFS
equity instruments are recognized in the finance income when the Group’s right to
receive the dividends is established.
3) Impairment of financial assets
a) Financial assets carried at amortized cost
The Group assesses, at the end of each reporting period, whether there is any
objective evidence that a financial asset is impaired. Financial assets are considered
to be impaired when there is objective evidence that, as a result of one or more
events that occurred after the initial recognition of the financial asset, the estimated
future cash flows of the investment have been affected.
Impairment loss is the difference between the asset’s carrying amount and the
present value of estimated future cash flows, discounted at the financial asset’s
original effective interest rate (EIR) at initial recognition. The carrying amount of
the financial asset is reduced by the impairment loss and the amount of the loss is
recognized in profit or loss. The Group measures impairment loss based on fair
value of financial assets from observable market data.
If, in a subsequent period, the amount of the impairment loss decreases and the
decrease can be related objectively to an event occurring after the impairment was
recognized, the previously recognized impairment loss is reversed and recognized
in profit or loss.
-25-

b) Available-for-sale financial investments
The Group assesses, at the end of each reporting period, whether there is any
objective evidence that a financial asset or group of financial assets is impaired.
For equity investments classified as AFS, a significant or prolonged decline in the
fair value of the security below its cost is considered to be objective evidence of
impairment. If there is objective evidence of impairment on AFS financial
investments, the cumulative loss that has been recognized in other comprehensive
income or loss less any impairment loss previously recognized in profit or loss is
reclassified from equity to profit or loss. Impairment losses recognized in profit or
loss for an investment in an equity instrument classified as AFS are not reversed
through profit or loss. Meanwhile, if, in a subsequent period, the fair value of a debt
instrument classified as AFS increases and the increase can be objectively related
to an event occurring after the impairment loss was recognized in profit or loss, the
impairment loss is reversed through profit or loss.
4) Derecognition
The Group derecognizes a financial asset only when the contractual rights to the cash
flows from the financial asset expire, or when it transfers the rights to receive the
contractual cash flows in a transaction in which all the risks and rewards of ownership
of the financial asset are transferred.
5) Offsetting of financial instruments
Financial assets and financial liabilities are offset as a net amount in the consolidated
statement of financial position when the Group has a legally enforceable right to set
off the recognized amounts of the assets and liabilities and intends to settle on a net
basis, or to realize the assets and the liabilities simultaneously.
(7) Trade receivables
Trade receivables are amounts owed by customer for products and services provided in
the ordinary course of business. Receivables expected to be collected within one year are
classified as current assets. Otherwise they are classified as non-current assets. Trade
receivables are initially measured at fair value and are presented as net of allowance for
doubtful accounts, estimated on an individual basis based on past bad debt experience.
(8) Inventories
Inventories are stated at the lower of cost and net realizable value. Cost of inventories
includes fixed and variable manufacturing overhead costs which are systematically
allocated to inventories by appropriate methods based on each category of inventory. The
cost of inventories is determined by the specific identification method for finished goods,
work-in-process, and materials in transit, and gross average method for all other
inventories.
-26-

The Group periodically reviews changes in net realizable value of inventories (current
replacement cost for raw materials) due to damage, obsolescence, decline in selling prices
and others and recognizes loss on inventory valuation. Loss on inventory valuation is
charged to cost of sales when it is ordinary and to other non-operating expense when it is
extraordinary. When the circumstances that previously caused inventories to be written
down below cost no longer exist and the new market value of inventories subsequently
recovers, the valuation loss is reversed to the extent of the original valuation loss and the
reversal is deducted from cost of sales.
(9) Property, plant and equipment
Property, plant and equipment is stated at cost less subsequent accumulated depreciation
and accumulated impairment losses. When parts of an item of property, plant and
equipment have different useful lives, they are accounted for as separate items (major
components) of property, plant and equipment. The cost of an item of property, plant and
equipment includes expenditure that is directly attributable to the acquisition of the asset
including the initial estimate of the costs of dismantling and removing the item and
restoring the site on which it is located.
Subsequent costs incurred to replace part of previously recognized item of property, plant
and equipment are added to the carrying amount of an asset, or recognized as a separate
asset, if it is probable that future economic benefits associated with the assets will flow
into the Group and the cost of an asset can be measured reliably. The carrying amount of
what was replaced is derecognized. Routine maintenance and repairs are expensed as
incurred.
Depreciation of property, plant and equipment is calculated to the cost of each asset less
residual value using the straight-line method over the estimated useful lives of the assets
as follows:
Useful lives
Buildings 10~48 years Structures 5~40 years
Machinery 2~20 years
Others 2~15 years
If a part of a property, plant and equipment has significant cost in relation to the total cost
property, plant and equipment, it is depreciated separately.
The Group reviews the depreciation method, the estimated useful lives and residual values
of property, plant and equipment at the end of each annual reporting period. If
expectations differ from previous estimates, the changes are accounted for as a change in
an accounting estimate.
-27-

When the carrying amount of property, plant and equipment is higher than the recoverable
amount, the carrying amount is adjusted to the recoverable amount and the difference is
recognized as an impairment loss. Meanwhile, when the recoverable amount subsequently
exceeds the carrying amount of the impaired asset, the excess is recorded as a reversal of
impairment loss to the extent that the asset’s carrying amount does not exceed the carrying
amount that would have been determined, net of depreciation, if no impairment loss had
been recognized. Upon derecognition of a property, plant and equipment, the difference
between the net disposal proceed and carrying amount of the item is recognized in other
non-operating income (expense).
A revaluation surplus is recorded in OCI and credited to the asset revaluation reserve in
equity. However, to the extent that it reverses a revaluation deficit of the same asset
previously recognized in profit or loss, the increase is recognized in profit and loss. A
revaluation deficit is recognized in the statement of profit or loss, except to the extent that
it offsets an existing surplus on the same asset recognized in the asset revaluation reserve.
(10) Intangible assets
Intangible assets are initially measured at cost and are carried at cost less accumulated
amortization and accumulated impairment losses. Subsequent expenditure on an
intangible asset is capitalized only when it is probable that the expected future economic
benefits that are attributable to the asset will increase.
Intangible assets other than goodwill and intangibles with indefinite useful lives are
amortized on a straight-line basis over their estimated useful lives from the date that they
are available for use. The estimated useful lives of the intangible assets are as follows:
However, useful lives of certain trademarks and memberships, which are determined to
be indefinite since there is no foreseeable limit to the period over which the assets are
expected to generate net cash inflows for the Group, are not amortized but tested for
impairment once a year.
Goodwill acquired in a business combination is measured as the excess of the sum of: a)
the consideration transferred, b) the amount of any non-controlling interests in the
acquiree, and c) the fair value of the acquirer's previously held equity interest in the
acquiree (if any); over the net of the acquisition-date amounts of the identifiable assets
acquired and the liabilities assumed and is classified as intangible assets. Goodwill is
tested for impairment annually and carried at cost as established at the date of acquisition
of the business less accumulated impairment losses, if any. Impairment loss recognized
for goodwill is not reversed. For the purpose of impairment testing, goodwill is allocated
to each of the Group’s cash-generating units (or groups of cash-generating units) that is
expected to benefit from the synergies of the combination.
Useful lives Industrial property rights 5~10 years
Development costs 4~12 years
Others 2~20 years
-28-

Expenditures relating to development activities are capitalized when the result of the
development is for the development of new products or substantial improvement of
functions of existing products; there is technical and commercial feasibility of completing
the development; and the Group has the ability to measure reliably the expenditure
attributable to the development. Capitalized development cost include expenditure on
materials, salaries, wages and other employment-related costs of personnel directly
engaged in generating assets and related overhead cost which is systematically allocated.
Capitalized development costs are presented at the acquisition cost less accumulated
amortization and accumulated impairment losses. Capitalized development costs are
amortized using the straight-line method over the estimated useful life and amortization
expenses are included in cost of goods manufactured and amortization in selling and
administrative expenses. The expenditure on research and development which does not
meet conditions noted above is recognized as an expense when it is incurred.
The estimated useful life and amortization method for intangible assets with finite useful
lives are reviewed at the end of each reporting period and for the assets which have been
assessed as having indefinite useful life, that assessment is revisited each period, with the
effect of any changes in estimate being accounted for as a change in accounting estimate.
(11) Investment property
Investment properties are properties held to earn rentals and/or for capital appreciation.
Investment properties are measured initially at cost, including transaction costs.
Subsequent to initial recognition, the book value of investment property is presented at
the cost less accumulated depreciation and accumulated impairment.
While land is not depreciated, building is depreciated using the straight-line method over
the useful lives between 20 and 48 years.
The estimated useful lives, residual values and depreciation method are reviewed at the
end of each reporting period, with the effect of any changes in estimate being accounted
for as a change in accounting estimate.
(12) Borrowing costs
Borrowing costs directly attributable to the acquisition, construction or production of
qualifying assets, which are assets that necessarily take a substantial period of time to get
ready for their intended use, are added to the cost of those assets, until such time as the
assets are substantially ready for their intended use.
-29-

(13) Impairment of non-financial assets
Assets with indefinite useful lives such as goodwill are not amortized but tested for
impairment annually. Assets which are amortized or depreciated are tested for impairment
to determine whether events and circumstances indicating those assets have suffered
impairment exist. Impairment loss is the excess of the carrying amount over recoverable
amount. Recoverable amount is the higher of fair value less costs to sell and value in use.
When it is not possible to estimate the recoverable amount of an individual asset, the
Group estimates the recoverable amount of the cash-generating unit to which the asset
belongs. When a reasonable and consistent basis of allocation can be identified, corporate
assets are also allocated to individual cash-generating units, or otherwise they are
allocated to the smallest group of cash-generating units for which a reasonable and
consistent allocation basis can be identified. Except for goodwill, all non-financial assets
that have incurred impairment are tested for reversal of impairment at the end of each
reporting period.
(14) Borrowings
Borrowings are measured initially at fair value, net of transaction costs and subsequently
at amortized cost using the EIR, with interest expense being recognized on an effective
yield basis. The difference between the amount received and the redemption amount is
amortized using the effective interest method and recognized in profit or loss. Borrowings
are classified as non-current liabilities when the Group has an unconditional right to defer
settlement of the liability for at least twelve months after the end of the reporting period.
Otherwise borrowings are classified as current liabilities.
(15) Compound financial instrument
Compound financial instruments issued by the Group are classified as a financial liability
or an equity instrument in accordance with the substance of the contractual arrangement.
The conversion right of convertible bonds and stock warranties embedded in compound
financial instrument issued by the Group which can, at the option of the holder, be
converted into a fixed number of equity instruments in the Group, is classified as equity.
The liability component of a convertible bonds and bonds with stock warranties is
recognized at the fair value of a similar liability on initial recognition and be measured at
amortized cost by applying the EIR until it is extinguished. The equity component is
measured by deducting the fair value of the liability component from the fair value of the
compound financial instrument as a whole on initial recognition. Any tax effect is also
reflected, and such instrument is not subsequently remeasured.
The conversion right that is an embedded derivative is recognized at the market value of
a similar derivative or at the fair value derived from an appropriate valuation model.
Subsequent changes in fair value of the conversion right are recognized in profit or loss.
-30-

(16) Financial guarantee contracts
The Group has financial guarantee contract liabilities, which are obligations to pay
specific amounts for indemnifying creditors’ loss on insolvency of specific debtors
according to initial or revised contract provisions of liabilities on the payment date.
Financial guarantee contract liabilities are initially measured at their fair value less the
direct transaction cost relating to the issuance. Subsequently, financial guarantee contract
liabilities are measured at the higher of the amount of the obligations under the contract,
as determined in accordance with KIFRS 1037 Provisions, Contingent Liabilities and
Contingent Assets, and the amount initially recognized less the cumulative amortizations
recognized in accordance with the KIFRS 1018 Revenue.
(17) Employee benefits liability
The Group operates various types of benefit plans, and generally makes contributions
calculated based on periodic actuarial calculations to separately administered funds such
as qualifying insurance companies or trust funds.
A defined contribution plan is a post-employment benefit plan, under which the Group
pays fixed contribution to a separately administered fund. The Group does not assume
any legal or constructive obligation to pay the additional contribution even if the fund
does not hold sufficient assets to pay benefits, relating to employee’s service in the current
and prior periods, in full. The contribution is recognized as pension benefit at the date of
payment. If the contribution already paid exceeds the contribution due for services
rendered prior to the end of the reporting period, the Group recognizes such excess as an
asset (prepaid expense) to the extent that the prepayment will lead to a reduction in future
payments or a cash refund.
Defined benefit plans are post-employment benefit plans other than defined contribution
plans. Generally, under the defined benefit plan, amounts to be paid as retirement benefits
are determined by reference to a formula usually based on employees' earnings, years of
service, ages and other considerations. The retirement benefit obligation recognized in
the consolidated statements of financial position represents the present value of the
defined benefit obligation, less fair value of plan assets and adjustment for unrecognized
past service cost. The defined benefit obligation is calculated by an independent actuary
using the projected unit credit method. The present value of the defined benefit obligation
is denominated in the same currency in which the benefits are expected to be paid, and
calculated at the discount rate which is the yield at the reporting date on high quality
corporate bonds that have maturity dates approximating the terms of the Group’s
obligation.
Actuarial gain or loss from changes in actuarial assumptions or differences between
actuarial assumptions and actual results is recognized in other comprehensive income or
loss, which is immediately reflected in retained earnings. Past service cost is directly
recognized in profit or loss in the period the plan amendment or curtailment occurs.
-31-

(18) Provisions
Provisions are recognized when the Group has a present obligation (legal or constructive)
as a result of a past event, it is probable that the Group will be required to settle the
obligation, and a reliable estimate can be made of the amount of the obligation. A
provision is measured using the present value of the cash flows estimated to settle the
present obligation when the effect of the time value of money is material. At the end of
each reporting period, the remaining provision balance is reviewed and assessed to
determine if the current best estimate is being recognized. The increase in provision due
to passage of time is recognized as interest expense. If the existence of an obligation to
transfer economic benefit is no longer probable, the related provision is reversed during
the period.
When some or all of the economic benefits required to settle a provision are expected to
be recovered from a third party, a receivable is recognized as an asset if it is virtually
certain that reimbursement will be received and the amount of the receivable can be
measured reliably. In this case, any income arising from the third party reimbursement is
netted off against the related expense to be recognized in the consolidated statements of
profit or loss from the recognition of provisions.
(19) Leases
Leases are classified as finance leases whenever the terms of the lease transfer
substantially all the risks and rewards of ownership to the lessee. All other leases are
classified as operating leases.
(20) Derivative financial instruments and hedge accounting
Derivatives are initially recognized at fair value at the date the derivative contract is
entered into and are subsequently remeasured to their fair value at the end of each
reporting period. The resulting gain or loss is generally recognized as profit or loss when
it is incurred. However, the effective portion of changes in the fair value of derivatives
that are designated and qualify as cash flow hedges is recognized in other comprehensive
income or loss. The gain or loss relating to the ineffective portion is recognized
immediately in profit or loss.
1) Hedge accounting
The Group operates fair value hedges to avoid the risk of fair value change, which is
incurred from specific risk on assets, liabilities and firm contracts, and cash flow
hedges to avoid the risk of future cash flow change, which is incurred from specific
risk on expecting contracts. At the inception of the hedge relationship, the Group
documents the relationship between the hedging instrument and the hedged item,
along with its risk management objectives and its strategy for undertaking various
hedge transactions. Furthermore, at the inception of the hedge and on an ongoing
basis, the Group assesses whether the hedging instrument is highly effective in
offsetting changes in fair values or cash flows of the hedged item.
-32-

a) Fair value hedges
Changes in the fair value of derivatives that are designated and qualified as fair
value hedges (or gain or loss on foreign currency translation, when a financial
instrument, not derivative is designated as the hedging instrument) are recognized
in profit or loss immediately, together with any changes in the fair value of the
hedged asset or liability that are attributable to the hedged risk.
b) Cash flow hedges
The effective portion of change in the fair value of derivatives that are designated
and qualify as cash flow hedges for decreasing risk incurred from change of future
cash flow on forecast transaction is recognized in other comprehensive income or
loss. Amounts previously recognized in other comprehensive income or loss and
accumulated in equity are reclassified to profit or loss in the periods when the
hedged item is recognized in profit or loss, or is reflected in the carrying amount
of the associated asset or liability when the forecasted transaction occurs. Even
when hedge accounting is discontinued due to the expiration, termination or
exercise of hedging instrument, subsequent accounting treatment of amounts
recognized in other comprehensive income or loss and accumulated in equity is
the same. However, when hedge accounting is discontinued due to forecast
transaction being no longer expected to occur, the gain or loss accumulated in
equity is recognized immediately in profit or loss.
2) Separable embedded derivatives
Embedded derivatives are separated from the host contract and accounted for
separately only if the following criteria has been met: (a) the economic characteristics
and risks of the host contract and the embedded derivatives are not clearly and closely
related to a separate instrument with the same terms as the embedded derivative that
would meet the definition of a derivative, and (b) the hybrid (combined) instrument
is not measured at fair value through profit or loss. Changes in the fair value of
separable embedded derivatives are recognized immediately in profit or loss.
3) Other derivative financial instruments
Derivative financial instruments other than the effective portion of derivative
financial instruments that are designated as the hedging instruments are measured at
fair value. Gain or loss arising from changes in fair value is recognized in profit or
loss.
(21) Dividend
Dividend payable is recognized as liability when declaration of the dividend is approved
in the shareholders’ meeting.
-33-

(22) Issued capital Common stocks are classified as equity, and the incremental costs directly arising from
capital transactions, net of tax are deducted from equity. Preferred stocks are classified as
equity only if the preferred stocks are not redeemable or redeemable solely upon the
Group’s decision, or the distribution of dividends is solely upon the Group's decision.
Once a general meeting of shareholders meeting approves dividends, the Group
recognizes the dividend liability accordingly.
Own equity instruments that are reacquired (treasury shares) are recognized at cost and
deducted from equity. No gain or loss is recognized in profit or loss on the purchase, sale,
issue or cancellation of the Group’s own equity instruments.
(23) Share-based payments
The Group measures the cost of share options granted to employees by reference to the
estimated fair value at the date at which they are granted. The share-based payment
expenses are recognized on a straight-line basis over the vesting period reflecting
expected forfeiture rate. The Group determines the fair value of share option using the
Black-Scholes option pricing model.
(24) Revenue recognition(Excluding construction contract)
Revenue is measured at the fair value of the consideration received or receivable for the
sale of goods and rendering of services arising in the course of the ordinary activities of
the Group. Revenue is reduced for value added tax, estimated customer returns, rebates
and trade discounts and is presented after eliminating intercompany transactions. The
Group recognizes revenue when the amount of revenue can be measured reliably and it is
probable that the economic benefits associated with the transaction will flow to the Group
and when transaction meets the revenue recognition criteria specified by activity. When
measuring revenue, the Group reliably estimates on contingencies related to sales based
on historical data such as customer type, transaction type and trading terms.
1) Sale of goods
Revenue from the sale of goods is recognized when the Group has transferred to the
buyer the significant risks and rewards of ownership of the goods. Revenue is
recognized on initial delivery of the goods net of expected discounts and returns
estimated based on historical data. The Group estimates and recognizes provision for
warranty and sales return arising from sale of goods.
2) Rendering of services
If the outcome of a contract can be reliably measured, contract revenue and contract
cost associated with the construction contract are recognized by reference to the stage
of completion of the contract activity at the end of the reporting period. The stage of
completion of the contract is assessed by reference to the proportion of the actual
contract costs incurred to the costs to complete the contract. Should the construction
contract expect to incur loss (total contract cost exceeds total contract revenue), such
loss is immediately recognized in profit or loss. Revenue from service transactions
other than a construction contract is recognized by using percentage of completion
method.
-34-

3) Royalty revenue
Royalty revenue is recognized on an accrual basis in accordance with the substance
of the relevant agreement.
4) Dividend and Interest revenue
Revenues arising from dividends are recognized when the right to receive the
dividend payment is established. Interest income from a financial asset is recognized
when it is probable that the economic benefits will flow to the Group and the amount
of income can be measured reliably. Interest income is recognized using the effective
interest method.
5) Lease
Lease income is accounted for on a straight-line basis over the lease terms.
(25) Construction contracts
Where the outcome of a construction contract can be estimated reliably, revenue and costs
are recognized by reference to the stage of completion of the contract activity at the end
of the reporting period, measured based on the proportion of contract costs incurred for
work performed to date relative to the estimated total contract costs, except where this
would not be representative of the stage of completion. Variations in contract work,
claims and incentive payments are included to the extent that the amount can be measured
reliably and its receipt is considered probable. Where the outcome of a construction
contract cannot be estimated reliably, contract revenue is recognized to the extent of
contract costs incurred that it is probable will be recoverable. Contract costs are
recognized as expenses in the period in which they are incurred.
When it is probable that total contract costs will exceed total contract revenue, the
expected loss is recognized as an expense immediately.
When contract costs incurred to date plus recognized profits less recognized losses exceed
progress billing, the surplus is shown as amounts due from customers for contract work.
For contracts where progress billings exceed contract costs incurred to date plus
recognized profits less recognized losses, the surplus is shown as the amounts due to
customers for contract work. Amounts received before the related work is performed are
included in the consolidated statement of financial position, as a liability, as advances
received. Amounts billed for work performed but not yet paid by the customer are
included in the consolidated statement of financial position under trade and other
receivables.
-35-

(26) Government grants
Government grants that are earmarked for the acquisition of assets are recognized as a
deduction from the acquisition cost of the received assets or other assets for temporarily
investing received assets before the intended assets are acquired. When the intended
assets are acquired, they are recorded as a deduction from the acquisition cost.
Government grants that have no specific condition for their use are recognized in
operating income when it is directly related to primary operations. If not, government
grants are recognized in other non-operating income. If there are specific expenses related
to government grants, the Group offsets the income from government grants with such
expenses and recognizes the net amount in profit or loss.
(27) Taxes and deferred tax
Income tax expense is composed of current and deferred tax. Current and deferred tax are
recognized in profit or loss, except when they relate to items that are recognized in other
comprehensive income or loss or directly in equity, in which case, the current and deferred
tax are also recognized in other comprehensive income or loss or directly in equity,
respectively.
Income tax (current tax) expense is the sum of corporate tax for each fiscal year and tax
added to corporate tax under corporate income tax law and other applicable laws.
Additional income taxes or tax refunds for the prior periods are included in income tax
expense for the current period when recognized. The Group’s liability for current tax is
calculated using tax rates that have been enacted or substantively enacted by the end of
the reporting period.
Deferred tax is recognized on temporary differences between the carrying amounts of
assets and liabilities in the consolidated financial statements and the corresponding tax
bases used in the computation of taxable income. Deferred tax assets and liabilities are
not recognized if the temporary difference arises from the initial recognition (other than
in a business combination) of other assets and liabilities in a transaction that affects
neither the taxable income nor the accounting income.
Deferred tax assets and liabilities are measured at the tax rates that are expected to apply
in the period in which the liability is settled or the asset realized, based on tax rates (and
tax laws) that have been enacted or substantively enacted by the end of the reporting
period.
Deferred tax liabilities are recognized for taxable temporary differences associated with
investments in subsidiaries, joint ventures and associates except where the Group is able
to control the reversal of the temporary difference and it is probable that the temporary
difference will not reverse in the foreseeable future. Deferred tax assets arising from
deductible temporary differences associated with such investments and interests are only
recognized to the extent that it is probable that there will be sufficient taxable income
against which to utilize the benefits of the temporary differences and they are expected to
reverse in the foreseeable future.
-36-

The carrying amount of deferred tax assets is reviewed at the end of each reporting period
and reduced to the extent that it is no longer probable that sufficient taxable income will
be available to allow all or part of the asset to be recovered.
(28) Non-current assets held for sale
Non-current assets and disposal groups are classified as held-for-sale if their carrying
amount will be recovered principally through a sale transaction rather than through
continuing use. Non-current assets (and disposal groups) classified as held for sale are
measured at the lower of their previous carrying amount and fair value less costs to sell
and are no longer depreciated or amortized.
If the fair value less costs to sell of the non-current assets held-for-sale (and disposal
groups) decrease, impairment loss is recognized immediately in profit or loss. A gain
should be recognized for any subsequent increase in fair value less costs to sell of an asset,
but not in excess of the cumulative impairment loss previously recognized.
(29) Operating segments
Operating segments are reported on the same basis as the financial information that is
reported to the management of the Group. The management of the Group is responsible
for the allocation of resources and assessment of performance for the operating segments.
(30) Greenhouse gas emissions
The Group receives free emission rights as a result of emission trading schemes. The
rights are received on an annual basis and, in return, the Group is required to remit rights
equal to its actual emissions. The Group has adopted the net liability approach to the
emission rights granted. Therefore, a provision is recognized only when actual emissions
exceed the emission rights granted and still held. The emission costs are recognized as
other operating costs. Where emission rights are purchased from other parties, they are
recorded at cost, and treated as a reimbursement right, whereby they are matched to the
emission liabilities and re-measured to fair value. The changes in fair value are recognized
in the statement of profit or loss and other comprehensive income.
3. SIGNIFICANT ACCOUNTING JUDGMENTS AND KEY SOURCES OF
ESTIMATION UNCERTAINTIES:
The estimates and underlying assumptions are reviewed on an
ongoing basis. The estimates and underlying assumptions are
based on historical experiences and other factors including
expectation on possible future events. Actual results may differ
from these estimates. The following are critical assumptions and
key sources of estimation uncertainty at the end of reporting
period, that have a significant risk of causing a material
adjustment to the carrying amounts of the Group’s assets and
liabilities within the next financial year.
-37-

(1) Revenue recognition based on percentage of completion
Revenue for construction contracts is recognized using the percentage-of-completion
method, under which revenue is recognized as work progresses in the ratio of actual costs
incurred to estimated total costs. Any changes in the early stages of long-term projects in
the scope and costs of project implementation in the construction period, and in
construction plans may have a significant effect on the amount of revenue recognized.
(2) Impairment of goodwill
Goodwill is tested for impairment annually and when circumstances indicate that the
carrying value may be impaired. Recoverable amount of cash generating unit (CGU) is
calculated based on the value in use, this calculation requires the use of accounting
estimates.
(3) Employee benefit liability
The Group operates a defined benefit plan. Defined benefit liability is calculated by annual
actuarial valuations as of the reporting date. In order to perform the actuarial valuations,
assumptions for discount rates, future salary increases and others are required to be
estimated.
(4) Provisions
Provisions are recognized when the Group has a present obligation (legal or constructive)
as a result of a past event, and if it is probable that an outflow of resources embodying
economic benefits will be required to settle the obligation and if a reliable estimate can be
made of the amount of the obligation. In accordance with the relevant laws and practices,
the estimated amounts may change to prescribe for additional provisions to be recognized
in future periods.
(5) Deferred tax
Recognition and measurement of deferred tax assets and liabilities require judgement of
the Group’s management. Especially, the recognition of deferred tax asset and the scope of
recognition are influenced by assumptions about future circumstances and judgement of
management.
-38-
(6) Impairment of non-financial assets
Impairment exists when the carrying value of an asset or CGU exceeds its recoverable
amount, which is the higher of its fair value less costs of disposal and its value in use. The
fair value less costs of disposal calculation is based on available data from binding sales
transactions, conducted at arm’s length, for similar assets or observable market prices less
incremental costs for disposing of the asset. The value in use calculation is based on a
discounted cash flow (DCF) model. The cash flows are derived from the budget for the
next five years and do not include restructuring activities that the Group is not yet
committed to or significant future investments that will enhance the asset’s performance
of the CGU being tested. The recoverable amount is sensitive to the discount rate used for
the DCF model as well as the expected future cash-inflows and the growth rate used for
extrapolation purposes. The key assumptions used to determine the recoverable amount
for the different CGUs.
4. FINANCIAL RISK MANAGEMENT:
The Group is exposed to various financial risks, such as market (foreign currency risk and
interest rate risk), credit and liquidity, relating to the operations of the Group. The purpose of
risk management policy is to minimize potential risks, which could have adverse effect on
financial performance.
Financial risk management activities are performed by the Treasury department in accordance
with the aforementioned documented risk management policies. In addition, the Group enters
into derivative contracts to hedge against certain risks. The Group is trying to minimize the
effect of financial risks by reorganizing financial risk management policy and monitoring
financial risks regularly.
(1) Market risk
1) Foreign currency risk
The Group’s exposure to the risk of changes in foreign currency exchange rates relates
primarily to the Group’s operating activities and net investments in foreign
subsidiaries. The Group’s objective of foreign currency risk management is to
minimize uncertainty and volatility arising from fluctuations in foreign currency
exchange rates. Foreign currency risk is managed in accordance to the Group’s policy
on foreign currencies, and currency trading for speculative purposes is prohibited.
Foreign currency risk is managed by the Group’s policy on foreign currencies. The
Group’s basis for foreign currency management is to reduce income/loss volatility.
The Group reduces exposure to foreign currency risk by matching the inflow and the
outflow of foreign currencies (natural hedge) and manages foreign currency risk by
using currency derivatives, such as currency forwards, for the remaining exposure.
-39-

The book value of the Group’s monetary assets and liabilities denominated in foreign
currencies, which represents the maximum exposure to foreign currency risk as of
December 31, 2016 and 2015 is as follows (in millions of Korean won):
2016
USD EUR JPY GBP Others (*1) Total
Financial assets ₩1,841,337 ₩256,224 ₩6,528 ₩55,829 ₩560,948 ₩2,720,866
Financial liabilities 2,972,281 562,000 63,879 45,541 152,379 3,796,080
Net assets (liabilities)
₩(1,130,944) ₩(305,776) ₩(57,351) 10,288 408,569 ₩(1,075,214)
2015
USD EUR JPY GBP Others (*1) Total
Financial assets ₩1,855,656 ₩235,622 ₩3,708 ₩43,382 ₩250,720 ₩2,389,088
Financial liabilities 3,156,123 586,422 85,566 46,502 131,460 4,006,073
Net assets (liabilities) ₩(1,300,467) ₩(350,800) ₩(81,858) ₩(3,120) ₩119,260 ₩(1,616,985)
(*1) Others are assets and liabilities denominated in foreign currencies other than
USD, EUR, JPY and GBP.
A sensitivity analysis on the Group’s income before tax for the period, assuming a 10%
increase and decrease in currency exchange rates, as of December 31, 2016 and 2015
is as follows (in millions of Korean won):
2016 2015
10% increase 10% decrease 10% increase
10% decrease
Income before tax impact ₩(107,521) ₩107,521 ₩(161,699) ₩161,699
The above-mentioned sensitivity analysis is based on monetary assets and liabilities
denominated in foreign currencies other than the Group’s functional currency as of
December 31, 2016 and 2015
2) Interest rate risk
Interest rate risk is related to borrowings and bank deposits with floating interest rates,
and related interest income and expense are exposed to interest rate risk. The Group is
exposed to interest rate risk mainly due to its borrowing or deposit with floating
interest rates. The purpose of interest rate risk management is to minimize uncertainty
and financial expense arising from interest rate fluctuation.
-40-

To manage its interest rate risk, the Group minimizes external borrowings using
internal funds and reduces borrowings with high interest rates and maintains an
appropriate balance between borrowings with floating interest rate and fixed-interest
rate and short-term and long-term borrowings. The Group manages its interest rate risk
preemptively through regular monitoring and adjustments to the changing domestic
and overseas markets conditions and nature of its interest rates.
Floating rate financial assets and liabilities exposed to interest rate risk as of December
31, 2016 and 2015 are as follows (in millions of Korean won):
2016 2015
Financial assets ₩187,393 ₩576,278
Financial liabilities 4,129,315 5,469,319
Net assets (liabilities) ₩(3,941,922) ₩(4,893,041)
A sensitivity analysis on the Group’s income before tax for the period, assuming a 1%P
increase and decrease in interest rates, as of December 31, 2016 and 2015 is as follows
(in millions of Korean won):
2016 2015
1%p increase 1% p decrease 1%p Increase 1%p decrease
Income before tax impact ₩(39,419) ₩39,419 ₩(48,930) ₩48,930
3) Price risk
The Group is exposed to equity price risks arising from its listed equity investments
among AFS equity investments. The Group periodically measures the risk as the fair
value or future cash flows of equity investments may fluctuate due to the changes in
market prices. Important investments in the Group’s portfolio are individually
managed, and acquisition and disposal are approved by the Board of Directors.
-41-
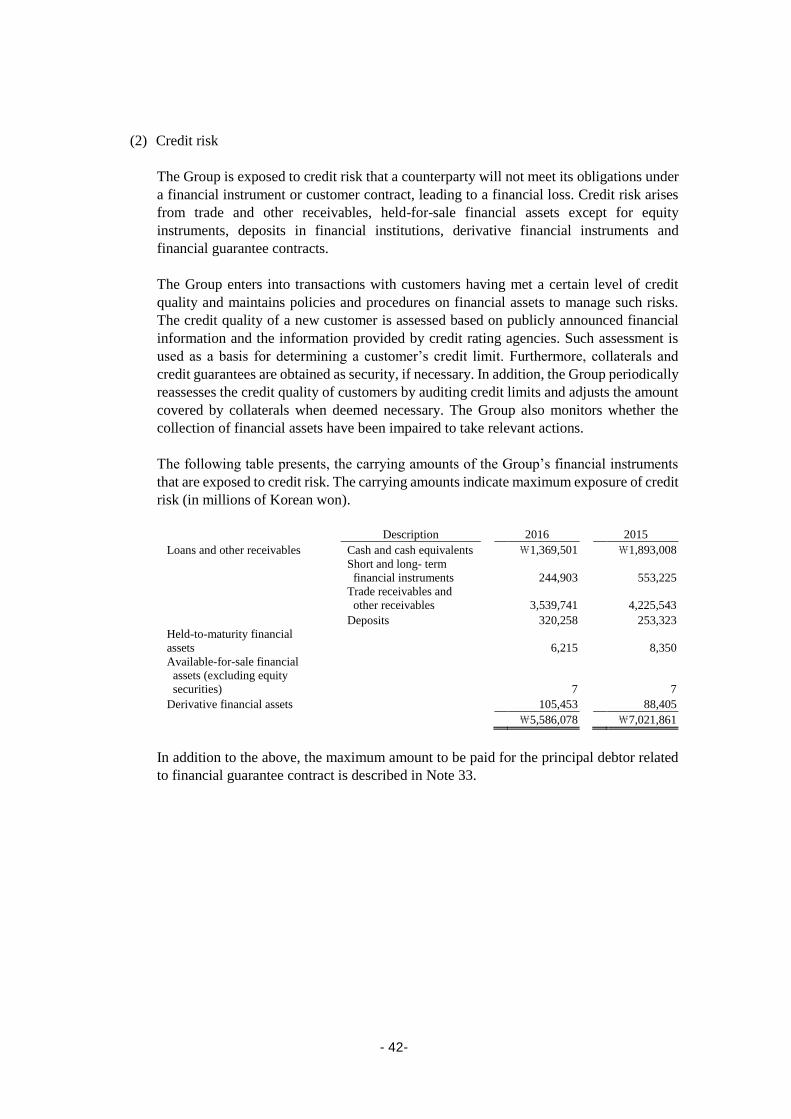
(2) Credit risk
The Group is exposed to credit risk that a counterparty will not meet its obligations under
a financial instrument or customer contract, leading to a financial loss. Credit risk arises
from trade and other receivables, held-for-sale financial assets except for equity
instruments, deposits in financial institutions, derivative financial instruments and
financial guarantee contracts.
The Group enters into transactions with customers having met a certain level of credit
quality and maintains policies and procedures on financial assets to manage such risks.
The credit quality of a new customer is assessed based on publicly announced financial
information and the information provided by credit rating agencies. Such assessment is
used as a basis for determining a customer’s credit limit. Furthermore, collaterals and
credit guarantees are obtained as security, if necessary. In addition, the Group periodically
reassesses the credit quality of customers by auditing credit limits and adjusts the amount
covered by collaterals when deemed necessary. The Group also monitors whether the
collection of financial assets have been impaired to take relevant actions.
The following table presents, the carrying amounts of the Group’s financial instruments
that are exposed to credit risk. The carrying amounts indicate maximum exposure of credit
risk (in millions of Korean won).
Description 2016 2015
Loans and other receivables Cash and cash equivalents ₩1,369,501 ₩1,893,008
Short and long- term
financial instruments
244,903
553,225
Trade receivables and
other receivables
3,539,741
4,225,543
Deposits 320,258 253,323
Held-to-maturity financial
assets
6,215
8,350
Available-for-sale financial
assets (excluding equity
securities)
7
7
Derivative financial assets 105,453 88,405
₩5,586,078 ₩7,021,861
In addition to the above, the maximum amount to be paid for the principal debtor related
to financial guarantee contract is described in Note 33.
-42-

The Group’s receivables’ aging analysis as of December 31, 2016 and 2015 is as follows
(in millions of Korean won):
2016
Before
maturity 0–3 months 3–6 months 6–12 months
More than
12 months Total
Trade receivables ₩970,693 ₩287,507 ₩102,315 ₩179,849 ₩2,051,185 ₩3,591,549
Loans and other
receivables 703,177 103,675 69,029 121,242 1,301,996 2,299,119
Accrued income 33,069 1,728 312 1,241 110,919 147,269
Total ₩1,706,939 ₩392,910 ₩171,656 ₩302,332 ₩3,464,100 ₩6,037,937
2015
Before
maturity 0–3 months 3–6 months 6–12 months
More than
12 months Total
Trade receivables ₩1,292,419 ₩309,832 ₩155,501 ₩175,189 ₩2,416,303 ₩4,349,244
Loans and other
receivables 489,981 270,441 43,350 102,759 1,310,813 2,217,344
Accrued income 37,776 101,233 - - 10,297 149,306
Total ₩1,820,176 ₩681,506 ₩198,851 ₩277,948 ₩3,737,413 ₩6,715,894
An allowance is recognized by applying appropriate allowance rates for receivables that
can be assessed to be impaired individually due to insolvency, bankruptcy and others or
an allowance can be estimated by assessing the cash flow of individual project. A group
of financial assets that are not individually significant and have similar credit risk
characteristics are assessed for impairment on a collective basis based on aging analysis
and the Group’s past experience of receivables collection. AFS financial assets, held-to-
maturity financial assets, deposits in financial institutions and derivative instruments are
individually assessed for impairment.
(3) Liquidity risk
The Group is exposed to liquidity risk that it will encounter difficulties in fulfilling the
obligations associated with its financial liabilities that are settled by delivering cash or
another financial asset.
The Group manages liquidity risk by matching the duration of financial assets and
liabilities through estimating future cash flows from its operating, investing and financing
activities, and securing moderate levels of liquidity in advance.
-43-

A summary of the Group’s non-derivative liabilities maturity as of December 31, 2016
and 2015 is as follows (in millions of Korean won):
2016
Book value
Nominal cash flows according to contract
Total
Less than 1 year
1 year–2 years 2–5 years
More than 5 years
Financial liabilities ₩14,306,493 ₩14,363,506 ₩9,534,429 ₩2,166,790 ₩2,620,976 ₩41,311
Interest on financial liabilities - 596,307 266,818 157,098 171,511 880
Total ₩14,306,493 ₩14,959,813 ₩9,801,247 ₩2,323,888 ₩2,792,487 ₩42,191
2015
Book
Value
Nominal cash flows according to contract
Total
Less than
1 year
1 year–2
years 2–5 years
More than
5 years
Financial liabilities ₩16,209,846 ₩16,245,785 ₩10,045,230 ₩2,266,430 ₩2,098,613 ₩1,835,512
Interest on financial liabilities - 885,032 340,817 188,475 322,449 33,291
Total ₩16,209,846 ₩17,130,817 ₩10,386,047 ₩2,454,905 ₩2,421,062 ₩1,868,803
The contractual amounts of financial liabilities in the above tables are calculated basis on
non-discounted cash flows (including interest expense) and therefore differ from their
book values. Other than the above non-derivative liabilities, the maximum guarantee
amounts based on financial guarantee contracts provided by the Group as of December 31,
2016 are described in Note 33.
(4) Capital risk
The objective of the Group’s capital risk management is to secure its ability to provide
earnings to its shareholders and interested parties and sustain optimal capital structure to
reduce the cost of capital. In order to sustain optimal capital structure, the Group uses a
debt-to-equity ratio similar to other entities in the industry. Debt-to-equity ratio is
calculated by dividing total liabilities by total equity and net borrowings to equity ratio is
calculated by dividing net borrowings by total equity. Net borrowings are calculated by
deducting cash and cash equivalents, short and long term financial instruments from total
borrowings.
-44-

Debt-to-equity ratios and net borrowings-to-equity ratios as of December 31, 2016 and
2015, are as follows (in millions of Korean won):
2016 2015
Total liabilities ₩18,009,737 ₩20,234,033
Total equity 6,822,831 7,026,108
Debt-to-equity ratio 263.96% 287.98%
Cash and cash equivalents and
financial instruments
₩1,614,404 ₩2,446,233
Total borrowings 10,449,563 12,605,543
Net borrowings 8,835,159 10,159,310
Net borrowings-to-equity ratio 129.49% 144.59%
5. RESTRICTED FINANCIAL ASSETS:
Details of restricted financial assets as of December 31, 2016 and 2015, are as follows (in
millions of Korean won):
2016 2015 Restrictions
Cash and cash equivalents ₩8,551 ₩12,271 Collateral for prepayments and others
Short-term financial
instruments
165,958 357,627
Government R&D projects (*1), advanced receipts
from contractors (*2), shared growth fund,
establishment of a pledge right, collateral for long-
term borrowings and others
Long-term financial
instruments
2,071 2,082
Security deposits for maintenance of checking
accounts and others
Deposits 22,020 584
Reserves for repayments related to asset backed loans
Total
₩198,600 ₩372,564
(*1) The amounts are restricted in use and may only be used for specific national R&D
projects.
(*2) The amounts may only be used for designated construction contracts.
-45-
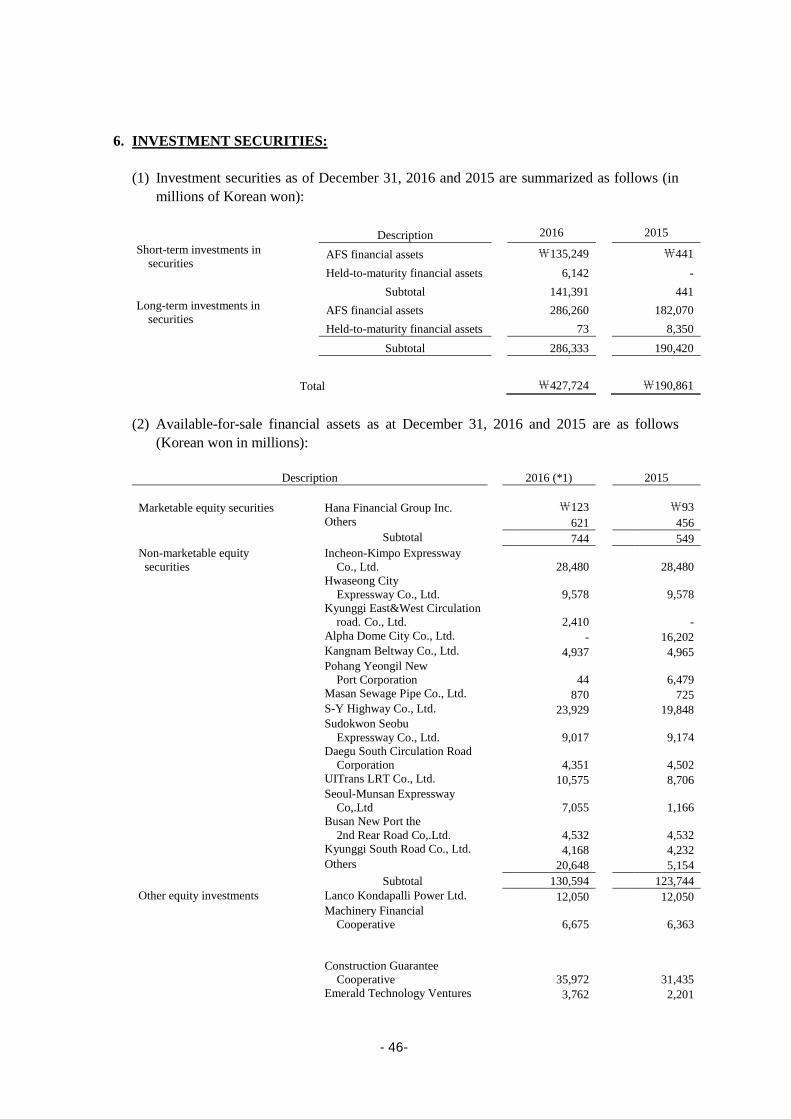
6. INVESTMENT SECURITIES:
(1) Investment securities as of December 31, 2016 and 2015 are summarized as follows (in
millions of Korean won):
Description 2016 2015
Short-term investments in
securities AFS financial assets ₩135,249 ₩441
Held-to-maturity financial assets 6,142 -
Subtotal 141,391 441
Long-term investments in
securities AFS financial assets 286,260 182,070
Held-to-maturity financial assets 73 8,350
Subtotal 286,333 190,420
Total ₩427,724 ₩190,861
(2) Available-for-sale financial assets as at December 31, 2016 and 2015 are as follows
(Korean won in millions):
Description 2016 (*1) 2015
Marketable equity securities Hana Financial Group Inc.
₩123
₩93
Others 621 456
Subtotal 744 549
Non-marketable equity
securities Incheon-Kimpo Expressway
Co., Ltd.
28,480
28,480
Hwaseong City
Expressway Co., Ltd.
9,578
9,578
Kyunggi East&West Circulation
road. Co., Ltd.
2,410
-
Alpha Dome City Co., Ltd. - 16,202
Kangnam Beltway Co., Ltd. 4,937 4,965
Pohang Yeongil New
Port Corporation
44
6,479
Masan Sewage Pipe Co., Ltd. 870 725
S-Y Highway Co., Ltd. 23,929 19,848
Sudokwon Seobu
Expressway Co., Ltd.
9,017
9,174
Daegu South Circulation Road
Corporation
4,351
4,502
UITrans LRT Co., Ltd. 10,575 8,706
Seoul-Munsan Expressway
Co,.Ltd
7,055
1,166
Busan New Port the
2nd Rear Road Co,.Ltd.
4,532
4,532
Kyunggi South Road Co., Ltd. 4,168 4,232
Others 20,648 5,154
Subtotal 130,594 123,744
Other equity investments Lanco Kondapalli Power Ltd. 12,050 12,050
Machinery Financial
Cooperative
6,675
6,363
Construction Guarantee
Cooperative
35,972
31,435
Emerald Technology Ventures 3,762 2,201
-46-

Description 2016 (*1) 2015
Others 6,561 3,490
Subtotal 65,020 55,539
Beneficiary certificate Gold Spoon JY 2nd 60,000 -
Eugene customized special
invest type private placement
investment trust 1st
89,603
-
Others 75,541 2,672
Subtotal 225,144 2,672
Debit securities Regional development
bonds and others
7
7
Total
₩421,509
₩182,511
(*1) As at December 31, 2016, a portion of the Group’s available-for-sale financial assets has
been pledged as collateral for the Group’s borrowings and developers’ project financing
(See Note 34).
-47-

(3) Change in fair value of available-for-sale financial assets for the years ended December
31, 2016 and 2015 are as follows (Korean won in millions):
2016
January 1 Valuation
Reclassified
to profit or
loss December 31
Marketable equity
Securities
₩(4,119)
₩6,758
₩-
₩2,639
Non-marketable equity
Securities
(33,390)
8,911
4,369
(20,110)
Other equity investments 4,817 370 - 5,187
Tax effect 2,148 (4,290) (960) (3,102)
₩(30,544) ₩11,749 ₩3,409 ₩(15,386)
2015
January 1 Valuation
Reclassified
to profit or
loss December 31
Marketable equity
Securities
₩ (3,586)
₩ (533)
₩-
₩ (4,119)
Non-marketable equity
Securities
(1,543)
(65)
(31,782)
(33,390)
Other equity investments 4,705 112 - 4,817
Tax effect 221 68 1,859 2,148
₩(203) ₩(418) ₩(29,923) ₩(30,544)
(4) Held-to-maturity financial assets as at December 31, 2016 and 2015 are as follows
(Korean won in millions):
2016 2015
Current Non-current Current Non-current
Government and
corporate bonds ₩-
₩72
₩-
₩49
Other debt securities 6,142 1 - 8,301
₩6,142 ₩73 ₩- ₩8,350
-48-
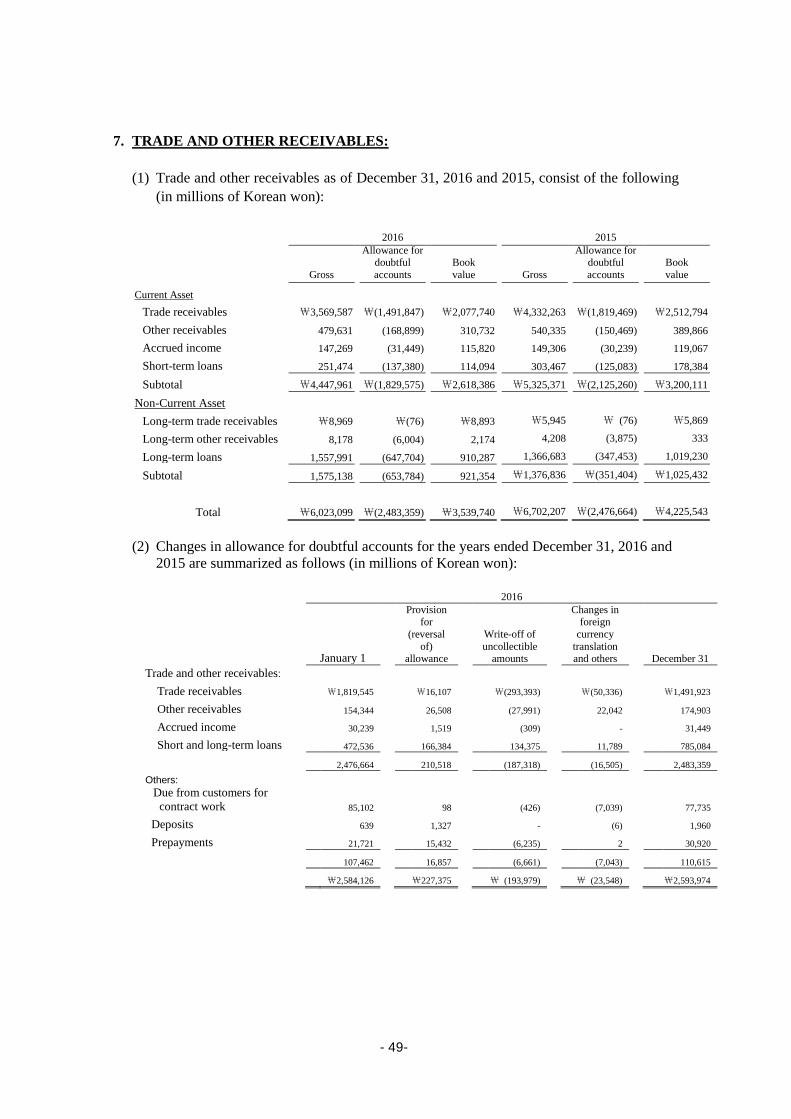
7. TRADE AND OTHER RECEIVABLES:
(1) Trade and other receivables as of December 31, 2016 and 2015, consist of the following
(in millions of Korean won):
2016 2015
Gross
Allowance for doubtful
accounts
Book
value
Gross
Allowance for doubtful
accounts
Book
value
Current Asset
Trade receivables ₩3,569,587 ₩(1,491,847) ₩2,077,740 ₩4,332,263 ₩(1,819,469) ₩2,512,794
Other receivables 479,631 (168,899) 310,732 540,335 (150,469) 389,866
Accrued income 147,269 (31,449) 115,820 149,306 (30,239) 119,067
Short-term loans 251,474 (137,380) 114,094 303,467 (125,083) 178,384
Subtotal ₩4,447,961 ₩(1,829,575) ₩2,618,386 ₩5,325,371 ₩(2,125,260) ₩3,200,111
Non-Current Asset
Long-term trade receivables ₩8,969 ₩(76) ₩8,893 ₩5,945 ₩ (76) ₩5,869
Long-term other receivables 8,178 (6,004) 2,174 4,208 (3,875) 333
Long-term loans 1,557,991 (647,704) 910,287 1,366,683 (347,453) 1,019,230
Subtotal 1,575,138 (653,784) 921,354 ₩1,376,836 ₩(351,404) ₩1,025,432
Total ₩6,023,099 ₩(2,483,359) ₩3,539,740 ₩6,702,207 ₩(2,476,664) ₩4,225,543
(2) Changes in allowance for doubtful accounts for the years ended December 31, 2016 and
2015 are summarized as follows (in millions of Korean won):
2016
January 1
Provision
for
(reversal
of) allowance
Write-off of
uncollectible amounts
Changes in
foreign
currency
translation and others December 31
Trade and other receivables:
Trade receivables ₩1,819,545 ₩16,107 ₩(293,393) ₩(50,336) ₩1,491,923
Other receivables 154,344 26,508 (27,991) 22,042 174,903
Accrued income 30,239 1,519 (309) - 31,449
Short and long-term loans 472,536 166,384 134,375 11,789 785,084
2,476,664 210,518 (187,318) (16,505) 2,483,359
Others:
Due from customers for
contract work
85,102
98
(426)
(7,039)
77,735
Deposits 639 1,327 - (6) 1,960
Prepayments 21,721 15,432 (6,235) 2 30,920
107,462 16,857 (6,661) (7,043) 110,615
₩2,584,126 ₩227,375 ₩ (193,979) ₩ (23,548) ₩2,593,974
-49-
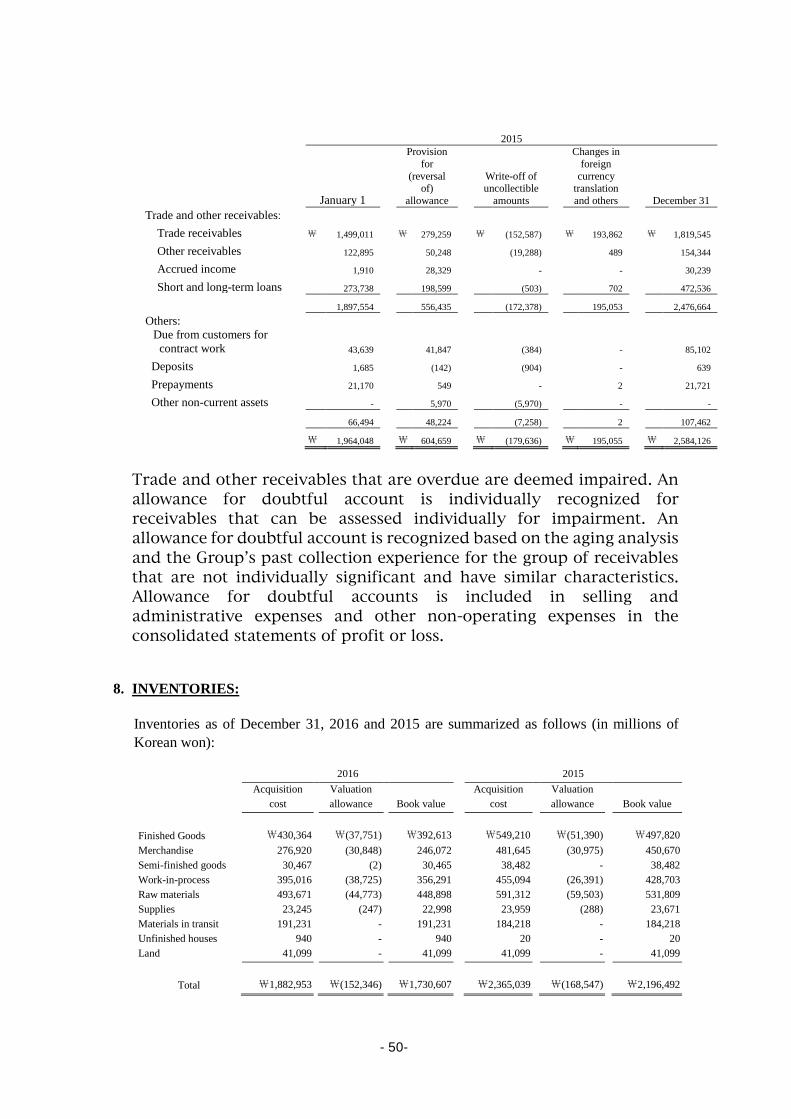
2015
January 1
Provision
for
(reversal of)
allowance
Write-off of uncollectible
amounts
Changes in
foreign
currency translation
and others December 31
Trade and other receivables:
Trade receivables ₩ 1,499,011 ₩ 279,259 ₩ (152,587) ₩ 193,862 ₩ 1,819,545
Other receivables 122,895 50,248 (19,288) 489 154,344
Accrued income 1,910 28,329 - - 30,239
Short and long-term loans 273,738 198,599 (503) 702 472,536
1,897,554 556,435 (172,378) 195,053 2,476,664
Others:
Due from customers for
contract work
43,639
41,847
(384)
-
85,102
Deposits 1,685 (142) (904) - 639
Prepayments 21,170 549 - 2 21,721
Other non-current assets - 5,970 (5,970) - -
66,494 48,224 (7,258) 2 107,462
₩ 1,964,048 ₩ 604,659 ₩ (179,636) ₩ 195,055 ₩ 2,584,126
Trade and other receivables that are overdue are deemed impaired. An
allowance for doubtful account is individually recognized for
receivables that can be assessed individually for impairment. An
allowance for doubtful account is recognized based on the aging analysis
and the Group’s past collection experience for the group of receivables
that are not individually significant and have similar characteristics.
Allowance for doubtful accounts is included in selling and
administrative expenses and other non-operating expenses in the
consolidated statements of profit or loss.
8. INVENTORIES:
Inventories as of December 31, 2016 and 2015 are summarized as follows (in millions of
Korean won):
2016 2015
Acquisition
cost
Valuation
allowance Book value
Acquisition
cost
Valuation
allowance Book value
Finished Goods ₩430,364 ₩(37,751) ₩392,613 ₩549,210 ₩(51,390) ₩497,820
Merchandise 276,920 (30,848) 246,072 481,645 (30,975) 450,670
Semi-finished goods 30,467 (2) 30,465 38,482 - 38,482
Work-in-process 395,016 (38,725) 356,291 455,094 (26,391) 428,703
Raw materials 493,671 (44,773) 448,898 591,312 (59,503) 531,809
Supplies 23,245 (247) 22,998 23,959 (288) 23,671
Materials in transit 191,231 - 191,231 184,218 - 184,218
Unfinished houses 940 - 940 20 - 20
Land 41,099 - 41,099 41,099 - 41,099
Total ₩1,882,953 ₩(152,346) ₩1,730,607 ₩2,365,039 ₩(168,547) ₩2,196,492
-50-
Reversal of losses on inventory valuation charged to the cost of sales amounted to ₩16,201
million and ₩28,607 million the year ended December 31, 2016 and 2015, respectively.
-51-

9. DERIVATIVES:
(1) Details of gain and loss on valuation of derivatives as of December 31, 2016 and 2015,
are as follows (in thousands of foreign currencies and millions of Korean won):
2016
Buy Sell
Derivative
financial assets
(liabilities)
Gain (loss) on
valuation of
derivative
financial
instruments(*4)
Other
comprehensive
income (loss) (*1)
Firm commitment
asset (liabilities)
(*2) Currency Amount Currency Amount
Foreign currency forwards:
KRW 5,403,197 USD 4,735,416 ₩(286,929) ₩(160,331) ₩(14,167) ₩165,551
KRW 116,591 EUR 87,936 4,221 1,658 3,200 76
KRW 211,493 JPY 19,279,568 1,163 (5,724) (635) (2,049)
KRW 102,930 Others (1,215) (2,258) 682 1,570
USD 2,400,231 KRW 2,750,577 116,432 57,413 44,853 (16,191)
EUR 312,270 KRW 411,561 (10,119) (4,265) (3,121) 3,906
JPY 25,268,718 KRW 304,509 (28,043) (216) (2,882) (348)
Others KRW 149,796 (901) (1,275) (13) (50)
GBP and others EUR and others 7,097 (5,441) (9,979) 2,184
Long-term and Short-term borrowing denominated in
foreign currencies (*3)
KRW - USD - - - -
3,268
Embedded derivatives and others 131 447 131 -
Put back option(see 9-(2)) - (160) - -
Subtotal (198,163) (120,152) 18,069 157,917
Tax effect - - (4,479) -
Adjustments for consolidation - - 14,598 -
Total ₩(198,163) ₩(120,152) ₩28,188 ₩157,917
(*1) In consideration of the amounts adjusted in revenue and cost of goods, the effective
portion of changes in fair value of cash flow hedges of ₩28,188 million, net of tax,
was recognized in accumulated other comprehensive income or loss.
(*2) In consideration of the amounts adjusted in revenue, firm commitment assets of
₩188,501 million and firm commitment liabilities of ₩30,584 million were
recognized in the consolidated statements of financial position by applying a fair
value hedge accounting.
(*3) The Group designated its long-term borrowings denominated in foreign currencies
as hedging instruments to hedge the fair value change of firm commitments.
(*4) It includes the amount classified as discontinued operations income (loss) by the
disposal of business unit and transfer to held-for-sales.
-52-

2015
Buy Sell Derivative
financial assets
(liabilities)
Gain (loss) on
valuation of
derivative financial
instruments
Accumulated other
comprehensive
income (loss) (*1)
Firm
commitment
asset
(liabilities) (*2) Currency Amount Currency Amount
Foreign currency forwards:
KRW 6,575,715 USD 5,879,087 ₩(309,899) ₩(256,150) ₩(33,337) ₩135,560
KRW 229,362 EUR 177,544 (217) 1,130 1,507 (499)
KRW 257,857 JPY 24,461,934 6,051 (7,848) (177) (3,885)
KRW 153,305 Others (1,377) (242) (1,134) 142
USD 2,307,415 KRW 2,603,838 82,276 78,393 43,787 (19,061)
EUR 415,594 KRW 557,771 (16,071) (5,301) (4,998) 5,112
JPY 29,201,574 KRW 337,724 (35,143) 2,295 (8,735) (19)
Others KRW 155,317 1,916 (749) 2,815 (132)
GBP and others EUR and others 3,037 (19,780) (7,632) (698)
Long-term borrowing denominated in foreign currencies (*3)
KRW 210,710 USD 200,000 - - - 23,690
Embedded derivatives and others(*4) (447) 39,412 - -
Put back option(see 9-(2)) (6,800) (6,955) - -
Subtotal (276,674) (175,795) (7,904) 140,210
Tax effect - - 2,096 --
Adjustments for consolidation - - 24,423 -
Total ₩(276,674) ₩(175,795) ₩18,615 ₩140,210
(*1) In consideration of the amounts adjusted in revenue, the effective portion of changes
in fair value of cash flow hedges of ₩18,615 million, net of tax, was recognized in
accumulated other comprehensive income or loss.
(*2) In consideration of the amounts adjusted in revenue, firm commitment assets of
₩185,271 million and firm commitment liabilities of ₩45,061 million were
recognized in the consolidated statements of financial position by applying a fair
value hedge accounting.
(*3) The Group designated its long-term borrowings denominated in foreign currencies
as hedging instruments to hedge the fair value change of firm commitments.
(*4) Represents amounts related to exchange rights on exchangeable bonds issued by the
Company and valuation of the share purchase contract between the Company and
the investor of redeemable convertible preferred stock issued by Doosan
Engineering & Construction Co., Ltd. (“DEC”).
(2) The Group participated in SOC projects and other infrastructure projects including
Shinbundang Line, Shinbundang extension Line, Daegu 4th beltway, Masan Sewer
Pipeline BTL, Suwon-Gwangmyeong Road, etc. as a construction investor. To invite
financial investors, the Group entered into a put option contract (₩36,600 million).
The Group classified the contract as financial derivatives and recognized the fluctuation
of option value as loss on valuation of derivatives (The year ended December 31, 2016:
₩160 million, The year ended December 31, 2015: ₩6,955 million) and derivatives
liabilities (As of December 31, 2016: nil, As of December 31, 2015: ₩6,800 million).
-53-

10. FINANCIAL INSTRUMENTS:
(1) Financial assets as of December 31, 2016 and 2015, are as follows (in millions of Korean
won):
2016
Financial assets at fair
value through
profit or loss
Loans and
receivables
AFS
financial
assets
Held-to-maturity
financial
assets
Derivatives designated
as hedging
instruments
Carrying
amount Fair value
Cash and cash equivalents ₩- ₩1,369,501 ₩- ₩- ₩- ₩1,369,501 ₩1,369,501
Short and long-term
financial instruments - 244,903 - - - 244,903 244,903
Short and long-term
investment in securities - - 421,509 6,215 - 427,724 427,724
Derivative financial assets 64,762 - - - 40,691 105,453 105,453
Trade and other
receivables - 3,539,740 - - - 3,539,740 3,539,740
Deposits - 320,258 - - - 320,258 320,258
Total ₩64,762 ₩5,474,402 ₩421,509 ₩6,215 ₩40,691 ₩6,007,579 ₩6,007,579
2015
Financial
assets at fair
value through profit or loss
Loans and receivables
AFS
financial assets
Held-to-
maturity
financial assets
Derivatives
designated
as hedging instruments
Carrying amount Fair value
Cash and cash equivalents ₩- ₩1,893,008 ₩- ₩- ₩- ₩1,893,008 ₩1,893,008
Short and long-term
financial instruments - 553,225 - - - 553,225 553,225
Short and long-term
investment in securities - - 182,511 8,350 - 190,861 190,861
Derivative financial assets 36,476 - - - 51,929 88,405 88,405
Trade and other
receivables - 4,225,543 - - - 4,225,543 4,225,543
Deposits - 253,323 - - - 253,323 253,323
Total ₩36,476 ₩6,925,099 ₩182,511 ₩8,350 ₩51,929 ₩7,204,365 ₩7,204,365
-54-

(2) Financial liabilities as of December 31, 2016 and 2015, are as follows (in millions of
Korean won):
2016,
Financial
liabilities at fair
value through profit or loss
Financial
liabilities at amortized cost
Derivatives
designated as
hedging instruments
Carrying amount Fair value
Trade and other payables ₩- ₩3,341,043 ₩- ₩3,341,043 ₩3,341,043
Borrowings and bonds - 10,392,678 - 10,392,678 10,392,678
Derivative financial
liabilities 39,702 - 263,914 303,616 303,616
Financial guarantee
liabilities - 19,997 - 19,997 19,997
Others - 572,772 - 572,772 572,772
Total ₩39,702 ₩14,326,490 ₩263,914 ₩14,630,106 ₩14,630,106
2015
Financial
liabilities at fair
value through profit or loss
Financial
liabilities at amortized cost
Derivatives
designated as
hedging instruments
Carrying amount Fair value
Trade and other payables ₩- ₩3,099,574 ₩- ₩3,099,574 ₩3,099,574
Borrowings and bonds - 12,570,556 - 12,570,556 12,570,556
Derivative financial
liabilities 36,542 - 328,537 365,079 365,079
Financial guarantee
liabilities - 22,699 - 22,699 22,699
Others - 539,716 - 539,716 539,716
Total ₩36,542 ₩16,232,545 ₩328,537 ₩16,597,624 ₩16,597,624
(3) As of December 31, 2016, the Group uses the following hierarchy for determining and
disclosing the fair value of financial instruments by valuation technique. The level of
hierarchy of fair value is as follows:
Level 1: Unadjusted quoted prices in active markets for identical assets or liabilities
Level 2: Inputs other than quoted prices that are observable for the asset or liability,
either directly or indirectly
Level 3: Inputs that are not based on observable market data (unobservable inputs)
The fair value of financial instruments traded in active markets is based on quoted market
prices at the dates of the consolidated statements of financial position. These instruments
are included in Level 1. Instruments included in level 1 primarily comprise listed equity
investments classified as trading securities or AFS securities.
-55-

The fair value of financial instruments that are not traded in an active market (for example,
over-the counter derivatives) is determined by using valuation techniques. These valuation
techniques maximize the use of observable market data where it is available and rely as
little as possible on entity-specific estimates. If all significant inputs required to fair value
an instrument are observable, the instrument is included in level 2.
If one or more of the significant inputs are not based on observable market data, the
instrument is included in level 3.
Specific valuation techniques used to value financial instruments include:
- Quoted or dealer price of similar instruments.
- The fair value of forward foreign exchange contracts determined by using forward
exchange rates at the reporting date, with the resulting value discounted to present value.
- Other financial techniques such as discounted cash flow analysis.
As for trade and other receivables, the book value approximates reasonable estimates of
fair value.
The level of fair value measurements of financial instruments as of December 31, 2016
and 2015, are as follows (in millions of Korean won):
2016
Level 1 Level 2 Level 3 Total
Financial assets measured at fair value: Financial assets at fair value through profit or loss ₩- ₩64,762 ₩- ₩64,762 AFS financial assets 90,627 341 137,314 228,282 Derivatives designated as hedging instruments - 40,692 - 40,692
Total ₩90,627 ₩105,795 ₩137,314 ₩333,736
Financial liabilities measured at fair value:
Financial liabilities at fair value through profit or loss ₩- ₩39,702 ₩- ₩39,702 Derivatives designated as hedging instruments - 263,914 - 263,914
Total ₩- ₩303,616 ₩- ₩303,616
2015
Level 1 Level 2 Level 3 Total
Financial assets measured at fair value: Financial assets at fair value through profit or loss ₩- ₩36,476 ₩- ₩36,476 AFS financial assets 2,781 - 126,385 129,166
Derivatives designated as hedging instruments - 51,929 - 51,929
Total ₩2,781 ₩88,405 ₩126,385 ₩217,571
Financial liabilities measured at fair value:
Financial liabilities at fair value through profit or loss ₩- ₩36,542 ₩- ₩36,542 Derivatives designated as hedging instruments - 328,537 - 328,537
Total ₩- ₩365,079 ₩- ₩365,079
-56-

The above tables excludes financial assets and financial liabilities which are not measured
at fair value as differences between the carrying amounts and fair values are not significant.
Assumptions used for the measurement of available-for-sale financial assets at fair value
based on level 3 valuation techniques as at December 31, 2015 are as follows (in millions
of Korean won):
Valuation techniques Discount rate Note
S-Y Expressway
Co., Ltd. and
others
Fair value as a current
exit price model
-
Current share issuance
amount
Daegu South
Circulation
Road Corporation
and others
Dividend discount
model and others
7.00%~14.00%
Expected dividend cash
flow for each financial
period and others
Korea Housing
Guarantee
Co., Ltd.
Shareholder’s
discounted cash flow
model
10.00%
Shareholder’s cash flow
Others
Net asset value
assessment and others
-
Fair value of net asset
and others
Changes in the book value of AFS financial assets that have been rated as Level 3 of fair
value hierarchy for the year ended December 31, 2016 and 2015 are as follows. There is
no transfer between levels of the fair value hierarchy for the year ended December 31,
2016 and 2015 (in millions of Korean won):
January 1
Buy
Sell
Total comprehensive income
Reclass
Net foreign
exchange
difference
Profit for the
year
Other
comprehensi
ve income
December
31
The year ended
December 31, 2016 ₩126,385 ₩10,437 ₩- ₩ (8,403) ₩2,145 ₩7,191 ₩(441)
₩137,314
January 1 Buy Sell
Profit for the
year
Other
Comprehensive
income
Net foreign
exchange
difference
Net foreign
exchange
difference
December
31
The year ended
December 31, 2015 ₩130,721 ₩7,141 ₩(11,553) ₩- ₩60 ₩- ₩16 ₩126,385
-57-
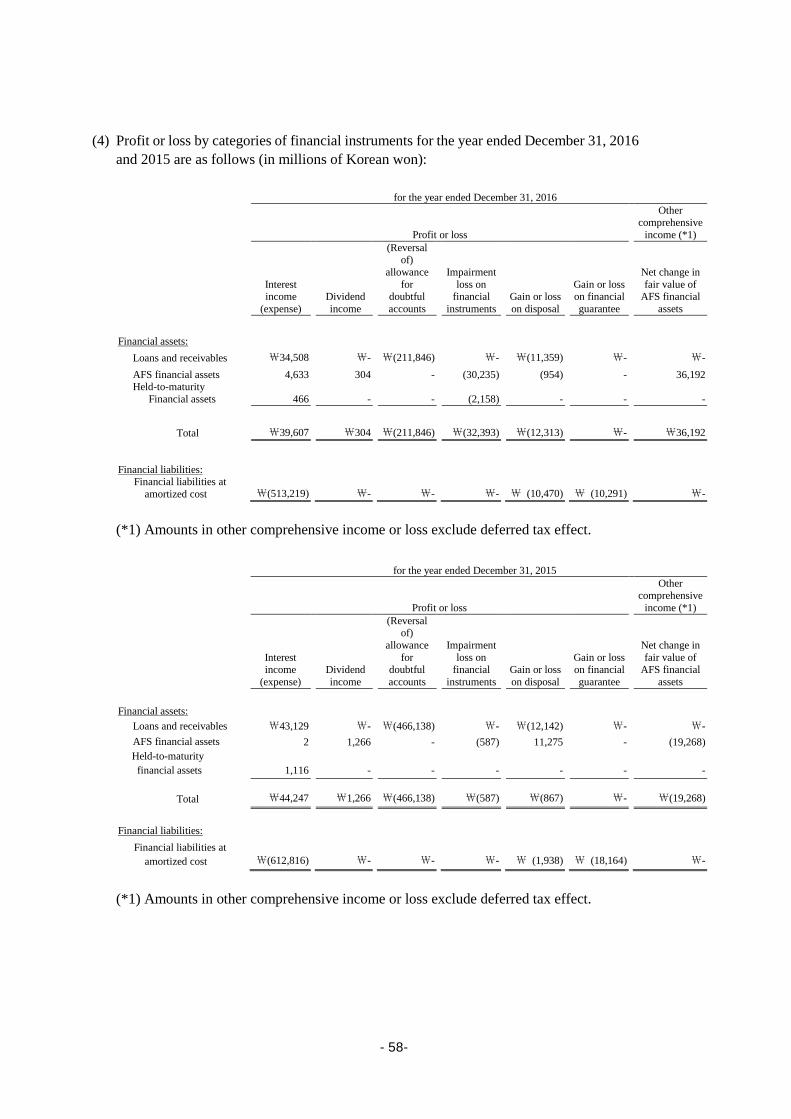
(4) Profit or loss by categories of financial instruments for the year ended December 31, 2016
and 2015 are as follows (in millions of Korean won):
for the year ended December 31, 2016
Profit or loss
Other comprehensive
income (*1)
Interest income
(expense)
Dividend
income
(Reversal of)
allowance
for doubtful
accounts
Impairment
loss on financial
instruments
Gain or loss
on disposal
Gain or loss on financial
guarantee
Net change in
fair value of AFS financial
assets
Financial assets:
Loans and receivables ₩34,508 ₩- ₩(211,846) ₩- ₩(11,359) ₩- ₩-
AFS financial assets 4,633 304 - (30,235) (954) - 36,192 Held-to-maturity
Financial assets 466 - - (2,158) - - -
Total ₩39,607 ₩304 ₩(211,846) ₩(32,393) ₩(12,313) ₩- ₩36,192
Financial liabilities: Financial liabilities at
amortized cost ₩(513,219) ₩- ₩- ₩- ₩ (10,470) ₩ (10,291) ₩-
(*1) Amounts in other comprehensive income or loss exclude deferred tax effect.
for the year ended December 31, 2015
Profit or loss
Other comprehensive
income (*1)
Interest income
(expense)
Dividend
income
(Reversal of)
allowance
for doubtful
accounts
Impairment
loss on financial
instruments
Gain or loss
on disposal
Gain or loss on financial
guarantee
Net change in
fair value of AFS financial
assets
Financial assets:
Loans and receivables ₩43,129 ₩- ₩(466,138) ₩- ₩(12,142) ₩- ₩-
AFS financial assets 2 1,266 - (587) 11,275 - (19,268)
Held-to-maturity
financial assets 1,116 - - - - - -
Total ₩44,247 ₩1,266 ₩(466,138) ₩(587) ₩(867) ₩- ₩(19,268)
Financial liabilities:
Financial liabilities at
amortized cost ₩(612,816) ₩- ₩- ₩- ₩ (1,938) ₩ (18,164) ₩-
(*1) Amounts in other comprehensive income or loss exclude deferred tax effect.
-58-

Gains or losses on translation or transaction of foreign currencies arising from foreign
currency transactions except for derivative financial instruments have been mostly
incurred from financial assets classified as loans and receivables and financial liabilities
measured at amortized cost.
Details of gains and losses on valuation and settlement of derivative financial instruments
for the year ended December 31, 2016 and 2015, are as follows (in millions of Korean
won):
2016 2015
Gain (loss) on
valuation of
derivative
financial
instruments
Gain (loss) on
settlement
of derivative
financial
instruments
Other
comprehensive
income(*1)
Gain (loss) on
valuation of
derivative
financial
instruments
Gain (loss) on
settlement
of derivative
financial
instruments
Other
comprehensive
income(*1)
Derivatives held for trading ₩17,121 ₩(6,166) ₩- ₩64,240 ₩10,599 ₩-
Fair value hedge derivatives (116,978) 5,820 - (226,071) (17,514) -
Cash flow hedge derivatives (20,985) 61,727 25,973 (8,145) 28,258 68,555
Total
₩(120,842) ₩61,381 ₩25,973 ₩(169,976) ₩21,343 ₩68,555
(*1) Other comprehensive income does not reflect corporate tax effect.
Above gains or losses on financial instruments include amounts in selling and
administrative expenses, finance income or cost and other comprehensive income or loss.
(5) Financial assets and financial liabilities subject to an enforceable master netting
arrangement or similar agreement as of December 31, 2016 are as follows (in millions of
Korean won):
Eligible for legal right to offset
Total assets
(liabilities) Offset amount Amount after offset
Derivative financial instrument assets ₩141,875 ₩(54,685) ₩87,190
Derivative financial instrument liabilities (315,692) 54,685 (261,007)
Long-term investment securities 40,000 (40,000) -
Asset-backed loans (40,000) 40,000 -
-59-

11. INVESTMENT IN JOINT VENTURES AND ASSOCIATES:
(1) Investment in joint ventures and associates as of December 31, 2016 and 2015, consists of
the following (in millions of Korean won):
Acquisition cost Book value Net assets
Country of
domicil
e
Equit
y owne
rship
(%) 2016 2015 2016 2015 2016 2015
Associates:
Tamra Offshore
Wind Power Co., Ltd. Korea 36.00 ₩ 11,880 ₩ 9,864 ₩ 9,676 ₩ 9,617 ₩ 9,676 ₩ 9,617
Dalian Samyoung Doosan Metal Product
Co., Ltd. (“DSDMP”) (*1) China 10.80
2,675 2,675 3,044 3,453 3,044 3,453
Shinbundang Railroad Co., Ltd. (*2)
Korea 29.03
50,088 62,552 14,770 26,770 14,770 26,770
Kyunggi Railroad Co.,
Ltd.(*1,2)
Korea 7.35
7,067 7,067 1,893 5,277 1,893 5,277
Neo Trans Co., Ltd. Korea 42.86 43 43 18,990 15,429 18,990 15,429
New Seoul
Railway Corporation(*2)
Korea
25.05
8,794 1,373 7,837 611 7,818 409
KIAMCO(*4) Korea 31.41 23,149 - 23,149 - 23,155 -
Subtotal 103,696 83,574 79,359 61,157 79,346 60,955
Joint ventures:
Haman Industrial Complex
(*2,3)
Korea
80.00
3,600 3,600 - - (1,073) (1,073)
Doosan PSI LLC USA 50.00 1,108 1,108 1,188 1,254 1,188 1,254
Doosan Infracore Liaoning
Machinery Sales Co., Ltd(*4)
China
43.00
355 - 134 - 270 -
Subtotal 5,063 4,708 1,322 1,254 385 181
₩ 108,759 ₩ 88,282 ₩ 80,681 62,411 ₩ 79,731 ₩ 61,136
(*1) Although the Group’s equity interest in the investee is less than 20%, the investee
is classified as an associate considering the exercise of voting rights in the board of
directors.
(*2) Investments in the investee have been provided as collateral in connection with
project financing.
(*3) Although the Group’s equity interest in the investee is more than 50%, the investee
is classified as a joint venture considering the agreement between the shareholders.
(*4) The investee is classified as an associate according to acquisition of shares in 2016.
-60-

(2) Changes in investment in joint ventures and associates for the year
ended December 31, 2016 and 2015 consist of the following (in
millions of Korean won):
2016
January 1, 2016
Acquisition (disposal)
Share of profit (loss)
Increase (decrease)
in equity
of associates Others
December 31, 2016
Associates:
Tamra Offshore Wind Power Co., Ltd ₩9,617 ₩2,016 ₩(1,947) ₩(10) ₩- ₩9,676
DSDMP 3,453 - (310) (99) - 3,044
Shinbundang Railroad Co., Ltd. 26,770 - (12,000) - - 14,770
Kyunggi Railroad Co., Ltd. 5,277 - (3,384) - - 1,893
Neo Trans Co., Ltd 15,429 - 3,561 - - 18,990
New Seoul Railroad Co., Ltd. 611 7,421 (195) - - 7,837
KIAMCO - 23,149 - - - 23,149
Subtotal ₩61,157 ₩32,586 ₩(14,275) ₩(109) ₩- ₩79,359
Joint ventures:
Haman Industrial Complex - - - - - -
Doosan PSI LLC 1,254 - (100) - 34 1,188
Doosan Infracore Liaoning Machinery
Sales Co., Ltd - 355 (233) - 12 134
Subtotal 1,254 355 (333) - 46 1,322
Total ₩62,411 ₩32,941 ₩(14,608) ₩(109) ₩46 ₩80,681
2015
January 1,
2015
Acquisition
(disposal)
Share of profit (loss)
(*1)
Increase
(decrease)
in equity of
associates Others
December
31, 2015
Associates:
Doosan Capital Co., Ltd. ₩48,902 ₩(6,613) ₩(42,389) ₩100 ₩- ₩-
Tamra Offshore Wind Power Co., Ltd 9,673 - (56) - - 9,617
Doosan (China) Financial Leasing Corp. 96,996 - (19,137) - (77,859) -
DSDMP 3,647 - (230) 36 - 3,453
Shinbundang Railroad Co., Ltd. 46,538 - (19,768) - - 26,770
Kyunggi Railroad Co., Ltd. 5,737 - (460) - - 5,277
Neo Trans Co., Ltd 13,335 - 2,094 - - 15,429
New Seoul Railroad Co., Ltd. 727 - (116) - - 611
Subtotal ₩225,555 ₩(6,613) ₩(80,062) ₩136 ₩(77,859) ₩61,157
Joint ventures:
Haman Industrial Complex 1,190 - (1,190) - - -
Doosan PSI LLC - 1,108 79 - 67 1,254
Subtotal 1,190 1,108 (1,111) - 67 1,254
Total ₩226,745 ₩(5,505) ₩(81,173) ₩136 ₩(77,792) ₩62,411
(*1) The above income on equity method investments includes loss
on disposal of investment in associates of ₩40,935 million. With
respect to changes in equity interest resulting from increase in
paid-in capital of associates, the Group recognized income on an
equity method investments of ₩509 million.
-61-

(3) The condensed financial information of the investees as of and for the year ended
December 31, 2016 and 2015 is as follows (in millions of Korean won):
2016
Total
assets
Total
liabilities
Sales
Net income
(loss)
Total
comprehensive
income (loss)
Tamra Offshore Wind Power Co., Ltd ₩128,776 ₩101,900 ₩- ₩ (5,411) ₩ (5,411)
DSDMP 45,358 17,174 14,012 (2,871) (3,787)
Shinbundang Railroad Co., Ltd. 1,003,274 952,397 83,493 (41,340) (41,340)
Kyunggi Railroad Co., Ltd 684,400 658,638 26,072 (57,780) (57,780)
Neo Trans Co., Ltd 59,064 14,755 75,890 8,311 8,311
New Seoul Railroad Co., Ltd. 46,715 15,508 - (776) (776)
KIAMCO 73,737 17 - 6 6
Haman Industrial Complex 10,016 11,357 - - -
Doosan PSI LLC 8,306 5,928 2,482 (199) (199)
Doosan Infracore Liaoning Machinery
Sales Co., Ltd
869 242 3,348 (415) (415)
2015
Total
assets
Total
liabilities
Sales
Net income
(loss)
Total
comprehensive
income (loss)
Tamra Offshore Wind Power Co., Ltd ₩90,810 ₩64,095 ₩- ₩(154) ₩(154)
DSDMP 49,609 17,637 21,986 (2,129) (1,799)
Shinbundang Railroad Co., Ltd. 1,009,219 917,002 59,663 (68,094) (68,094)
Kyunggi Railroad Co., Ltd 577,382 510,694 - (12,115) (12,115)
Neo Trans Co., Ltd 44,655 8,656 57,487 4,886 4,886
New Seoul Railroad Co., Ltd. 5,223 3,971 - (357) (357)
Haman Industrial Complex 24,866 27,416 131 (835) (835)
Doosan PSI LLC 3,860 1,353 4,855 158 158
-62-

(4) The following table provides a reconciliation of the summarized financial information of
the associates and joint ventures to the carrying amount of its interest in the associates and
joint ventures (in millions of Korean won):
2016
Adjustment amount
Company (*1)
Net asset (a)
Equity
ownership
(%) (b)
Equity
interest in
the investee
(axb) Difference
Internal
transaction Others Book value
Associates:
Tamra Offshore Wind Power Co., Ltd ₩26,876 36 ₩9,676 ₩- ₩- ₩- ₩9,676
DSDMP 28,184 10.8 3,044 - - - 3,044
Shinbundang Railroad Co., Ltd. 50,877 29.03 14,770 - - - 14,770
Kyunggi Railroad Co., Ltd. 25,762 7.35 1,893 - - - 1,893
Neo Trans Co., Ltd. 44,309 42.86 18,990 - - - 18,990
New Seoul Railway 31,207 25.05 7,818 - - 19 7,837
KIAMCO 73,720 31.41 23,155 - - (6) 23,149
Subtotal 280,935 79,346 - - 13 79,359
Joint ventures:
Doosan PSI LLC 2,387 50 1,188 - - - 1,188
Doosan Infracore Liaoning Machinery
Sales Co., Ltd
627 43 270 - (136) - 134
Subtotal 3,005 1,458 - (136) - 1,322
Total ₩283,940 ₩80,804 ₩- ₩(136) ₩13 ₩80,681
(*1) Adjustments on Haman Industrial Complex were not included as the Company
discontinued recognizing its share of further losses.
2015
Adjustment amount
Company (*1)
Net asset (a)
Equity
ownership
(%) (b)
Equity
interest in
the investee
(axb) Difference
Internal
transaction Others Book value
Associates:
Tamra Offshore Wind Power
Co., Ltd
₩26,715 36 ₩9,617 ₩- ₩- ₩- ₩9,617
DSDMP 31,972 10.80 3,453 - - - 3,453
Shinbundang Railroad Co.,
Ltd.
92,217 29.03 26,770 - - - 26,770
Kyunggi Railroad Co., Ltd. 66,689 7.91 5,277 - - - 5,277
Neo Trans Co., Ltd. 35,999 42.86 15,429 - - - 15,429
New Seoul Railway 1,252 32.65 409 202 - - 611
254,844 60,955 202 - - 61,157
Joint ventures:
Doosan PSI LLC 2,507 50.00 1,254 - - - 1,254
₩257,351 36.00 ₩62,209 ₩202 ₩- ₩- ₩62,411
(*1) The net asset value of Doosan Capital represents only the equity holders of the parent
and the equity interest in the investee was calculated by adding up the equity
ownership of preferred shares.
-63-

12. PROPERTY, PLANT AND EQUIPMENT:
(1) Changes in property, plant and equipment for the year ended December 31, 2016 and 2015
consist of the following (in millions of Korean won):
2016
Land Buildings and
structures Machinery
Tools, furniture,
fixtures and others
Construction in progress Total
As of January 1, 2016 ₩4,415,622 ₩1,426,175 ₩950,431 ₩186,002 ₩228,348 ₩7,206,578
Acquisition/ capital
expenditure
1,494 14,501 26,464 25,626 257,548 325,633
Transfer(*1) (192,754) (23,645) 128,356 5,975 (227,429) (309,497)
Disposals (32,682) (19,927) (9,039) (6,506) (3,756) (71,910)
Depreciation - (74,493) (194,101) (58,994) - (327,588)
Impairments - (5,437) (3,890) (753) - (10,080)
Business transfer(*2) (275,446) (105,550) (46,741) (9,798) (320) (437,855)
Changes in foreign currency
translation and others(*3)
3,086 6,770 5,680 (8,491) (787) 6,258
As of December 31, 2016
₩3,919,320 ₩1,218,394 ₩857,160 ₩133,061 ₩253,604 ₩6,381,539
- Acquisition cost ₩2,512,453 ₩2,117,178 ₩2,744,001 ₩682,091 ₩253,604 ₩8,309,327
- Accumulated depreciation
and impairment
(12,445) (898,784) (1,886,841) (549,030) - (3,347,100)
- Revaluation surplus 1,419,312 - - - - 1,419,312
(*1) The group reclassified a part of land, buildings and structures to investment property
which belongs to CPE business unit which is the Group’s discontinued operating
business unit.
(*2) Decreased due to disposal of HRSG business unit, Machine Tools business
unit and CPE business unit.
(*3) The amount includes the impact on acquisition of Doosan GridTech Inc, which is
newly included as subsidiary.
-64-

2015
Land
Buildings and
structures Machinery
Tools, furniture, fixtures and
others
Construction
in progress Total
As of January 1, 2015 ₩4,072,078 ₩1,613,155 ₩1,062,511 ₩228,076 ₩214,320 ₩7,190,140
Acquisition/ capital
expenditure
138,447 6,803 29,807 34,746 239,161 448,964
Transfer(*1) (120,719) (11,938) 127,831 19,862 (225,321) (210,285)
Disposals (12,982) (11,930) (11,453) (3,842) - (40,207)
Depreciation - (86,622) (208,008) (75,680) - (370,310)
Impairments (746) (73,207) (38,326) (17,336) - (129,615)
Revaluation 473,623 - - - - 473,623
Business transfer and others (129,337) (17,292) (12,434) (378) (116) (159,557)
Changes in foreign currency
translation and others(*3)
(4,742) 7,206 503 554 304 3,825
As of December 31, 2015
₩4,415,622 ₩1,426,175 ₩950,431 ₩186,002 ₩228,348 ₩7,206,578
- Acquisition cost 2,862,653 2,350,329 2,872,214 766,878 228,348 9,080,422
- Accumulated depreciation
and impairment
(1,224) (924,154) (1,921,783) (580,876) - (3,428,037)
- Revaluation surplus 1,554,193 - - - - 1,554,193
As of December 31, 2016, certain property, plant and equipment have been pledged as
collateral for borrowings (See Note 34).
(2) Capitalized borrowing costs for the years ended December 31, 2016 and 2015 are as
follows (in millions of Korean won):
2016 2015
Capitalized borrowing costs ₩7,229 ₩2,135
Interest rate of borrowing costs 3.60%~4.47% 3.88% ~ 4.49%
(3) Details of depreciation on property, plant and equipment for the years ended December
31, 2016 and 2015 are as follows (in millions of Korean won):
2016 2015
Cost of sales ₩278,032 ₩320,747
Selling and administrative expenses 22,661 28,247
Research and development costs and others 18,658 20,158
Profit for the year from discontinued operation 8,237 1,158
₩327,588 ₩370,310
-65-

(4) Revaluation of land
The Group’s land is stated as fair value, and the carrying amount of land measured using
the cost model as of December 31, 2016 and December 31, 2015 amounted to
₩2,500,008 million and ₩2,861,429 million, respectively. There are no material
differences between the fair value for the year ended December 31, 2016 and revaluation
book value for the year ended December 31, 2015.
13. INTANGIBLE ASSETS:
(1) Changes in intangible assets for the year ended December 31, 2016 and 2015 are as follows
(in millions of Korean won):
2016
Goodwill
Industrial
property rights
Development
costs
Other
intangible assets Total
As of January 1, 2016 ₩4,393,647 ₩1,158,682 ₩892,154 ₩213,291 ₩6,657,774
Acquisition/ capital
expenditure
- 4 225,633 23,141 248,778
Transfer - - (8,202) 20,276 12,074
Disposal - (4) - (1,406) (1,410)
Amortization - (17,359) (124,854) (61,859) (204,072)
Impairment - - (54,707) (3,572) (58,279)
Business transfer (91,521) (856) (11,501) (11,701) (115,579)
Changes in the scope of
consolidation
29,823 - - 6,799 36,622
Changes in foreign currency
translation
28,412 18,994 (314) 23,200 70,292
As of December 31, 2016
₩4,360,361 ₩1,159,461 ₩918,209 ₩208,169 ₩6,646,200
Acquisition cost ₩4,397,889 ₩1,332,566 ₩1,422,808 ₩576,004 ₩7,729,267
Accumulated amortization
and impairment loss
(37,528) (173,105) (504,599) (367,835) (1,083,067)
-66-

2015
Goodwill
Industrial
property rights
Development
costs
Other
intangible assets Total
₩4,558,361 ₩1,148,142 ₩898,549 ₩258,293 ₩6,863,345
As of January 1, 2015 - 2,221 236,168 15,568 253,957
Acquisition/ capital
expenditure
- 207 (7,181) 45,861 38,887
Transfer - (10) - (2,429) (2,439)
Disposal (63,179) - - - (63,179)
Amortization - (17,270) (123,613) (73,361) (214,244)
Impairment (42,112) - (121,759) (32,959) (196,830)
Changes in foreign currency
translation
(59,423) 25,392 9,990 2,318 (21,723)
As of December 31, 2015
₩4,393,647 ₩1,158,682 ₩892,154 ₩213,291 ₩6,657,774
Acquisition cost ₩4,433,884 ₩1,307,086 ₩1,575,243 ₩775,001 ₩8,091,214
Accumulated amortization
and impairment loss
(40,237) (148,404) (683,089) (561,710) (1,433,440)
The carrying amounts of intangible assets with indefinite useful lives including goodwill
and others as of December 31, 2016 and December 31, 2015 amounted to ₩5,555,413
million and ₩5,564,098 million, respectively.
(2) Research and development costs expensed as incurred for 2016 and 2015 amounted to
₩242,731 million and ₩332,123 million, respectively.
(3) Capitalized borrowing costs for the years ended December 31, 2016 and 2015 are as
follows (in millions of Korean won):
2016 2015
Capitalized borrowing costs ₩12,268 ₩9,051
Interest rate of borrowing costs 3.60% ~ 4.47% 3.88% ~ 4.49%
(4) Details of amortization of intangible assets for the years ended December 31, 2016 and
2015 are as follows (in millions of Korean won):
2016 2015
Cost of sales ₩130,479 ₩134,264
Selling and administrative expenses 72,327 79,282
Research and development costs and others 519 568
Profit from a discontinued operation 747 130
₩204,072 ₩214,244
-67-

(5) Carrying amount of goodwill allocated to each cash-generating unit (“CGU”) as at
December 31, 2016 and 2015 are as follows (in millions of Korean won):
2016 2015
Power generation ₩622,246 ₩619,106
Water 6,786 6,803
DEC 60,050 72,781
DI 3,671,279 3,694,957
₩4,360,361 ₩4,393,647
The recoverable amount of CGU is determined based on a value in use calculation, and
major assumptions used as at December 31, 2016 are as follows:
Power
generation Water DEC DI Long-term
average
growth
Rate
2.00% 2.00% 1.00% 2.00%
Discount rate 9.55% 9.55% 10.00% 8.90%~9.40%
A value in use is calculated using pre-tax cash flow projections based on financial budgets
approved by senior management covering a five-year period. The management assessed
the total profit in the budget based on past performances and market growth forecasts.
Cash flows beyond the five-year period are extrapolated using a forecast growth rates,
which do not exceed the long-term average growth rate for the industry where the CGU
operates in and which are consistent with estimations included in industry reports. The
discount rate used is risk adjusted discount rate that reflects relevant risks specific to the
related operating segment.
-68-
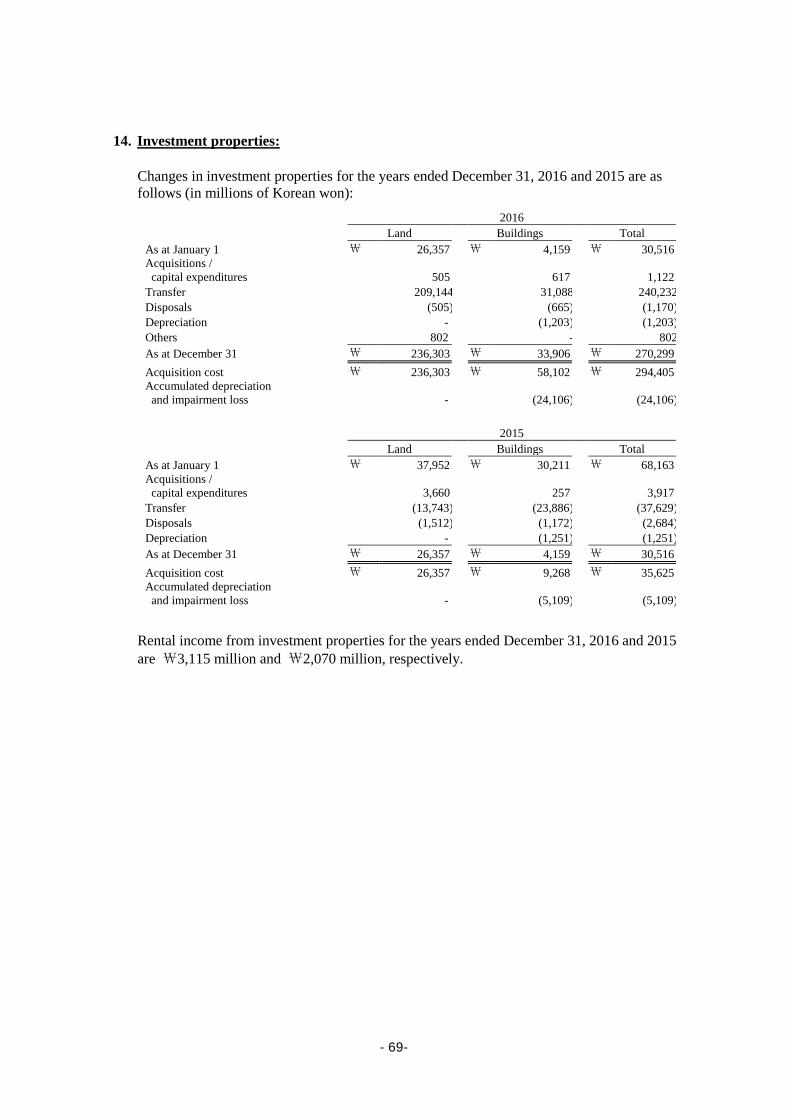
14. Investment properties:
Changes in investment properties for the years ended December 31, 2016 and 2015 are as
follows (in millions of Korean won):
2016
Land Buildings Total
As at January 1 ₩ 26,357 ₩ 4,159 ₩ 30,516
Acquisitions /
capital expenditures
505
617
1,122
Transfer 209,144 31,088 240,232
Disposals (505) (665) (1,170)
Depreciation - (1,203) (1,203)
Others 802 - 802
As at December 31 ₩ 236,303 ₩ 33,906 ₩ 270,299
Acquisition cost ₩ 236,303 ₩ 58,102 ₩ 294,405
Accumulated depreciation
and impairment loss -
(24,106)
(24,106)
2015
Land Buildings Total
As at January 1 ₩ 37,952 ₩ 30,211 ₩ 68,163
Acquisitions /
capital expenditures
3,660
257
3,917
Transfer (13,743) (23,886) (37,629)
Disposals (1,512) (1,172) (2,684)
Depreciation - (1,251) (1,251)
As at December 31 ₩ 26,357 ₩ 4,159 ₩ 30,516
Acquisition cost ₩ 26,357 ₩ 9,268 ₩ 35,625
Accumulated depreciation
and impairment loss -
(5,109)
(5,109)
Rental income from investment properties for the years ended December 31, 2016 and 2015
are ₩3,115 million and ₩2,070 million, respectively.
-69-
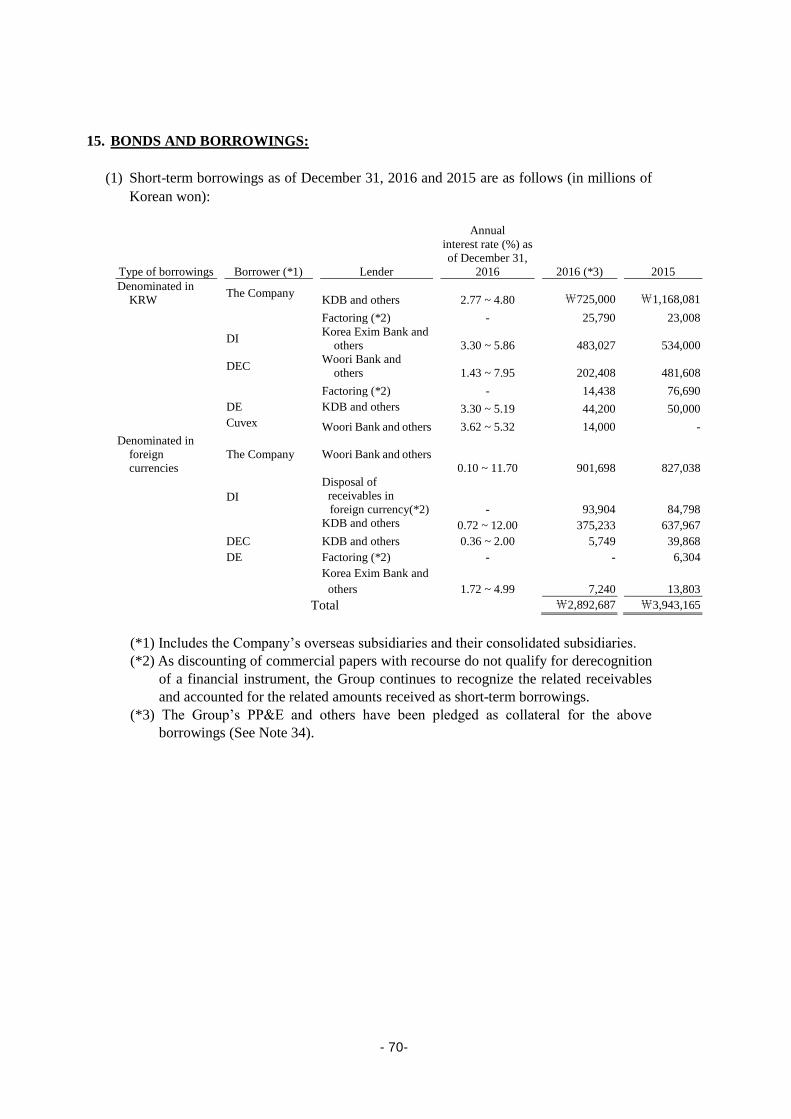
15. BONDS AND BORROWINGS:
(1) Short-term borrowings as of December 31, 2016 and 2015 are as follows (in millions of
Korean won):
Type of borrowings Borrower (*1) Lender
Annual
interest rate (%) as
of December 31,
2016 2016 (*3) 2015
Denominated in
KRW The Company
KDB and others
2.77 ~ 4.80 ₩725,000 ₩1,168,081
Factoring (*2) - 25,790 23,008
DI
Korea Exim Bank and
others
3.30 ~ 5.86 483,027 534,000
DEC
Woori Bank and
others
1.43 ~ 7.95 202,408 481,608
Factoring (*2) - 14,438 76,690
DE KDB and others 3.30 ~ 5.19 44,200 50,000
Cuvex Woori Bank and others 3.62 ~ 5.32 14,000 -
Denominated in
foreign
currencies
The Company
Woori Bank and others 0.10 ~ 11.70
901,698
827,038
DI
Disposal of
receivables in
foreign currency(*2)
-
93,904
84,798
KDB and others 0.72 ~ 12.00 375,233 637,967
DEC KDB and others 0.36 ~ 2.00 5,749 39,868
DE Factoring (*2) - - 6,304
Korea Exim Bank and
others
1.72 ~ 4.99
7,240
13,803
Total ₩2,892,687 ₩3,943,165
(*1) Includes the Company’s overseas subsidiaries and their consolidated subsidiaries.
(*2) As discounting of commercial papers with recourse do not qualify for derecognition
of a financial instrument, the Group continues to recognize the related receivables
and accounted for the related amounts received as short-term borrowings.
(*3) The Group’s PP&E and others have been pledged as collateral for the above
borrowings (See Note 34).
-70-

(2) Details of bonds as of December 31, 2016 and 2015 are as follows (in millions of Korean
won):
Annual
Interest rate (%) 2016 2015
Public subscription bonds 2.38 ~ 5.27 ₩1,802,434 ₩2,532,788
Private subscription bonds (*1) 1.77 ~ 5.50 405,000 340,000
Exchangeable bonds - - 115,656
Convertible bonds (See Note 15-(3)) 3.20 ~ 4.00 152,630 311,112
Bonds with stock warrants
(See Note 15-(4))
3.00
143,423 -
Bonds denominated in foreign
currencies (*2) 2.13 ~ 3.80
737,185 585,999
Subtotal ₩3,240,672 ₩3,885,555
Less: Current portion of long-term bonds (1,462,253) (1,321,578)
Less: Discount on bonds (24,728) (15,993)
Long-term bonds ₩1,753,691 ₩2,547,984
(*1) The Group's PP&E and others have been pledged as collateral for the private
subscription bonds (See Note 34).
(*2) The bonds denominated in foreign currencies are guaranteed by Korea Exim Bank
(See Note 33).
(3) Convertible bonds issued by DEC as of December 31, 2016 are summarized as follows:
Convertible bonds issued in 2014
Issue date Maturity Date Coupon rate YTM Exercise year
Conversion price Issuance value Book value
September 4, 2014 September 4, 2017 4.00% 7.50%
From 1 month after date
of issue to 1 month
before maturity
₩8,190/share ₩190,798 million ₩14,547 million
1) Early redemption
The early redemption right is exercisable as a whole or in part against the par value of
convertible bonds at the interest payment date in 1.5 years and 2.5 years after the date
of issuance of bonds.
2) Redemption at maturity
The coupon rate for the bond is 4.0%. For bonds not converted until maturity,
111.6534% of the principal amount will be paid on September 4, 2017 with a yield to
maturity rate of 7.5%, compounded quarterly.
3) Calculation of conversion price
The conversion price is adjusted when there is an increase in paid-in capital through
issuance of shares at a price lower than the market price, stock dividends, or
capitalization of reserves, before exercising the conversion rights, or when there is an
issuance of stock purchase warrants or debt securities with warrants.
-71-

Convertible bonds issued in 2015
Issue date Maturity Date Coupon rate YTM Exercise year
Conversion price Issuance value Book value
June 11, 2015 June 11, 2018 3.20% 6.50%
From 1 month after date
of issue to 1 month
before maturity
₩6,000/share ₩143,560 million ₩141,559 million
1) Early redemption
The early redemption right is exercisable as a whole or in part against the par value of
convertible bonds at the interest payment date in 2 years and 2.5 years after the date of
issuance of bonds.
2) Redemption at maturity
The coupon rate for the bond is 3.2%. For bonds not converted until maturity,
110.8345% of the principal amount will be paid on Jun. 11, 2018 with a yield to
maturity rate of 6.5% compounded quarterly.
3) Calculation of conversion price
The conversion price is adjusted when there is an increase in paid-in capital through
issuance of shares at a price lower than the market price, stock dividends, or
capitalization of reserves, before exercising the conversion rights, or when there is an
issuance of stock purchase warrants or debt securities with warrants.
Changes in the carrying amount of convertible bonds for the year ended December 31,
2016 are as follows (in millions of Korean won):
January 1 Issuance
Exercise /
amortization December 31
Convertible bonds ₩311,112 ₩(156,976) ₩(1,506) ₩152,630
Redemption premium 35,105 (18,293) (164) 16,648
Discount on bond (9,612) 3,865 2,573 (3,174)
Exchange rights adjustment (28,370) 10,492 7,880 (9,998)
Book value 308,235 (160,912) 8,783 156,106
Consideration for conversion rights
(other capital surplus) 4,163 (1,022) (30) 3,111
As of December 31, 2016, 14.74% of the 84th convertible bonds and 7.27% of the 85th
convertible bonds were converted. 2,896,156 shares and 1,545,853 shares were
respectively issued by exercising exchange rights of convertible bonds.
-72-

(4) As of December 31, 2016, bonds with stock warrants issued by DEC are summarized as
follows (in millions of Korean won):
Issue date Maturity Date Coupon rate YTM Exercise year Exercise
price Issuance value
Book value
June 24, 2016 June 24, 2019 3.00% 6.00%
From 1 month after date
of issue to 1 month
before maturity
₩3,615/share ₩143,019 million ₩134,390million
1) Early redemption
The early redemption right is exercisable as a whole or in part against the par value of
bonds with stock warrants at the interest payment date in 2 years and 2.5 years after the
date of issuance of bonds.
2) Redemption at maturity
The coupon rate for the bond is 3%. For bonds not converted until maturity, 109.7809%
of the principal amount will be paid on June 24, 2019 with a yield to maturity rate of
6.0% compounded quarterly.
3) Calculation of exercise price
The exercise price is adjusted when there is an increase in paid-in capital through
issuance of shares at a price lower than the market price, stock dividends, or
capitalization of reserves, before exercising the stock warrants, or when there is an
issuance of stock purchase warrants or debt securities with warrants.
Changes in the carrying amount of bonds with stock warrants for the year ended
December 31, 2016 are as follows (in millions of Korean won):
January 1 Issuance
Exercise /
amortization December 31
Bond with stock warrants ₩- ₩150,000 ₩(6,577) ₩143,423
Redemption premium - 14,671 (661) 14,010
Discount on bond - (6,981) 1,462 (5,519)
Exchange rights adjustment - (22,165) 4,641 (17,524)
Book value - 135,525 (1,135) 134,390
Consideration for stock warrants
rights (other capital surplus) - 5,845 (263) 5,582
-73-

(5) Long-term borrowings as of December 31,2016 and 2015 are as follows (in millions of
Korean won):
Type of borrowings Borrower (*1) Lender
Annual
interest rate (%)as
of December
31,2016
December
31,2016 (*2)
December 31,
2015
Denominated in KRW The Company KDB and others 3.00 ~ 5.02 ₩1,075,903 ₩787,801
DI KDB and others 3.90 ~ 4.98 55,000 300,667
DEC Doosan E&C 2nd Co.,
Ltd.(*2)
6.46, CD+4.73
82,000 102,412
DE KDB and others 3.48 ~ 4.42 75,000 75,000
Denominated in
foreign
currencies
The Company National Bank of
Abu Dhabi and others
2.43 ~10.30
385,912 414,211
DI JP Morgan and 3 others 0.23 ~ 8.00 1,958,087 2,548,131
Subtotal 3,631,903 4,228,222
Less: Current portion of long-term borrowings (1,075,461) (916,961)
Discount on long-term borrowings (21,451) (28,971)
Total
₩2,534,991 ₩3,282,290
(*1) Includes the Company’s overseas subsidiaries and their consolidated subsidiaries.
(*2) The Group’s PP&E and others have been pledged as collateral for the above
borrowings (See Note 34).
(6) Asset-backed securities of the Company and DEC are as follows (in millions of Korean
won):
Company
Lender
Maturity
Discount rate
(%) Amount(*1)
The Company Korea Development Bank and others
2017.03.16~2018.
12.16 3.87 ₩92,000
Korea Development Bank and others
2017.01.27~2018.
04.27 4.21 135,000
Korea Development Bank 2018.06.20 3.29 40,000
Woori Bank 2018.06.20 4.33 30,000
The Korean Teachers' Credit Union
and others
2018.06.20 5.50 50,000
Shinyoung securities 2018.06.20 5.50 30,000
DEC Shinyoung securities and others 2017.03.23 7.30 93,200
Shinyoung securities and others 2017.01.06 7.30 60,000
Shinyoung securities and others 2017.01.24 7.30 76,600
Korea asset securities and others 2017.02.10 7.30 45,000
Korea Development Bank 2017.09.15 8.59 20,500
Meritz Securities Co.,Ltd and others 2017.03.31 5.50 12,000
Subtotal ₩684,300
Less: Current portion of asset-backed securities (435,650)
Discount on asset-backed securities (1,675)
Total ₩246,975
(*1) The Group’s PP&E and others have been pledged as collateral for the above asset-
backed securities (See Note 34).
-74-

16. RETIREMENT BENEFIT OBLIGATION:
The Group operates a defined benefit plan, and the cost of providing benefit under the defined
benefit plan is determined using the projected unit credit method on actuarial valuation of the
present value of its defined benefit obligations.
(1) Details of retirement benefit obligation as of December 31, 2016 and 2015 are as follows
(in millions of Korean won):
2016, 2015
Present value of defined benefit obligation ₩2,372,555 ₩2,318,673
Fair value of plan assets (*1) (1,506,150) (1,418,480)
Total ₩866,405 ₩900,193
(*1) Include employer contributions of ₩1,470 million and ₩1,696 million to the
National Pension Service as of December 31, 2016 and 2015, respectively.
(2) Expenses recognized in statements of income for the year ended December 31, 2016 and
2015 are as follows (in millions of Korean won):
2016 2015
Current service cost ₩91,571 ₩107,537
Net interest cost 34,466 38,415
Effect of curtailment and settlement (756) 214
Total ₩125,281 ₩146,166
(3) Classification of expenses related to the employee benefit liability for the years ended
December 31, 2016 and 2015 are as follows (in millions of Korean won):
2016 2015
Cost of sales ₩70,841 ₩67,477
Selling and administrative expenses 39,135 45,585
Research and development costs 10,117 13,775
Profit(loss) from discontinued operations 5,188 19,329
₩125,281 ₩146,166
-75-

(4) Changes in the present value of the defined benefit obligations for the years ended
December 31, 2016 and 2015 are as follows (in millions of Korean won): 2016 2015
As at January 1 ₩2,318,673 ₩2,418,728
Current service costs 91,571 107,537
Transfer from related parties 2,169 4,249
Transfer to related parties (5,204) (7,431)
Interests 77,712 84,667
Remeasurement gain (loss) in OCI:
Actuarial changes arising from
changes in demographic assumptions (2,529)
(43,318) Actuarial changes arising from changes
in financial assumptions 216,431
(71,019)
Others (13,999) 26,160
Effect of curtailment and settlement (2,137) (8,895)
Contributions by plan participants 2,623 2,611
Benefits paid (110,957) (253,398)
Others (201,798) 58,782
As at December 31 ₩2,372,555 ₩2,318,673
(5) Changes in the fair value of plan assets for the years ended December 31, 2016 and 2015
are as follows (in millions of Korean won): 2016 2015
As at January 1 ₩1,418,480 ₩1,398,119
Expected return on plan assets 43,246 46,252
Transfer from related parties 1,210 2,007
Transfer to related parties (3,570) (2,972)
Remeasurement gain (loss) in OCI 114,808 (50,998)
Contributions by plan participants 2,496 2,486
Contributions by employer 180,479 162,529
Benefits paid (99,538) (162,830)
Effect of curtailment and settlement (1,381) (7,117)
Others (150,080) 31,004
As at December 31 ₩1,506,150 ₩1,418,480
In relation to the defined benefit plans, the reasonable estimates of future employer
contributions during the year 2017 amounts to ₩129,592 million. In addition, the actual
return on plan assets for the years ended December 31, 2016 and 2015 amounts to
₩158,054 million and ₩(-)4,746 million, respectively.
(6) The principal assumptions used in determining employee benefit liability as at December
31, 2016 and 2015 are as follows: 2016 2015
Discount rate 1.30% ~ 7.72% 2.60% ~ 7.73%
Future salary increase rate 2.00% ~ 8.00% 2.00% ~ 8.00%
-76-

(7) Components of plan assets as at December 31, 2016 and 2015 are as follows (in millions
of Korean won): 2016 2015
Equity investments ₩440,389 ₩561,525
Korean government bonds 534,345 418,631
Trust assets and others 531,416 438,324
₩1,506,150 ₩1,418,480
The majority of the employee benefit plan consists of quoted securities in active markets.
(8) Details of a sensitively analysis on the defined benefit obligation for changes in the
significant assumptions as at December 31, 2016 are as follows (in millions of Korean
won): Amount Ratio
Discount rate:
1% increase ₩(260,925) (11.00%)
1% decrease 327,566 13.81%
Future salary increases:
1% increase 49,477 2.09%
1% decrease (44,668) (1.88%)
(9) The maturity profile of the defined benefit obligation as at December 31, 2016 is as follows
(in millions of Korean won):
Within the next
12 months
Between 1 and
2 years
Between 2 and
5 years
Between 5 and
10 years Total
Amounts ₩130,556 ₩187,352 ₩447,150 ₩755,283 ₩1,520,341
(10) With regard to the defined contribution pension plans, the Group recognized expenses of
₩19,471 million (2015: ₩17,696 million)
-77-

17. PROVISIONS :
Changes in significant provisions for the years ended December 31, 2016 and 2015 are as
follows (in millions of Korean won):
2016
January 1
Arising during
the year
Unused amounts
reversed Utilized Others (*1) December 31 Current Non-current
Construction
warranties ₩372,581 ₩109,786 ₩(36,055) ₩(81,125) ₩(24,900) ₩340,287 ₩(116,200) ₩224,087
Returned goods 2,079 1,140 - (858) - 2,361 (2,361) -
₩374,660 ₩110,926 ₩(36,055) ₩(81,983) ₩(24,900) ₩342,648 ₩(118,561) ₩224,087
(*1) Includes gain or loss arising from changes in foreign exchange rates.
2015
January 1
Arising during
the year
Unused amounts
reversed Utilized Others (*1) December 31 Current Non-current
Construction
warranties ₩373,775 ₩101,275 ₩(71,916) ₩(37,368) ₩6,815 ₩372,581 ₩(128,339) ₩244,242
Returned goods 1,197 1,513 (261) (370) - 2,079 (2,079) -
₩374,972 ₩102,788 ₩(72,177) ₩(37,738) ₩6,815 ₩374,660 ₩(130,418) ₩244,242
(*1) Includes gain or loss arising from changes in foreign exchange rates.
The Group estimates expenses required to settle the Group’s obligations on product
warranties, refunds, maintenance and others based on the level of warranty period, historical
experience and other considerations.
18. ISSUED CAPITAL:
The Group is authorized to issue 400,000,000 shares, with a par value of ₩5,000 per share
and the number of ordinary stock issued as of December 31, 2016 and 2015 is 106,158,256.
The number of redeemable convertible preferred stock (RCPS) issued as of December 31,
2016 and 2015 is 13,203,540. The number of shares with limited voting rights under the
Korean Commercial Code as of December 31, 2016 and 2015 as of December 31, 2016 and
2015 is nil and 7,312,505, respectively.
Changes in share capital and share premium for the years ended December 31, 2016 and
2015, are as follows (in millions of Korean won and number of shares):
On December 6, 2014, the Group issued RCPS under the resolution of the Board of
Directors on November 25, 2014 and the details are as follows:
Number of shares Share capital Share premium
Common
shares
Preferred
shares(*1)
Common
shares
Preferred
shares(*1) Total
Common
shares
Preferred
shares(*1) Total
Balance at December 31, 2015 106,158,256 13,203,540 ₩530,791 ₩66,018 ₩596,809 ₩73,011 ₩306,662 ₩379,673
Balance at December 31, 2016 106,158,256 13,203,540 ₩530,791 ₩66,018 ₩596,809 ₩73,011
₩306,662 ₩379,673
-78-
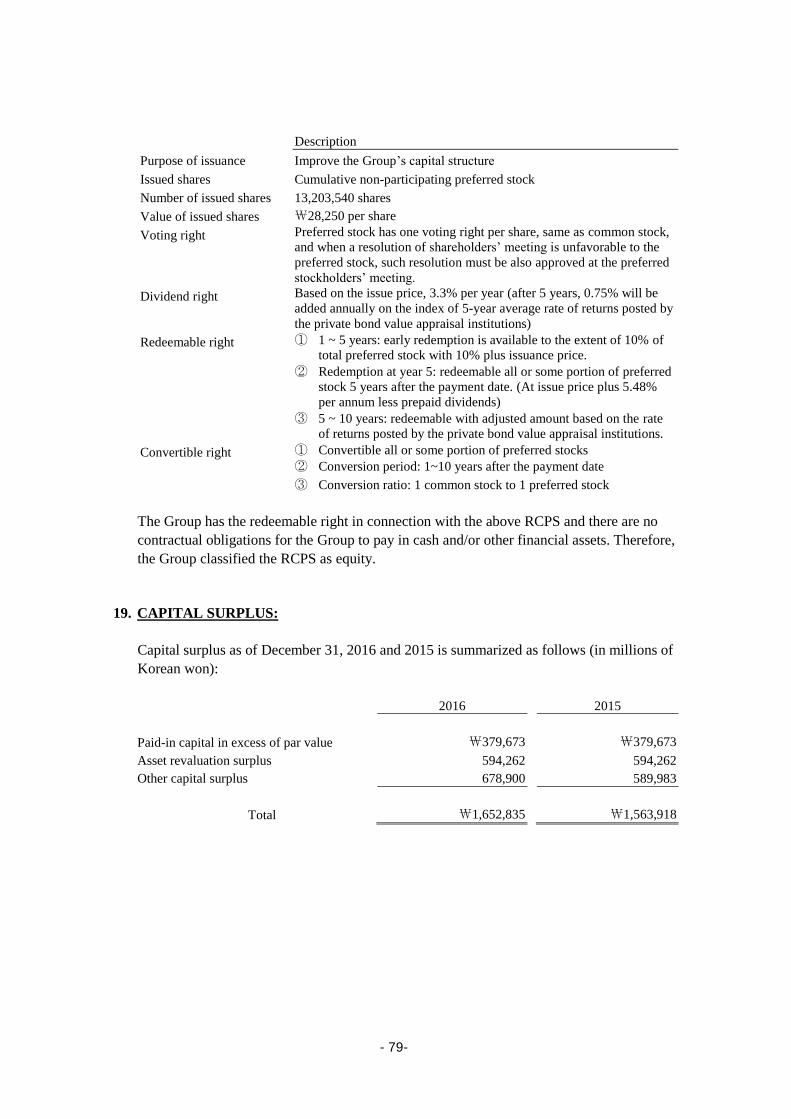
Description
Purpose of issuance Improve the Group’s capital structure
Issued shares Cumulative non-participating preferred stock
Number of issued shares 13,203,540 shares
Value of issued shares ₩28,250 per share
Voting right Preferred stock has one voting right per share, same as common stock,
and when a resolution of shareholders’ meeting is unfavorable to the
preferred stock, such resolution must be also approved at the preferred
stockholders’ meeting.
Dividend right Based on the issue price, 3.3% per year (after 5 years, 0.75% will be
added annually on the index of 5-year average rate of returns posted by
the private bond value appraisal institutions)
Redeemable right ① 1 ~ 5 years: early redemption is available to the extent of 10% of
total preferred stock with 10% plus issuance price.
② Redemption at year 5: redeemable all or some portion of preferred
stock 5 years after the payment date. (At issue price plus 5.48%
per annum less prepaid dividends)
③ 5 ~ 10 years: redeemable with adjusted amount based on the rate
of returns posted by the private bond value appraisal institutions.
Convertible right ① Convertible all or some portion of preferred stocks
② Conversion period: 1~10 years after the payment date
③ Conversion ratio: 1 common stock to 1 preferred stock
The Group has the redeemable right in connection with the above RCPS and there are no
contractual obligations for the Group to pay in cash and/or other financial assets. Therefore,
the Group classified the RCPS as equity.
19. CAPITAL SURPLUS:
Capital surplus as of December 31, 2016 and 2015 is summarized as follows (in millions of
Korean won):
2016 2015
Paid-in capital in excess of par value ₩379,673 ₩379,673
Asset revaluation surplus 594,262 594,262
Other capital surplus 678,900 589,983
Total ₩1,652,835 ₩1,563,918
-79-

20. OTHER COMPONENTS OF EQUITY:
(1) Other components of equity as of December 31, 2016 and 2015 are summarized as
follows (in millions of Korean won):
2016 2015
Treasury stock ₩(85,640) ₩(175,901)
Stock options 10,297 11,988
Others 58,070 58,756
Total ₩(17,273) ₩(105,157)
(2) Treasury stocks as at December 31, 2016 and 2015 are as follows (in millions of
Korean won, number of shares):
2016 2015
Number of
shares Amount Number of
shares Amount
Ordinary stock
-
₩-
7,312,505
₩90,261
Preferred stock
3,025,532
85,640
3,025,532
85,640
3,025,532
₩85,640
10,338,037
₩175,901
(3) The Company has granted stock options to its executives. The settlement method for
stock options includes issuance of new shares, issuance of treasury shares or cash
settlement. The type of settlement method chosen is determined based on the Board of
Directors' decision at the time of exercise. These stock options require a vesting
condition of a two year continuous employment from the grant date.
1) The terms and conditions of stock options granted as at December 31, 2016 are
summarized as follows (Korean won in units, shares in units):
Grant date
Number of
shares to be
issued Exercise period Exercise price
Estimated
fair value as of
the grant date
2007.03.16 6,800 2010.03.17 ~ 2017.03.16 ₩50,200 ₩22,564
2008.03.21 13,400 2011.03.21 ~ 2018.03.20 121,200 49,565
2009.03.27 10,900 2012.03.27 ~ 2019.03.26 73,000 32,595
2010.03.26 26,800 2013.03.26 ~ 2020.03.25 90,100 41,077
2011.03.25 50,500 2014.03.25 ~ 2021.03.24 65,700 24,642
2012.03.30 114,800 2015.03.30 ~ 2022.03.29 66,800 16,337
2013.03.29 201,000 2016.03.29 ~ 2023.03.28 44,900 10,860
2014.03.28 342,300 2017.03.28 ~ 2024.03.27 34,550 7,948
766,500
-80-

2) Change in the stock options for the year ended December 31, 2016 is summarized
as follows (in millions of Korean won, shares in units):
Number of shares to be issued
Grant
date
January 1
Newly granted
Retired
December 31
2006.02.27 2,600 - (2,600) -
2007.03.16 8,600 - (1,800) 6,800
2008.03.21 17,400 - (4,000) 13,400
2009.03.27 13,200 - (2,300) 10,900
2010.03.26 29,600 - (2,800) 26,800
2011.03.25 59,900 - (9,400) 50,500
2012.03.30 143,200 - (28,400) 114,800
2013.03.29 279,900 - (78,900) 201,000
2014.03.28 342,300 - - 342,300
896,700 - (130,200) 766,500
Valuation
Grant date January 1 Newly granted Retired December 31
2006.02.27 ₩33 ₩- ₩(33) ₩-
2007.03.16 194 - (41) 153
2008.03.21 863 - (198) 665
2009.03.27 430 - (75) 355
2010.03.26 1,216 - (115) 1,101
2011.03.25 1,477 - (232) 1,245
2012.03.30 2,339 - (464) 1,875
2013.03.29 3,040 - (857) 2,183
2014.03.28 2,396 324 - 2,720
₩11,988 ₩324 ₩(2,015) ₩10,297
The Company’s weighted average share prices at the exercise date for the years ended
December 31, 2016 and 2015 are ₩23,568 and ₩24,195, respectively. The
Company’s weighted average expected durations of share based payment for December
31, 2016 and 2015 are 0.15 years and 0.8 years, respectively.
Compensation expenses associated with stock options for the years ended December 31,
2016 and 2015 are ₩324 million and ₩985 million, respectively, and no
compensation expenses are expected to be recognized in the future periods.
-81-

3) The estimated fair value was calculated using the modified fair value method and
assumptions applied to this method are summarized as follows:
Grant date
Risk free rate
(*1)
Expected
exercise period
Expected
volatility
Expected
dividend
yield
2006.02.27 5.01% 3 years 53.87% 1.69%
2007.03.16 4.79% 3 years 49.33% 5.67%
2008.03.21 5.25% 3 years 56.02% 7.33%
2009.03.27 3.71% 3 years 65.15% 9.00%
2010.03.26 3.82% 3 years 66.45% 10.00%
2011.03.25 3.66% 3 years 53.12% 10.00%
2012.03.30 3.57% 3 years 38.21% 13.33%
2013.03.29 2.45% 3 years 35.98% 15.00%
2014.03.28 2.88% 3 years 34.72% 15.00%
(*1) Based on a three-year Treasury bond yield rate.
21. ACCUMULATED OTHER COMPREHENSIVE INCOME:
(1) Accumulated other comprehensive income as of December 31, 2016 and 2015 is
summarized as follows (in millions of Korean won):
2016 2015
Loss on valuation of AFS securities ₩(15,386) ₩(30,544)
Gain (loss) on valuation of derivative financial
instruments 26,569 18,615
Change in equity of equity method investments 1,285 1,337
Gain on revaluation of land 977,800 1,014,673
Loss on translation of foreign operations (451,486) (492,069)
Total ₩538,782 ₩512,012
-82-
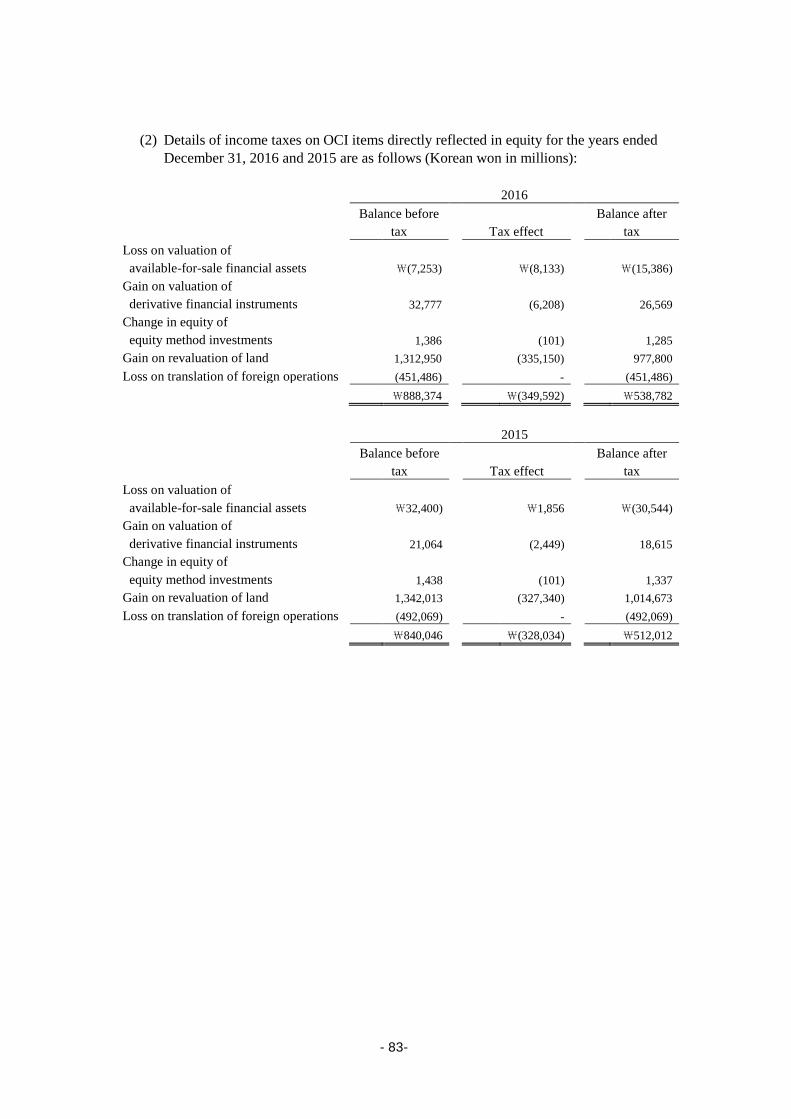
(2) Details of income taxes on OCI items directly reflected in equity for the years ended
December 31, 2016 and 2015 are as follows (Korean won in millions):
2016
Balance before
tax Tax effect
Balance after
tax
Loss on valuation of
available-for-sale financial assets ₩(7,253)
₩(8,133)
₩(15,386)
Gain on valuation of
derivative financial instruments 32,777
(6,208)
26,569
Change in equity of
equity method investments 1,386 (101)
1,285
Gain on revaluation of land 1,312,950 (335,150) 977,800
Loss on translation of foreign operations (451,486) - (451,486)
₩888,374 ₩(349,592) ₩538,782
2015
Balance before
tax Tax effect
Balance after
tax
Loss on valuation of
available-for-sale financial assets ₩32,400)
₩1,856
₩(30,544)
Gain on valuation of
derivative financial instruments 21,064
(2,449)
18,615
Change in equity of
equity method investments 1,438 (101)
1,337
Gain on revaluation of land 1,342,013 (327,340) 1,014,673
Loss on translation of foreign operations (492,069) - (492,069)
₩840,046 ₩(328,034) ₩512,012
-83-

22. RETAINED EARNINGS:
(1) Retained earnings as of December 31, 2016 and 2015 are as follows (in millions of Korean
won):
2016 2015
Legal reserve ₩127,568 ₩117,868
Voluntary reserve 776,561 1,079,588
Unappropriated retained earnings (199,621) (184,368)
Total ₩704,508 ₩1,013,088
(2) Details of dividends for the years ended December 31, 2016 and 2015 are as follows:
2016 2015 (*1)
Common
stock
Preferred
stock
Common
stock
Preferred
stock (*2)
Number of shares 106,158,256
shares
13,203,540
shares
98,845,751
shares
13,203,540
shares
Par value per share
(Korean won in units) ₩5,000
₩5,000
₩5,000
₩5,000
Par value dividend rate 11.00% 18.60% 17.00% 18.60%
Dividends per share
(Korean won in units) ₩550.00
₩932.25
₩850.00
₩932.25
Dividends
(Korean won in millions) ₩58,387
₩12,309
₩84,019
₩12,309
(*1) Represents the amount proposed prior to the date of approval of issuance of
financial statements, but not recognized as appropriations of retained earnings on
the financial statements as at the reporting date.
The Company paid dividends for the year ended December 31, 2015 in April 2016, and
dividends for the year ended December 31, 2016 are expected to be paid in April 2017.
(3) Pay-out ratio and dividend yield ratio for the years ended December 31, 2016 and 2015
are as follows:
2016 2015
Common
stock
Preferred
stock
Common
stock
Preferred
stock
Pay-out ratio
Dividends / Profit for
the year attributable
to the equity holders
of the parent
(*1)
(*1)
(*1)
(*1)
Dividend
yield ratio
Dividends per share /
Share price at the
reporting date
2.02%
(*2) 4.13%
(*2)
(*1) The Group did not calculate the pay-out ratio for 2016 and 2015 as the Group recorded
loss for the year.
(*2) The Group did not calculate the dividend yield ratio for 2016 and 2015 as the fair value
of the preferred stock is not exist.
-84-

23. OTHER NON-CONTROLLING INTERESTS:
(1) Details of hybrid instruments issued by DI classified as equity as of December 31, 2016
are as follows:
Description
Issue date Issue date October 5, 2012
Issue price USD 500,000,000
Maturity 30 years and automatic revolving
Dividend
Amount: 3.25% at par value, resets every 5 years, and 5% and 2% will
be added after 5 and 7 years, respectively, according to a “Step up”
clause.
Payment: semi-annually in arrears, optional deferral of distributions is
available.
Others
DI can exercise a call option on the instrument 5 years after the issue
date and every dividend payment date afterwards.
Investors can exercise a put option on the instrument to Core Partners
Limited, an SPE, if DI does not exercise its call option.
If investors exercise their put option and Core Partners Limited, an SPE, acquires the
instruments after 5 years since the issue date, the SPE has a right to put the instruments
back to DI (the “Stock Exchange Right”) under which the SPE can exchange a unit of
the instrument with a par value of $15.4 for one share of DI’s common stock. The hybrid
instruments are classified as equity as of December 31, 2016 as they do not contain a
contractual obligation for DI to settle in cash and the Stock Exchange Right confers a
right to receive a fixed number of DI’s common stock at the issue date.
Details of hybrid instruments issued by DPS.S.A classified as equity as of December 31,
2016 are as follows:
Description
Issue date December, 3, 2015
Issue price USD 300,000,000
Maturity 30 years and automatic revolving
Dividend
Amount: 2.50% at par value, resets once after 3 years, and 1.3% will
be added after 3 years, according to a “Step up” clause.
Payment: semi-annually in arrears, optional deferral of distributions
is available.
Others
DPS.S.A can exercise a call option on the instrument 3 years after the
issue date
The guarantee financial institution, Korea Exim Bank has to retain all
of the hybrid instruments owned by investors, if DPS.S.A does not
exercise its call option.
-85-

If Korea Exim Bank gets to retain the hybrid instruments as the investors exercise the
non-call put rights after 3 years, Korea Exim Bank is awarded exchange rights, which
allow an exchange of the hybrid instruments with equity shares of the Company. Korea
Exim Bank, when it elects to exercise the exchange rights, is entitled to either i) an
exchange of par value of USD 19.1 on the hybrid instrument with one share of common
stock, or ii) a cash settlement at the issue price of USD 300 million, at the Company’s
decision. In this regard, the Company has provided as collateral 75,509,366 shares of DI
stock and 29,650,000 shares of DE stock to Korea Exim Bank. The Company assessed
that the hybrid instruments are equity securities as the instruments are exchangeable with
the Company’s equity securities or settled in cash at the Company’s decision when the
exchange rights are exercised by Korea Exim Bank.
(2) Details of redeemable convertible preferred stock issued by DEC are as follows:
Description
Issue date December 16, 2013
Purpose of issuance To obtain liquidity and to improve the financial structure
Issued shares Cumulative non-participating preferred stock
Number of issued shares 22,727,272 shares
Value of issued shares ₩17,600 per share
Voting right
No voting right is awarded. However, in the case where no dividend for
preferred stock is declared at the shareholders’ meeting, the preferred
shareholders are awarded one voting right per share from the next
shareholders’ meeting up to the shareholders’ meeting where dividend
payment for preferred stock is declared.
Dividend rate Based on the issue price, 6.5% per year
Redemption right
Redemption: On December 16, 2016, if there is profit available for dividends,
DEC can redeem all or some portion of preferred stock.
Early redemption: On December 16, 2015, if there is profit available for
dividends, DEC can redeem all or some portion of preferred stock (limited to
30% of total issued amount).
Conversion right
Conversion right: Both preferred stockholders and DEC hold conversion
rights. However, only preferred stockholders may exercise early conversion
rights.
Conversion period: From March 16, 2017 to March 15, 2018
Early conversion: Preferred stockholders can convert on December 16, 2015
and 2 business days prior to such date
Conversion ratio: 1 common stock per 1 preferred stock
The Group has the redemption rights in connection with the above redeemable
convertible preferred stock. As the Group has no contractual obligation to settle in cash
or other financial assets, the redeemable convertible preferred stock is classified as equity
securities. In the year ended December 31, 2016, the Company purchased whole amount
of convertible preferred stock. It doesn’t not appear in non-controlling interest, as netting.
-86-

24. SEGMENT INFORMATION:
(1) The reportable business segments of the Group and major products and services by
segments are as follows:
Business segment Main products and services
Power generation NSSS, BOP, turbine and others
Water Seawater desalination plants and water treatment systems
Industrial plants Container handling cranes, national defense service and others
Castings & forgings
Power generation components, shipbuilding components, iron & steel
making components, mold & tool steel and petrochemical & industrial
components
Construction Plant, civil engineering, architecture
Wholesale and retail Purchasing agent service
DI
Internal combustion engines, and various construction machinery,
transport equipment and others
DE
Marine engines, internal combustion engine, internal combustion
generator, emergency generator for nuclear power plant and others
DEC Apartment building and others
Cuvex Operation of resort and golf club
(2) Summarized financial information by business segments for the year ended December
31, 2016 and 2015 is as follows (in millions of Korean won):
2016
Sales Intercompany Net sales
Operating
income(loss)
Net income
(loss)
Power generation ₩5,240,962 ₩(309,250) ₩4,931,712 ₩265,434 ₩(94,010)
Water 372,408 (12,137) 360,271 (12,422) (56,228)
Industrial plants 56,430 - 56,430 2,010 (35,307)
Castings & forgings 435,790 (133,578) 302,212 (4,044) (32,742)
Construction 439,326 (4) 439,322 34,509 (7,490)
Wholesale and retail 8,730 (7,110) 1,620 629 2,603
DI 7,953,616 (2,225,276) 5,728,340 490,818 115,985
DE 818,222 (16,758) 801,464 4,237 (181,226)
DEC 1,274,566 (22,054) 1,252,512 12,795 (357,034)
Cuvex 27,242 (8,444) 18,798 88 173
Subtotal 16,627,292 (2,734,611) 13,892,681 794,054 (645,276)
Consolidation adjustments (2,734,611) 2,734,611 - (2,881) 429,751
Total
₩13,892,681 ₩- ₩13,892,681 ₩791,173 ₩(215,525)
-87-

2015
Sales Intercompany Net sales
Operating
income(loss)
Net income
(loss)
Power generation ₩5,615,766 ₩(320,123) ₩5,295,643 ₩258,927 ₩14,507
Water 477,627 (16,449) 461,178 (28,502) (50,024)
Industrial plants 69,070 (20) 69,050 15,943 (28,667)
Castings & forgings 453,866 (131,020) 322,846 10,236 (2,233)
Construction 482,075 8,433 490,508 2,318 (167,887)
Wholesale and retail 11,610 (11,555) 55 395 (45,322)
DI 9,718,254 (2,504,251) 7,214,003 27,441 (859,505)
DE 704,089 (13,186) 690,903 (63,754) (125,442)
DEC 1,820,561 (160,429) 1,660,132 (166,913) (520,746)
Subtotal 19,352,918 (3,148,600) 16,204,318 56,091 (1,785,319)
Consolidation adjustments (3,148,600) 3,148,600 - 5,975 34,420
Total
₩16,204,318 ₩- ₩16,204,318 ₩62,066 ₩(1,750,899)
(3) Summarized financial information on assets and liabilities by business segments as of
December 31, 2016 and 2015 is as follows (in millions of Korean won):
2016 2015
Assets Liabilities Assets Liabilities
Power generation ₩10,614,137 ₩7,101,472 ₩10,319,359 ₩6,732,792
Water 806,318 590,731 952,244 612,209
Industrial plants 137,520 47,187 198,150 64,318
Castings & forgings 1,284,458 489,699 1,254,422 487,464
Construction 1,578,002 1,040,279 1,444,537 1,010,122
Wholesale and retail 189,846 60,270 201,387 77,568
DI 10,026,809 6,578,432 11,383,173 8,280,217
DE 1,356,450 822,185 1,406,042 831,369
DEC 3,030,035 1,965,359 4,225,712 2,811,405
Cuvex 219,043 79,613 - -
Subtotal 29,242,618 18,775,227 ₩31,385,026 ₩20,907,464
Consolidation adjustments (4,410,050) (765,490) (4,124,885) (673,431)
Total
₩24,832,568 ₩18,009,737 ₩27,260,141 ₩20,234,033
-88-
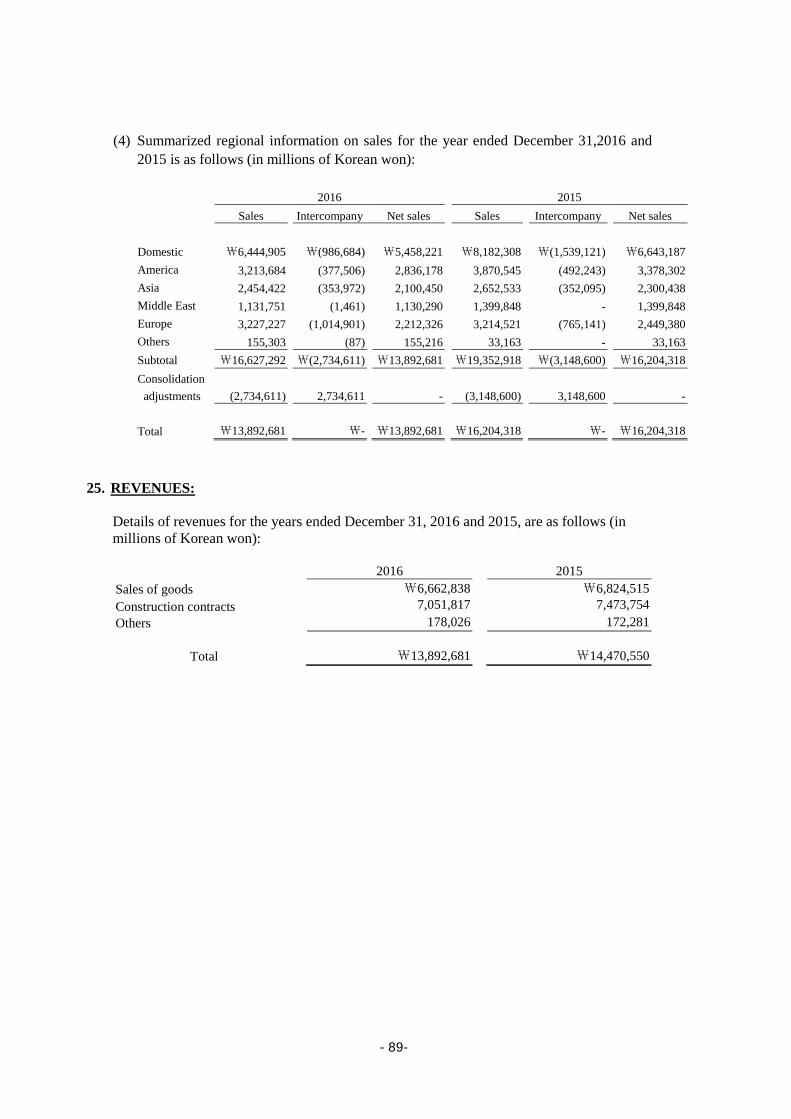
(4) Summarized regional information on sales for the year ended December 31,2016 and
2015 is as follows (in millions of Korean won):
2016 2015
Sales Intercompany Net sales Sales Intercompany Net sales
Domestic ₩6,444,905 ₩(986,684) ₩5,458,221 ₩8,182,308 ₩(1,539,121) ₩6,643,187
America 3,213,684 (377,506) 2,836,178 3,870,545 (492,243) 3,378,302
Asia 2,454,422 (353,972) 2,100,450 2,652,533 (352,095) 2,300,438
Middle East 1,131,751 (1,461) 1,130,290 1,399,848 - 1,399,848
Europe 3,227,227 (1,014,901) 2,212,326 3,214,521 (765,141) 2,449,380
Others 155,303 (87) 155,216 33,163 - 33,163
Subtotal ₩16,627,292 ₩(2,734,611) ₩13,892,681 ₩19,352,918 ₩(3,148,600) ₩16,204,318
Consolidation
adjustments
(2,734,611) 2,734,611 - (3,148,600) 3,148,600 -
Total
₩13,892,681 ₩- ₩13,892,681 ₩16,204,318 ₩- ₩16,204,318
25. REVENUES:
Details of revenues for the years ended December 31, 2016 and 2015, are as follows (in
millions of Korean won):
2016 2015
Sales of goods ₩6,662,838 ₩6,824,515
Construction contracts 7,051,817 7,473,754
Others 178,026 172,281
Total
₩13,892,681
₩14,470,550
-89-

26. CONSTRUCTION CONTRACTS:
(1) Details of the Group’s accumulated construction profit or loss for the year ended
December 31,2016 and 2015 and assets and liabilities related to construction contracts as
of December 31, 2016 and 2015 are as follows (in millions of Korean won):
As of and for the year ended December 31,2016
Accumulated
construction
revenue
Accumulated
construction cost
Accumulated
construction
profit (loss)
Receivable from
construction contract Due to customers for
contract work Claimed Unclaimed
Power generation
₩30,699,20
8
₩25,553,3
19 ₩5,145,889 ₩177,167
₩1,239,82
4 ₩553,818
Water 3,953,709 3,487,802 465,907 61,505 128,741 58,200
Industrial plants 496,219 401,044 95,175 5,718 13,438 9,585
Castings &
forgings
8,607 4,463 4,144 - 8,607 -
Plant construction 1,327,101 1,294,002 33,099 2,529 27,258 1,297
General construction 2,259,668 2,008,108 251,560 466,884 130,173 44,863
38,744,512 32,748,738 5,995,774 713,803 1,548,041 667,763
Subsidiaries:
DEC 7,668,210 6,756,550 911,660 1,207,098 226,956 147,307 DE 233,372 187,819 45,553 452 15,762 16,562 DPS S.A and
subsidiaries
8,960,275 8,255,746 704,529 287,304 217,639 74,036
16,861,857 15,200,115 1,661,742 1,494,854 460,357 237,905
₩55,606,369 ₩47,948,853 ₩7,657,516 ₩2,208,657
₩2,008,39
8 ₩905,668
Internal transaction (50,440) (45,246) (5,194) (79,582) (16) (29,159)
Discontinued (157,527) (136,312) (21,215) - - -
Total
₩55,398,40
2
₩47,767,2
95 ₩7,631,107 ₩2,129,075
₩2,008,38
2 ₩876,509
As of and for the year ended December 31, 2015
Accumulated construction
revenue
Accumulated
construction cost
Accumulated construction
profit (loss)
Receivable from
construction contract Due to customers for
contract work Claimed Unclaimed
Power generation ₩27,658,253 ₩22,939,565 ₩4,718,688 ₩219,450 ₩1,140,386 ₩653,368
Water 4,055,496 3,668,334 387,162 131,936 128,573 1,419
Industrial plants 750,561 703,137 47,424 6,567 30,301 15,745
Plant construction 1,257,669 1,235,229 22,440 7,674 14,618 10,882
General
construction
2,179,703 2,026,072 153,631 756,117 113,125 55,382
35,901,682 30,572,337 5,329,345 1,121,744 1,427,003 736,796
Subsidiaries:
DEC 9,714,942 8,599,549 1,115,393 1,306,672 362,170 270,789
DE 226,100 177,913 48,187 - 2,331 9,702
DPS S.A and
subsidiaries
9,717,433 8,839,573 877,860 171,555 191,903 183,311
19,658,475 17,617,035 2,041,440 1,478,227 556,404 463,802
₩55,560,157 ₩48,189,372 ₩7,370,785 ₩2,599,971 ₩1,983,407 ₩1,200,598
Internal transaction (31,373) (28,207) (3,166) (51,286) (30) (19,942)
Discontinued (2,150,205) (1,908,384) (241,821) (84,682) (180,925) (79,505)
Total
₩53,378,579 ₩46,252,781 ₩7,125,798 ₩2,464,003 ₩1,802,452 ₩1,101,151
-90-

(2) Changes in construction contracts for the year ended December 31, 2016 and 2015 are as
follows (in millions of Korean won):
2016
Project name
Period
January 1,
2016
Increase
(decrease)
Revenue
recognized
December
31,2016,
Power generation Vinh Tan 4 Thermal
Power Plant and others
2014.02~ 2018.06
₩11,431,311 ₩3,286,503 ₩3,563,681 ₩11,154,133
Water Yanbu ph.3 MSF and
others
2012.11~
2016.12
636,475 588,173 296,230 928,418
Industrial plants AOE-II reduction gear and
others
2014.06~ 2017.11
63,098 59,825 56,430 66,493
Castings & forgings Jurong 2016.06~
2017.04
- 10,770 8,607 2,163
Plant construction
Shinboryung #1,2 electric
generation construction
and others
2013.06~
2017.06
478,151 127,063 104,206 501,008
General construction Seoul Forest Trimage and
others
2013.07~
2017.04
845,280 438,501 335,120 948,661
₩13,454,315 ₩4,510,835 ₩4,364,274 ₩13,600,876
Subsidiaries:
DEC
Suseo-Pyungtaek high
speed rail second
construction district and
others
2007.05~ 2019.12
₩7,072,769 ₩1,042,979 ₩1,613,861 ₩6,501,887
DE
Singori #3 and #4
emergency generators,
alternative AC power
diesel engine and other 15
2005.02~ 2017.03
85,208 (831) 34,446 49,931
DPS S.A and
subsidiaries Raipur and others
2008.12~
2030.12
3,319,743 1,348,350 1,442,001 3,226,092
₩10,477,720 ₩2,390,498 ₩3,090,308 ₩9,777,910
₩23,932,035 ₩6,901,333 ₩7,454,582 ₩23,378,786
Internal transaction (208,295) (108,027) (14,108) (302,214)
Discontinued (871,414) 524,698 (346,716) -
₩22,852,326 ₩7,318,004 ₩7,093,758 ₩23,076,572
-91-

2015
Project name
Period
January 1,
2015
Increase
(decrease)
Revenue
recognized
December
31, 2015
Power generation Vinh Tan 4 Thermal Power
Plant and others
2014.02~ 2018.06
₩11,170,597 ₩4,052,849 ₩3,792,135 ₩11,431,311
Water Yanbu ph.3 MSF and
others
2012.11~
2016.12
809,156 263,010 435,691 636,475
Industrial plants Cikarang GTSU 2 and
STRE 2 and others
2014.04~ 2016.04
173,941 (41,773) 69,070 63,098
Plant construction
Shinboryung #1,2 electric
generation construction
and others
2013.06~
2017.06
128,220 488,819 138,888 478,151
General construction Seoul Forest Trimage and
others
2013.07~ 2017.01
957,047 231,420 343,187 845,280
₩13,238,961 ₩4,994,325 ₩4,778,971 ₩13,454,315
Subsidiaries:
DEC
Suseo-Pyungtaek high
speed rail second
construction district and
others
2007.05~
2017.12
₩6,736,325 ₩2,078,629 ₩1,742,185 ₩7,072,769
DE
Singori #3 and #4
emergency generators,
alternative AC power
diesel engine and other 15
2005.02~
2017.03
97,502 24,460 36,754 85,208
DPS S.A and
subsidiaries Raipur and others
2008.12~ 2030.12
1,916,543 2,954,622 1,551,422 3,319,743
₩8,750,370 ₩5,057,711 ₩3,330,361 ₩10,477,720
₩21,989,331 ₩10,052,036 ₩8,109,332 ₩23,932,035
Internal transaction (75,788) (150,282) (17,775) (208,295)
Attributed to : Discontinued operations (802,459) (664,091) (595,136) (871,414)
₩21,111,084 ₩9,237,663 ₩7,496,421 ₩22,852,326
(3) Changes in profit or loss in current and future reporting periods and the book value of due
from (to) customers for contracts work (excluding foreign currency translation effect)
resulting from changes in total contract revenue and in total estimated contract costs for
construction contracts in progress As of December 31,2016 are as follows (in millions of
Korean won):
Changes in
total contract revenue
Changes in
total contract cost
Effect on
profit(loss) for the year
Effect on
profit(loss) for the future
Changes in due
from (to) customer for contract work
provision for
construction loss
Power generation ₩439,014 ₩250,190 ₩101,381 ₩87,443 ₩101,381 ₩7,803
Water 144,323 117,947 23,924 2,452 23,924 122
Industrial plants 1,891 (1,792) 1,752 1,931 1,752 -
Plant construction 31,652 26,717 4,355 580 4,355 2,516
General construction 16,269 14,443 (1,338) 3,164 (1,338) 2,152
DE - 1,440 (1,415) (25) (1,415) -
DEC 18,727 13,000 (19,391) 33,459 (19,391) 2,176
Subtotal ₩651,876 ₩421,945 ₩109,268 ₩129,004 ₩109,268 ₩14,769
Discontinued 4,908 (13,068) 9,727 (92) 9,727 -
Total
₩656,784 ₩408,877 ₩118,995 ₩128,912 ₩118,995 ₩14,769
-92-

Impacts on current and future net income were calculated based on total contract revenue
and costs which were estimated based on the current circumstances as of December 31,
2016. Those estimations may change in the future.
(4) As of December 31,2016, details of contracts that the revenue was recognized based on
the percentage of completion measured by contract cost incurred, which is more than 5%
of sales of years ended December 31, 2016 are as follows. There is no contract that the
group decided not to disclose due to the prohibition by related regulations or contracts. (in
millions of Korean won):
Due from customers for
contract work
Trade receivables(receivables
from construction contract)
Contract date
Due date /
Delivery date
in contract
Percentage of
completion Amount
Allowance
for doubtful
accounts Amount
Allowance
for doubtful
accounts
UAE BNPP #1, 2 NSSS 2010-06-30 2018-05-01 97 ₩- ₩- ₩- ₩-
Ras Al Khair 2010-08-31 2017-03-27 94 12,996 - 74,797 -
Nghi Son II 2014-12-24 2019-07-30 - - - - -
Vinh Tan 4 TPP 2014-02-26 2018-06-30 82 270,792 - 15,012 200
UAE BNPP #3, 4 NSSS 2010-06-30 2020-05-01 74 - - - -
Shinhanwul #1, 2 NSSS 2009-07-31 2018-02-28 94 34,486 - - -
Shingori #5,6 NSSS 2014-08-28 2022-03-31 36 - - - -
Shingori #3, 4 NSSS 2006-08-28 2017-03-31 98 22,209 - - -
Yanbu Ph.3 MSF(*1) 2012-12-04 2016-12-15 90 55,253 - - -
Qurayyah Add-On (*1) 2009-09-16 2013-02-15 100 130,681 - - -
Fadhili CHP 2016-11-12 2019-11-30 3 - - - -
Song Hau 1 2015-04-10 2019-10-02 33 154,219 - 234 -
Raipur Chhattisgarh TPP (*1) 2010-01-22 2016-04-03 100 - - 72,343 -
(*1) The Group is negotiating to extend contract period with respective contract party.
27. EXPENSES CLASSIFIED BY NATURE:
Expenses classified by nature for the year ended December 31, 2016 and 2015 are as follows
(in millions of Korean won):
2016 2015
Changes in inventories
₩465,885
₩135,418
Purchases of raw materials and goods 6,245,905 7,462,978
Salaries 2,124,905 2,445,926
Depreciation and amortization 515,709 545,483
Others 3,749,104 3,908,077
Total ₩13,101,508 ₩14,497,882
-93-

28. SELLING AND ADMINISTRATIVE EXPENSES:
Details of selling and administrative expenses for the years ended December 31, 2016 and
2015 are as follows (in millions of Korean won):
2016 2015
Salaries ₩516,690 ₩531,725
Severance and retirement benefits 41,972 218,976
Employee welfare benefits 106,286 118,148
Travel 44,603 53,982
Training 18,703 21,895
Taxes and dues 21,411 21,918
Commissions 221,001 224,700
Sales commission 54,724 52,589
Rents 59,686 64,904
Bad debt expenses 17,368 289,704
Transportation 11,891 12,671
Depreciation 22,699 26,398
Amortization 72,327 72,515
Research 191,636 241,117
Foreign marketing development expenses 25,012 30,114
Advertising 66,444 89,996
Warranty 20,813 25,628
Insurance and others 110,749 117,659
Total ₩1,624,015 ₩2,214,639
29. FINANCE INCOME AND EXPENSES:
(1) Finance income for the year ended December 31,2016 and 2015 are summarized as
follows (in millions of Korean won):
2016 2015
Interest income
₩39,607 ₩44,247
Dividend income 304 1,266
Gain on foreign currency transaction 236,898 289,026
Gain on foreign currency translation 132,939 122,297 Gain on settlement of derivative financial
instruments 321,713 308,526 Gain on valuation of derivative financial
instruments 101,319 139,865
Gain on valuation of firm commitments 182,478 296,009
Others 745 2,047
Total ₩1,016,003 ₩1,203,283
-94-
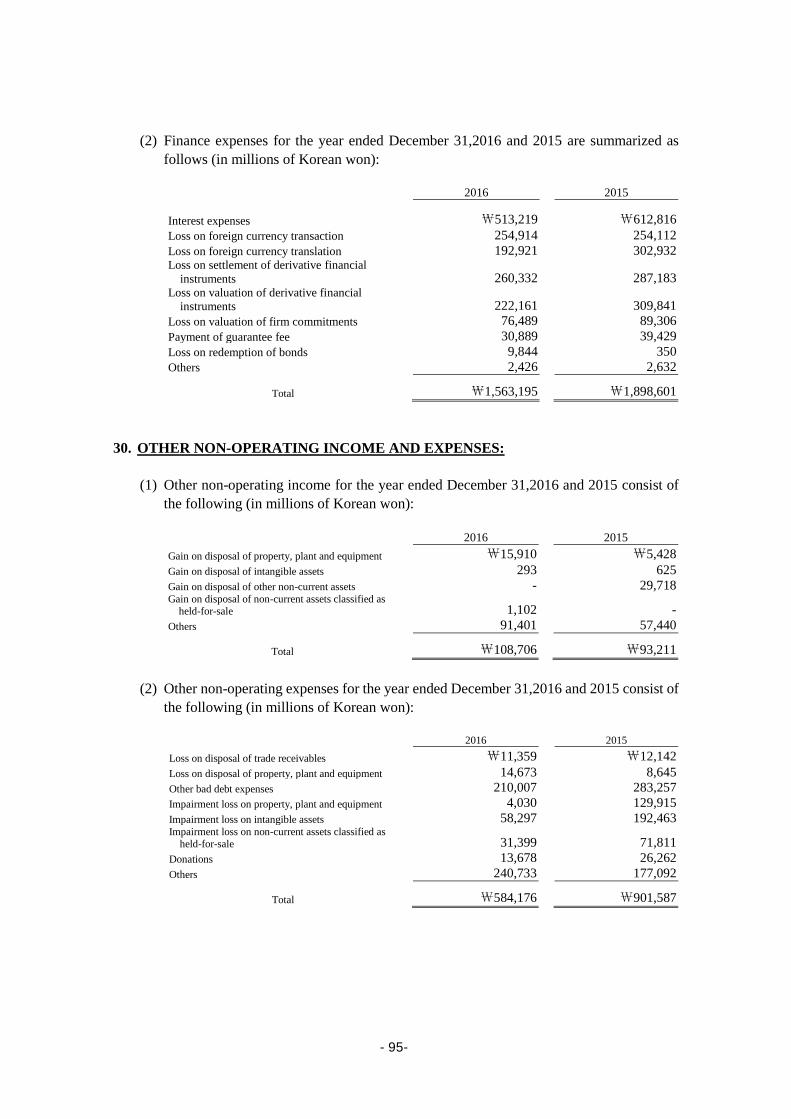
(2) Finance expenses for the year ended December 31,2016 and 2015 are summarized as
follows (in millions of Korean won):
2016 2015
Interest expenses
₩513,219 ₩612,816
Loss on foreign currency transaction 254,914 254,112
Loss on foreign currency translation 192,921 302,932 Loss on settlement of derivative financial
instruments 260,332 287,183 Loss on valuation of derivative financial
instruments 222,161 309,841
Loss on valuation of firm commitments 76,489 89,306
Payment of guarantee fee 30,889 39,429
Loss on redemption of bonds 9,844 350
Others 2,426 2,632
Total ₩1,563,195 ₩1,898,601
30. OTHER NON-OPERATING INCOME AND EXPENSES:
(1) Other non-operating income for the year ended December 31,2016 and 2015 consist of
the following (in millions of Korean won):
2016 2015
Gain on disposal of property, plant and equipment ₩15,910 ₩5,428
Gain on disposal of intangible assets 293 625
Gain on disposal of other non-current assets - 29,718 Gain on disposal of non-current assets classified as
held-for-sale 1,102 -
Others 91,401 57,440
Total ₩108,706 ₩93,211
(2) Other non-operating expenses for the year ended December 31,2016 and 2015 consist of
the following (in millions of Korean won):
2016 2015
Loss on disposal of trade receivables ₩11,359 ₩12,142
Loss on disposal of property, plant and equipment 14,673 8,645
Other bad debt expenses 210,007 283,257
Impairment loss on property, plant and equipment 4,030 129,915
Impairment loss on intangible assets 58,297 192,463 Impairment loss on non-current assets classified as
held-for-sale 31,399 71,811
Donations 13,678 26,262
Others 240,733 177,092
Total ₩584,176 ₩901,587
-95-

31. INCOME TAX EXPENSE:
(1) The component of income tax expenses for the years ended December 31, 2016 and
2015 are as follows (in millions of Korean won):
2016 2015
Current income tax expense ₩143,795 ₩88,091
Adjustments in respect of
current income tax of prior year
568 176
Tax effect of temporary difference 206,793 197,182
Total income tax expense (benefit) 351,156 285,449
Current income tax related to items
recognized in equity during the year
(25,326) 1,360
Deferred tax related to items
recognized in equity during the year
(32,887) (121,550)
Income tax benefit related to
discontinued operation
(159,064) -
Others (2,314) (34,207)
Income tax expense (benefit) ₩131,565 ₩131,052
(2) The component of income tax expense and deferred tax related to items recognized in
equity for the years ended December 31, 2016 and 2015 are as follows (in millions of
Korean won):
2016 2015
Net Gain(loss)
on disposal of treasury stock
₩(16,928)
₩-
Equity adjustments in equity method - (22)
Net gain(loss) on revaluation of land 4,005 (111,463)
Unrealized gain(loss) on
available for sale financial assets
(43,186)
(4,244)
Gain (loss) on valuation of
derivative financial instruments
(6,811)
(13,847)
Remeasurement of
the net defined benefit liability
10,874
16,170
Net gain(loss) on translation of
foreign operations
(6,066)
44,215
Others (101) (50,999)
Total ₩(58,213) ₩(120,190)
-96-

(3) Changes in deferred tax assets (liabilities) for the years ended December 31, 2016 and
2015 are as follows (in millions of Korean won):
2016
Jan 01
Increase
(decrease) Dec 31
Provision for retirement and
severance benefits
₩258,891
₩29,059
₩287,950
Allowance for doubtful
accounts
480,818
5,020
485,838
Property, plant and equipment 30,444 7,190 37,634
Reserve for research and
development
(97,261)
45,441
(51,820)
Intangible assets 67,191 (14,937) 52,254
Derivative financial instruments 32,481 (10,655) 21,826
Foreign currency denominated
assets (liabilities)
16,653
6,932
23,585
Gain on revaluation of land (759,244) 52,250 (706,994)
Others 634,792 (327,093) 307,699
Total ₩664,765 ₩(206,793) ₩457,972
2015
Jan 01
Increase
(decrease) Dec 31
Provision for retirement and
severance benefits
₩262,606
₩(3,715)
₩258,891
Allowance for doubtful
accounts
398,220
82,598
480,818
Property, plant and equipment 25,569 4,875 30,444
Reserve for research and
development
(137,584)
40,323
(97,261)
Intangible assets 53,446 13,745 67,191
Derivative financial instruments 57,981 (25,500) 32,481
Foreign currency denominated
assets (liabilities)
1,232
15,421
16,653
Gain on revaluation of land (682,421) (76,823) (759,244)
Others 882,898 (248,106) 634,792
Total ₩861,947 ₩(197,182) ₩664,765
(4) The amount of deductible temporary differences for which no deferred tax asset is
recognized in the statements of financial position as at December 31, 2016 and 2015
are as follows (in millions of Korean won):
2016 2015
Deductible temporary differences ₩4,858,343 ₩3,651,343
The probability of deferred tax assets being realized depends on the Group's ability to
generate taxable income in future years over which temporary differences are expected
to reverse depending on the economic situation, industry forecast and other various
factors. The Group periodically reviews such matters.
-97-

(5) Temporary differences related to investment in subsidiaries, associates and joint
ventures which are not recognized as deferred tax asset (liability) as at December 31,
2016 and 2015 are as follows (in millions of Korean won):
2016 2015
Investment in subsidiaries ₩145,203 ₩681,368
Investment in associates or joint ventures 55,494 41,324
Total ₩200,697 ₩722,692
(6) Reconciliation of loss before income tax at the Korea statutory tax rate to income tax
benefit at the effective income tax rate of the company as follows (in millions of
Korean won):
2016 2015
Net loss before income tax ₩(246,097) ₩(1,612,685)
Income tax using
the controlling company's
statutory tax rate
75,124
(528,954)
Adjustments:
Non-temporary differences (20,811) (53,366)
Unrealized deferred tax related to temporary
differences
76,164
583,232
Tax credit (16,864) (7,195)
Others 17,952 137,335
Income tax expense(benefit) ₩131,565 ₩131,052
Effective tax rate(*1) - -
(*1) Effective tax rate for the years ended December 31, 2016 and 2015 were not
calculated due to loss before income tax.
32. EARNINGS (LOSS) PER SHARE:
(1) Basic earnings (loss) per share
Basic earnings (loss) per share for the year ended December 31, 2016 and 2015 are as
follows (in Korean won):
2016 2015
Net income(loss) for the period attributable to equity
holders of the parent
₩(170,750,790,211) ₩(1,038,543,220,644)
Less: preferred stock dividend 12,309,000,165 12,309,000,165
Income(Loss) for the period attributable to ordinary equity
holders of the parent (183,059,790,376) (1,050,852,220,809)
Income (Loss) from continuing operations (268,909,894,468) (1,009,252,761,890)
Income (loss) from discontinued operations 85,850,104,092 (41,599,458,919)
Weighted-average number of ordinary stock outstanding 103,001,492 Shares 98,845,751 Shares
Earnings (loss) per share:
Basic, loss for the year attributable to ordinary equity
holders of the parent ₩(1,777) ₩(10,631)
Income(loss) for the period from continuing operations (2,611) (10,210)
Income(loss) for the period from discontinued operations 834 (421)
-98-

Weighted-average number of ordinary shares outstanding for the year ended December
31, 2016 and 2015 are as follows (number of shares):
2016 2015
Beginning outstanding shares
106,158,256 106,158,256
Beginning treasury stock (7,312,505) (7,312,505)
Disposal of treasury stock 4,155,741 -
Weighted-average number of common shares outstanding
as of December 31 103,001,492 98,845,751
(2) Diluted earnings (loss) per share for the year ended December 31,2016 and 2015 are as
follows (in units of Korean won, except for share):
2016 2015
Income(loss) for the period attributable to equity holders of
the parent
₩(183,059,790,376) ₩(1,050,852,220,809)
Adjusted profit (loss) for the period
Income(loss) for the period attributable to equity holders of
the parent after adjustment (183,059,790,376) (1,050,852,220,809)
Income (Loss) from continuing operations (268,909,894,468) (1,009,252,761,890)
Income (loss) from discontinued operations 85,850,104,092 (41,599,458,919)
Weighted-average number of ordinary stock outstanding 103,001,492 Shares 98,845,751 Shares
Earnings (loss) per share:
Diluted, Income(loss) for the period attributable to ordinary
equity holders of the parent ₩(1,777) ₩(10,631)
Income(loss) for the period from continuing operations (2,611) (10,210)
Income for the period from discontinued operations 834 (421)
There is no difference between adjusted weighted-average number
of common shares outstanding for the calculation of diluted earnings
per share and weighted average number of common shares
outstanding for the calculation of basic earnings per share.
(3) Details of potential ordinary shares, that are potentially dilutive but were not included in
the calculation of earnings(loss) per share, as there were no dilutive effects for the year
ended December 31,2016 and 2015 are as follows (number of shares):
2016 2015
Stock option (2006.02.27) - 2,600
Stock option (2007.03.16) 6,800 8,600
Stock option (2008.03.21) 13,400 17,400
Stock option (2009.03.27) 10,900 13,200
Stock option (2010.03.26) 26,800 29,600
Stock option (2011.03.25) 50,500 59,900
Stock option (2012.03.30) 114,800 143,200
Stock option (2013.03.29) 201,000 279,900
Stock option (2014.03.28) 342,300 342,300
Redeemable convertible preferred shares 13,203,540 13,203,540
Total
13,970,040
14,100,240
-99-

33. COMMITMENTS AND CONTINGENCIES:
(1) As of December 31, 2016, 21 promissory notes in the aggregate of ₩13,136 million, 19
blank notes and 38 blank checks have been provided as collateral to relevant financial
institutions and others for the Group’s debt and guarantees.
(2) As of December 31, 2016, the Group has credit lines for borrowings, bank overdraft and
others from financial institutions up to ₩8,922,511 million and used ₩7,379,568
million. As a result, the Group maintains unused credit lines amounts to ₩1,542,853
million.
(3) As of December 31, 2016, the Group is involved in pending lawsuits as a defendant with
total claims of approximately ₩568,025 million. The outcome of such pending lawsuits
cannot presently be determined. In 2015, Hyundai Engineering & Construction Co., Ltd.
requested International Chamber of Commerce to arbitrate disputes on manufacture of
HRSG and warranties for general repairs with DEC. As of December 31, 2016,
arbitration is in process, and the outcome of the arbitration cannot be reasonably
estimated.
(4) As of December 31, 2016, the Group has entered into 20 technical contracts with
Mitsubishi Heavy Industries, Ltd. and others. For the year ended December 31, 2016 and
2015, royalty payments amounted to ₩60,380 million and ₩59,496 million,
respectively.
(5) The Group continues to recognize factored financial assets in the statement of financial
position since the Group holds virtually all the risks and rewards of ownership. The
Group also recognizes the associated financial liabilities of ₩101,919 million as of
December 31, 2016.
(6) As of December 31, 2016, the Group provides joint and several guarantees of ₩488,649
million for the performance of construction contracts to other construction companies. In
addition, the Group provides joint and several guarantees for construction performance
to Korea Housing & Finance Corporation related to the guarantee for housing sales,
which was provided by Korea Housing Finance Corporation to the developers.
(7) As of December 31, 2016, payment guarantees by financial institutions of ₩12,026,815
million are provided for the Group in connection with domestic and overseas construction
projects and others.
(8) As of December 31, 2016, the Group provides payment guarantees of ₩2,121,263
million to customers and purchasers of vacant lots for housing sales for the purpose of
supporting reconstruction and redevelopment project unions and domestic and overseas
sales.
-100-

(9) As of December 31, 2016, the Group's total future minimum lease payments under non-
cancellable operating lease contracts are as follows (in millions of Korean won):
Amount
Less than 1 year ₩42,557
More than 1 year ~ less than 5 years 119,799
More than 5 years 110,105
Total
₩272,461
(10) The Supreme Court of the Republic of Korea ruled that regular bonuses and other
employee benefits, which are to be paid on a regular basis, universally applicable, and at
fixed term, also fall under the category of ordinary wages. Given that the Supreme
Court’s ruling is expected to cause an additional financial burden for most companies,
the Supreme Court ruled that such additional liability may be exempt from its retroactive
obligation, should such liability lead to excessive financial hardship for the entity. In
relation to the Supreme Court’s ruling, the Group sees the possibility of the likeliness of
having to pay related amounts to be low and it cannot be reasonably estimated.
(11) As of December 31, 2016, details of guarantees provided by the Group for developers’
project financing are as follows (in millions of Korean won):
Type Developer Project name Lender
Guarantee
period
Guarantee
limit Loan balance Warranty type
ABCP
The Company
Yong-in Administration
Town
Meritz Securities
Co., Ltd.
2016.04.07 ~
2017.04.04
₩45,000 ₩45,000
Debt assumption
Loan
The Company Seoul Forest Trimage
Korea Federation of
Community Credit
Cooperative and others
2014.04.29 ~
2017.08.29
135,000 135,000
Debt assumption
DEC
Ulsan Daehyungdong Woori bank and others 2013.07.11 ~
2017.11.30
116,350 89,500 Joint and several
guarantee
Hwaseong Banwol Woori bank and others 2008.03.31 ~
2017.06.30
52,000 40,000 Joint and several
guarantee
Pohang new port Shinhan Bank and
others 2010.03.26 ~
2025.12.31
7,447 7,447 Joint and several
guarantee
Daejeon Riverside KEB Hana Bank 2004.05.06 ~
2024.05.06
5,500 5,500 Joint and several
guarantee
Subtotal ₩316,297 ₩277,447
Short-term
Bond The Company
Seoul Forest Trimage
LIG Securities and
others 2014.04.29~
2017.08.29
35,000 35,000
Debt assumption
Sangdo-dong Doosan
We’ve(2nd) Hyundai Securities and
others 2016.02.26~
2017.02.24
17,000 17,000
Debt assumption
Hongcheon Club Mow Hyundai Securities and
others 2016.04.19~
2017.04.18
175,400 175,400
Debt assumption
DEC
Ulsan Daehyungdong KTB Securities 2016.10.06~
2017.01.05
41,600 32,000 Joint and several
guarantee
Cheonan
Chengdangdong KTB Securities 2016.12.30~
2017.03.30
52,000 40,000 Joint and several
guarantee
Cheonan
Chengdangdong HMC Securities 2016.12.02~
2017.03.02
52,000 40,000 Joint and several
guarantee
Cheonan
Chengdangdong HMC Securities 2016.12.09~
2017.03.09
65,000 50,000 Joint and several
guarantee
Cheonan
Chengdangdong HMC Securities 2016.12.15~
2017.03.15
39,000 30,000 Joint and several
guarantee
Cheonan
Chengdangdong HMC Securities 2016.12.30~
2017.03.30
78,000 60,000 Joint and several
guarantee
Yongin samga KTB Securities 2016.12.19~
2017.03.17
78,000 60,000 Joint and several
guarantee
Yongin samga.
KTB Securities 2016.12.29~
2017.03.29
78,000 60,000
Joint and several
guarantee
Subtotal ₩711,000 ₩599,400
Total
₩1,072,297 ₩921,847
-101-
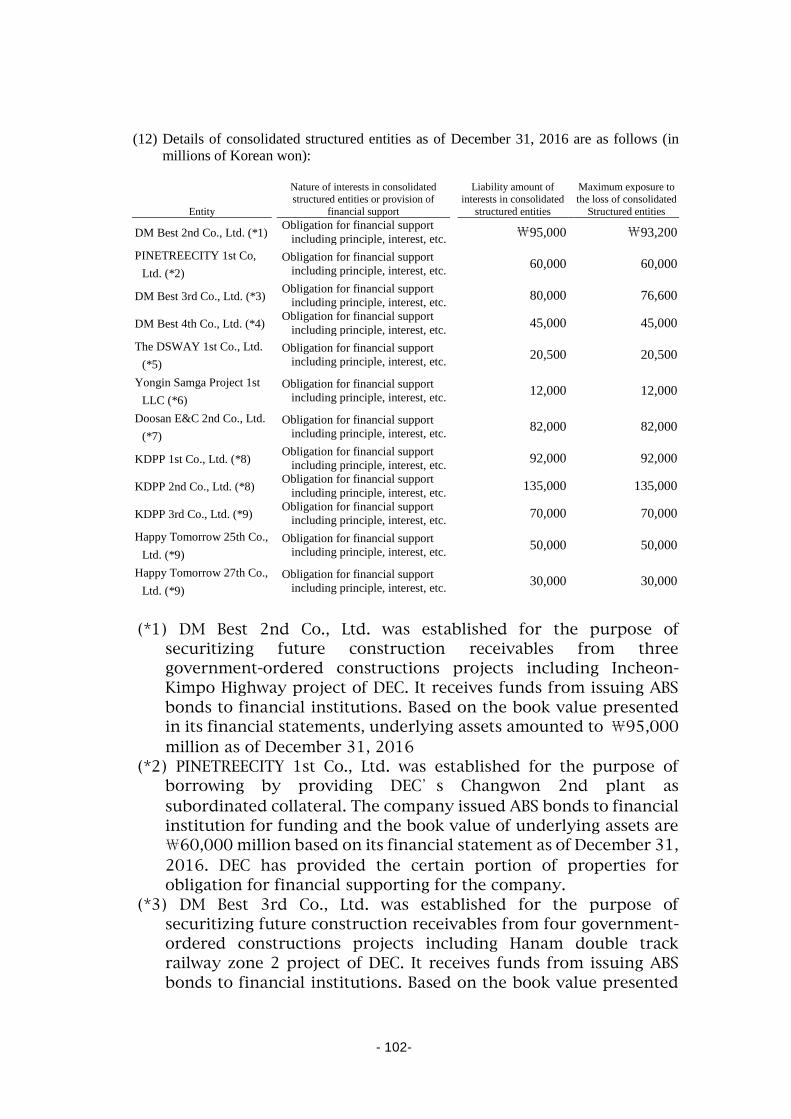
(12) Details of consolidated structured entities as of December 31, 2016 are as follows (in
millions of Korean won):
Entity
Nature of interests in consolidated
structured entities or provision of
financial support
Liability amount of
interests in consolidated
structured entities
Maximum exposure to
the loss of consolidated
Structured entities
DM Best 2nd Co., Ltd. (*1) Obligation for financial support
including principle, interest, etc. ₩95,000 ₩93,200
PINETREECITY 1st Co,
Ltd. (*2)
Obligation for financial support
including principle, interest, etc. 60,000 60,000
DM Best 3rd Co., Ltd. (*3) Obligation for financial support
including principle, interest, etc. 80,000 76,600
DM Best 4th Co., Ltd. (*4) Obligation for financial support
including principle, interest, etc. 45,000 45,000
The DSWAY 1st Co., Ltd.
(*5)
Obligation for financial support
including principle, interest, etc. 20,500 20,500
Yongin Samga Project 1st
LLC (*6)
Obligation for financial support
including principle, interest, etc. 12,000 12,000
Doosan E&C 2nd Co., Ltd.
(*7)
Obligation for financial support
including principle, interest, etc. 82,000 82,000
KDPP 1st Co., Ltd. (*8) Obligation for financial support
including principle, interest, etc. 92,000 92,000
KDPP 2nd Co., Ltd. (*8) Obligation for financial support
including principle, interest, etc. 135,000 135,000
KDPP 3rd Co., Ltd. (*9) Obligation for financial support
including principle, interest, etc. 70,000 70,000
Happy Tomorrow 25th Co.,
Ltd. (*9)
Obligation for financial support
including principle, interest, etc. 50,000 50,000
Happy Tomorrow 27th Co.,
Ltd. (*9)
Obligation for financial support
including principle, interest, etc. 30,000 30,000
(*1) DM Best 2nd Co., Ltd. was established for the purpose of
securitizing future construction receivables from three
government-ordered constructions projects including Incheon-
Kimpo Highway project of DEC. It receives funds from issuing ABS
bonds to financial institutions. Based on the book value presented
in its financial statements, underlying assets amounted to ₩95,000
million as of December 31, 2016
(*2) PINETREECITY 1st Co., Ltd. was established for the purpose of
borrowing by providing DEC’s Changwon 2nd plant as
subordinated collateral. The company issued ABS bonds to financial
institution for funding and the book value of underlying assets are
₩60,000 million based on its financial statement as of December 31,
2016. DEC has provided the certain portion of properties for
obligation for financial supporting for the company.
(*3) DM Best 3rd Co., Ltd. was established for the purpose of
securitizing future construction receivables from four government-
ordered constructions projects including Hanam double track
railway zone 2 project of DEC. It receives funds from issuing ABS
bonds to financial institutions. Based on the book value presented
-102-

in its financial statements, underlying assets amounted to ₩80,000
million as of December 31, 2016
(*4) DM Best 4th Co., Ltd. was established for the purpose of securitizing
future construction receivables from eight government-ordered
constructions projects including Kimpo railway zone 2 project of
DEC. It receives funds from issuing ABS bonds to financial
institutions. Based on the book value presented in its financial
statements, underlying assets amounted to ₩45,000 million as of
December 31, 2016
-103-

(*5) The DSWAY 1st Co., Ltd. was established for the purpose of
securitizing future construction receivables from five construction
projects including Doosan research complex of DEC. It receives
funds from issuing ABS bonds to financial institutions. Based on the
book value presented in its financial statements, underlying assets
amounted to ₩20,500 million as of December 31, 2016
(*6) Yongin Samga Project 1st LLC was established for the purpose of
borrowing by providing DEC’s Yongin Samga project site as
subordinated collateral. The company issued ABS bonds to financial
institution for funding and the book value of underlying assets are
₩12,000 million based on its financial statement as of December 31,
2016. DEC has provided the certain portion of properties for
obligation for financial supporting for the company.
(*7) Doosan E&C 2nd Co., Ltd. was established for the purpose of
borrowing by providing DEC’s Changwon 2nd plant as collateral.
The company issued ABS bonds to financial institution for funding
and the book value of underlying assets are ₩82,000 million based
on its financial statement as of December 31, 2016. DEC has
provided the some of its properties for obligation for financial
supporting for the company.
(*8) KDPP 1st Co., Ltd and KDPP 2nd Co., Ltd. was established for the
purpose of securitizing future construction receivables belongs to
parent company. It receives funds from issuing ABCP bonds to
financial institutions. Based on the book value presented in its
financial statements, underlying assets amounted to ₩92,000
million and ₩135,000 million each as of December 31, 2016,
respectively.
(*9) KDPP 3rd Co., Ltd. Happy Tomorrow 25th Co., Ltd. Happy
Tomorrow 27th Co., Ltd. was established for the purpose of
securitizing common stocks and convertible redeemable preferred
stocks of DEC belongs to parent company. It receives funds from
issuing ABCP bonds to financial institutions. Based on the book
value presented in its financial statements, underlying assets
amounted to ₩70,000 million, ₩50,000 million and ₩30,000 each
as of December 31, 2016.
-104-
(13) Other commitments and contingencies
1) During the year ended December 31, 2016, DI issued 28th series bonds denominated
in USD 300 million. In accordance with the agreement for issuing the 19th series
bonds, an early redemption clause exists for when and if DI’s guarantor, KDB,
becomes privatized. However, under the agreement, the funds required for such
redemption will be lent by KDB to DI. In addition, DI has provided its 11,178,538
shares of Doosan Bobcat Inc. as collateral.
2) As of December 31, 2016, DI, a shareholder of Doosan Infracore China Co., Ltd.
entered into an agreement with financial investors under which DI and the financial
investors, as they mutually agree, may collectively dispose of all shares in Doosan
Infracore China Co., Ltd., respectively held by each, to a third party. Upon exercise
of the agreement by the financial investors, DI holds the right to sell its shares in
Doosan Infracore China Co., Ltd. together pursuant to the agreement or otherwise
repurchase the shares held by the financial investors.
3) DEC entered into construction contracts with INTDC Co., Ltd. and Daewon Plus
Constructions Co., Ltd., to develop Ilsan Zenith project and Haeundae Zenith project,
respectively. DEC has provided guarantees to customers, who purchase the Ilsan
Zenith and Haeundae Zenith apartments, for the consideration paid to purchase the
apartments during the repurchase guarantee periods (2~3 years after the date of sale),
should customers apply for such guarantees (See Note 33-(8)). As of December 31,
2016, the Group’s consolidated financial statements do not reflect the effect from
such guarantees as the Group cannot reasonably predict the number of purchasers
applying for the guarantee and the related guaranteed amount.
4) With regard to the Incheon-Kimpo Highway Construction Project, the Group entered
into a capital supplement agreement with a limit of guarantee of ₩22,346 million
with Incheon-Kimpo Expressway Co., Ltd. and Construction investors associated
with SOC business have an agreement of providing an insufficient fund, when the
agreement was terminated or insufficient to repay the loan principal and interest by
buy price or payment arising from purchase requirement from authorities.
5) As of December 31, 2016, the Company has entered into a contract to assume a
liability (Limit: ₩92,600 million) if it fails to complete construction of The Land
Park Office in Magok district and Gwanggyo Doosan We’ve project.
6) DEC entered into an agreement to disburse possible liquidate damage to Doosan
Mecatec Co., Ltd. for the business contracts entered prior to the business transfer
limited by ₩27,300 million that and the company recognize the effect on the
financial statement from the outcome of the contract in provision.
-105-

34. ASSETS PLEDGED AS COLLATERAL:
(1) Assets pledged as collateral related with debt
1) As of December 31,2016, assets that have been pledged as collateral for the Group's
borrowings and others are as follows (in millions of Korean won):
Pledger Collateralized asset
Collateralized
Amount
Amount of
borrowings
and others Pledgee
The Company Property, plant and equipment ₩990,485 ₩954,747 KDB and others
3,870 2,572 Korea Exim Bank
58,167 72,510 Vietnam Bank
3,812 3,812 Banca Transylvania
Equity securities in subsidiaries 124,132 70,000 KDB and others
366,154 180,000 Shinyoung Securities and others
DI Property, plant and equipment(*1) 941,589 163,460 KDB
DEC Short-term financial instruments 1,000 1,000 Kiup Bank
Investment properties 31,200 - KDB(*2)
Inventory 67,500 45,868 KDB
105,000 - KEB Hana Bank
Property, plant and equipment 130,050 82,000 Doosan E&C 2nd Co., Ltd.
78,000 60,000 PINETREECITY 1st Co., Ltd.
DE Property, plant and equipment 7,584 6,320 KDB
Cuvex Property, plant and equipment 19,500 4,000 KEB Hana Bank
Total ₩2,928,043 ₩1,646,289
(*1) The rights to the benefits from property and inventory insurance have been pledged
as collateral to KDB.
(*2) Subordinate beneficiary certificate owned by the group according to real estate trust
agreement is pledged as collateral to KDB.
2) Clark Equipment Co. ("CECO") and Doosan Holdings Europe
Ltd. (DHEL) repaid all the long-term borrowings funded in
2011 for the acquisition of the Compact Equipment business
of Ingersoll-Rand and entered into a new loan agreement to
borrow USD 1,700,000 thousand on May 28, 2014. DI
provided 62,495 shares in CECO, 38,446 shares in DHEL,
110,071,219 shares in Doosan Infracore South East Asia
Pte.Ltd. and certain tangible and intangible assets of CECO
and DHEL, and their subsidiaries as collateral for
borrowings. The balance of borrowings as of December 31,
2016 amounted to USD 947,500 thousand.
3) DI has provided all of its shares in Doosan Infracore America Corp. and Doosan
Infracore Norway AS. as collateral for borrowings of USD147,000 thousands from
Korea Exim Bank. In addition DI has provided 5,004,125 shares in Doosan Bobcat
Inc. as collateral for borrowings ₩100,000 million from Korea Exim bank.
-106-

4) DEC has provided 1,200,000 shares in Doosan Cuvex Co., Ltd. as collateral in
connection with an overdraft limit agreement of ₩105,958 million with Woori Bank.
As of December 31, 2016, the balance of related borrowings amounted to ₩105,958
million.
-107-

5) DEC has provided 24.76% of equity interests in Doosan Heavy Industry Vietnam Co.,
Ltd. and 20% of equity interests in DHI Vietnam Haipong Co., Ltd. as collateral in
connection with an overdraft limit agreement of ₩45,868 million with KDB. As of
December 31, 2016, the balance of related borrowing amounted to ₩45,868 million.
(2) As of December 31,2016 assets pledged as collateral on behalf of others are summarized
as follows (in millions of Korean won):
Pledgor Collateralized Asset
Book
value
Pledgee Beneficiary
The
Company
Long-term
investment
securities
₩23,818
Kookmin Bank and
others
Incheon-Kimpo express
highway Co., Ltd. and others
Inventories 9,824 CSOB Abener Energia S.A.
DEC
Long-term
investment
securities
101,657
KDB and others
Metropolitan West Highway
and others
Total \135,299
(3) Some of investments in associates and joint ventures such as, Shinbundang Co., Ltd.
stock and others (Book value: ₩24,499million) have been provided as collateral for
certain subsidiaries’ project financing to KDB and other, lenders of the project financing.
In addition, DEC has provided some of investment properties as collateral to KDB for
borrowings amounted to ₩110,000 million of Doosan Mecatec Inc. and some of
properties have been provided as collateral for guarantee deposits for leases of Next
Entertainment Inc. amounted to ₩3,000 million.
-108-

35. RELATED-PARTY TRANSACTIONS:
(1) The major related parties of the Group and nature of their relationship with the Group as
of December 31, 2016 are as follows:
1) As of December 31, 2016, the Group’s ultimate parent company is Doosan
Corporation (equity ownership: 36.82%).
2) As of December 31, 2016, the details of the Group’s associates and joint ventures,
other related parties are as follows:
Control relationship Related party
Associates and joint
ventures
Tamra Offshore Wind Power Co., Ltd., Dalian Samyoung Doosan Metal Product Co.,Ltd.,
Kyunggi Railroad Co., Ltd., Shinbundang Railroad Co., Ltd., Neo Trans Co., Ltd.,
New Seoul Railway Corporation, Haman Industrial Complex Company, Xuzhou Xugong Doosan Engine Co., Ltd., Doosan PSI LLC, Doosan Infracore Liaoning Machinery Sales
Co., Ltd and others
Others related parties:
Subsidiaries of the parent
company(*2)
Doota Mall Co., Ltd.(*3), Oricom Inc., Hancom Co., Ltd., Doosan DST Co., Ltd.,
Doosan Bears Inc.
Doosan Advertising (Beijing) Co., Ltd., Doosan Feed & Livestock Co., Ltd.,
DIP Holdings Co., Ltd., DRA Co., Ltd.,
Doosan Real Estate Securitization Specialty Co., Ltd.,
Doosan 2nd Real Estate Securitization Specialty Co., Ltd.,
Doosan Leadership Institute(*1), Doosan Mecatec Co., Ltd.(*1)
Doosan Hongkong Ltd.(DSH), Doosan Shanghai Chemical Limited
Doosan Electro-Materials Singapore Pte Ltd.(“DSES”),
Doosan Electro-Materials (Changshu) Co., Ltd.,
Doosan Electro-Materials America, LLC, Doosan Electro-Materials Luxembourg Sarl,
Doosan Electro-Materials(Shen Zhen) Limited,
Doosan Information and Communications America LLC,
Doosan Information and Communications China Co., Ltd.,
Doosan Information and Communications Europe Ltd.,
Doosan Industrial Vehicle Europe N.A., Doosan Industrial Vehicle U.K. Ltd.,
Doosan Industrial Vehicle America Corp., Doosan Industrial Vehicle Yantai Co., Ltd.,
Doosan Logistics Europe GmbH, Doosan Mottrol (Jiangyin) Co., Ltd.,
Doosan Fuel Cell America Inc., Circuit Foil Luxembourg Sarl and others
Associates and joint
ventures of the parent
company
Guang Dong Xingpu Steel Center, Doosan Eco Biz Net Co., Ltd., Prestoliteasia Co., Ltd., Sichuan Kelun-Doosan Biotechnology Company Limited,
Others Doosan Credit Union, Yonkang Foundation, Chung-Ang University, Dongdaemoon Miraechangcho Foundation,
A group of large-
enterprise affiliates (*4)
Bigant Co., Ltd., Neoplux Co., Ltd., Neoholdings Co.,Ltd. and others
(*1) Newly established in 2016.
(*2) In 2016, Doosan DST Co., Ltd was disposed and Doosan Real Estate
Securitization Specialty Co., Ltd was liquidated.
(*3) Doosan Tower Co., Ltd. changed its name into Doota Mall Co., Ltd. in 2016.
(*4) Although these companies are not applicable to related parties defined in K-
IFRS 1024 Paragraph 9, a group of large-size affiliates designated by the Korea
Fair Trade Commission are classified as related parties according to the
resolution by the Securities & Futures Commission in accordance with
substantial relationship defined in IFRS 1024 Paragraph 10.
-109-

(2) Significant operational transactions with related parties for the year ended December
31,2016 and 2015 are as follows (in millions of Korean won):
2016
Sales and others Purchases and others
Related party
Sales
Disposal of
property, plant
equipment
and intangible
assets
Other
revenue Purchase
Acquisition of
property, plant
and equipment
and intangible
assets
Other
expense
Parent:
Doosan Corp ₩69,738 ₩52,016 ₩1,284 ₩111,779 ₩29,869 ₩127,814
Associates and joint ventures:
Kyunggi Railroad Co., Ltd. 47,047 - - 3 - -
New Seoul Railway Corporation 10,661 - - 232 - -
Tamra Offshore Wind Power Co., Ltd., 39,767 - - - - -
Others
264 - 180 484 - -
Subtotal ₩97,739 ₩- ₩180 ₩719 ₩- ₩-
Other related parties:
Doota mall Co.,Ltd. 56,271 - - 620 - 6,581
Oricom Inc. 1,200 - 21 336 - 14,350
Hancom Co., Ltd. 830 5,325 - - - -
Doosan DST Co., Ltd. 3,177 - 28 - - -
Doosan Bears Inc. - - - 4 - 13,496 Doosan Information and
Communications America, LLC
- - 143 114 - 36,786
Doosan Information and Communications China Co., Ltd.
- - - 2 - 5,807
Doosan Information and
Communications Europe Ltd.
1,735 - - 31,311 - -
Doosan Leadership Institute 1,213 4 - 13 - 9,893
Doosan Mecatec Co., Ltd. 4,703 - 1 - - 9,031
Doosan Credit Union 1 5,325 - - - -
Chung-Ang University 18,533 - - 1,035 - 6,605
Others 258 - 14 13 - 992
Subtotal ₩87,921 ₩10,654 ₩207 ₩33,448 ₩- ₩103,541
Total
₩255,398 ₩62,670 ₩1,671 ₩145,946 ₩29,869 ₩231,355
-110-
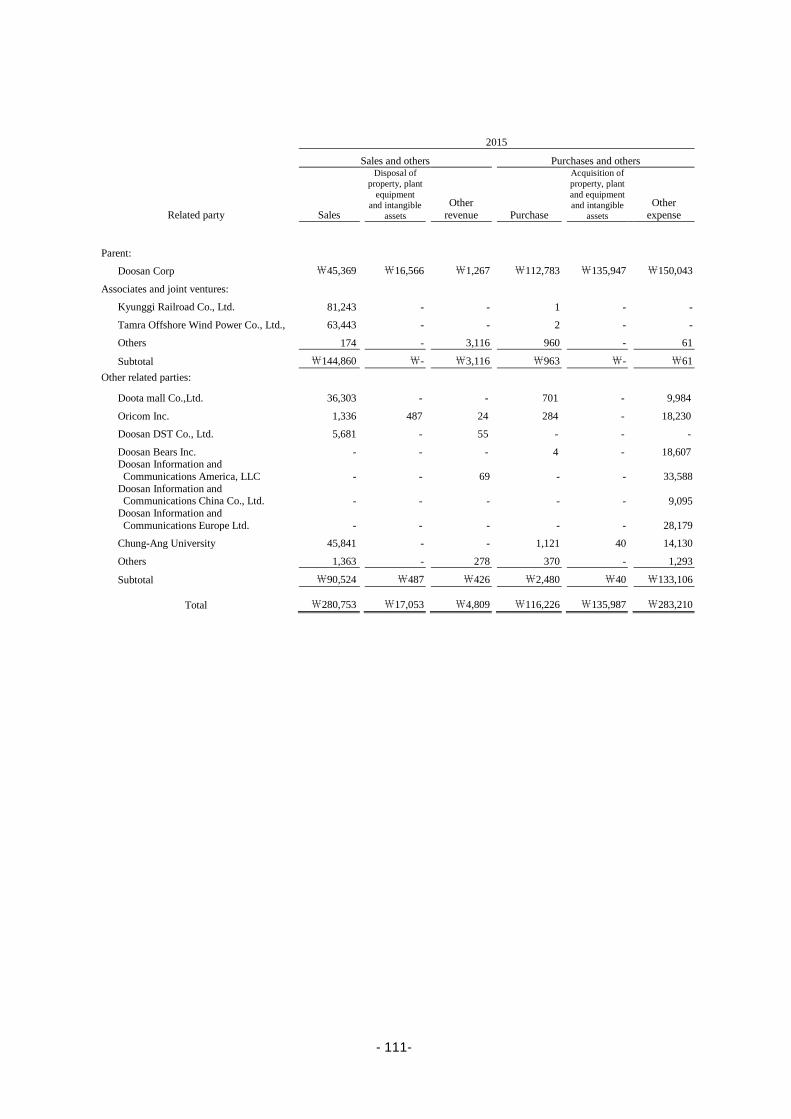
2015
Sales and others Purchases and others
Related party
Sales
Disposal of
property, plant
equipment
and intangible
assets
Other
revenue Purchase
Acquisition of
property, plant
and equipment
and intangible
assets
Other
expense
Parent:
Doosan Corp ₩45,369 ₩16,566 ₩1,267 ₩112,783 ₩135,947 ₩150,043
Associates and joint ventures:
Kyunggi Railroad Co., Ltd. 81,243 - - 1 - -
Tamra Offshore Wind Power Co., Ltd., 63,443 - - 2 - -
Others
174 - 3,116 960 - 61
Subtotal ₩144,860 ₩- ₩3,116 ₩963 ₩- ₩61
Other related parties:
Doota mall Co.,Ltd. 36,303 - - 701 - 9,984
Oricom Inc. 1,336 487 24 284 - 18,230
Doosan DST Co., Ltd. 5,681 - 55 - - -
Doosan Bears Inc. - - - 4 - 18,607 Doosan Information and
Communications America, LLC
- - 69 - - 33,588
Doosan Information and Communications China Co., Ltd.
- - - - - 9,095
Doosan Information and
Communications Europe Ltd.
- - - - - 28,179
Chung-Ang University 45,841 - - 1,121 40 14,130
Others 1,363 - 278 370 - 1,293
Subtotal ₩90,524 ₩487 ₩426 ₩2,480 ₩40 ₩133,106
Total
₩280,753 ₩17,053 ₩4,809 ₩116,226 ₩135,987 ₩283,210
-111-
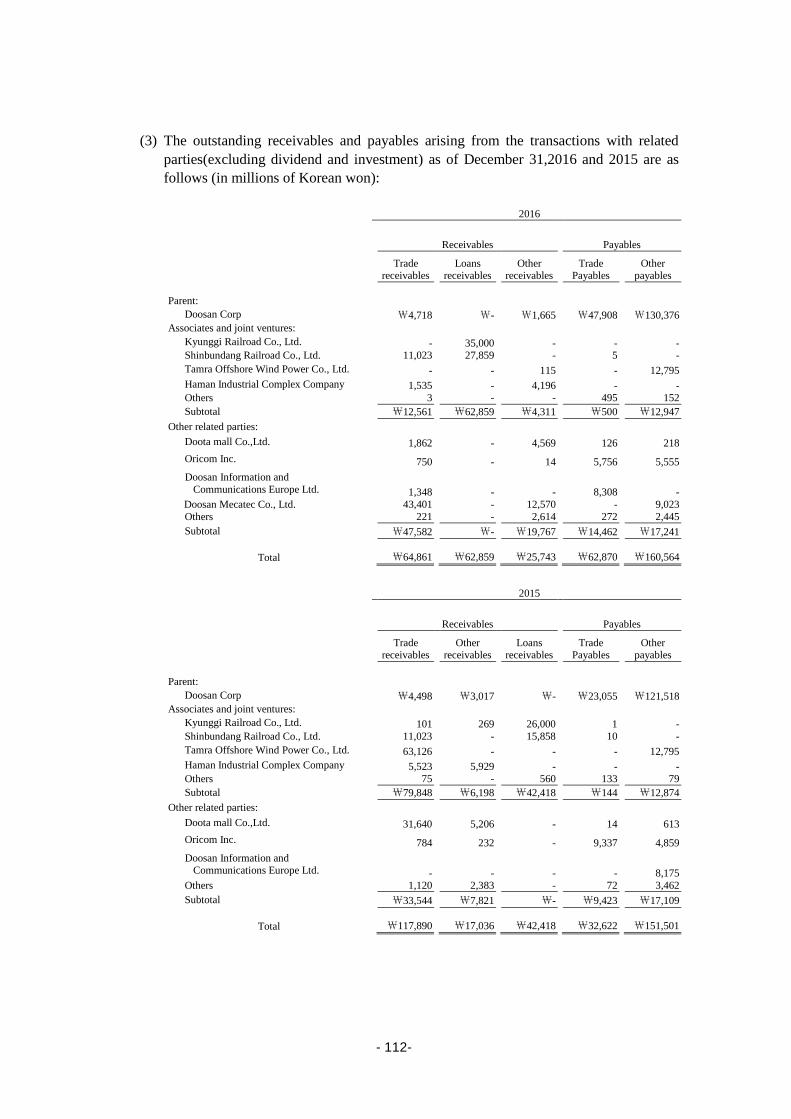
(3) The outstanding receivables and payables arising from the transactions with related
parties(excluding dividend and investment) as of December 31,2016 and 2015 are as
follows (in millions of Korean won):
2016
Receivables Payables
Trade receivables
Loans receivables
Other receivables
Trade Payables
Other payables
Parent:
Doosan Corp ₩4,718 ₩- ₩1,665 ₩47,908 ₩130,376
Associates and joint ventures:
Kyunggi Railroad Co., Ltd. - 35,000 - - - Shinbundang Railroad Co., Ltd. 11,023 27,859 - 5 -
Tamra Offshore Wind Power Co., Ltd. - - 115 - 12,795
Haman Industrial Complex Company 1,535 - 4,196 - -
Others 3 - - 495 152
Subtotal ₩12,561 ₩62,859 ₩4,311 ₩500 ₩12,947
Other related parties:
Doota mall Co.,Ltd. 1,862 - 4,569 126 218
Oricom Inc. 750 - 14 5,756 5,555
Doosan Information and
Communications Europe Ltd.
1,348 - - 8,308 -
Doosan Mecatec Co., Ltd. 43,401 - 12,570 - 9,023
Others 221 - 2,614 272 2,445
Subtotal ₩47,582 ₩- ₩19,767 ₩14,462 ₩17,241
Total
₩64,861 ₩62,859 ₩25,743 ₩62,870 ₩160,564
2015
Receivables Payables
Trade
receivables Other
receivables Loans
receivables Trade
Payables Other
payables
Parent:
Doosan Corp ₩4,498 ₩3,017 ₩- ₩23,055 ₩121,518
Associates and joint ventures:
Kyunggi Railroad Co., Ltd. 101 269 26,000 1 -
Shinbundang Railroad Co., Ltd. 11,023 - 15,858 10 -
Tamra Offshore Wind Power Co., Ltd. 63,126 - - - 12,795
Haman Industrial Complex Company 5,523 5,929 - - -
Others 75 - 560 133 79
Subtotal ₩79,848 ₩6,198 ₩42,418 ₩144 ₩12,874
Other related parties:
Doota mall Co.,Ltd. 31,640 5,206 - 14 613
Oricom Inc. 784 232 - 9,337 4,859
Doosan Information and
Communications Europe Ltd.
- - - - 8,175
Others 1,120 2,383 - 72 3,462
Subtotal ₩33,544 ₩7,821 ₩- ₩9,423 ₩17,109
Total
₩117,890 ₩17,036 ₩42,418 ₩32,622 ₩151,501
-112-

(4) Financial transactions (including investment) with related parties for the year ended
December 31,2016 and 2015 are as follows (in millions of Korean won):
2016
Loans Investments Dividend Equity
Loans Collection Received Provided Income Payout Disposal Purchase
Parents:
Doosan Corp ₩- ₩- ₩- ₩- ₩- ₩37,354 ₩33,217 ₩-
Other related parties:
Oricom Inc. - - - - - - 6,525 -
DIP Holdings co., ltd. - - - - - - 117,201 -
Doosan Mecatec Co., Ltd. - - - 117,201 - - - -
Subtotal ₩- ₩- ₩- ₩117,201 ₩- ₩- ₩123,726 ₩-
Associates and joint ventures:
Shinbundang Railroad Co., Ltd. 12,001 - - - - - - -
Tamra Offshore Wind Power Co., Ltd. - - - 2,016 - - - -
Kyunggi Railroad Co., Ltd. 9,000 - - - - - - -
New Seoul Railway Corporation 45 45 - 7,421 - - - -
KIAMCO - - - 23,149 - - - -
Doosan Infracore Liaoning Machinery
Sales Co., Ltd - - - 355 - -
- -
Subtotal ₩21,046 ₩45 ₩- ₩32,941 ₩- ₩- ₩- ₩-
Total ₩21,046 ₩45 ₩- ₩150,142 ₩- ₩37,354 ₩156,943 ₩-
2015
Loans Investments Dividend
Loans Collection Received Provided Income Payout
Parents:
Doosan Corp ₩- ₩- ₩- ₩- ₩- ₩32,959
Other related parties: Doosan Power Systems Pension Scheme - - 25,000 - - -
Associates and joint ventures:
Doosan (China) Financial Leasing Corp. 105,926 - - - - -
Power Solutions International, Inc. - - - 1,108 - - Kyunggi Railroad Co., Ltd. 13,700 - - - - -
New Seoul Railway Corporation 206 - - - - - Shinbundang Railroad Co., Ltd. 6,000 - - - - -
Subtotal ₩125,832 ₩- ₩- ₩1,108 ₩- ₩-
Total ₩125,832 ₩- ₩25,000 ₩1,108 ₩- ₩-
(5) The Group provides payment guarantees and collateral to certain related parties as of
December 31, 2016 (See Notes 33 and 34).
-113-

(6) Key management personnel are standing directors who have authorities and
responsibilities for planning, operation and control of the business of the Group.
Compensation for key management personnel for the year ended December 31,2016 and
2015 consists of following (in millions of Korean won):
2016 2015
Short-term employee benefits ₩70,333 ₩68,859
Severance and retirement
benefits
4,861 5,343
Share-based payment 463 1,258
Total
₩75,657 ₩75,460
36. CONSOLIDATED STATEMENTS OF CASH FLOWS:
(1) Details of non-cash and changes in operating assets and liabilities to reconcile profit for
the year ended December 31, 2016 and 2015 are as follows (in millions of Korean won):
2016 2015
Loss for the period:
₩(215,525) ₩(1,750,899)
Adjustments:
Interest expenses 518,020 630,155
Loss on foreign currency translation 174,397 311,102
Bad debt expenses 24,839 321,752
Other bad debt expenses 210,007 284,535
Loss on valuation of inventory(reversal) (16,201) 28,607
Loss on valuation of derivative financial instruments 224,664 318,405
Loss on valuation of firm commitments 76,489 89,306
Gain(Loss) on equity method investments 14,608 81,659
Depreciation 328,306 371,355
Amortization of intangible assets 203,952 214,125
Loss on disposal of property, plant and equipment 14,902 9,301
Impairment loss on property, plant and equipment 10,080 129,915
Impairment loss on intangible assets 156,114 196,904
Impairment loss on non-current assets classified as held-for-sale 66,938 71,811
Impairment loss on long-term financial instruments 32,393 -
Severance and retirement benefits 126,093 148,379
Share-based payments 324 985
Provision for construction warranties(reversal) (13,949) 28,230
Financial guarantee fee 5,446 21,807
Loss on redemption of bonds 9,844 350
Income tax expense 290,587 167,893
Interest income (41,019) (45,199)
Dividend income (304) (1,646)
Gain on foreign currency translation (128,752) (126,522)
Gain on valuation of derivative financial instruments (104,512) (142,608)
Gain on valuation of firm commitments (182,478) (297,431)
Gain on disposal of non-current assets classified as held-for-sale (1,102) 338
Gain on disposal of other non-current assets - (29,718)
Gain on disposal of discontinued operations (458,492) -
Others 126,321 13,018
Subtotal ₩1,667,515 ₩2,796,808
-114-

2016 2015
Changes in operating assets and liabilities:
Trade receivables 108,409 (41,587)
Due from customers for contract work (332,969) 10,505
Other receivables 29,047 (10,674)
Inventories 112,039 (140,137)
Other current assets (2,855) 40,187
Other non-current assets 4,281 18,335
Derivative financial assets and liabilities (133,048) (79,397)
Firm commitments assets and liabilities 82,915 106,759
Trade payables 528,147 (411,979)
Other payables 9,138 235,907
Due to customers for contract work (242,723) 85,848
Other current liabilities (64,668) (74,465)
Reserve for construction warranties 4,814 41,707
Reserve for other provision 282 882
Other non-current liabilities 122,878 (7,498)
Severance payments paid (110,957) (258,239)
Plan assets (74,842) 2,748
Others (2) 1,130
Subtotal ₩39,886 ₩(479,968)
Total
₩1,491,876 ₩565,941
(2) Significant transactions not involving cash flows for the year ended December 31,2016
and 2015 are as follows (in millions of Korean won):
2016 2015
Classification of assets(liabilities) classified as held for sale in
discontinued operations
₩86,044 ₩230,075
Transfer from construction-in-progress to another account 227,308 225,321
Transfer from property, plant and equipment to another account 219,684 74,964
Reclassification between short-term and long-term financial
instruments
- 50,417
Transfer to current portion of bonds and borrowings 1,024,297 925,528
Increase in other payables from acquisition of property, plant
and equipment
19,201 59,460
-115-
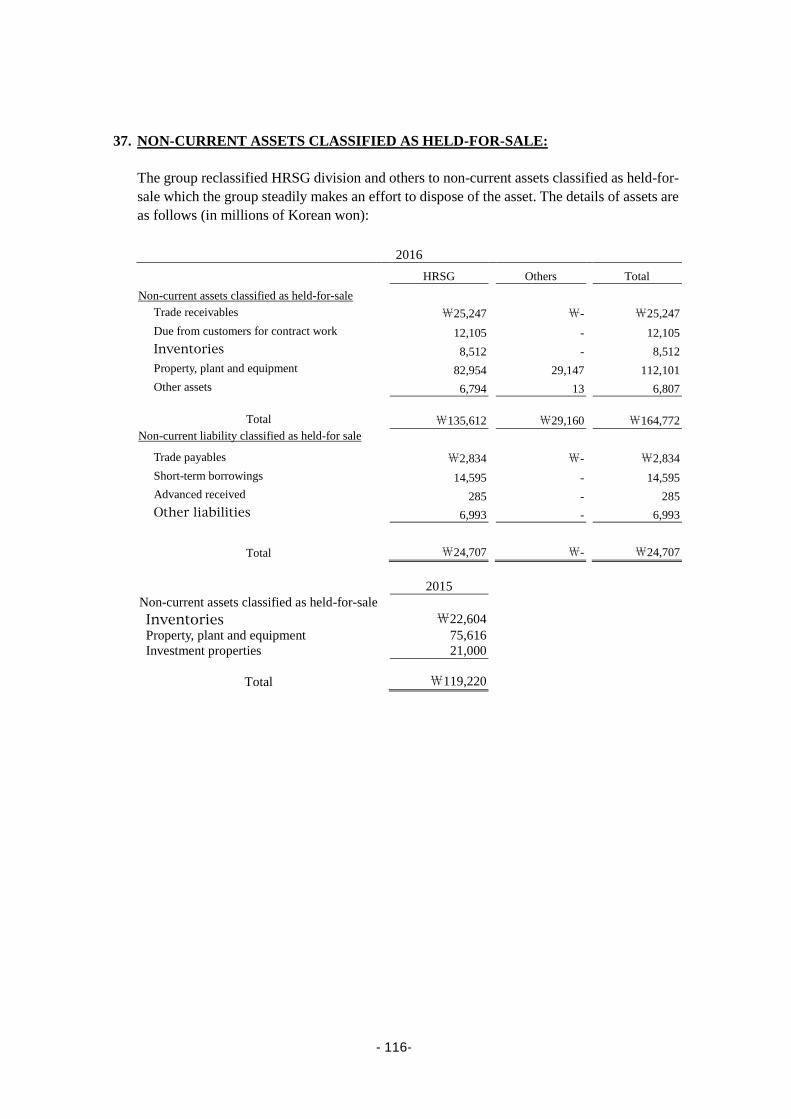
37. NON-CURRENT ASSETS CLASSIFIED AS HELD-FOR-SALE:
The group reclassified HRSG division and others to non-current assets classified as held-for-
sale which the group steadily makes an effort to dispose of the asset. The details of assets are
as follows (in millions of Korean won):
2016
HRSG Others Total
Non-current assets classified as held-for-sale
Trade receivables ₩25,247 ₩- ₩25,247
Due from customers for contract work 12,105 - 12,105
Inventories 8,512 - 8,512
Property, plant and equipment 82,954 29,147 112,101
Other assets 6,794 13 6,807
Total
₩135,612 ₩29,160 ₩164,772
Non-current liability classified as held-for sale
Trade payables ₩2,834 ₩- ₩2,834
Short-term borrowings 14,595 - 14,595
Advanced received 285 - 285
Other liabilities 6,993 - 6,993
Total
₩24,707 ₩- ₩24,707
2015
Non-current assets classified as held-for-sale
Inventories ₩22,604
Property, plant and equipment 75,616
Investment properties 21,000
Total ₩119,220
-116-

38. DISCONTINUED OPERATIONS:
(1) DEC, a subsidiary, disposed of both HRSG division and CPE (Chemical Process
Equipment) division in 2016. Additionally, the group steadily makes an effort to disposal
of the asset owned by DHI Vietnam Haipong Co., Ltd. And Doosan Heavy Industry
Vietnam Co., Ltd.
In 2016, DEC disposed its CPE (Chemical Process Equipment) division through
investment in kind agreement, and the company steadily makes an effort to dispose
HRSG division.
Business division Description
Rexcon
DEC, a subsidiary, discontinued and disposed the
division Rexcon in the prior period.
OSS DEC, a subsidiary, discontinued the division OSS in
the prior period.
Machine Tools business DI, a subsidiary, disposed the division Machine Tools
business in the current period.
HRSG 1) DEC : Disposal of the division HRSG
2) DVH (Subsidiary of DEC): DVH which is
related to the business of HRSG is on the process
of disposal. Division HRSG is classified to non-
current assets as held-for-sale.
3) VINA (Subsidiary of DHI): Division HRSG is
classified to non-current assets as held-for-sale.
CPE 1) DEC: Transferred to Doosan Mecatec.
2) Doosan Heavy Industries Vietnam Co., Ltd :
Division CPE is discontinued and assets of the
division is on the process of external disposal
(2) Discontinued division Machinery Tools business in DI and discontinued division
HRSG in DEC, are disposed As of December 31, 2016. The group reclassified HRSG
division and CPE division to non-current assets classified as held-for-sale which the
group steadily makes an effort to disposal of the asset by Doosan Heavy Industries
Vietnam Co. and DHI Vietnam Haipong Co., Ltd.(See note 37).
-117-

(3) The results of DEC and DI discontinued for the year ended December 31,2016 and 2015
are presented below (in millions of Korean won):
2016 Machine
Tools
business HRSG CPE Total Sales ₩313,348 ₩181,632 ₩169,482 ₩664,462
Cost of goods 241,571 158,750 156,541 556,862 Selling and administrative cost 48,909 18,387 18,806 86,102
Operating profit(loss) 22,868 4,495 (5,865) 21,498
Other non-operating income (expense) (10,608) (130,491) (19,607) (160,706)
Gain before income tax 12,260 (125,996) (25,472) (139,208)
Income tax expenses 5,944 98 - 6,042
Gain (loss) from discontinued operations ₩6,316 ₩(126,094) ₩(25,472) ₩(145,250)
Gain (loss) from disposal of discontinued operations 176,451 287,537 (3,579) 460,409 Income tax expense related to disposal of
discontinued operations
66,774 86,248 - 153,022
Subtotal ₩109,677 ₩201,289 ₩(3,579) ₩307,387
Gain (loss) of discontinued operations
₩115,993 ₩75,195 ₩(29,051) ₩162,137
2015
Machine Tools
business HRSG CPE OSS Rexcon Total
Sales ₩1,248,091 ₩164,226 ₩336,327 ₩976 ₩56,228 ₩1,805,848
Cost of goods 920,383 121,473 336,586 3,248 53,176 1,434,866
Selling and administrative cost 205,179 18,641 63,406 1,489 3,480 292,195
Operating profit(loss) 122,529 24,112 (63,665) (3,761) (428) 78,787
Other non-operating income (expense)
(5,539)
(4,651)
(20,597)
(2,744)
(5,914)
(39,445)
Gain before income tax 116,990 19,461 (84,262) (6,505) (6,342) 39,342
Income tax expenses 34,362 (155) - - - 34,207 Gain (loss) from discontinued
operations
82,628 19,616
(84,262) (6,505) (6,342) 5,135 Gain (loss) related to disposal of
discontinued operations
- -
- - (12,297) (12,297)
Gain (loss) of discontinued
operations
₩82,628 ₩19,616 ₩(84,262) ₩(6,505) ₩(18,639) ₩(7,162)
-118-
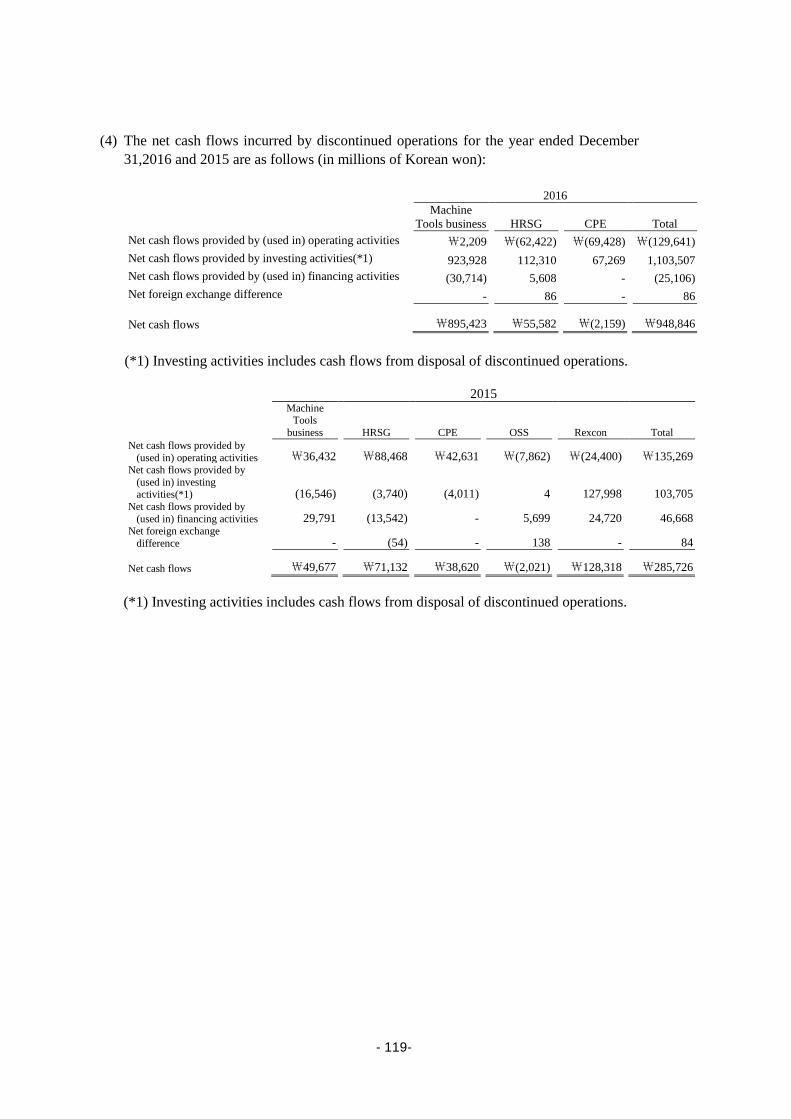
(4) The net cash flows incurred by discontinued operations for the year ended December
31,2016 and 2015 are as follows (in millions of Korean won):
2016
Machine
Tools business HRSG CPE Total
Net cash flows provided by (used in) operating activities ₩2,209 ₩(62,422) ₩(69,428) ₩(129,641)
Net cash flows provided by investing activities(*1) 923,928 112,310 67,269 1,103,507
Net cash flows provided by (used in) financing activities (30,714) 5,608 - (25,106)
Net foreign exchange difference - 86 - 86
Net cash flows
₩895,423 ₩55,582 ₩(2,159) ₩948,846
(*1) Investing activities includes cash flows from disposal of discontinued operations.
2015
Machine Tools
business HRSG CPE OSS Rexcon Total
Net cash flows provided by
(used in) operating activities ₩36,432 ₩88,468 ₩42,631 ₩(7,862) ₩(24,400) ₩135,269
Net cash flows provided by
(used in) investing activities(*1)
(16,546) (3,740) (4,011) 4 127,998 103,705 Net cash flows provided by
(used in) financing activities
29,791 (13,542) - 5,699 24,720 46,668 Net foreign exchange
difference
- (54) - 138 - 84
Net cash flows ₩49,677 ₩71,132 ₩38,620 ₩(2,021) ₩128,318 ₩285,726
(*1) Investing activities includes cash flows from disposal of discontinued operations.
-119-

39. BUSINESS COMBINATIONS:
(1) Details of business combination for the year ended December 31,2016 are summarized
as follows (in millions of Korean won):
Acquired company Principal activity
Date of
acquisition
Interest after
acquisition
Purchase
consideration
Doosan GridTech Inc. Software and System engineering June 30, 2016 100% ₩36,108
Doosan GridTech LLC Software and System engineering June 30, 2016 100%
The group acquired Doosan GridTech Inc. and Doosan GridTech LLC to penetrate ESS
(Energy Storage System) business and to enhance the competitiveness of related business
by obtaining core technologies of Energy Storage System.
(2) Purchase consideration arising from the business combinations for the year ended
December 31,2016 is as follows (in millions of Korean won):
Amount
Cash and cash equivalent ₩36,108
(3) Fair value of the identifiable assets and liabilities arising from the business combinations
for the year ended December 31,2016 are as follows (in millions of Korean won):
Amount Fair value of identifiable assets: ₩13,103
Current assets 6,247
Non-current assets 6,856
Fair value of identifiable liabilities: 6,651
Current liabilities 4,338
Non-current liabilities 2,313
Fair value of identifiable net assets 6,452
(4) Net cash outflow arising from the business combinations for the year ended December
31,2016 is as follows
Amount Purchase by cash and cash equivalent ₩36,108
Less : Acquisition of cash and cash equivalent 4,267
Total ₩31,841
-120-
40. SUBSEQUENT EVENT:
(1) The Group announced that it will issue KRW 500,000 million of bonds with warrants on
May 4, 2017. The issuance of bonds with warrants was approved by the board of directors
on February 27, 2017.
① Maturity Date : a 5-year maturity, May 4, 2022
② Coupon rate : 1.00%
③ YTM : 2.00%, 105,245% of the principal amount will be paid at maturity
④ Advanced redemption right: the redeemable put option that allows investors to redeem
them three years post issuance (May 4, 2020). 103.0839% of the principal amount will
be paid.
⑤ The warrant exercise price: ₩26,550/share (projection)
⑥ The warrant exercise ratio: one registered common stock per one security of stock
warrant.
(2) On February 16, 2017, Korea Gas Corporation filed the lawsuit of KRW 200,000 million
against each of total 13 construction companies including the Group.
41. APPROVAL OF FINANCIAL STATEMENTS:
The financial statements were issued and approved on February 16, 2017, and will get final
approval during the shareholders’ meeting on March 31, 2017.
-121-