consolidated financial highlights - shionogi
TRANSCRIPT

Sales and profits down in fiscal 2019
ROE, ROIC, and CCC
Working hard to ensure that shareholders also can experience growth
Royalty income from others
Milestone payments from Roche in connection with development progress
Royalty income and dividend income from ViiV Healthcare
Royalty income from AstraZeneca
(Billions of yen)
(Billions of yen)
(Billions of yen)
200.0
150.0
100.0
50.0
0
(FY)2013 2014 2015 2016 2017 2018 2019
71.171.1 81.581.5
111.6111.6132.3132.3
208.6208.6191.9191.9
180.1180.1
400.0
300.0
200.0
100.0
0
(FY)2015 2016 2017 201920182018JGAAP
JGAAP
JGAAP
IFRS
310.0310.0338.9338.9 344.7344.7 363.7363.7 368.0368.0
333.4333.4
200.0
150.0
100.0
50.0
0
(FY)2015 2016 20192017
100.9100.9123.0123.0
138.7138.7 151.8151.8
2018
166.6166.6
(Billions of yen)
150.0
100.0
50.0
0
(FY)2015 2016 2017 201920182018JGAAP IFRS
91.491.4108.2108.2 115.2115.2
138.5138.5 145.1145.1130.6130.6
(Billions of yen)
150.0
100.0
50.0
0
(FY)2015 2016 2017 201920182018JGAAP IFRS
66.766.783.983.9
108.9108.9132.8132.8 137.2137.2
122.2122.2
(%)
25
20
15
10
5
0
(FY)2015 2016 2017 201920182018JGAAP IFRS
13.613.616.316.3
19.419.420.920.9
17.817.815.515.5
(%)
20
15
10
5
0
(FY)2015 2016 2017 201920182018JGAAP IFRS
(months)
12
9
6
3
0
(FY)2015 2016 2017 201920182018JGAAP IFRS
11.811.813.313.3
14.914.916.516.5
14.014.0 13.213.2 7.67.66.76.7
6.26.2
8.98.9 8.88.87.77.7
(yen)
120
100
80
60
40
20
0
(FY)2012 201520142013 2016 2017 20192018
4242 46465252
62627272
82829494
103103
Eight consecutiveyears of dividend
growth
• Royalty income reached ¥127.1 billion (up 2.1% year on year) on the back of a steady increase in global product sales in the HIV franchise.
• Dividend income was stable, underpinned by favorable earnings at ViiV Healthcare’s global HIV business.
• Shionogi received milestone payments from Roche in connection with progress in global development for the flu drug Xofluza, but the amount was less than in the previous year when multiple payments were received.
Shionogi has adopted International Financial Reporting Standards (IFRS) from the fiscal year ended March 31, 2020. The financial figures are shown for both JGAAP and IFRS for the fiscal year ended March 31, 2019.
• Continuous dividend increases
• Flexible share buybacks and retirement of treasury shares
• Fiscal 2019: Approx. 7.79 million shares acquired and 5.20 million treasury shares retired (resolution passed on March 30, 2020 and shares retired on April 6)
Return on equity (ROE),*1 return on invested capital (ROIC),*2 and cash conversion cycle (CCC)*3 were set as key indicators for the quantitative targets of growth, efficiency, and shareholder returns in the previous Medium-Term Business Plan (SGS2020) updated in October 2016. In the fiscal year ended March 31, 2020, ROE was 15.5% (down 2.3 points year on year), ROIC was 13.2% (down 0.8 point), and CCC was 7.7 months (a 1.1 month improvement from the previous year). Moving forward, we will work to achieve the management indicators set out in STS2030.
Decline in royalty income
Revenue
ROE
Dividends per share
ROIC CCC
Ordinary income
Operating profit
Profit attributable to owners of parent
Royalty income and dividend income from ViiV Healthcare
• Revenue fell 9.4% year on year to ¥333.4 billion.Among the main components of revenue, exports and overseas subsidiary sales were ¥30.8 billion (up 1.1% year on year), but overall revenue fell due to a decline in domestic prescription drug sales, royalty income, and milestone income.
• Operating profit and profit attributable to owners of parent also declined.
*1 Profit attributable to owners of parent ÷ (Shareholders’ equity + accumulated other comprehensive income) × 100 (%)*2 After-tax operating income ÷ (Interest bearing debt + Shareholders’ equity + Non-controlling interests) × 100 (%)*3 The number of days between investing cash (for raw materials, product purchases, etc.) and the time when that is ultimately converted into cash again. (This indicator is
used for capital efficiency.)
Consolidated Financial Highlights
85 86SHIONOGI INTEGRATED REPORT 2020 SHIONOGI INTEGRATED REPORT 2020
Value C
reation
Story
Value C
reation
Strategy
Addressing M
aterial IssuesD
ata Section

Second Medium-Term Business Plan Third Medium-Term Business Plan Shionogi Growth Strategy 2020 (SGS2020)
Accelerating progressExpansion of R&D and establishment of global structure
SONG for the Real GrowthProgress toward global growth
Aim to grow as a drug discovery-based pharmaceutical company
JGAAP 2010 2011 2012 2013 2014 2015 2016 2017 2018 2019 International Financial Reporting Standards (IFRS) 2019
2020 2020
For the years ended March 31: (Millions of yen) For the years ended March 31: (Millions of yen)
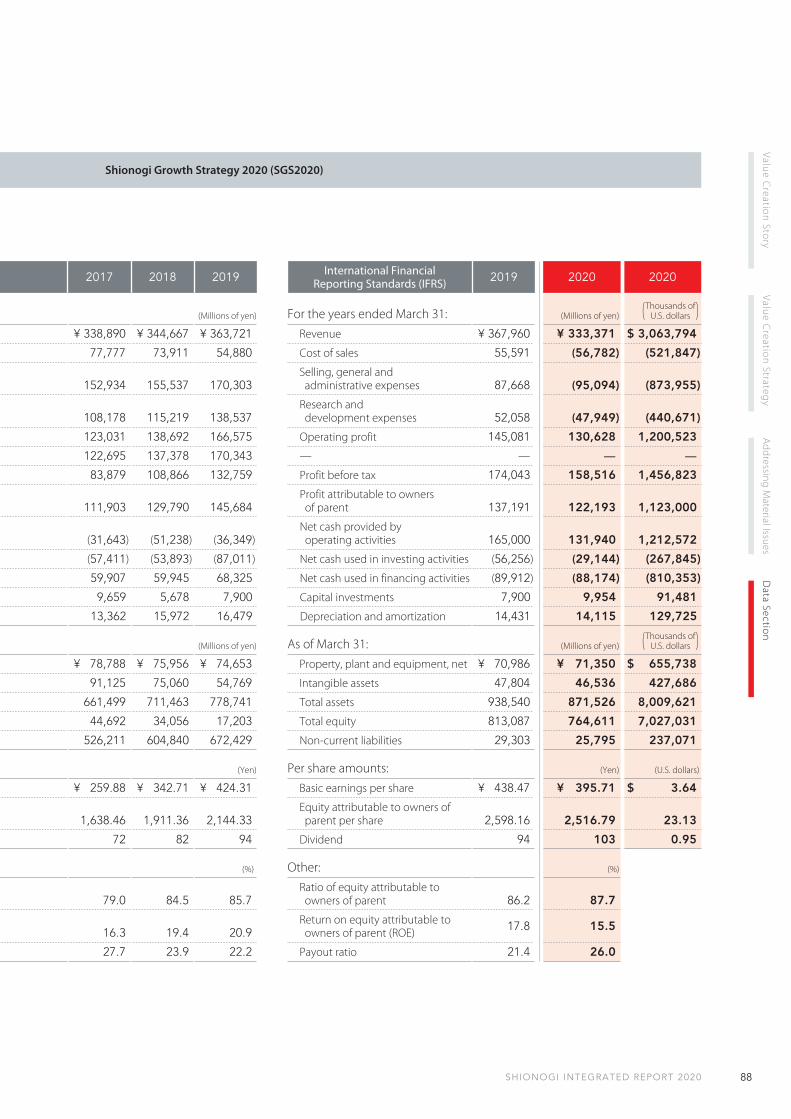
Net sales ¥ 278,502 ¥ 282,350 ¥ 267,275 ¥ 282,903 ¥ 289,717 ¥ 273,991 ¥ 309,973 ¥ 338,890 ¥ 344,667 ¥ 363,721 Revenue ¥ 367,960 ¥ 333,371 $ 3,063,794
Cost of sales 76,263 81,737 77,753 78,574 77,993 82,189 74,758 77,777 73,911 54,880 Cost of sales 55,591 (56,782) (521,847)
Selling, general and administrative expenses 149,801 153,720 142,518 144,764 149,848 141,436 143,808 152,934 155,537 170,303
Selling, general and administrative expenses 87,668 (95,094) (873,955)
Operating income 52,438 46,892 47,003 59,565 61,875 50,365 91,406 108,178 115,219 138,537Research and development expenses 52,058 (47,949) (440,671)
Ordinary income 50,522 45,176 46,093 58,922 62,225 77,880 100,869 123,031 138,692 166,575 Operating profit 145,081 130,628 1,200,523
Profit before income taxes 58,540 33,135 41,494 58,306 63,188 82,051 97,452 122,695 137,378 170,343 — — — —
Profit attributable to owners of parent 38,625 20,026 27,101 66,727 40,618 44,060 66,687 83,879 108,866 132,759 Profit before tax 174,043 158,516 1,456,823
Net cash provided by operating activities 52,901 56,528 54,724 59,276 79,496 45,604 102,290 111,903 129,790 145,684
Profit attributable to owners of parent 137,191 122,193 1,123,000
Net cash used in investing activities (826) (13,947) (38,290) (19,959) (20,040) (31,696) (32,894) (31,643) (51,238) (36,349)Net cash provided by operating activities 165,000 131,940 1,212,572
Net cash used in financing activities (4,978) (27,011) (27,749) (37,687) (53,798) (46,211) (18,525) (57,411) (53,893) (87,011) Net cash used in investing activities (56,256) (29,144) (267,845)
Research and development expenses 51,808 50,921 53,599 53,021 53,605 48,870 49,787 59,907 59,945 68,325 Net cash used in financing activities (89,912) (88,174) (810,353)
Capital investments 12,546 17,967 13,233 11,447 8,962 8,163 9,943 9,659 5,678 7,900 Capital investments 7,900 9,954 91,481
Depreciation and amortization 18,047 17,966 16,282 11,912 12,912 12,672 12,578 13,362 15,972 16,479 Depreciation and amortization 14,431 14,115 129,725
As of March 31: (Millions of yen) As of March 31: (Millions of yen)
Property, plant and equipment, net ¥ 62,447 ¥ 70,220 ¥ 74,282 ¥ 78,473 ¥ 78,976 ¥ 77,022 ¥ 78,673 ¥ 78,788 ¥ 75,956 ¥ 74,653 Property, plant and equipment, net ¥ 70,986 ¥ 71,350 $ 655,738
Intangible assets 119,065 99,593 106,694 70,464 72,824 80,328 71,626 91,125 75,060 54,769 Intangible assets 47,804 46,536 427,686
Total assets 540,761 523,242 522,161 574,882 580,566 595,067 631,599 661,499 711,463 778,741 Total assets 938,540 871,526 8,009,621
Total long-term liabilities 131,955 115,325 92,899 53,041 33,721 48,427 45,739 44,692 34,056 17,203 Total equity 813,087 764,611 7,027,031
Total net assets 341,976 328,096 347,198 423,633 467,836 478,883 513,877 526,211 604,840 672,429 Non-current liabilities 29,303 25,795 237,071
Per share amounts: (Yen) Per share amounts: (Yen) (U.S. dollars)
Profit attributable to owners of parent ¥ 115.33 ¥ 59.80 ¥ 80.93 ¥ 199.25 ¥ 121.29 ¥ 132.67 ¥ 204.83 ¥ 259.88 ¥ 342.71 ¥ 424.31 Basic earnings per share ¥ 438.47 ¥ 395.71 $ 3.64
Net assets 1,019.71 979.69 1,027.83 1,254.44 1,385.11 1,456.70 1,564.73 1,638.46 1,911.36 2,144.33Equity attributable to owners of parent per share 2,598.16 2,516.79 23.13
Dividend 36 40 40 42 46 52 62 72 82 94 Dividend 94 103 0.95
Other: (%) Other: (%)
Equity ratio 63.2 62.7 65.9 73.1 79.9 79.7 80.7 79.0 84.5 85.7Ratio of equity attributable to owners of parent 86.2 87.7
Return on equity [ROE] 11.9 6.0 8.1 17.5 9.2 9.4 13.6 16.3 19.4 20.9Return on equity attributable to owners of parent (ROE) 17.8 15.5
Payout ratio 31.2 66.9 49.4 21.1 37.9 39.2 30.3 27.7 23.9 22.2 Payout ratio 21.4 26.0
Thousands of U.S. dollars( )
Thousands of U.S. dollars( )
Notes: 1. From the fiscal year ended March 31, 2015, the Company has adopted a new accounting standard for research and development expenses (business research expenses). This change has been reflected in figures for the fiscal year ended March 31, 2014.
2. In the fiscal year ended March 31, 2019, the Company changed the presentation method for tax effect accounting. The change has been reflected in figures for the fiscal year ended March 31, 2015, and subsequent periods.
3. International Financial Reporting Standards (IFRS): Accounting standards defined by the non-government organization International Accounting Standards Board (IASB) headquartered in London.
4. IFRS adopted from the fiscal year ended March 31, 2020
Consolidated 11-Year Financial Summary
87 88SHIONOGI INTEGRATED REPORT 2020 SHIONOGI INTEGRATED REPORT 2020
Value C
reation
Story
Value C
reation
Strategy
Addressing M
aterial IssuesD
ata Section
Second Medium-Term Business Plan Third Medium-Term Business Plan Shionogi Growth Strategy 2020 (SGS2020)
Accelerating progressExpansion of R&D and establishment of global structure
SONG for the Real GrowthProgress toward global growth
Aim to grow as a drug discovery-based pharmaceutical company
JGAAP 2010 2011 2012 2013 2014 2015 2016 2017 2018 2019 International Financial Reporting Standards (IFRS) 2019
2020 2020
For the years ended March 31: (Millions of yen) For the years ended March 31: (Millions of yen)
Net sales ¥ 278,502 ¥ 282,350 ¥ 267,275 ¥ 282,903 ¥ 289,717 ¥ 273,991 ¥ 309,973 ¥ 338,890 ¥ 344,667 ¥ 363,721 Revenue ¥ 367,960 ¥ 333,371 $ 3,063,794
Cost of sales 76,263 81,737 77,753 78,574 77,993 82,189 74,758 77,777 73,911 54,880 Cost of sales 55,591 (56,782) (521,847)
Selling, general and administrative expenses 149,801 153,720 142,518 144,764 149,848 141,436 143,808 152,934 155,537 170,303
Selling, general and administrative expenses 87,668 (95,094) (873,955)
Operating income 52,438 46,892 47,003 59,565 61,875 50,365 91,406 108,178 115,219 138,537Research and development expenses 52,058 (47,949) (440,671)
Ordinary income 50,522 45,176 46,093 58,922 62,225 77,880 100,869 123,031 138,692 166,575 Operating profit 145,081 130,628 1,200,523
Profit before income taxes 58,540 33,135 41,494 58,306 63,188 82,051 97,452 122,695 137,378 170,343 — — — —
Profit attributable to owners of parent 38,625 20,026 27,101 66,727 40,618 44,060 66,687 83,879 108,866 132,759 Profit before tax 174,043 158,516 1,456,823
Net cash provided by operating activities 52,901 56,528 54,724 59,276 79,496 45,604 102,290 111,903 129,790 145,684
Profit attributable to owners of parent 137,191 122,193 1,123,000
Net cash used in investing activities (826) (13,947) (38,290) (19,959) (20,040) (31,696) (32,894) (31,643) (51,238) (36,349)Net cash provided by operating activities 165,000 131,940 1,212,572
Net cash used in financing activities (4,978) (27,011) (27,749) (37,687) (53,798) (46,211) (18,525) (57,411) (53,893) (87,011) Net cash used in investing activities (56,256) (29,144) (267,845)
Research and development expenses 51,808 50,921 53,599 53,021 53,605 48,870 49,787 59,907 59,945 68,325 Net cash used in financing activities (89,912) (88,174) (810,353)
Capital investments 12,546 17,967 13,233 11,447 8,962 8,163 9,943 9,659 5,678 7,900 Capital investments 7,900 9,954 91,481
Depreciation and amortization 18,047 17,966 16,282 11,912 12,912 12,672 12,578 13,362 15,972 16,479 Depreciation and amortization 14,431 14,115 129,725
As of March 31: (Millions of yen) As of March 31: (Millions of yen)
Property, plant and equipment, net ¥ 62,447 ¥ 70,220 ¥ 74,282 ¥ 78,473 ¥ 78,976 ¥ 77,022 ¥ 78,673 ¥ 78,788 ¥ 75,956 ¥ 74,653 Property, plant and equipment, net ¥ 70,986 ¥ 71,350 $ 655,738
Intangible assets 119,065 99,593 106,694 70,464 72,824 80,328 71,626 91,125 75,060 54,769 Intangible assets 47,804 46,536 427,686
Total assets 540,761 523,242 522,161 574,882 580,566 595,067 631,599 661,499 711,463 778,741 Total assets 938,540 871,526 8,009,621
Total long-term liabilities 131,955 115,325 92,899 53,041 33,721 48,427 45,739 44,692 34,056 17,203 Total equity 813,087 764,611 7,027,031
Total net assets 341,976 328,096 347,198 423,633 467,836 478,883 513,877 526,211 604,840 672,429 Non-current liabilities 29,303 25,795 237,071
Per share amounts: (Yen) Per share amounts: (Yen) (U.S. dollars)
Profit attributable to owners of parent ¥ 115.33 ¥ 59.80 ¥ 80.93 ¥ 199.25 ¥ 121.29 ¥ 132.67 ¥ 204.83 ¥ 259.88 ¥ 342.71 ¥ 424.31 Basic earnings per share ¥ 438.47 ¥ 395.71 $ 3.64
Net assets 1,019.71 979.69 1,027.83 1,254.44 1,385.11 1,456.70 1,564.73 1,638.46 1,911.36 2,144.33Equity attributable to owners of parent per share 2,598.16 2,516.79 23.13
Dividend 36 40 40 42 46 52 62 72 82 94 Dividend 94 103 0.95
Other: (%) Other: (%)
Equity ratio 63.2 62.7 65.9 73.1 79.9 79.7 80.7 79.0 84.5 85.7Ratio of equity attributable to owners of parent 86.2 87.7
Return on equity [ROE] 11.9 6.0 8.1 17.5 9.2 9.4 13.6 16.3 19.4 20.9Return on equity attributable to owners of parent (ROE) 17.8 15.5
Payout ratio 31.2 66.9 49.4 21.1 37.9 39.2 30.3 27.7 23.9 22.2 Payout ratio 21.4 26.0
Thousands of U.S. dollars( )
Thousands of U.S. dollars( )
Notes: 1. From the fiscal year ended March 31, 2015, the Company has adopted a new accounting standard for research and development expenses (business research expenses). This change has been reflected in figures for the fiscal year ended March 31, 2014.
2. In the fiscal year ended March 31, 2019, the Company changed the presentation method for tax effect accounting. The change has been reflected in figures for the fiscal year ended March 31, 2015, and subsequent periods.
3. International Financial Reporting Standards (IFRS): Accounting standards defined by the non-government organization International Accounting Standards Board (IASB) headquartered in London.
4. IFRS adopted from the fiscal year ended March 31, 2020
Consolidated 11-Year Financial Summary
87 88SHIONOGI INTEGRATED REPORT 2020 SHIONOGI INTEGRATED REPORT 2020
Value C
reation
Story
Value C
reation
Strategy
Addressing M
aterial IssuesD
ata Section

(Millions of yen) (Thousands of U.S. dollars)
As of April 1, 2018(Transition date)
As of March 31, 2019
As of March 31, 2020
As of March 31, 2020
Assets
Non-current assets:
Property, plant and equipment (Notes 11, 14) ¥ 72,165 ¥ 70,986 ¥ 71,350 $ 655,738
Goodwill (Note 12) 10,767 3,358 10,854 99,760
Intangible assets (Notes 13, 14) 42,453 47,804 46,536 427,686
Right-of-use assets (Note 15) 5,320 5,915 4,657 42,808
Other financial assets (Notes 16, 29) 299,586 302,709 202,161 1,857,929
Retirement benefit asset (Note 24) 10,340 — — —
Deferred tax assets (Note 9) 378 534 3,048 28,017
Other non-current assets (Notes 14, 20) 6,895 13,586 16,890 155,232
Total non-current assets 447,908 444,895 355,500 3,267,168
Current assets:
Inventories (Note 17) 30,846 35,125 33,818 310,804
Trade receivables (Notes 18, 29) 82,140 100,951 79,804 733,431
Other financial assets (Notes 16, 29) 110,551 150,530 171,157 1,572,998
Income taxes receivable (Note 9) 59 395 192 1,772
Other current assets (Note 20) 10,083 10,840 22,191 203,944
Cash and cash equivalents (Note 19) 176,135 195,800 208,861 1,919,503
Total current assets 409,816 493,645 516,026 4,742,453
Total assets 857,725 938,540 871,526 8,009,621
Consolidated statement of financial position
Consolidated Financial Statements
(Millions of yen) (Thousands of U.S. dollars)
Year ended March 31, 2019
Year ended March 31, 2020
Year ended March 31, 2020
Revenue (Note 5) ¥ 367,960 ¥ 333,371 $ 3,063,794Cost of sales (55,591) (56,782) (521,847)Gross profit 312,369 276,589 2,541,947Selling, general and administrative expenses (Note 6) (87,668) (95,094) (873,955)Research and development expenses (52,058) (47,949) (440,671)Amortization of intangible assets associated with products (Note 13) (4,273) (3,255) (29,923)Other income (Note 7) 1,394 4,291 39,437Other expenses (Note 7) (24,680) (3,951) (36,314)Operating profit 145,081 130,628 1,200,523Finance income (Notes 8, 16) 32,371 30,504 280,344Finance costs (Note 8) (3,409) (2,616) (24,044)Profit before tax 174,043 158,516 1,456,823Income tax expense (Note 9) (37,124) (36,322) (333,814)Profit 136,918 122,194 1,123,009
Profit attributable toOwners of parent 137,191 122,193 1,123,000Non-controlling interests (272) 1 9
Earnings per share (Yen) (U.S. dollars)
Basic earnings per share (Note 10) ¥ 438.47 ¥ 395.71 $ 3.64Diluted earnings per share (Note 10) 434.71 395.28 3.63
(Millions of yen) (Thousands of U.S. dollars)
Year ended March 31, 2019
Year ended March 31, 2020
Year ended March 31, 2020
Profit ¥ 136,918 ¥ 122,194 $ 1,123,009Other comprehensive income
Items that will not be reclassified to profit or lossNet change in fair value of equity instruments designated as measured at fair value through other comprehensive income (Notes 16, 21) 22,581 (62,544) (574,804)Remeasurements of defined benefit plans (Notes 21, 24) (13,889) 503 4,630
Total of items that will not be reclassified to profit or loss 8,692 (62,040) (570,175)Items that may be reclassified to profit or loss
Exchange differences on translation of foreign operations (Note 21) (7,721) (26,247) (241,221)Effective portion of cash flow hedges (Notes 21, 29) (510) 2,474 22,741
Total of items that may be reclassified to profit or loss (8,232) (23,772) (218,480)Total other comprehensive income (loss), net of tax 460 (85,813) (788,655)Comprehensive income 137,378 36,381 334,354
Comprehensive income attributable toOwners of parent 137,926 36,594 336,318Non-controlling interests (547) (213) (1,963)
Consolidated statement of profit or loss
Consolidated statement of comprehensive income
Note: See notes to Consolidated Financial Statements Year ended March 31 with Independent Auditor’s Report.
Notes: IFRS adopted from the fiscal year ended March 31, 2020 See notes to Consolidated Financial Statements Year ended March 31 with Independent Auditor’s Report.
Note: See notes to Consolidated Financial Statements Year ended March 31 with Independent Auditor’s Report.
89 90SHIONOGI INTEGRATED REPORT 2020 SHIONOGI INTEGRATED REPORT 2020
Value C
reation
Story
Value C
reation
Strategy
Addressing M
aterial IssuesD
ata Section
(Millions of yen)
Share capital
Capital surplus
Treasury shares
Retained earnings
Other components
of equity
Equity attributable to owners of parent
Non-controlling
interests
Total equity
Balance as of April 1, 2018 ¥ 21,279 ¥ 21,055 ¥ (36,641) ¥ 545,498 ¥ 179,365 ¥ 730,557 ¥ 4,257 ¥ 734,814
Profit 137,191 137,191 (272) 136,918
Total other comprehensive income, net of tax (Note 21) 734 734 (274) 460
Comprehensive income 137,191 734 137,926 (547) 137,378
Purchase of treasury shares (Note 21) (50,020) (50,020) (50,020)
Disposal of treasury shares (Note 21) (1,481) 19,174 17,693 17,693
Cancellation of treasury shares (Note 21) (38,604) 38,604 — —
Dividends (Note 21) (27,669) (27,669) (27,669)
Increase by business combination — —
Changes in ownership interest in subsidiaries 288 288 604 892
Transfer from other components of equity to retained earnings (Note 21) (1,516) 1,516 — —
Other 40,019 (40,020) (0) (1) (1)
Balance as of March 31,2019 ¥ 21,279 ¥ 21,277 ¥ (28,882) ¥ 613,483 ¥ 181,616 ¥ 808,774 ¥ 4,313 ¥ 813,087
Profit 122,193 122,193 1 122,194
Total other comprehensive income, net of tax (Note 21) (85,598) (85,598) (214) (85,813)
Comprehensive income 122,193 (85,598) 36,594 (213) 36,381
Purchase of treasury shares (Note 21) (50,012) (50,012) (50,012)
Disposal of treasury shares (Note 21) (509) 1,602 1,092 1,092
Cancellation of treasury shares — —
Dividends (Note 21) (31,134) (31,134) (31,134)
Increase by business combination (Note 32) — 90 90
Changes in ownership interest in subsidiaries (755) (755) (4,187) (4,942)
Transfer from other components of equity to retained earnings (Note 21) 4,169 (4,169) — —
Other 420 (420) 0 49 49
Balance as of March 31, 2020 ¥ 21,279 ¥ 20,432 ¥ (77,292) ¥ 708,291 ¥ 91,848 ¥ 764,560 ¥ 51 ¥ 764,611
Consolidated statement of changes in equity
Consolidated Financial Statements
(Millions of yen) (Thousands of U.S. dollars)
As of April 1, 2018(Transition date)
As of March 31, 2019
As of March 31, 2020
As of March 31, 2020
Equity and liabilities
Equity
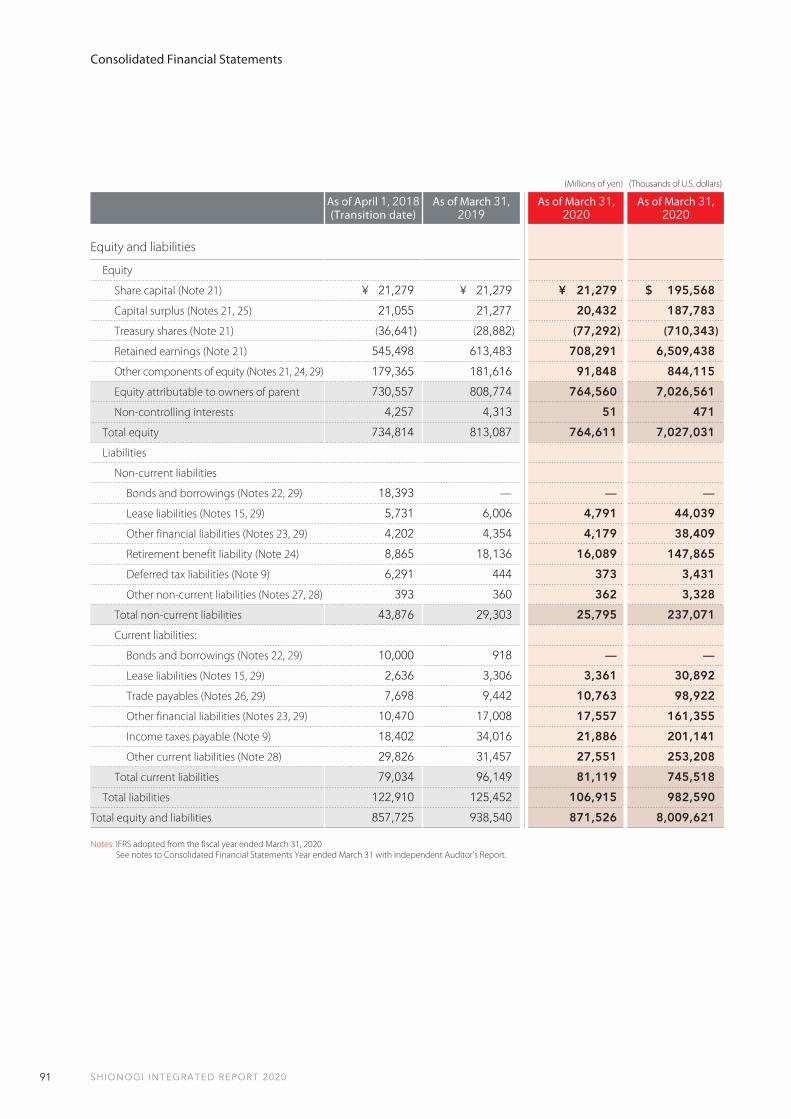
Share capital (Note 21) ¥ 21,279 ¥ 21,279 ¥ 21,279 $ 195,568
Capital surplus (Notes 21, 25) 21,055 21,277 20,432 187,783
Treasury shares (Note 21) (36,641) (28,882) (77,292) (710,343)
Retained earnings (Note 21) 545,498 613,483 708,291 6,509,438
Other components of equity (Notes 21, 24, 29) 179,365 181,616 91,848 844,115
Equity attributable to owners of parent 730,557 808,774 764,560 7,026,561
Non-controlling interests 4,257 4,313 51 471
Total equity 734,814 813,087 764,611 7,027,031
Liabilities
Non-current liabilities
Bonds and borrowings (Notes 22, 29) 18,393 — — —
Lease liabilities (Notes 15, 29) 5,731 6,006 4,791 44,039
Other financial liabilities (Notes 23, 29) 4,202 4,354 4,179 38,409
Retirement benefit liability (Note 24) 8,865 18,136 16,089 147,865
Deferred tax liabilities (Note 9) 6,291 444 373 3,431
Other non-current liabilities (Notes 27, 28) 393 360 362 3,328
Total non-current liabilities 43,876 29,303 25,795 237,071
Current liabilities:
Bonds and borrowings (Notes 22, 29) 10,000 918 — —
Lease liabilities (Notes 15, 29) 2,636 3,306 3,361 30,892
Trade payables (Notes 26, 29) 7,698 9,442 10,763 98,922
Other financial liabilities (Notes 23, 29) 10,470 17,008 17,557 161,355
Income taxes payable (Note 9) 18,402 34,016 21,886 201,141
Other current liabilities (Note 28) 29,826 31,457 27,551 253,208
Total current liabilities 79,034 96,149 81,119 745,518
Total liabilities 122,910 125,452 106,915 982,590
Total equity and liabilities 857,725 938,540 871,526 8,009,621
Notes: IFRS adopted from the fiscal year ended March 31, 2020 See notes to Consolidated Financial Statements Year ended March 31 with Independent Auditor’s Report.
Note: See notes to Consolidated Financial Statements Year ended March 31 with Independent Auditor’s Report.
91 92SHIONOGI INTEGRATED REPORT 2020 SHIONOGI INTEGRATED REPORT 2020
Value C
reation
Story
Value C
reation
Strategy
Addressing M
aterial IssuesD
ata Section

(Millions of yen)
Share capital
Capital surplus
Treasury shares
Retained earnings
Other components
of equity
Equity attributable to owners of parent
Non-controlling
interests
Total equity
Balance as of April 1, 2018 ¥ 21,279 ¥ 21,055 ¥ (36,641) ¥ 545,498 ¥ 179,365 ¥ 730,557 ¥ 4,257 ¥ 734,814
Profit 137,191 137,191 (272) 136,918
Total other comprehensive income, net of tax (Note 21) 734 734 (274) 460
Comprehensive income 137,191 734 137,926 (547) 137,378
Purchase of treasury shares (Note 21) (50,020) (50,020) (50,020)
Disposal of treasury shares (Note 21) (1,481) 19,174 17,693 17,693
Cancellation of treasury shares (Note 21) (38,604) 38,604 — —
Dividends (Note 21) (27,669) (27,669) (27,669)
Increase by business combination — —
Changes in ownership interest in subsidiaries 288 288 604 892
Transfer from other components of equity to retained earnings (Note 21) (1,516) 1,516 — —
Other 40,019 (40,020) (0) (1) (1)
Balance as of March 31,2019 ¥ 21,279 ¥ 21,277 ¥ (28,882) ¥ 613,483 ¥ 181,616 ¥ 808,774 ¥ 4,313 ¥ 813,087
Profit 122,193 122,193 1 122,194
Total other comprehensive income, net of tax (Note 21) (85,598) (85,598) (214) (85,813)
Comprehensive income 122,193 (85,598) 36,594 (213) 36,381
Purchase of treasury shares (Note 21) (50,012) (50,012) (50,012)
Disposal of treasury shares (Note 21) (509) 1,602 1,092 1,092
Cancellation of treasury shares — —
Dividends (Note 21) (31,134) (31,134) (31,134)
Increase by business combination (Note 32) — 90 90
Changes in ownership interest in subsidiaries (755) (755) (4,187) (4,942)
Transfer from other components of equity to retained earnings (Note 21) 4,169 (4,169) — —
Other 420 (420) 0 49 49
Balance as of March 31, 2020 ¥ 21,279 ¥ 20,432 ¥ (77,292) ¥ 708,291 ¥ 91,848 ¥ 764,560 ¥ 51 ¥ 764,611
Consolidated statement of changes in equity
Consolidated Financial Statements
(Millions of yen) (Thousands of U.S. dollars)
As of April 1, 2018(Transition date)
As of March 31, 2019
As of March 31, 2020
As of March 31, 2020
Equity and liabilities
Equity
Share capital (Note 21) ¥ 21,279 ¥ 21,279 ¥ 21,279 $ 195,568
Capital surplus (Notes 21, 25) 21,055 21,277 20,432 187,783
Treasury shares (Note 21) (36,641) (28,882) (77,292) (710,343)
Retained earnings (Note 21) 545,498 613,483 708,291 6,509,438
Other components of equity (Notes 21, 24, 29) 179,365 181,616 91,848 844,115
Equity attributable to owners of parent 730,557 808,774 764,560 7,026,561
Non-controlling interests 4,257 4,313 51 471
Total equity 734,814 813,087 764,611 7,027,031
Liabilities
Non-current liabilities
Bonds and borrowings (Notes 22, 29) 18,393 — — —
Lease liabilities (Notes 15, 29) 5,731 6,006 4,791 44,039
Other financial liabilities (Notes 23, 29) 4,202 4,354 4,179 38,409
Retirement benefit liability (Note 24) 8,865 18,136 16,089 147,865
Deferred tax liabilities (Note 9) 6,291 444 373 3,431
Other non-current liabilities (Notes 27, 28) 393 360 362 3,328
Total non-current liabilities 43,876 29,303 25,795 237,071
Current liabilities:
Bonds and borrowings (Notes 22, 29) 10,000 918 — —
Lease liabilities (Notes 15, 29) 2,636 3,306 3,361 30,892
Trade payables (Notes 26, 29) 7,698 9,442 10,763 98,922
Other financial liabilities (Notes 23, 29) 10,470 17,008 17,557 161,355
Income taxes payable (Note 9) 18,402 34,016 21,886 201,141
Other current liabilities (Note 28) 29,826 31,457 27,551 253,208
Total current liabilities 79,034 96,149 81,119 745,518
Total liabilities 122,910 125,452 106,915 982,590
Total equity and liabilities 857,725 938,540 871,526 8,009,621
Notes: IFRS adopted from the fiscal year ended March 31, 2020 See notes to Consolidated Financial Statements Year ended March 31 with Independent Auditor’s Report.
Note: See notes to Consolidated Financial Statements Year ended March 31 with Independent Auditor’s Report.
91 92SHIONOGI INTEGRATED REPORT 2020 SHIONOGI INTEGRATED REPORT 2020
Value C
reation
Story
Value C
reation
Strategy
Addressing M
aterial IssuesD
ata Section

Consolidated statement of cash flows(Millions of yen) (Thousands of U.S. dollars)
Year ended March 31, 2019
Year ended March 31, 2020
Year ended March 31, 2020
Cash flows from operating activities
Profit before tax ¥ 174,043 ¥ 158,516 $ 1,456,823
Depreciation and amortization 14,431 14,115 129,725
Impairment losses 17,168 100 919
Finance (income) costs (32,963) (29,233) (268,668)
(Increase) decrease in trade and other receivables (18,570) 21,371 196,408
(Increase) decrease in inventories (3,637) 1,158 10,647
Increase (decrease) in trade and other payables 4,922 (5,747) (52,819)
Other 3,711 (9,202) (84,574)
Subtotal 159,106 151,078 1,388,462
Interest and dividends received 30,086 29,565 271,713
Interest paid (693) (348) (3,207)
Income taxes paid (23,499) (48,354) (444,395)
Net cash provided by operating activities 165,000 131,940 1,212,572
Cash flows from investing activities
Payments into time deposits (123,651) (200,827) (1,845,673)
Proceeds from withdrawal of time deposits 91,064 174,672 1,605,302
Purchase of property, plant and equipment (6,547) (8,945) (82,210)
Proceeds from sale of property, plant and equipment 751 3,427 31,504
Purchase of intangible assets (18,848) (2,823) (25,950)
Payments for acquisition of a subsidiary (Note 32) — (4,525) (41,592)
Purchase of investments in associates (5,742) (4,252) (39,077)
Purchase of investments (11,964) (99,630) (915,641)
Proceeds from sale of investments 20,725 119,485 1,098,115
Payments for acquisition of businesses (937) — —
Other (1,104) (5,725) (52,621)
Net cash used in investing activities (56,256) (29,144) (267,845)
Cash flows from financing activities
Repayments of long-term borrowings (Note 22) (10,000) — —
Repayments of lease liabilities (Note 22) (3,022) (3,544) (32,574)
Purchase of treasury shares (Note 21) (50,270) (50,159) (460,981)
Dividends paid (Note 21) (27,639) (31,122) (286,027)
Payments for acquisition of interests in subsidiaries from non-controlling interests — (3,367) (30,944)
Proceeds from sale of interests in a subsidiary to non-controlling interests 1,020 — —
Other — 18 173
Net cash used in financing activities (89,912) (88,174) (810,353)
Effect of exchange rate changes on cash and cash equivalents 832 (1,560) (14,346)
Net increase in cash and cash equivalents 19,664 13,060 120,028
Cash and cash equivalents at beginning of period (Note 19) 176,135 195,800 1,799,474
Cash and cash equivalents at end of period (Note 19) ¥ 195,800 ¥ 208,861 $ 1,919,503
Consolidated Financial Statements
Note: See notes to Consolidated Financial Statements Year ended March 31 with Independent Auditor’s Report.
Note: See notes to Consolidated Financial Statements Year ended March 31 with Independent Auditor’s Report.
(Thousands of U.S. dollars)
Share capital
Capital surplus
Treasury shares
Retained earnings
Other components
of equity
Equity attributable to owners of parent
Non-controlling
interests
Total equity
Balance as of March 31,2019 $ 195,568 $ 195,545 $ (265,440) $ 5,638,118 $ 1,669,115 $ 7,432,906 $ 39,640 $ 7,472,546
Profit 1,123,000 1,123,000 9 1,123,009
Total other comprehensive income, net of tax (Note 21) (786,682) (786,682) (1,973) (788,655)
Comprehensive income 1,123,000 (786,682) 336,318 (1,963) 334,354
Purchase of treasury shares (Note 21) (459,631) (459,631) (459,631)
Disposal of treasury shares (Note 21) (4,685) 14,728 10,043 10,043
Cancellation of treasury shares — —
Dividends (Note 21) (286,137) (286,137) (286,137)
Increase by business combination (Note 32) — 829 829
Changes in ownership interest in subsidiaries (6,942) (6,942) (38,484) (45,426)
Transfer from other components of equity to retained earnings (Note 21) 38,318 (38,318) — —
Other 3,865 (3,861) 4 450 455
Balance as of March 31, 2020 $ 195,568 $ 187,783 $ (710,343) $ 6,509,438 $ 844,115 $ 7,026,561 $ 471 $ 7,027,031
93 94SHIONOGI INTEGRATED REPORT 2020 SHIONOGI INTEGRATED REPORT 2020
Value C
reation
Story
Value C
reation
Strategy
Addressing M
aterial IssuesD
ata Section

Third-Party Assurance of Environmental Data
Environmental Data
Calculation methods for environmental performance data
Calculation methods
Indicators Unit 2015 2016 2017 2018 2019
Greenhouse gas (GHG)Total of Scope 1, 2 and 3 (Location-based) tons-CO2 313,354 355,504 287,356 209,171 226,883 (Market-based) tons-CO2 309,948 349,397 286,898 204,031 218,614Total of Scope 1 and 2 (Location-based) tons-CO2 102,125 101,827 90,595 87,850 85,208 (Market-based) tons-CO2 98,719 95,720 90,136 82,711 76,939Scope 1 tons-CO2 46,778 46,106 43,456 41,349 37,519 (Intensity per unit of sales) tons-CO2/1 million yen 0.1509 0.1361 0.1261 0.1137 0.1120Scope 2 (Location-based) tons-CO2 55,347 55,721 47,139 46,501 47,690 (Intensity per unit of sales) tons-CO2/1 million yen 0.1786 0.1644 0.1368 0.1278 0.1424Scope 2 (Market-based) tons-CO2 51,941 49,614 46,681 41,362 39,421 (Intensity per unit of sales) tons-CO2/1 million yen 0.1676 0.1464 0.1354 0.1137 0.1177Total of Scope 3*1 tons-CO2 211,229 253,677 196,761 121,321 141,675Category 3 tons-CO2 3,093 3,015 2,876 2,798 5,732Other categories tons-CO2 208,135 250,661 193,885 118,523 135,943
Energy consumptionTotal energy consumption GJ 1,829,055 1,818,374 1,733,999 1,677,537 1,651,304 (Intensity per unit of sales) GJ/1 million yen 5.901 5.366 5.031 4.612 4.930Gasoline kl 2,044 1,812 1,749 1,598 1,382Other fuel oils (kerosene, light oil, heavy oil A) kl 239 330 54 87 49Liquefied petroleum gas (LPG) tons 616 875 808 830 580Liquefied natural gas (LNG) tons 8,970 8,530 8,067 7,932 7,113Town gas thousand Nm3 6,991 6,978 6,860 6,138 5,771Electricity thousand kWh 93,898 94,428 90,497 89,107 93,245Steam GJ 0 0 0 0 15,863
Indicators Calculation methodsScope 1 CO2 emissions resulting from fuel use
Calculation methods: Based on the “Greenhouse Gas Emissions Accounting and Reporting Manual (Ver. 4.6)” of the Ministry of the Environment and the Ministry of Economy, Trade and Industry of Japan
CO2 emission factors: Based on the “Greenhouse Gas Emissions Accounting and Reporting Manual (Ver. 4.6)” of the Ministry of the Environment and the Ministry of Economy, Trade and Industry of Japan
Scope 2 CO2 emissions resulting from purchase of electricity and steamCalculation methods: Based on the “Greenhouse Gas Emissions Accounting and Reporting Manual (Ver. 4.6)” of the Ministry of the Environment and the
Ministry of Economy, Trade and Industry of JapanElectricity (Japan) (location-based): Substitute values from “Emission Factors by Power Suppliers (for the calculation of GHG emissions by specified emitters)
(FY2018 results)” published by the Ministry of the Environment and the Ministry of Economy, Trade and Industry of Japan (January 7, 2020)
Electricity (Japan) (market-based): Adjusted emissions factors from “Emission Factors by Power Suppliers (for the calculation of GHG emissions by specified emitters) (FY 2018 results)” published by the Ministry of the Environment and the Ministry of Economy, Trade and Industry of Japan (January 7, 2020)
Electricity (overseas) (both location-based and market-based): Emissions Factors (2016) of the International Energy Agency (IEA)Steam (both location-based and market-based): Emissions factors from the “Greenhouse Gas Emissions Accounting and Reporting Manual (Ver. 4.6)” of
the Ministry of the Environment and the Ministry of Economy, Trade and Industry of Japan
Scope 3 Category 3 CO2 emissions resulting from procurement of fuels required for the generation of electricity purchased*2
Calculation methods: Based on the “Basic Guidelines on Accounting for Greenhouse Gas Emissions Throughout the Supply Chain (Ver. 2.3)” of the Ministry of the Environment and the Ministry of Economy, Trade and Industry of Japan, calculated using “7. Emission Unit Values per Use of Electricity and Heat” in the “The Database on Emissions Unit Values for Calculation of Greenhouse Gas Emissions, etc., by Organizations Throughout the Supply Chain (Ver. 3.0)” of the Ministry of the Environment of Japan
Other categories Total of Categories 1, 2, 4, 5, 6, 7 and 12, excluding Categories 8, 9, 10, 11, 13, 14 and 15 that are not included in our own corporate activities or are reported under other categoriesCalculation methods: Based on the “Basic Guidelines on Accounting for Greenhouse Gas Emissions Throughout the Supply Chain (Ver.2.3)” of the Ministry
of Economy, Trade and Industry and the Ministry of the Environment of Japan
Energy consumption
Total energy consumption Total calorie-converted values for purchased energy (gasoline, other fuel oils, LPG, LNG, town gas, electricity, steam)Calculation methods: Based on the Regulations for Enforcement of the Act on the Rational Use of EnergyCalorie conversion factors: Based on the Regulations for Enforcement of the Act on the Rational Use of Energy
Gasoline Amount of gasoline purchased, including fuel for sales force vehicles
Other fuel oils Amount of kerosene, light oil, heavy oil A purchased
Liquefied petroleum gas (LPG) Amount of LPG purchased from gas suppliers
Liquefied natural gas (LNG) Amount of LNG purchased from gas suppliers
Town gas Amount of town gas purchased from gas suppliers
Electricity Amount of electricity purchased from power suppliers
Steam Amount of steam purchased from steam suppliers
Boundary of calculation Scope 1 and 2: Shionogi Group (excluding overseas related companies [administrative offices]): Shionogi Group companies in Japan and the Nanjing Plant of C&O Pharmaceutical Technology (Holdings) Limited
Scope 3: Shionogi Group companies in Japan (Shionogi & Co., Ltd. in or before fiscal 2018) Energy consumption: Shionogi Group (excluding overseas related companies [administrative offices]): Shionogi Group
companies in Japan and the Nanjing Plant of C&O Pharmaceutical Technology (Holdings) Limited
Shionogi calculates energy consumption and greenhouse gas (GHG) emissions using calorie conversion factors and CO2 emission factors for fuels and electricity used each fiscal year. Due to differences in calculation methods and boundary of calculation, the energy consumption and GHG emissions thus calculated differ from the figures presented in the Non-financial data section of this Integrated Report (p. 97) and in the Environment Report.GHG emissions and energy consumption data in fiscal 2019 marked with were subject to third-party assurance by KPMG AZSA Sustainability Co., Ltd.
*1 Until fiscal 2018, data were only tabulated for Shionogi & Co., Ltd., but with the spin-off of the manufacturing function as a subsidiary (establishment of Shionogi Pharma Co., Ltd.), from fiscal 2019 data are tabulated for Shionogi Group companies in Japan. The impact of this change is minor.
*2 Usage of steam etc. is only for C&O’s Nanjing plant. (Steam is not used under the boundary of calculation for Scope 3 (Shionogi Group companies in Japan).)
Independent Assurance Report
95 96SHIONOGI INTEGRATED REPORT 2020 SHIONOGI INTEGRATED REPORT 2020
Value C
reation
Story
Value C
reation
Strategy
Addressing M
aterial IssuesD
ata Section

Corporate Data
Stock InformationStock (Securities) Listings: Major Shareholders
Stock Status:
Shareholder Composition
The Master Trust Bank of Japan, Ltd. (Trust account) 12.53
6.30
6.12
3.12
2.76
2.82
2.28
2.20
1.71
1.69
Financial institutions43.95%
Note: Treasury shares included in Individuals.
(As of March 31, 2020)
(As of March 31, 2020)
Company Name
Established
Incorporated
Paid-in Capital
Number of Employees
Fiscal Year-End
Website
Shionogi & Co., Ltd.
March 17, 1878
June 5, 1919
¥21,280 million
5,233
March 31
https://www.shionogi.com/global/en/
Tokyo (#4507)(Shares listed in 1949)
Common Stock Authorized: 1,000,000,000 sharesIssued: 316,786,165 sharesNumber of shareholders: 36,955
Japan Trustee Services Bank, Ltd. (Trust account)
Japan Trustee Services Bank, Ltd. (Trust account 7)
Japan Trustee Services Bank, Ltd. (Trust account 9)
Japan Trustee Services Bank, Ltd. (Trust account 5)
JP MORGAN CHASE BANK 385632
Sumitomo Life Insurance Company
SMBC Trust Bank Ltd. (as a trustee for retirement benefit of Sumitomo Mitsui Banking Corporation)
Nippon Life Insurance Company
BNYM TREATY DTT 15
Shareholdercomposition
(As of March 31, 2020)
National and local governments0.26%
Securities firms1.59%
Other Japanese corporations2.96%
Individuals12.71%
Foreign investors38.75%
NameNumber of
shares(Thousands)
Percentage of total shares
(%)
38,091
19,167
18,604
9,485
8,409
8,566
6,955
6,700
5,208
5,148
Notes: 1. The Company owns 13,002,082 shares of treasury shares but the Company is
not included in the major shareholders listed above (top 10).2. The percentage of total is calculated as the proportion of shares to 303,784,083
shares of total issued stock (excluding 13,002,082 shares of treasury shares).
Non-financial Data Corporate Information
Mar. 31, 2016 Mar. 31, 2017 Mar. 31, 2018 Mar. 31, 2019 Mar. 31, 2020 Remark
Information on the number of employees (Information about only Shionogi & Co., Ltd. unless otherwise stated)
No. of employees
Consolidated 5,896 persons 5,511 persons 5,120 persons5,233 persons
(4,554 persons)5,222 persons
(4,527 persons)The figure in parentheses is calculated for domestic consolidated companies.
Shionogi & Co., Ltd. 4,055 persons 3,911 persons 3,677 persons 3,596 persons 2,667 persons
Rate of female employees 28.8% 28.8% 27.8% 28.1% (32.2%) 24.1% (32.2%)The figure in parentheses is calculated for domestic consolidated companies.
Average age
Total 41.4 years old 41.7 years old 41.4 years old 41.7 years old 41.3 years old Excluding seconded persons
Male 42.1 years old 42.2 years old 41.9 years old 42.2 years old 41.9 years old
Female 39.8 years old 40.6 years old 40.0 years old 40.4 years old 39.2 years old
Length of service
Total 17.2 years 17.4 years 17.3 years 17.3 years 15.9 years Excluding seconded persons
Male 17.1 years 17.1 years 16.9 years 17.1 years 16.1 years
Female 17.5 years 18.1 years 17.4 years 17.8 years 15.0 years
Average salary 8,901,271 yen 9,276,750 yen 9,193,748 yen 9,042,130 yen 9,431,304 yen
No. of new recruits
Total 99 persons 91 persons 110 persons 101 persons 94 personsRecruits who will enter the company on April 1 of the following fiscal year
Male 57 persons 61 persons 71 persons 59 persons 56 persons
Female 42 persons 30 persons 39 persons 42 persons 38 persons
Turnover rate of recruits enrolled for three years 0.0% 6.5% 6.5% 3.0% 4.5%Recruit who entered the company on April 1 three years ago
Turnover rate of employees 1.4% 1.4% 1.9% 1.6% 1.9% Excluding retired persons
No. of labor union members 3,396 persons 2,948 perso ns 2,758 persons 3,012 persons 2,806 personsRate of union
members: 100%Rate of union
members: 100%Rate of union
members: 100%Rate of union
members: 100%Rate of union
members: 100%
Employment rate of people with disabilities
2.1% 2.3% 2.2% 2.0% (2.5%) 2.0% (2.6%)
As of the end of March. The figure in parentheses is calculated for special cases in affiliated companies.Shionogi Smile Heart Co., Ltd. established in April 2018 and certified as a special subsidiary company in July 2018.
Rate of female managers
7.8% 8.4% 8.0% 9.9% (10.0%) 10.7% (11.4%)
As of April 1 of the following fiscal year. The figure in parentheses is calculated for domestic consolidated companies.Target: 10% (Domestic consolidation at the end of March 2021)
Rate of female heads of organizations 5.6% 6.7% 7.7% 8.6% 14.3% As of April 1 of the following fiscal year
Rate of female corporate officers 2/13 2/12 1/14 1/13 0/10 As of April 1 of the following fiscal year
15.4% 16.7% 7.1% 7.7% 0.0%
Rate of female members of the Board 16.7% 16.7% 16.7% 16.7% 16.7% As of April 1 of the following fiscal year
Information on labor management (Shionogi & Co., Ltd.)
Annual regular working hours for employees 1,852 hours 1,860 hours 1,860 hours 1,852 hours 1,845 hours
No. of paid holidays Up to 24 days Up to 24 days Up to 24 days Up to 24 days Up to 21 daysThe number of legal annual holidays based on the Labor Standards Act is up to 20 days.
Average No. of paid holidays taken by employees 13.4 days 13.6 days 12.0 days 12.5 days 12.6 days
Acquisition rate of childcare leave
Female 100% 100% 100% 100% 100% Rate of employees who have taken childcare leave during the year when their baby was bornMale 14.8% 17.4% 21.0% 24.2% 32.8%
No. of employees who have taken nursing care leave
Female 7 persons 4 persons 4 persons 2 persons 4 personsTotal number
Male 0 persons 0 persons 0 persons 0 persons 1 persons
No. of employees who have worked on short work hours due to child rearing
Female 181 persons 173 persons 162 persons 119 persons 136 personsTotal number
Male 4 persons 2 persons 1 persons 1 persons 1 persons
Volunteer leave 0 persons 0 persons 1 persons 0 persons 1 persons From FY 2014
Leave for bone marrow transplant donors 1 persons 1 persons 0 persons 0 persons 1 persons From FY 2014
Frequency rate 0.12 0.25 0.39 0.81 0.19
Severity rate 0.0001 0.004 0.003 0.018 0.0002
Legal violation / Administrative guidance 0 case 0 case 0 case 4 cases 0 case
Health (Shionogi & Co., Ltd.)
Smoking rate 18.7% 17.1% 16.4% 15.2% 14.2%
Rate of stress check attendance — 94% 94% 96% 95%
Participation rate in a healthy walk 37.1% 35.4% 42.2% 41.5% 41.5%
Rate of health checkup attendance 100% 100% 100% 100% 100%
Rate of employees on leave due to mental disorders 0.7% 0.5% 0.4% 0.4% 0.5%
Environment (Domestic consolidated companies)
CO2 emissions (Scope 1 and 2) 69,420 tons-CO2 67,764 tons-CO2 64,370 tons-CO2 61,866 tons-CO2 59,630 tons-CO2
Energy consumption (Thousand) 1,697 GJ 1,657 GJ 1,581 GJ 1,522 GJ 1,485 GJ
Water use (Thousand) 1,567 m3 1,528 m3 1,389 m3 1,315 m3 1,263 m3
Amount of waste generated 3,944 tons 3,820 tons 3,486 tons 3,824 tons 3,062 tons
Recycling rate 71% 79% 78% 81% 83%
Landfill rate 2.5% 1.3% 1.0% 0.8% 1.0%
Type 1 chemicals designated under the PRTR Act
Amount handled 377 tons 289 tons 251 tons 274 tons 203 tons
Amount released 61 tons 63 tons 35 tons 43 tons 34 tons
Amount transferred 235 tons 148 tons 177 tons 156 tons 131 tons
No. of complaints about the environment 1 case 1 case 2 cases 1 case 0 case
97 98SHIONOGI INTEGRATED REPORT 2020 SHIONOGI INTEGRATED REPORT 2020
Value C
reation
Story
Value C
reation
Strategy
Addressing M
aterial IssuesD
ata Section

Year ended March 31, 2020
1-8, Doshomachi 3-chome, Chuo-ku, Osaka 541-0045, Japan
Tel : +81-6-6202-2161 SHIONOGIINTEGRATED REPORT
2020
Shape the Future of Healthcare