consolidated financial statements 2020 - kuehne
TRANSCRIPT

ConsolidatedFinancial
Statements 2020
Contents
41
41
42
43
45
47
49
49
60
109
117
Consolidated Financial Statements 2020 of the Kuehne+Nagel GroupIncome Statement Statement of Comprehensive IncomeBalance SheetStatement of Changes in EquityCash Flow Statement Notes to the ConsolidatedFinancial StatementsAccounting policiesOther notesSignificant consolidated subsidiaries and joint venturesReport of the statutory auditor
Consolidated Financial Statements 2020of the Kuehne+Nagel Group
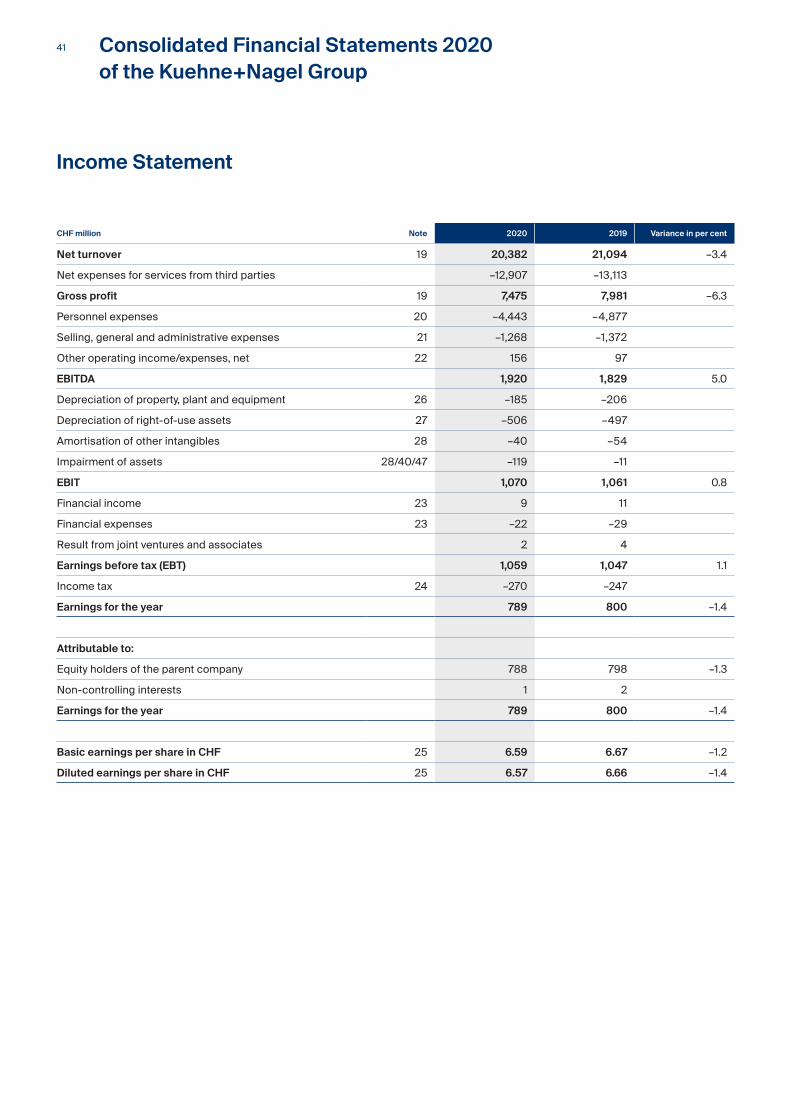
CHF million Note 2020 2019 Variance in per cent
Net turnover 19 20,382 21,094 –3.4
Net expenses for services from third parties –12,907 –13,113
Gross profit 19 7,475 7,981 –6.3
Personnel expenses 20 –4,443 –4,877
Selling, general and administrative expenses 21 –1,268 –1,372
Other operating income/expenses, net 22 156 97
EBITDA 1,920 1,829 5.0
Depreciation of property, plant and equipment 26 –185 –206
Depreciation of right-of-use assets 27 –506 –497
Amortisation of other intangibles 28 –40 –54
Impairment of assets 28/40/47 –119 –11
EBIT 1,070 1,061 0.8
Financial income 23 9 11
Financial expenses 23 –22 –29
Result from joint ventures and associates 2 4
Earnings before tax (EBT) 1,059 1,047 1.1
Income tax 24 –270 –247
Earnings for the year 789 800 –1.4
Attributable to:
Equity holders of the parent company 788 798 –1.3
Non-controlling interests 1 2
Earnings for the year 789 800 –1.4
Basic earnings per share in CHF 25 6.59 6.67 –1.2
Diluted earnings per share in CHF 25 6.57 6.66 –1.4
Income Statement
41

Statement of Comprehensive Income
CHF million Note 2020 2019
Earnings for the year 789 800
Other comprehensive income
Items that may be reclassified subsequently to profit or loss:
Foreign exchange differences –188 –47
Items that will not be reclassified to profit or loss:
Actuarial gains/(losses) on defined benefit plans 33/24 –8 –66
Income tax on actuarial gains/(losses) on defined benefit plans 24 1 16
Total other comprehensive income, net of tax –195 –97
Total comprehensive income for the year 594 703
Attributable to:
Equity holders of the parent company 593 701
Non-controlling interests 1 2
Statement of Comprehensive Income
42
Consolidated Financial Statements 2020
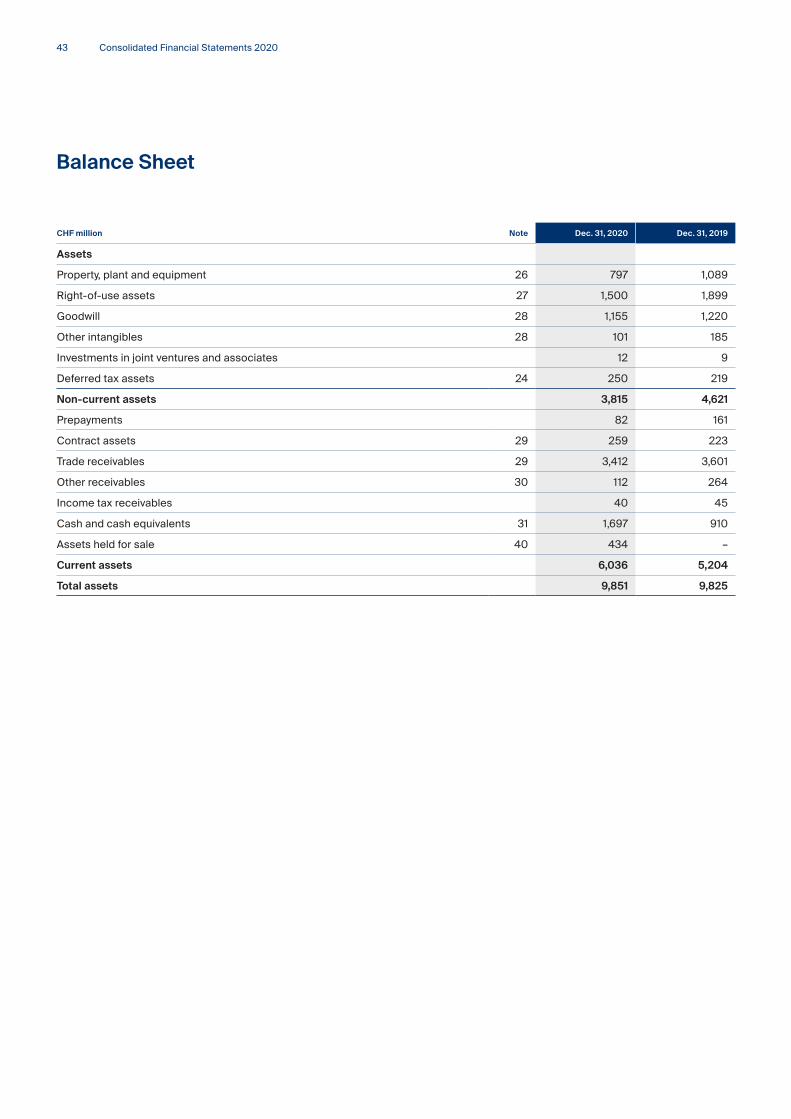
CHF million Note Dec. 31, 2020 Dec. 31, 2019
Assets
Property, plant and equipment 26 797 1,089
Right-of-use assets 27 1,500 1,899
Goodwill 28 1,155 1,220
Other intangibles 28 101 185
Investments in joint ventures and associates 12 9
Deferred tax assets 24 250 219
Non-current assets 3,815 4,621
Prepayments 82 161
Contract assets 29 259 223
Trade receivables 29 3,412 3,601
Other receivables 30 112 264
Income tax receivables 40 45
Cash and cash equivalents 31 1,697 910
Assets held for sale 40 434 –
Current assets 6,036 5,204
Total assets 9,851 9,825
Balance Sheet
43

Balance Sheet
CHF million Note Dec. 31, 2020 Dec. 31, 2019
Liabilities and equity
Share capital 120 120
Reserves and retained earnings 1,499 1,398
Earnings for the year 788 798
Equity attributable to the equity holders of the parent company 2,407 2,316
Non-controlling interests 6 6
Equity 32 2,413 2,322
Provisions for pension plans and severance payments 33 431 431
Deferred tax liabilities 24 61 60
Borrowings 35 400 400
Non-current provisions 36 35 45
Other non-current liabilities 38 52 206
Non-current lease liabilities 27 1,150 1,432
Non-current liabilities 2,129 2,574
Bank and other interest-bearing liabilities 35 2 12
Trade payables 37 1,875 1,890
Contract liabilities 37 87 74
Accrued trade expenses 37 1,338 1,190
Income tax liabilities 164 169
Current provisions 36 86 80
Other current liabilities 39 905 1,004
Current lease liabilities 27 433 510
Liabilities directly associated with the assets held for sale 40 419 –
Current liabilities 5,309 4,929
Total liabilities and equity 9,851 9,825
Schindellegi, March 2, 2021
Kuehne + Nagel International AG
Dr. Detlef Trefzger Markus Blanka-Graff
CEO CFO
44
Consolidated Financial Statements 2020
CHF million NoteShare
capitalShare
premiumTreasury
shares
Cumu-lative
trans-lation
adjust-ment
Actuarial gains/
(losses)Retained earnings
Total equity
attribu-table to
the equity holders
of parent company
Non- controlling
interestsTotal
equity
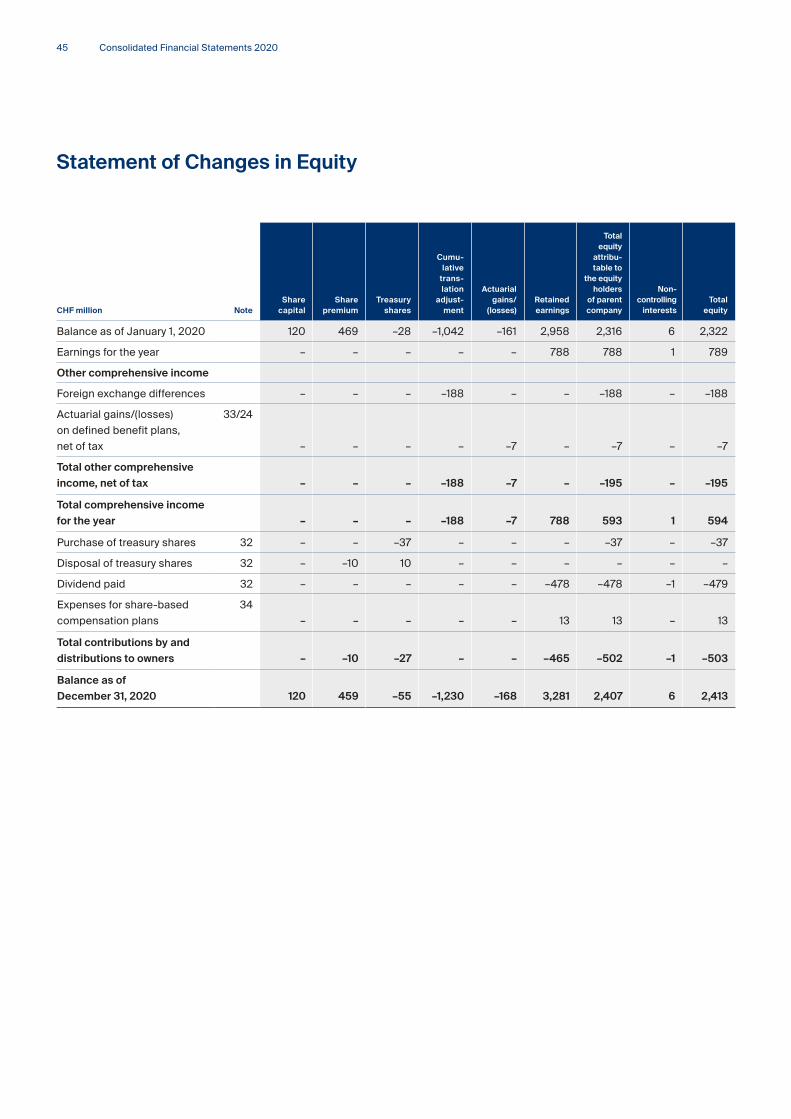
Balance as of January 1, 2020 120 469 –28 –1,042 –161 2,958 2,316 6 2,322
Earnings for the year – – – – – 788 788 1 789
Other comprehensive income
Foreign exchange differences – – – –188 – – –188 – –188
Actuarial gains/(losses)
on defined benefit plans,
net of tax
33/24
–
–
–
–
–7 –
–7
– –7
Total other comprehensive
income, net of tax
– –
–
–188
–7 –
–195 – –195
Total comprehensive income
for the year – – – –188 –7
788 593
1
594
Purchase of treasury shares 32 – – –37 – – – –37 – –37
Disposal of treasury shares 32 – –10 10 – – – – – –
Dividend paid 32 – – – – – –478 –478 –1 –479
Expenses for share-based
compensation plans
34
–
– – – – 13 13 –
13
Total contributions by and
distributions to owners
–
–10
–27 – –
–465 –502 –1 –503
Balance as of
December 31, 2020
120 459 –55 –1,230
–168
3,281 2,407 6 2,413
Statement of Changes in Equity
45

Statement of Changes in Equity
CHF million NoteShare
capitalShare
premiumTreasury
shares
Cumu-lative
trans-lation
adjust-ment
Actuarial gains/
(losses)Retained earnings
Total equity
attribu-table to
the equity holders
of parent company
Non- controlling
interestsTotal
equity
Balance as of January 1, 2019 120 477 –36 –995 –111 2,863 2,318 6 2,324
Earnings for the year – – – – – 798 798 2 800
Other comprehensive income
Foreign exchange differences – – – –47 – – –47 – –47
Actuarial gains/(losses)
on defined benefit plans,
net of tax 33/24 – – – – –50 – –50 – –50
Total other comprehensive
income, net of tax – – – –47 –50 – –97 – –97
Total comprehensive income
for the year – – – –47 –50 798 701 2 703
Disposal of treasury shares 32 – –8 8 – – – – – –
Dividend paid 32 – – – – – –718 –718 –2 –720
Expenses for share-based
compensation plans 34 – – – – – 15 15 – 15
Total contributions by and
distributions to owners – –8 8 – – –703 –703 –2 –705
Balance as of
December 31, 2019 120 469 –28 –1,042 –161 2,958 2,316 6 2,322
46

Consolidated Financial Statements 2020
Cash Flow Statement
CHF million Note 2020 2019
Cash flow from operating activities
Earnings for the year 789 800
Adjustments to reconcile earnings for the year to net cash flows:
Income tax 24 270 247
Financial income 23 –9 –11
Financial expenses 23 22 29
Result from joint ventures and associates –2 –4
Depreciation of property, plant and equipment 26 185 206
Depreciation of right-of-use assets 26/27 506 497
Amortisation of other intangibles 28 40 54
Impairment of assets 28/40/47 119 11
Expenses for share-based compensation plans 34 13 15
(Gain)/loss on disposal of subsidiaries and associates 22 – –1
(Gain)/loss on disposal of property, plant and equipment, net 22 –25 –96
Net addition to provisions for pension plans and severance payments 33 –4 –1
Subtotal operational cash flow 1,904 1,746
(Increase)/decrease contract assets –63 72
(Increase)/decrease trade and other receivables, prepayments –74 217
Increase/(decrease) provisions 27 11
Increase/(decrease) other liabilities –123 11
Increase/(decrease) trade payables, contract liabilities and accrued trade expenses 353 –84
Income taxes paid –306 –252
Total cash flow from operating activities 1,718 1,721
47
Cash Flow Statement
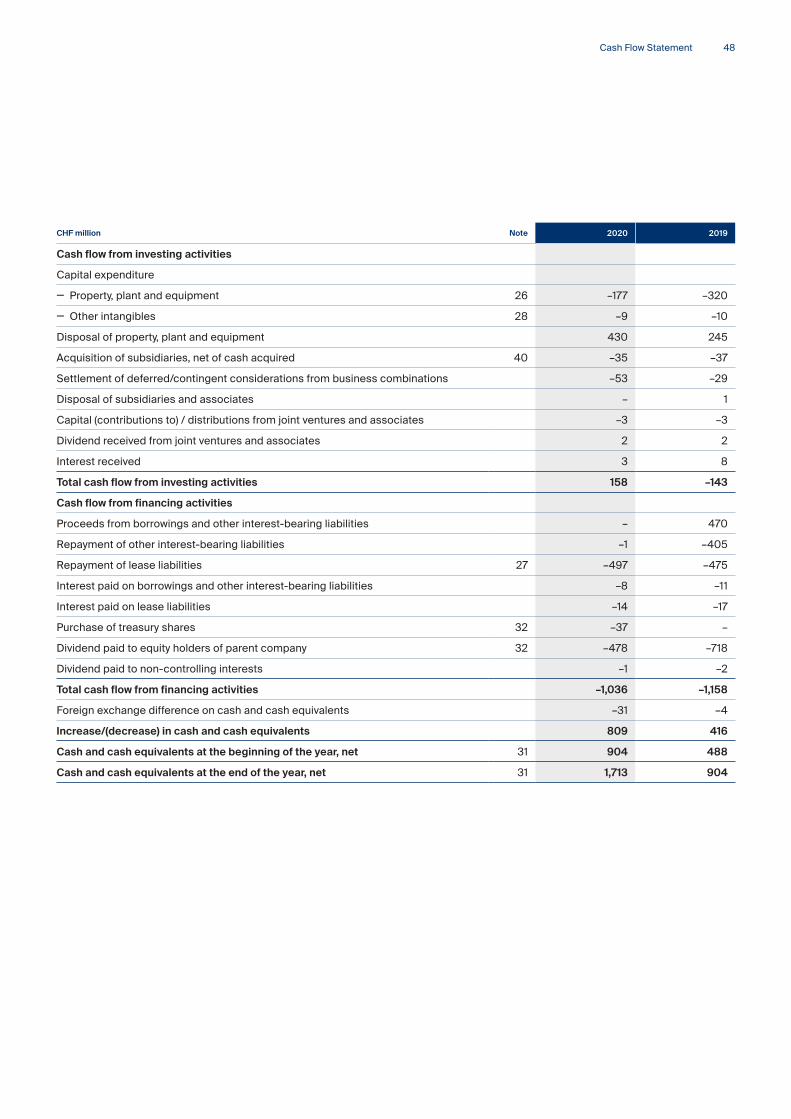
CHF million Note 2020 2019
Cash flow from investing activities
Capital expenditure
— Property, plant and equipment 26 –177 –320
— Other intangibles 28 –9 –10
Disposal of property, plant and equipment 430 245
Acquisition of subsidiaries, net of cash acquired 40 –35 –37
Settlement of deferred/contingent considerations from business combinations –53 –29
Disposal of subsidiaries and associates – 1
Capital (contributions to) / distributions from joint ventures and associates –3 –3
Dividend received from joint ventures and associates 2 2
Interest received 3 8
Total cash flow from investing activities 158 –143
Cash flow from financing activities
Proceeds from borrowings and other interest-bearing liabilities – 470
Repayment of other interest-bearing liabilities –1 –405
Repayment of lease liabilities 27 –497 –475
Interest paid on borrowings and other interest-bearing liabilities –8 –11
Interest paid on lease liabilities –14 –17
Purchase of treasury shares 32 –37 –
Dividend paid to equity holders of parent company 32 –478 –718
Dividend paid to non-controlling interests –1 –2
Total cash flow from financing activities –1,036 –1,158
Foreign exchange difference on cash and cash equivalents –31 –4
Increase/(decrease) in cash and cash equivalents 809 416
Cash and cash equivalents at the beginning of the year, net 31 904 488
Cash and cash equivalents at the end of the year, net 31 1,713 904
48
Consolidated Financial Statements 2020
Accounting policies
1 Organisation
Kuehne + Nagel International AG (the Company) is incorporated in
Schindellegi (Feusisberg), Switzerland. The Company is one of the
leading global logistics providers. Its strong market position lies in
the sea logistics, air logistics, road logistics and contract logistics
businesses.
The Consolidated Financial Statements of the Company for the
year ended December 31, 2020, comprise the Company, its sub-
sidiaries (the Group), its interests in joint ventures and associates.
2 Statement of compliance
The Consolidated Financial Statements have been prepared in
accordance with International Financial Reporting Standards (IFRS).
3 Basis of preparation
The Consolidated Financial Statements are presented in Swiss
Francs (CHF) million and are based on the individual financial
statements of the consolidated companies as of December 31,
2020. Those financial statements have been prepared in accor-
dance with uniform accounting policies issued by the Group,
which comply with the requirements of the International Financial
Reporting Standards (IFRS) and Swiss law (Swiss Code of Obliga-
tions). The Consolidated Financial Statements are prepared on
a historical cost basis except for certain financial instruments,
which are stated at fair value.
The preparation of financial statements in accordance with
IFRS requires management to make judgements, estimates and
assumptions that affect the application of policies and reported
Notes to the Consolidated Financial Statements
49
Notes to the Consolidated Financial Statements 2020
amounts of assets, liabilities, income and expenses. The actual
result may differ from these estimates. Judgements made by the
management in the application of IFRS that have a significant
effect on the Consolidated Financial Statements and estimates
with a significant risk of material adjustment in the future are
shown in note 47.
The accounting policies applied in the preparation of the Consoli-
dated Financial Statements are consistent with those followed in
the preparation of the Group’s Consolidated Financial Statements
for the year ended December 31, 2019, except for the adoption of
new standards, interpretations and amendments effective as of
January 1, 2020. Apart from the early adoption of COVID-19-Related
Rent Concessions – Amendment to IFRS 16 Leases as of May 28,
2020, the Group has not early adopted any standard, interpretation
or amendment that has been issued but is not yet effective. There
were no significant impacts from changes in accounting policies
in 2020.
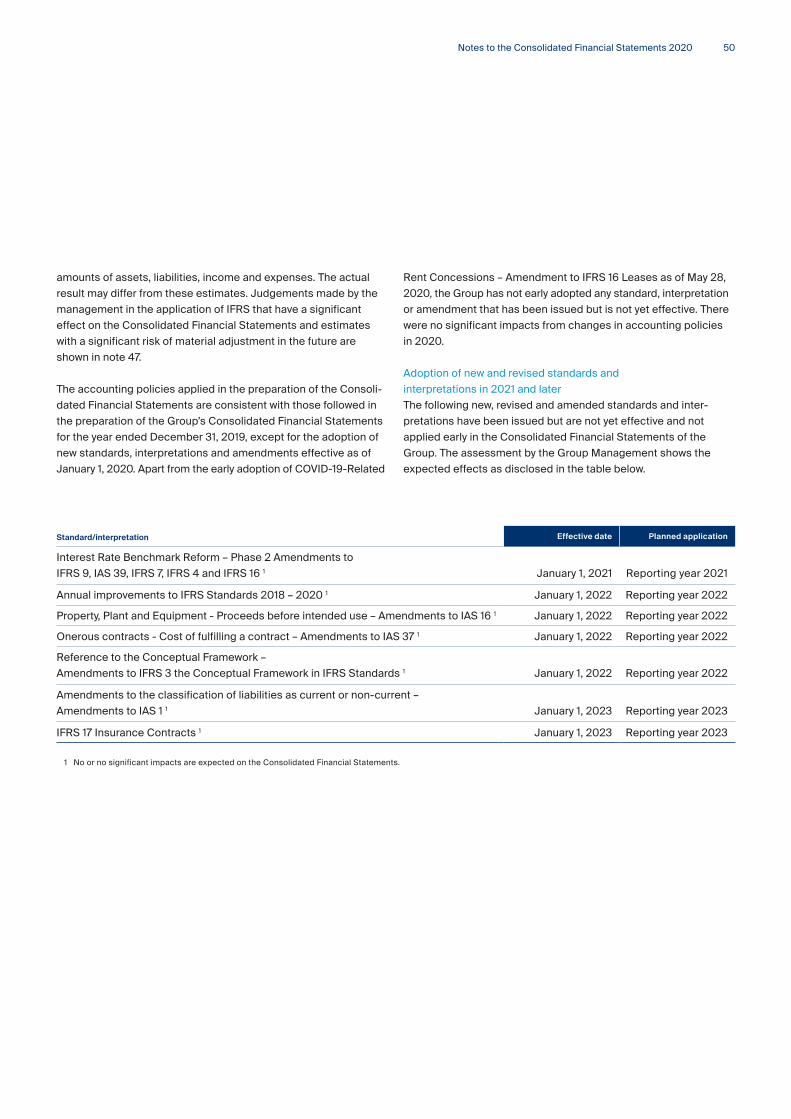
Adoption of new and revised standards and
interpretations in 2021 and later
The following new, revised and amended standards and inter-
pretations have been issued but are not yet effective and not
applied early in the Consolidated Financial Statements of the
Group. The assessment by the Group Management shows the
expected effects as disclosed in the table below.
Standard/interpretation Effective date Planned application
Interest Rate Benchmark Reform – Phase 2 Amendments to
IFRS 9, IAS 39, IFRS 7, IFRS 4 and IFRS 16 1 January 1, 2021 Reporting year 2021
Annual improvements to IFRS Standards 2018 – 2020 1 January 1, 2022 Reporting year 2022
Property, Plant and Equipment - Proceeds before intended use – Amendments to IAS 16 1 January 1, 2022 Reporting year 2022
Onerous contracts - Cost of fulfilling a contract – Amendments to IAS 37 1 January 1, 2022 Reporting year 2022
Reference to the Conceptual Framework –
Amendments to IFRS 3 the Conceptual Framework in IFRS Standards 1 January 1, 2022 Reporting year 2022
Amendments to the classification of liabilities as current or non-current –
Amendments to IAS 1 1 January 1, 2023 Reporting year 2023
IFRS 17 Insurance Contracts 1 January 1, 2023 Reporting year 2023
1 No or no significant impacts are expected on the Consolidated Financial Statements.
50

Consolidated Financial Statements 2020
not return to pre-crisis levels until 2024 as per the International
Air Transport Association (IATA). In the third quarter 2020 a slower
than initially expected recovery of the aviation sector and the
changed medium and long-term outlook for aviation customers
led to an impairment charge of other intangible assets (customer
lists) in the reportable segment Air Logistics in the region Americas
of CHF 52 million.
Kuehne+Nagel considered the COVID-19 outbreak and the
impact on the wider economy as a triggering event and performed
a goodwill impairment test for the relevant aggregated cash
generating units (CGU) in the third quarter 2020. The recoverable
amounts of the aggregated CGUs clearly exceeded their carrying
amounts. The annual impairment tests (described in note 28)
performed in the fourth quarter 2020 confirmed these results.
The Kuehne+Nagel Group reached an agreement with the sellers
of Quick for an early settlement of the contingent consideration,
resulting in a payment of CHF 46 million and a release of the
unused contingent consideration liability through the income
statement (included in other operating income) of CHF 115 million.
Further details regarding the measurement of contingent con-
siderations are described in note 45.
The Group has reassessed the expected credit loss by applying
updated credit ratings and probabilities of default. The impairment
allowance in per cent of trade receivables and contract assets has
increased from 1.95 per cent as of December 31, 2019 to 2.39 per
cent as of December 31, 2020.
The Group introduced short-time work in several jurisdictions and
recorded benefits in the amount of CHF 83 million as a deduction
of personnel expenses in the Consolidated Financial Statements
for the year ending December 31, 2020.
As of December 31, 2020, the Group received no material govern-
ment subsidies or other assistance.
Impact from COVID-19
On March 11, 2020, the World Health Organisation declared the
COVID-19 outbreak to be a pandemic due to its rapid spread
worldwide. Various governments introduced containment mea-
sures in order to reduce the growth of infections.
The Kuehne+Nagel Group has precautionary measures in place
to provide safe working environments for its employees and main-
tain business continuity. Dedicated teams at global and regional
level are monitoring the situation as it develops and will adjust
any measures based on the guidance of governments and other
relevant authorities.
While demand in certain industries increased, volumes in other
industries, especially in automotive, aviation and aerospace
reduced significantly until Q2 2020. Demand in industries such as
pharma, healthcare, high-tech, and e-commerce remained high.
The Group recorded increasing volumes in imports to Europe and
North America from Asia in the second half of the year. The auto-
motive and perishables industries showed signs of recovery while
the aviation sector remained weak. Since the overall development
of the COVID-19 pandemic is still unforeseeable, predictions
remain difficult.
For these Consolidated Financial Statements, the impact of the
COVID-19 outbreak and containment measures taken by various
governments are considered and assessments for the future are
made based on various scenarios.
The Group has analysed whether any triggering events can be
identified that would indicate an impairment of its assets.
The outlook for the time-critical logistics business, acquired
through Quick International Courier (Quick) at the end of 2018,
was affected significantly by the COVID-19 pandemic, resulting in
a down-trading of several major aviation customers. The recovery
of these customers is uncertain and depending on the recovery
of air travel – which is expected to take well beyond 2021 and will
51
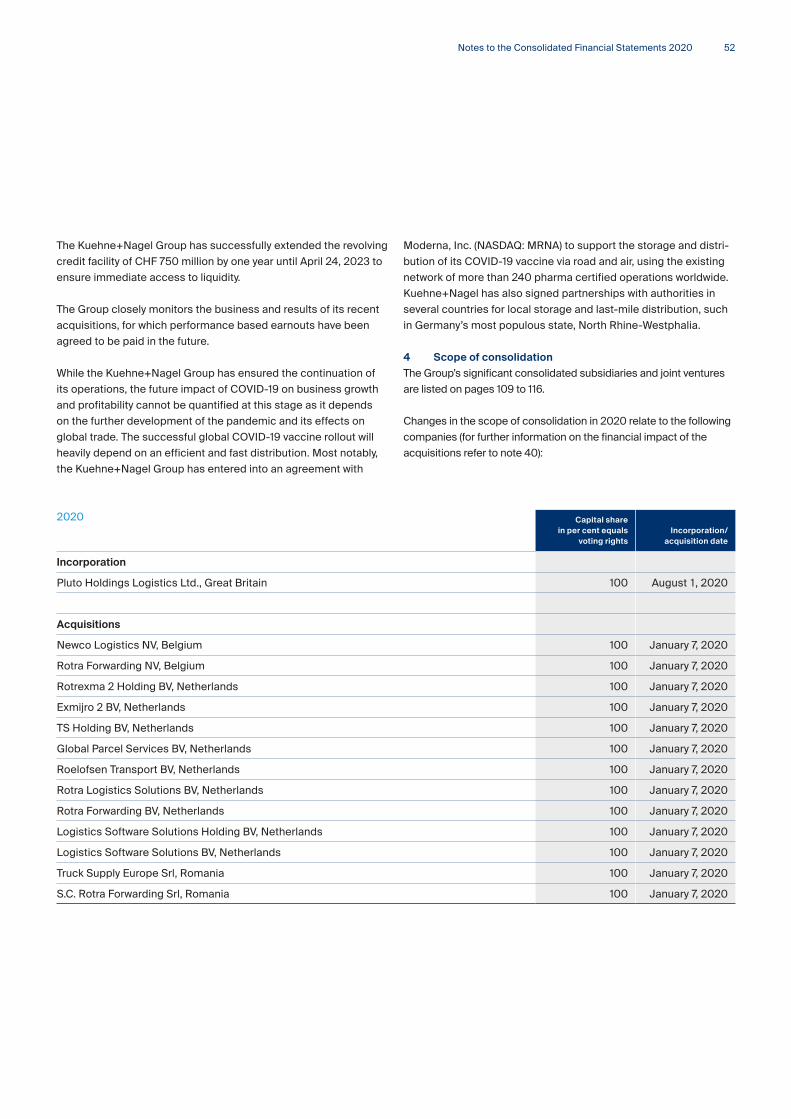
The Kuehne+Nagel Group has successfully extended the revolving
credit facility of CHF 750 million by one year until April 24, 2023 to
ensure immediate access to liquidity.
The Group closely monitors the business and results of its recent
acquisitions, for which performance based earnouts have been
agreed to be paid in the future.
While the Kuehne+Nagel Group has ensured the continuation of
its operations, the future impact of COVID-19 on business growth
and profitability cannot be quantified at this stage as it depends
on the further development of the pandemic and its effects on
global trade. The successful global COVID-19 vaccine rollout will
heavily depend on an efficient and fast distribution. Most notably,
the Kuehne+Nagel Group has entered into an agreement with
Moderna, Inc. (NASDAQ: MRNA) to support the storage and distri-
bution of its COVID-19 vaccine via road and air, using the existing
network of more than 240 pharma certified operations worldwide.
Kuehne+Nagel has also signed partnerships with authorities in
several countries for local storage and last-mile distribution, such
in Germany’s most populous state, North Rhine-Westphalia.
4 Scope of consolidation
The Group’s significant consolidated subsidiaries and joint ventures
are listed on pages 109 to 116.
Changes in the scope of consolidation in 2020 relate to the following
companies (for further information on the financial impact of the
acquisitions refer to note 40):
Notes to the Consolidated Financial Statements 2020
2020 Capital share in per cent equals
voting rights Incorporation/
acquisition date
Incorporation
Pluto Holdings Logistics Ltd., Great Britain 100 August 1, 2020
Acquisitions
Newco Logistics NV, Belgium 100 January 7, 2020
Rotra Forwarding NV, Belgium 100 January 7, 2020
Rotrexma 2 Holding BV, Netherlands 100 January 7, 2020
Exmijro 2 BV, Netherlands 100 January 7, 2020
TS Holding BV, Netherlands 100 January 7, 2020
Global Parcel Services BV, Netherlands 100 January 7, 2020
Roelofsen Transport BV, Netherlands 100 January 7, 2020
Rotra Logistics Solutions BV, Netherlands 100 January 7, 2020
Rotra Forwarding BV, Netherlands 100 January 7, 2020
Logistics Software Solutions Holding BV, Netherlands 100 January 7, 2020
Logistics Software Solutions BV, Netherlands 100 January 7, 2020
Truck Supply Europe Srl, Romania 100 January 7, 2020
S.C. Rotra Forwarding Srl, Romania 100 January 7, 2020
52

Consolidated Financial Statements 2020
value of any contingent consideration. If the contingent con-
sideration is classified as equity it is not re-measured, and
settlement is accounted for within equity. Otherwise, subsequent
changes to the fair value of the contingent consideration are
recognised in the income statement. The consideration trans-
ferred does not include amounts related to the settlement of
pre-existing relationships. Such amounts are generally recognised
in the income statement. Transaction costs other than those
associated with the issue of debt or equity securities incurred
in connection with a business combination are expensed as
incurred.
Written put options held by non-controlling shareholders
If the Group has a potential obligation to purchase shares in a
subsidiary from a non-controlling shareholder through a written
put option, a liability is recognised at the present value of the
redemption amount with a corresponding entry in equity. If a
non-controlling shareholder still has present access to the eco-
nomic benefits associated with the underlying ownership interest,
the non-controlling interest in the subsidiary continues to be
recognised as a separate component in equity.
5 Principles of consolidation
Business combinations
Business combinations are accounted for by applying the acqui-
sition method. The Group measures goodwill as the fair value
of the consideration transferred (including the fair value of any
previously held equity interest in the acquiree) and the recognised
amount of any non-controlling interests in the acquiree, less the
net recognised amount (generally fair value) of the identifiable
assets acquired and liabilities assumed, all measured as of the
acquisition date. If the excess is negative, a bargain purchase
gain is recognised immediately in the income statement.
The Group elects on a transaction-by-transaction basis whether
to measure non-controlling interests at its fair value or at its pro-
portionate share of the recognised amount of the identifiable net
assets at the acquisition date.
Consideration transferred includes the fair values of the assets
transferred, liabilities incurred by the Group to the previous owners
of the acquiree, equity interests issued by the Group, and the fair
Changes in the scope of consolidation for the year 2019 are related
to the following companies (for further information on the financial
impact of the acquisitions refer to note 40):
2019 Capital share in per cent equals
voting rights Incorporation/
acquisition date
Incorporation
Modern Office Pte Ltd, Singapore 100 January 1, 2019
Acquisitions
KN-Sincero Logistics Co. Ltd., China (formerly Shanghai Ruichun Logistics Co., Ltd.) 51 January 1, 2019
Zhejiang Jiajin Logistics Co. Ltd., China 51 January 1, 2019
Wuhan Zhisheng Logistics Co. Ltd., China 51 January 1, 2019
Shenzhen Hua Tie Xun Logistics CO. Ltd., China 51 January 1, 2019
JOELOG Beteiligungs GmbH, Austria 100 September 10, 2019
Jöbstl Gesellschaft mbH, Austria 100 September 10, 2019
Kurt Jöbstl Transport GmbH, Austria 100 September 10, 2019
SLM Spedition & Logistik GmbH, Austria 100 September 10, 2019
Jöbstl I d.o.o., Slovenia 100 September 10, 2019
53
Notes to the Consolidated Financial Statements 2020
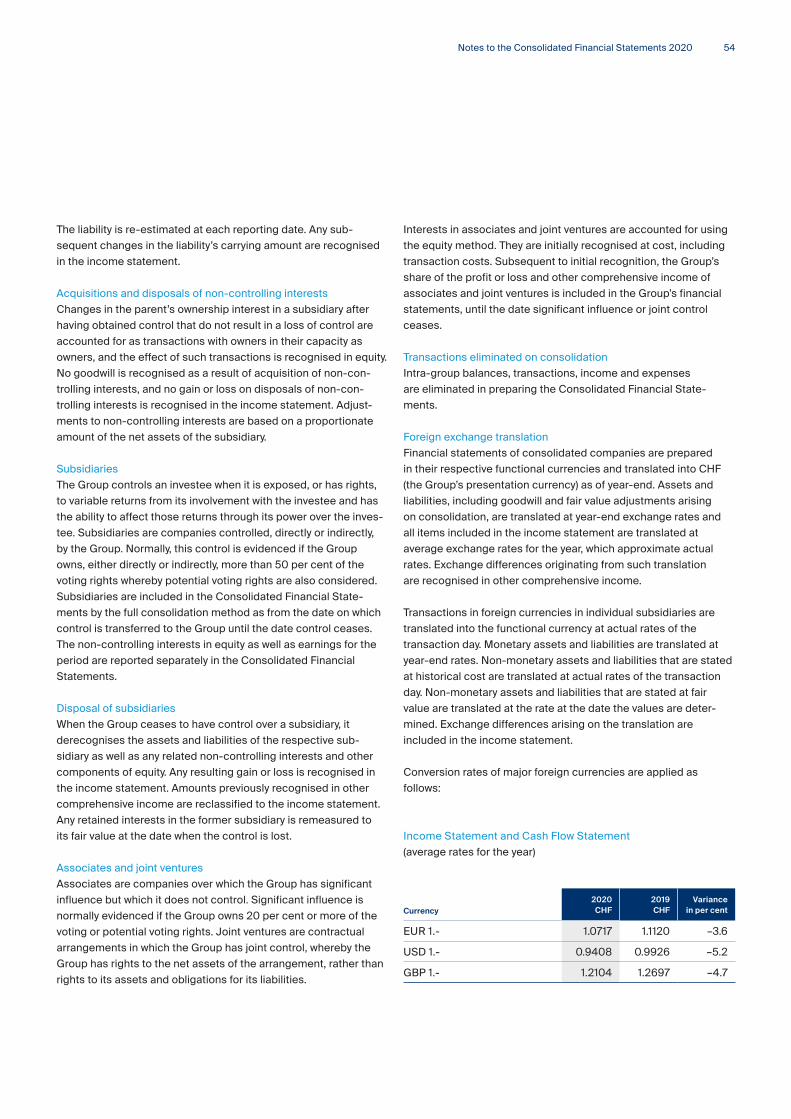
Currency2020CHF
2019CHF
Variance in per cent
EUR 1.- 1.0717 1.1120 –3.6
USD 1.- 0.9408 0.9926 –5.2
GBP 1.- 1.2104 1.2697 –4.7
The liability is re-estimated at each reporting date. Any sub-
sequent changes in the liability’s carrying amount are recognised
in the income statement.
Acquisitions and disposals of non-controlling interests
Changes in the parent’s ownership interest in a subsidiary after
having obtained control that do not result in a loss of control are
accounted for as transactions with owners in their capacity as
owners, and the effect of such transactions is recognised in equity.
No goodwill is recognised as a result of acquisition of non-con-
trolling interests, and no gain or loss on disposals of non-con-
trolling interests is recognised in the income statement. Adjust-
ments to non-controlling interests are based on a proportionate
amount of the net assets of the subsidiary.
Subsidiaries
The Group controls an investee when it is exposed, or has rights,
to variable returns from its involvement with the investee and has
the ability to affect those returns through its power over the inves-
tee. Subsidiaries are companies controlled, directly or indirectly,
by the Group. Normally, this control is evidenced if the Group
owns, either directly or indirectly, more than 50 per cent of the
voting rights whereby potential voting rights are also considered.
Subsidiaries are included in the Consolidated Financial State-
ments by the full consolidation method as from the date on which
control is transferred to the Group until the date control ceases.
The non-controlling interests in equity as well as earnings for the
period are reported separately in the Consolidated Financial
Statements.
Disposal of subsidiaries
When the Group ceases to have control over a subsidiary, it
derecognises the assets and liabilities of the respective sub-
sidiary as well as any related non-controlling interests and other
components of equity. Any resulting gain or loss is recognised in
the income statement. Amounts previously recognised in other
comprehensive income are reclassified to the income statement.
Any retained interests in the former subsidiary is remeasured to
its fair value at the date when the control is lost.
Associates and joint ventures
Associates are companies over which the Group has significant
influence but which it does not control. Significant influence is
normally evidenced if the Group owns 20 per cent or more of the
voting or potential voting rights. Joint ventures are contractual
arrangements in which the Group has joint control, whereby the
Group has rights to the net assets of the arrangement, rather than
rights to its assets and obligations for its liabilities.
Interests in associates and joint ventures are accounted for using
the equity method. They are initially recognised at cost, including
transaction costs. Subsequent to initial recognition, the Group’s
share of the profit or loss and other comprehensive income of
associates and joint ventures is included in the Group’s financial
statements, until the date significant influence or joint control
ceases.
Transactions eliminated on consolidation
Intra-group balances, transactions, income and expenses
are eliminated in preparing the Consolidated Financial State-
ments.
Foreign exchange translation
Financial statements of consolidated companies are prepared
in their respective functional currencies and translated into CHF
(the Group’s presentation currency) as of year-end. Assets and
liabilities, including goodwill and fair value adjustments arising
on consolidation, are translated at year-end exchange rates and
all items included in the income statement are translated at
average exchange rates for the year, which approximate actual
rates. Exchange differences originating from such translation
are recognised in other comprehensive income.
Transactions in foreign currencies in individual subsidiaries are
translated into the functional currency at actual rates of the
transaction day. Monetary assets and liabilities are translated at
year-end rates. Non-monetary assets and liabilities that are stated
at historical cost are translated at actual rates of the transaction
day. Non-monetary assets and liabilities that are stated at fair
value are translated at the rate at the date the values are deter-
mined. Exchange differences arising on the translation are
included in the income statement.
Conversion rates of major foreign currencies are applied as
follows:
Income Statement and Cash Flow Statement
(average rates for the year)
54
Consolidated Financial Statements 2020
■ Financial assets measured at fair value through profit or
loss (FVPL)
Financial assets, such as derivatives, are measured at fair value.
Changes in fair value are recognised in the income statement
as they arise.
No financial assets were measured at fair value through other
comprehensive income (FVOCI) for the periods ended December 31,
2020 and December 31, 2019.
Financial liabilities
All financial liabilities are initially recognised at fair value minus,
in the case of financial liabilities not at fair value through profit or
loss, transactions costs. The Group measures and classifies its
financial liabilities at amortised cost, unless they are measured at
fair value through profit or loss such as derivatives and contingent
considerations.
■ Financial liabilities measured at amortised cost
The liabilities are measured at the amount recognised at initial
recognition minus principal repayments, plus or minus the
cumulative amortisation of any difference between the initial
and the maturity amount. Interest expense is calculated using
the effective interest method and is recognised in the income
statement. Gains and losses are recognised in the income
statement when the liability is derecognised or reclassified.
A majority of the Group’s financial liabilities are measured at
amortised cost.
■ Financial liabilities measured at fair value through profit or loss
(FVPL)
Financial liabilities, such as derivatives and contingent consid-
eration arrangements from business combinations classified
as financial liabilities, are measured at fair value. Changes in
fair value are recognised in the income statement as they arise.
Derivatives
Derivative financial instruments (foreign exchange contracts)
are used to hedge foreign exchange exposures on outstanding
balances in the Group’s internal clearing system centralised at the
head office. Given that the Group’s hedging activities are limited to
hedges of recognised foreign currency monetary items, the Group
does not apply hedge accounting. Derivatives are measured at
fair value through profit or loss, and all changes in fair value are
recognised immediately in the income statement as part of finan-
cial income or expenses. All derivatives with a positive fair value
are presented as derivative assets and included in the line “other
receivables” on the balance sheet, while all derivatives with a neg-
ative fair value are presented as derivative liabilities and included
in the line “other current liabilities”.
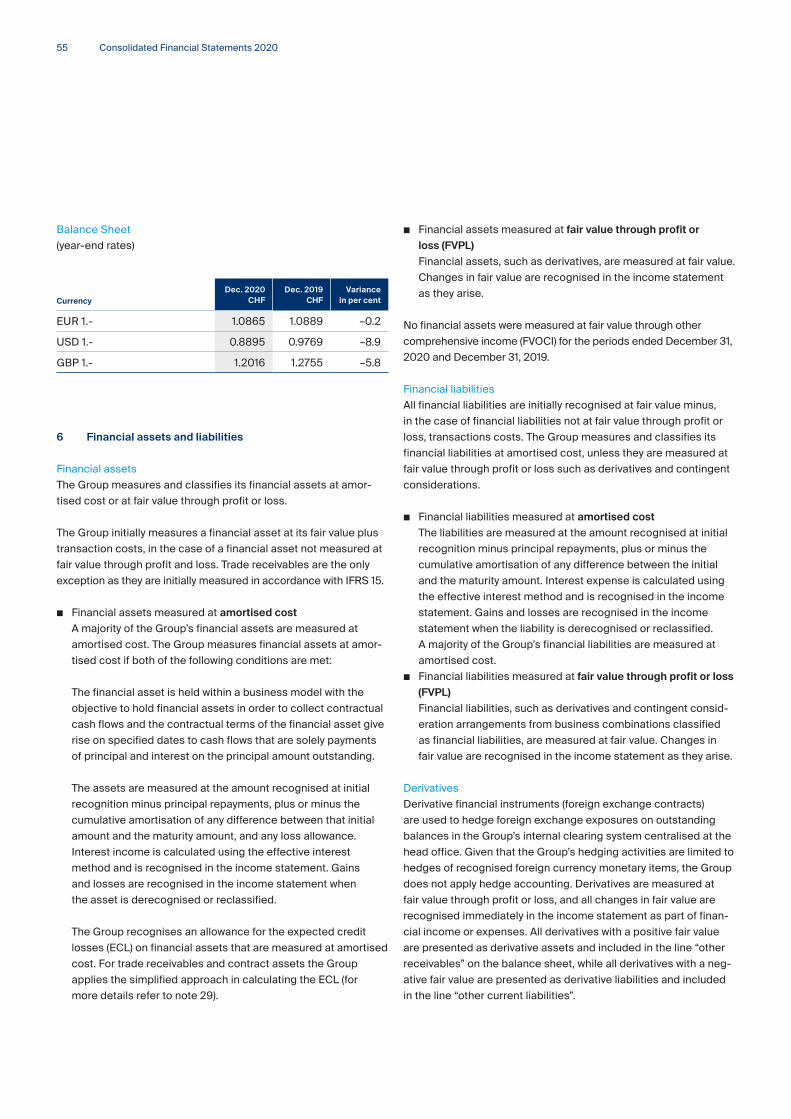
Balance Sheet
(year-end rates)
6 Financial assets and liabilities
Financial assets
The Group measures and classifies its financial assets at amor-
tised cost or at fair value through profit or loss.
The Group initially measures a financial asset at its fair value plus
transaction costs, in the case of a financial asset not measured at
fair value through profit and loss. Trade receivables are the only
exception as they are initially measured in accordance with IFRS 15.
■ Financial assets measured at amortised cost
A majority of the Group’s financial assets are measured at
amortised cost. The Group measures financial assets at amor-
tised cost if both of the following conditions are met:
The financial asset is held within a business model with the
objective to hold financial assets in order to collect contractual
cash flows and the contractual terms of the financial asset give
rise on specified dates to cash flows that are solely payments
of principal and interest on the principal amount outstanding.
The assets are measured at the amount recognised at initial
recognition minus principal repayments, plus or minus the
cumulative amortisation of any difference between that initial
amount and the maturity amount, and any loss allowance.
Interest income is calculated using the effective interest
method and is recognised in the income statement. Gains
and losses are recognised in the income statement when
the asset is derecognised or reclassified.
The Group recognises an allowance for the expected credit
losses (ECL) on financial assets that are measured at amortised
cost. For trade receivables and contract assets the Group
applies the simplified approach in calculating the ECL (for
more details refer to note 29).
CurrencyDec. 2020
CHFDec. 2019
CHFVariance
in per cent
EUR 1.- 1.0865 1.0889 –0.2
USD 1.- 0.8895 0.9769 –8.9
GBP 1.- 1.2016 1.2755 –5.8
55
Notes to the Consolidated Financial Statements 2020
borrowing rate (IBR) where the rate implicit in the lease is not readily
determinable. Subsequently, the carrying amount is increased by
the interest on the lease liabilities and reduced by the lease pay-
ments made. The liabilities are remeasured to reflect a reassess-
ment of the lease contract or contract modifications.
The Group does not recognise right-of-use assets and lease
liabilities for short-term (lease duration of less than 12 months)
and low value leases. These lease payments are expensed on
a straight-line basis over the lease period.
The Group does not separate non-lease from lease components,
but instead accounts for both as a single lease.
In case of sale and leaseback transactions that qualify as a sale,
the Group measures the right-of-use asset from the leaseback at
the proportion of the previous carrying amount of the asset that
relates to the right-of-use retained. Accordingly, only the amount of
any gain or loss that relates to the rights transferred is recognised
in the income statement. If the fair value of the consideration for the
sale of the asset does not equal the fair value of the asset, or if the
payments for the lease are not at market rates, the Group accounts
for the difference as either prepayments or additional financing.
9 Intangibles
Goodwill
Goodwill arising from an acquisition represents the excess of fair
value of the consideration transferred (including the fair value of
any previously held equity interest in the acquiree) and the recog-
nised amount of any non-controlling interests in the acquiree, less
the net recognised amount (generally fair value) of the identifiable
assets acquired and liabilities assumed.
Goodwill is stated at cost less accumulated impairment losses.
Goodwill is tested annually for impairment at year-end. However, if
there is an indication that goodwill could be impaired at any other
point in time, an impairment test is performed. The Kuehne+Nagel
Group has changed the level at which goodwill is tested in 2020.
For further details refer to note 28.
Other intangibles
Other identifiable intangibles (i.e. software, customer lists, customer
contracts, brands) purchased from third parties or acquired in a
business combination are separately recognised as intangibles and
are stated at cost less accumulated amortisation and accumulated
impairment losses. Intangibles acquired in a business combination
are recognised separately from goodwill if they are subject to
contractual or legal rights or are separately transferable. Software
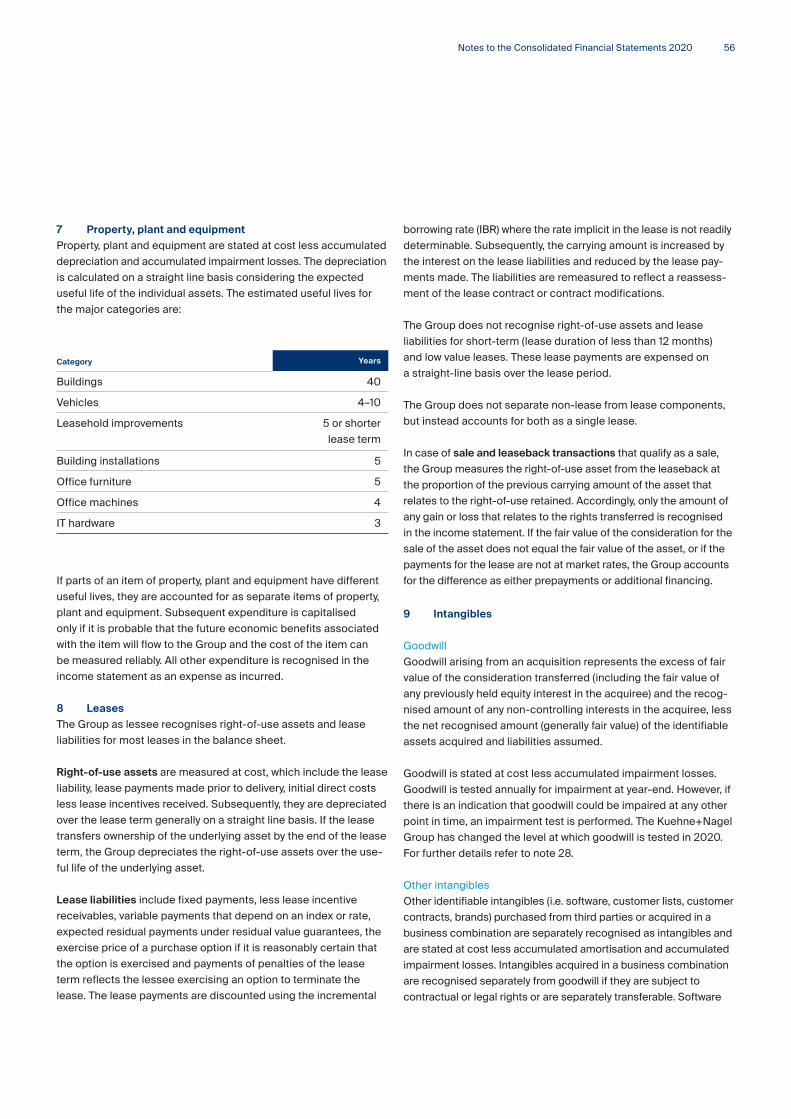
7 Property, plant and equipment
Property, plant and equipment are stated at cost less accumulated
depreciation and accumulated impairment losses. The depreciation
is calculated on a straight line basis considering the expected
useful life of the individual assets. The estimated useful lives for
the major categories are:
If parts of an item of property, plant and equipment have different
useful lives, they are accounted for as separate items of property,
plant and equipment. Subsequent expenditure is capitalised
only if it is probable that the future economic benefits associated
with the item will flow to the Group and the cost of the item can
be measured reliably. All other expenditure is recognised in the
income statement as an expense as incurred.
8 Leases
The Group as lessee recognises right-of-use assets and lease
liabilities for most leases in the balance sheet.
Right-of-use assets are measured at cost, which include the lease
liability, lease payments made prior to delivery, initial direct costs
less lease incentives received. Subsequently, they are depreciated
over the lease term generally on a straight line basis. If the lease
transfers ownership of the underlying asset by the end of the lease
term, the Group depreciates the right-of-use assets over the use-
ful life of the underlying asset.
Lease liabilities include fixed payments, less lease incentive
receivables, variable payments that depend on an index or rate,
expected residual payments under residual value guarantees, the
exercise price of a purchase option if it is reasonably certain that
the option is exercised and payments of penalties of the lease
term reflects the lessee exercising an option to terminate the
lease. The lease payments are discounted using the incremental
Category Years
Buildings 40
Vehicles 4–10
Leasehold improvements 5 or shorter
lease term
Building installations 5
Office furniture 5
Office machines 4
IT hardware 3
56
Consolidated Financial Statements 2020
11 Cash and cash equivalents
Cash and cash equivalents comprise cash at banks and in hand
as well as short-term deposits and highly liquid investments with a
term of three months or less from the date of acquisition that are
readily convertible to known amounts of cash and that are subject
to an insignificant risk of changes in value. For the purpose of the
consolidated cash flow statement, cash and cash equivalents
consist also of bank overdrafts that are repayable on demand as
they are forming an integral part of the Group’s cash management.
12 Share capital
Shares
Incremental costs directly attributable to the issue of shares and
share options are recognised as a deduction from equity.
Treasury shares
When equity is repurchased, the amount of the consideration
paid, which includes directly attributable costs, is recognised as
a deduction from equity. Repurchased shares are classified as
treasury shares and are presented as a deduction from total
equity. When treasury shares are sold or reissued subsequently,
the amount received is recognised as an increase in equity, and
the resulting gain or loss on the transaction, net of any tax effects,
is transferred to or from the share premium.
13 Provisions
Provisions are recognised when the Group has a present
obligation (legal or constructive) as a result of a past event if
it is probable that an outflow of resources will be required to
settle the obligation and the amount of the obligation can be
estimated reliably. If the effect is material, provisions are deter-
mined by discounting the expected future cash flows at a pre-
tax rate that reflects current market assessments of the time
value of money and, where appropriate, the risks specific to
the liability. A provision is classified in non-current liabilities in
case the expected timing of the payment of the amounts pro-
vided for is more than one year.
is amortised over its estimated useful life, three years maximum.
Other intangibles are amortised on a straight line basis over their
estimated useful lives (up to ten years maximum). As of December
31, 2020 and 2019, there are no intangibles with indefinite useful
life recognised in the Group’s balance sheet.
10 Impairment of non-financial assets
The carrying amounts of the Group’s investments in associates
and joint ventures, its intangibles, property, plant and equipment
and right-of-use assets, are reviewed at each balance sheet date
to determine whether there is any indication of impairment. If any
such indication exists, the asset’s recoverable amount is estimated.
Goodwill is tested for impairment every year. An impairment loss
is recognised whenever the carrying amount of an asset or its
cash-generating unit exceeds its recoverable amount.
The Group has changed the level of goodwill impairment testing.
Details on the change are described in note 28.
Calculation of a recoverable amount
The recoverable amount of an asset is the greater of its fair value
less costs of disposal and its value in use. In assessing value in
use the estimated future cash flows are discounted to their present
value using a pre-tax discount rate that reflects current market
assessments of the time value of money and the risks specific to
the asset. For an asset that does not generate largely independent
cash inflows, the recoverable amount is determined for the
cash-generating unit the asset belongs to. For the purposes of the
goodwill impairment testing, the cash-generating units are aggre-
gated into the global business units.
Reversals of impairment losses
An impairment loss recognised for goodwill is not reversed. In
respect to other assets, an impairment loss is reversed if there has
been a change in the estimates used to determine the recoverable
amount. An impairment loss is reversed only to the extent that the
asset’s carrying amount does not exceed the carrying amount that
would have been determined, net of depreciation or amortisation,
if no impairment loss had been recognised.
57
Notes to the Consolidated Financial Statements 2020
the Company into the plan. These shares are blocked for three
years whereby voting rights and rights to receive dividends remain
intact with the holder of the shares.
For each invested share the Group will match additional shares
upon completion of a three-year vesting period and service con-
dition during the same period.
The fair value of shares matched under the SMP is recognised
as a personnel expense with a corresponding increase in equity.
The fair value of matched shares is equal to the market price at
grant date reduced by the present value of the expected dividends
during the vesting period and recognised as personnel expense
over the relevant vesting periods. The amount expensed is adjusted
to reflect actual and expected levels of vesting.
15 Revenue recognition
The Group generates its revenues from four principal services:
1) Sea Logistics, 2) Air Logistics, 3) Road Logistics, and 4) Contract
Logistics. Revenues reported in each of these reportable segments
include revenues generated from the principal service as well as
revenues generated from ancillary services like customs clearance,
export documentation, import documentation, door-to-door
service, and arrangement of complex logistics supply movement,
that are incidental to the principal service.
In Sea Logistics, Air Logistics and Road Logistics the Group
generates the majority of its revenues by purchasing transpor-
tation services from direct (asset-based) carriers and selling a
combination of those services to its customers. In its capacity of
arranging carrier services, the Group issues a contract of carriage
to customers. Revenues related to shipments are recognised
based upon the terms in the contract of carriage and to the extent
a service is completed. A typical shipment would include services
rendered at origin, such as pick-up and delivery to port, freight
services from origin to destination port and destination services,
such as customs clearance and final delivery. These services
are considered to represent one single performance obligation
satisfied over time. The Group measures the fulfilment of its
performance obligations as services are rendered based on the
status of a shipment.
14 Pension plans, severance payments
and share-based compensation plans
Some consolidated companies maintain pension plans in favour
of their personnel in addition to the legally required social insur-
ance schemes. The pension plans partly exist as independent
trusts and are classified as a defined contribution or a defined
benefit plan.
Defined benefit plans
The aggregate of the present value of the defined benefit obliga-
tion and the fair value of plan assets for each plan is recorded in
the Balance Sheet as net defined benefit liability or net defined
benefit asset. The discount rate is the yield at the reporting date
on “AA” credit-rated corporate bonds that have maturity dates
approximating the terms of the Group’s obligations and that are
denominated in the same currency in which benefits are expected
to be paid. The calculation is performed by an independent, quali-
fied actuary using the projected unit credit method.
All actuarial gains and losses arising from defined benefit plans
are recognised immediately in other comprehensive income.
Service cost and net interest income/expense is recognised in
personnel expenses.
Defined contribution plans
Obligations for contributions to defined contribution pension
plans are recognised in the income statement as an expense
in the periods during which services are rendered by the
employees.
Severance payments
The Group provides severance benefits to employees as legally
required in certain countries, which are accounted for as defined
benefit plans and measured using the projected unit credit method
with all actuarial gains and losses immediately recognised in the
income statement.
Share-based compensation plans
The Company has various Share Matching Plans (SMP) in place.
These long-term incentive plans allow selected employees of the
Group to invest at a specified date previously acquired shares of
58

Consolidated Financial Statements 2020
Deferred tax is recognised based on the balance sheet liability
method, on temporary differences between the carrying amounts
of assets and liabilities for financial reporting purposes and their
tax base. The following temporary differences are not accounted
for: initial recognition of goodwill, initial recognition of assets or
liabilities that affect neither accounting nor taxable profit, and
differences relating to investments in subsidiaries to the extent
that they will probably not reverse in the foreseeable future.
The amount of deferred tax recognised is based on the expected
manner of realisation or settlement of the carrying amount of
assets and liabilities, using tax rates enacted or substantially
enacted at the balance sheet date.
A deferred tax asset in respect of temporary differences or unused
tax losses is recognised only to the extent that it is probable that
future taxable profits will be available against which the asset can
be utilised. Deferred tax assets are reduced to the extent that it is
no longer probable that the related tax benefit will be realised.
18 Non-current assets held for sale
and discontinued operations
Non-current assets (or disposal groups) are classified as held for
sale if their carrying amount will be recovered principally through
a sale transaction rather than from continuing use. The asset (or
disposal group) must be available for immediate sale in its present
condition and the sale must be highly probable. Immediately
before classification as held for sale, the measurement of the assets
(and all assets and liabilities in a disposal group) is updated in
accordance with applicable IFRS. Then, on initial classification as
held for sale, non-current assets and disposal groups are recog-
nised at the lower of carrying amount and fair value less costs to
sell. Impairment losses on initial classification as held for sale are
included in the income statement. Intangible assets and property,
plant and equipment once classified as held for sale are not
amortised or depreciated.
A discontinued operation is a component of the Group’s business
that represents a separate major line of business or geographical
area of operations or is a company acquired exclusively with a view
to resale. Classification as a discontinued operation occurs upon
disposal or when the operation meets the criteria to be classified
as held for sale.
In Contract Logistics the principal services are related to customer
contracts for warehousing and distribution activities, usually
representing a series of distinct services that are considered a
single performance obligation. Based on the customer contracts,
revenues are recognised to the extent the service is rendered.
There are no significant judgements involved in the measure-
ment of the performance of its obligations and the Group’s
contracts do not include any material variable considerations.
The Group elects to use the practical expedient regarding the
disclosure requirement of the transaction price allocated to un-
satisfied performance obligations. In nearly all customer contracts
either the original expected duration is one year or less or the
revenue is recognised at the amount to which the Group has a
right to invoice.
Contract assets are recorded for unbilled work in progress,
whereas amounts received for services that are not yet completed
are presented as contract liabilities.
Gross profit is a better indication of the performance in the
logistics industry than revenue. The gross profit represents
the difference between the revenue and the cost of services
rendered by third parties for all reportable segments.
16 Interest expenses and income
Interest expenses and income are recognised as they accrue
using the effective interest method.
17 Income tax
Income tax on earnings for the year comprises current and
deferred tax. Both current and deferred tax are recognised in the
income statement, except to the extent that the tax relates to
business combinations or items recognised directly in equity or
in other comprehensive income.
Current tax is the expected tax payable or receivable on the tax-
able income or loss for the year, using tax rates enacted or sub-
stantially enacted at the balance sheet date and any adjustment
to tax payable for previous years.
59
Other notes
Other notes
19 Segment reporting
a) Reportable segments
The Group provides integrated logistics solutions across custom-
ers’ supply chains using its global logistics network.
The four reportable segments, Sea Logistics, Air Logistics, Road
Logistics and Contract Logistics, reflect the internal management
and reporting structure to the Management Board (the chief oper-
ating decision maker, CODM) and are managed through specific
organisational structures. The CODM reviews internal management
reports on a monthly basis. Each segment is a distinguishable
business unit and is engaged in providing and selling discrete
products and services.
The discrete distinction between Sea Logistics, Air Logistics and
Road Logistics is the usage of the same transportation mode within
a reportable segment. In addition to common business processes
and management routines, a single main transportation mode is
used within a reportable segment. For the reportable segment
Contract Logistics the services performed are related to customer
contracts for warehouse and distribution activities, whereby ser-
vices performed are storage, handling and distribution.
Pricing between segments is determined on an arm’s length basis.
The accounting policies of the reportable segments are the same
as applied in the Consolidated Financial Statements.
Information about the reportable segments is presented on the
next pages. Segment performance is based on EBIT as reviewed by
the CODM. The column “eliminations” shows the eliminations of
turnover and expenses between segments. All operating expenses
are allocated to the segments and included in the EBIT.
b) Geographical information
The Group operates on a worldwide basis in several geographical
areas: Europe, Middle East and Africa (EMEA), Americas and
Asia-Pacific. All products and services are provided in each of
these geographical regions. The regional revenue is based on the
geographical location of the customers invoiced, and regional
assets are based on the geographical location of assets.
c) Major customers
There is no single customer who represents more than ten per
cent of the Group’s total revenue.
60
Consolidated Financial Statements 2020
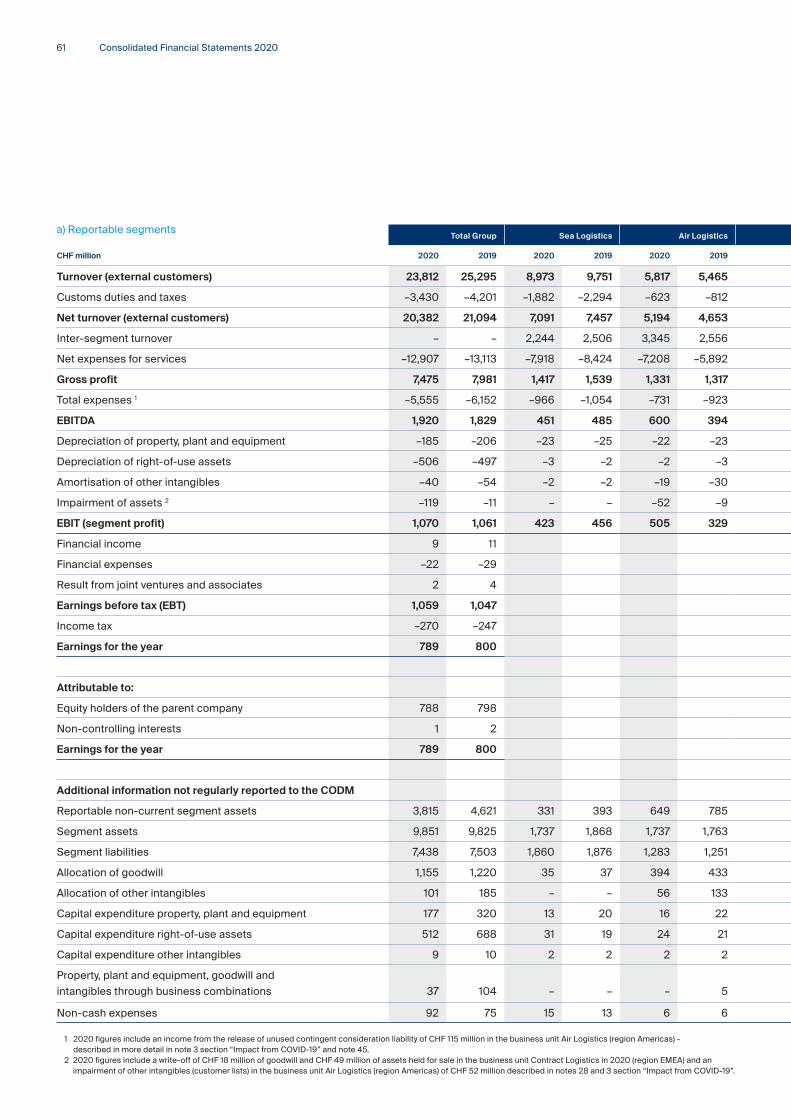
Total Group Sea Logistics Air Logistics Road Logistics Contract Logistics Total reportable segments Eliminations Unallocated corporate
CHF million 2020 2019 2020 2019 2020 2019 2020 2019 2020 2019 2020 2019 2020 2019 2020 2019
Turnover (external customers) 23,812 25,295 8,973 9,751 5,817 5,465 3,633 4,102 5,389 5,977 23,812 25,295 – – – –
Customs duties and taxes –3,430 –4,201 –1,882 –2,294 –623 –812 –411 –516 –514 –579 –3,430 –4,201 – – – –
Net turnover (external customers) 20,382 21,094 7,091 7,457 5,194 4,653 3,222 3,586 4,875 5,398 20,382 21,094 – – – –
Inter-segment turnover – – 2,244 2,506 3,345 2,556 1,385 1,511 214 237 7,188 6,810 –7,188 –6,810 – –
Net expenses for services –12,907 –13,113 –7,918 –8,424 –7,208 –5,892 –3,518 –3,976 –1,451 –1,631 –20,095 –19,923 7,188 6,810 – –
Gross profit 7,475 7,981 1,417 1,539 1,331 1,317 1,089 1,121 3,638 4,004 7,475 7,981 – – – –
Total expenses 1 –5,555 –6,152 –966 –1,054 –731 –923 –970 –985 –2,888 –3,190 –5,555 –6,152 – – – –
EBITDA 1,920 1,829 451 485 600 394 119 136 750 814 1,920 1,829 – – – –
Depreciation of property, plant and equipment –185 –206 –23 –25 –22 –23 –24 –28 –116 –130 –185 –206 – – – –
Depreciation of right-of-use assets –506 –497 –3 –2 –2 –3 –20 –14 –481 –478 –506 –497 – – – –
Amortisation of other intangibles –40 –54 –2 –2 –19 –30 –13 –14 –6 –8 –40 –54 – – – –
Impairment of assets 2 –119 –11 – – –52 –9 – –2 –67 – –119 –11 – – – –
EBIT (segment profit) 1,070 1,061 423 456 505 329 62 78 80 198 1,070 1,061 – – – –
Financial income 9 11
Financial expenses –22 –29
Result from joint ventures and associates 2 4
Earnings before tax (EBT) 1,059 1,047
Income tax –270 –247
Earnings for the year 789 800
Attributable to:
Equity holders of the parent company 788 798
Non-controlling interests 1 2
Earnings for the year 789 800
Additional information not regularly reported to the CODM
Reportable non-current segment assets 3,815 4,621 331 393 649 785 581 608 1,992 2,607 3,553 4,393 – – 262 228
Segment assets 9,851 9,825 1,737 1,868 1,737 1,763 1,109 1,314 3,249 3,696 7,832 8,641 – – 2,019 1,184
Segment liabilities 7,438 7,503 1,860 1,876 1,283 1,251 1,053 1,077 2,615 2,659 6,811 6,863 – – 627 640
Allocation of goodwill 1,155 1,220 35 37 394 433 335 326 391 424 1,155 1,220 – – – –
Allocation of other intangibles 101 185 – – 56 133 38 43 7 9 101 185 – – – –
Capital expenditure property, plant and equipment 177 320 13 20 16 22 19 31 129 247 177 320 – – – –
Capital expenditure right-of-use assets 512 688 31 19 24 21 30 35 427 613 512 688 – – – –
Capital expenditure other intangibles 9 10 2 2 2 2 1 1 4 5 9 10 – – – –
Property, plant and equipment, goodwill and
intangibles through business combinations 37 104 – – – 5 37 20 – 79 37 104 – – – –
Non-cash expenses 92 75 15 13 6 6 20 14 51 42 92 75 – – – – 1 2020 figures include an income from the release of unused contingent consideration liability of CHF 115 million in the business unit Air Logistics (region Americas) -
described in more detail in note 3 section “Impact from COVID-19” and note 45. 2 2020 figures include a write-off of CHF 18 million of goodwill and CHF 49 million of assets held for sale in the business unit Contract Logistics in 2020 (region EMEA) and an
impairment of other intangibles (customer lists) in the business unit Air Logistics (region Americas) of CHF 52 million described in notes 28 and 3 section “Impact from COVID-19”.
a) Reportable segments
61

Total Group Sea Logistics Air Logistics Road Logistics Contract Logistics Total reportable segments Eliminations Unallocated corporate
CHF million 2020 2019 2020 2019 2020 2019 2020 2019 2020 2019 2020 2019 2020 2019 2020 2019
Turnover (external customers) 23,812 25,295 8,973 9,751 5,817 5,465 3,633 4,102 5,389 5,977 23,812 25,295 – – – –
Customs duties and taxes –3,430 –4,201 –1,882 –2,294 –623 –812 –411 –516 –514 –579 –3,430 –4,201 – – – –
Net turnover (external customers) 20,382 21,094 7,091 7,457 5,194 4,653 3,222 3,586 4,875 5,398 20,382 21,094 – – – –
Inter-segment turnover – – 2,244 2,506 3,345 2,556 1,385 1,511 214 237 7,188 6,810 –7,188 –6,810 – –
Net expenses for services –12,907 –13,113 –7,918 –8,424 –7,208 –5,892 –3,518 –3,976 –1,451 –1,631 –20,095 –19,923 7,188 6,810 – –
Gross profit 7,475 7,981 1,417 1,539 1,331 1,317 1,089 1,121 3,638 4,004 7,475 7,981 – – – –
Total expenses 1 –5,555 –6,152 –966 –1,054 –731 –923 –970 –985 –2,888 –3,190 –5,555 –6,152 – – – –
EBITDA 1,920 1,829 451 485 600 394 119 136 750 814 1,920 1,829 – – – –
Depreciation of property, plant and equipment –185 –206 –23 –25 –22 –23 –24 –28 –116 –130 –185 –206 – – – –
Depreciation of right-of-use assets –506 –497 –3 –2 –2 –3 –20 –14 –481 –478 –506 –497 – – – –
Amortisation of other intangibles –40 –54 –2 –2 –19 –30 –13 –14 –6 –8 –40 –54 – – – –
Impairment of assets 2 –119 –11 – – –52 –9 – –2 –67 – –119 –11 – – – –
EBIT (segment profit) 1,070 1,061 423 456 505 329 62 78 80 198 1,070 1,061 – – – –
Financial income 9 11
Financial expenses –22 –29
Result from joint ventures and associates 2 4
Earnings before tax (EBT) 1,059 1,047
Income tax –270 –247
Earnings for the year 789 800
Attributable to:
Equity holders of the parent company 788 798
Non-controlling interests 1 2
Earnings for the year 789 800
Additional information not regularly reported to the CODM
Reportable non-current segment assets 3,815 4,621 331 393 649 785 581 608 1,992 2,607 3,553 4,393 – – 262 228
Segment assets 9,851 9,825 1,737 1,868 1,737 1,763 1,109 1,314 3,249 3,696 7,832 8,641 – – 2,019 1,184
Segment liabilities 7,438 7,503 1,860 1,876 1,283 1,251 1,053 1,077 2,615 2,659 6,811 6,863 – – 627 640
Allocation of goodwill 1,155 1,220 35 37 394 433 335 326 391 424 1,155 1,220 – – – –
Allocation of other intangibles 101 185 – – 56 133 38 43 7 9 101 185 – – – –
Capital expenditure property, plant and equipment 177 320 13 20 16 22 19 31 129 247 177 320 – – – –
Capital expenditure right-of-use assets 512 688 31 19 24 21 30 35 427 613 512 688 – – – –
Capital expenditure other intangibles 9 10 2 2 2 2 1 1 4 5 9 10 – – – –
Property, plant and equipment, goodwill and
intangibles through business combinations 37 104 – – – 5 37 20 – 79 37 104 – – – –
Non-cash expenses 92 75 15 13 6 6 20 14 51 42 92 75 – – – – 1 2020 figures include an income from the release of unused contingent consideration liability of CHF 115 million in the business unit Air Logistics (region Americas) -
described in more detail in note 3 section “Impact from COVID-19” and note 45. 2 2020 figures include a write-off of CHF 18 million of goodwill and CHF 49 million of assets held for sale in the business unit Contract Logistics in 2020 (region EMEA) and an
impairment of other intangibles (customer lists) in the business unit Air Logistics (region Americas) of CHF 52 million described in notes 28 and 3 section “Impact from COVID-19”.
62Other notes
Consolidated Financial Statements 2020
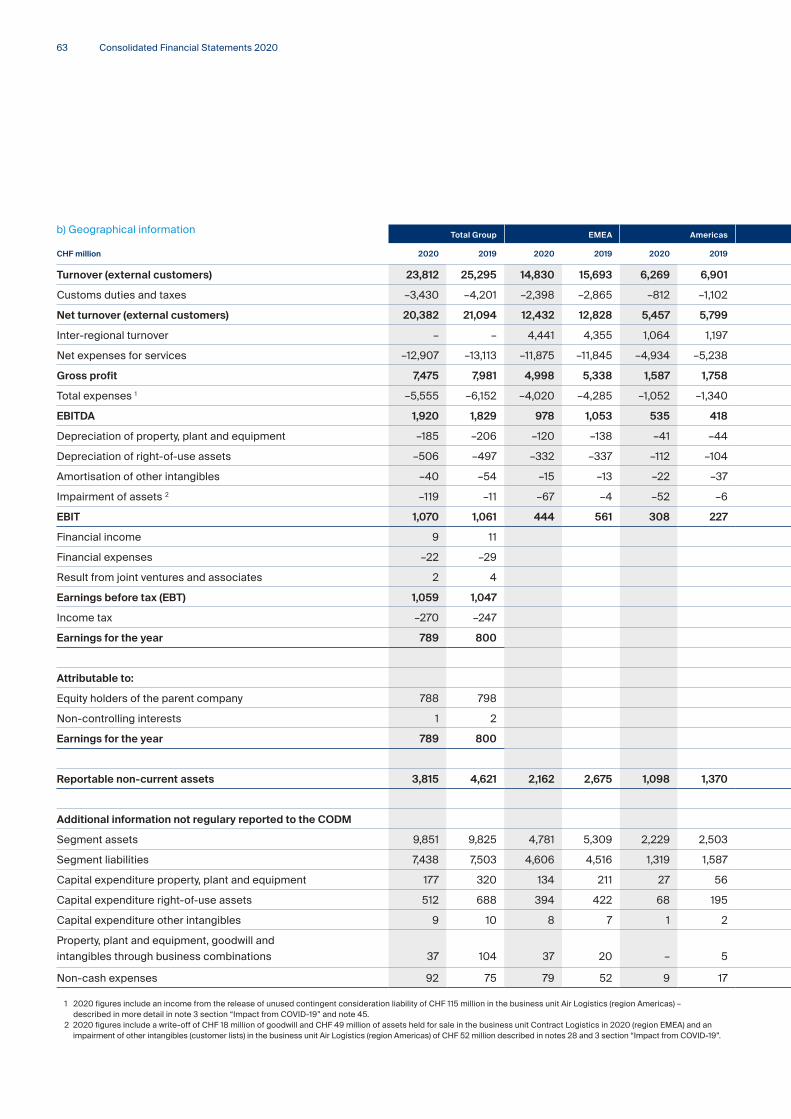
Total Group EMEA Americas Asia-Pacific Eliminations Unallocated corporate
CHF million 2020 2019 2020 2019 2020 2019 2020 2019 2020 2019 2020 2019
Turnover (external customers) 23,812 25,295 14,830 15,693 6,269 6,901 2,713 2,701 – – – –
Customs duties and taxes –3,430 –4,201 –2,398 –2,865 –812 –1,102 –220 –234 – – – –
Net turnover (external customers) 20,382 21,094 12,432 12,828 5,457 5,799 2,493 2,467 – – – –
Inter-regional turnover – – 4,441 4,355 1,064 1,197 1,683 1,258 –7,188 –6,810 – –
Net expenses for services –12,907 –13,113 –11,875 –11,845 –4,934 –5,238 –3,286 –2,840 7,188 6,810 – –
Gross profit 7,475 7,981 4,998 5,338 1,587 1,758 890 885 – – – –
Total expenses 1 –5,555 –6,152 –4,020 –4,285 –1,052 –1,340 –483 –527 – – – –
EBITDA 1,920 1,829 978 1,053 535 418 407 358 – – – –
Depreciation of property, plant and equipment –185 –206 –120 –138 –41 –44 –24 –24 – – – –
Depreciation of right-of-use assets –506 –497 –332 –337 –112 –104 –62 –56 – – – –
Amortisation of other intangibles –40 –54 –15 –13 –22 –37 –3 –4 – – – –
Impairment of assets 2 –119 –11 –67 –4 –52 –6 – –1 – – – –
EBIT 1,070 1,061 444 561 308 227 318 273 – – – –
Financial income 9 11
Financial expenses –22 –29
Result from joint ventures and associates 2 4
Earnings before tax (EBT) 1,059 1,047
Income tax –270 –247
Earnings for the year 789 800
Attributable to:
Equity holders of the parent company 788 798
Non-controlling interests 1 2
Earnings for the year 789 800
Reportable non-current assets 3,815 4,621 2,162 2,675 1,098 1,370 293 348 – – 262 228
Additional information not regulary reported to the CODM
Segment assets 9,851 9,825 4,781 5,309 2,229 2,503 822 829 – – 2,019 1,184
Segment liabilities 7,438 7,503 4,606 4,516 1,319 1,587 886 760 – – 627 640
Capital expenditure property, plant and equipment 177 320 134 211 27 56 16 53 – – – –
Capital expenditure right-of-use assets 512 688 394 422 68 195 50 71 – – – –
Capital expenditure other intangibles 9 10 8 7 1 2 – 1 – – – –
Property, plant and equipment, goodwill and
intangibles through business combinations 37 104 37 20 – 5 – 79 – – – –
Non-cash expenses 92 75 79 52 9 17 4 6 – – – – 1 2020 figures include an income from the release of unused contingent consideration liability of CHF 115 million in the business unit Air Logistics (region Americas) –
described in more detail in note 3 section “Impact from COVID-19” and note 45. 2 2020 figures include a write-off of CHF 18 million of goodwill and CHF 49 million of assets held for sale in the business unit Contract Logistics in 2020 (region EMEA) and an
impairment of other intangibles (customer lists) in the business unit Air Logistics (region Americas) of CHF 52 million described in notes 28 and 3 section “Impact from COVID-19”.
b) Geographical information
63

Total Group EMEA Americas Asia-Pacific Eliminations Unallocated corporate
CHF million 2020 2019 2020 2019 2020 2019 2020 2019 2020 2019 2020 2019
Turnover (external customers) 23,812 25,295 14,830 15,693 6,269 6,901 2,713 2,701 – – – –
Customs duties and taxes –3,430 –4,201 –2,398 –2,865 –812 –1,102 –220 –234 – – – –
Net turnover (external customers) 20,382 21,094 12,432 12,828 5,457 5,799 2,493 2,467 – – – –
Inter-regional turnover – – 4,441 4,355 1,064 1,197 1,683 1,258 –7,188 –6,810 – –
Net expenses for services –12,907 –13,113 –11,875 –11,845 –4,934 –5,238 –3,286 –2,840 7,188 6,810 – –
Gross profit 7,475 7,981 4,998 5,338 1,587 1,758 890 885 – – – –
Total expenses 1 –5,555 –6,152 –4,020 –4,285 –1,052 –1,340 –483 –527 – – – –
EBITDA 1,920 1,829 978 1,053 535 418 407 358 – – – –
Depreciation of property, plant and equipment –185 –206 –120 –138 –41 –44 –24 –24 – – – –
Depreciation of right-of-use assets –506 –497 –332 –337 –112 –104 –62 –56 – – – –
Amortisation of other intangibles –40 –54 –15 –13 –22 –37 –3 –4 – – – –
Impairment of assets 2 –119 –11 –67 –4 –52 –6 – –1 – – – –
EBIT 1,070 1,061 444 561 308 227 318 273 – – – –
Financial income 9 11
Financial expenses –22 –29
Result from joint ventures and associates 2 4
Earnings before tax (EBT) 1,059 1,047
Income tax –270 –247
Earnings for the year 789 800
Attributable to:
Equity holders of the parent company 788 798
Non-controlling interests 1 2
Earnings for the year 789 800
Reportable non-current assets 3,815 4,621 2,162 2,675 1,098 1,370 293 348 – – 262 228
Additional information not regulary reported to the CODM
Segment assets 9,851 9,825 4,781 5,309 2,229 2,503 822 829 – – 2,019 1,184
Segment liabilities 7,438 7,503 4,606 4,516 1,319 1,587 886 760 – – 627 640
Capital expenditure property, plant and equipment 177 320 134 211 27 56 16 53 – – – –
Capital expenditure right-of-use assets 512 688 394 422 68 195 50 71 – – – –
Capital expenditure other intangibles 9 10 8 7 1 2 – 1 – – – –
Property, plant and equipment, goodwill and
intangibles through business combinations 37 104 37 20 – 5 – 79 – – – –
Non-cash expenses 92 75 79 52 9 17 4 6 – – – – 1 2020 figures include an income from the release of unused contingent consideration liability of CHF 115 million in the business unit Air Logistics (region Americas) –
described in more detail in note 3 section “Impact from COVID-19” and note 45. 2 2020 figures include a write-off of CHF 18 million of goodwill and CHF 49 million of assets held for sale in the business unit Contract Logistics in 2020 (region EMEA) and an
impairment of other intangibles (customer lists) in the business unit Air Logistics (region Americas) of CHF 52 million described in notes 28 and 3 section “Impact from COVID-19”.
64Other notes

Consolidated Financial Statements 2020
In addition, Switzerland is reported being the country where
the ultimate parent company of the Group is registered.
b) Geographical information
Country information
The following countries individually constitute more than ten
per cent of the Group’s non-current assets or of its net turnover.
CHF million 2020 2019
CountriesReportable
non-current assets 1
Net turnover
Reportable non-current assets 1
Net turnover
France 2 396 1,484 482 1,630
Germany 2 749 3,415 820 3,457
Great Britain 2 234 1,892 611 2,119
Switzerland 2 24 311 20 277
USA 3 870 3,566 1,069 3,798
Others 1,280 9,714 1,391 9,813
Total 3,553 20,382 4,393 21,094
1 Non-current assets excluding investments in joint ventures and associates and deferred tax assets. 2 Part of region EMEA.3 Part of region Americas.
20 Personnel expenses
CHF million 2020 2019
Salaries and wages 3,621 3,907
Social expenses and benefits 783 848
Expenses for share-based compensation plans 13 15
Expenses for pension plans
— defined benefit plans 12 14
— defined contribution plans 67 75
Government compensation for short-time work and social security –83 –
Others 30 18
Total 4,443 4,877
65

Employees within the Group are defined as persons with valid
employment contracts as of December 31, and on the payroll of
the Group. Expenses for temporary staff are generally included in
“salaries and wages”.
21 Selling, general and administrative expenses
CHF million 2020 2019
Administration 296 268
Communication 64 70
Travel and promotion 40 107
Vehicles 207 232
Operating expenses 259 256
Facilities 402 439
Total 1,268 1,372
22 Other operating income/expenses, net
CHF million 2020 2019
Gain/(loss) on disposal of property, plant and equipment 2 15
Gain/(loss) on sale and leaseback of property, plant and equipment 1 23 81
Gain/(loss) on sale of subsidiaries and associates – 1
Gain/(loss) on release of unused contingent consideration liability 2 115 –
Other operating income/(expenses) 16 –
Total 156 97
1 In 2020, the Group has completed seven sale and leaseback transactions of real estate facilities in Australia, France, Germany and Great Britain. The agreed leaseback periods range between three and ten years (2019: eleven transactions in Australia, Germany, Great Britain, Greece, New Zealand and Switzerland with leaseback periods ranging between three and ten years).
2 In Q3 2020, CHF 46 million was paid to the sellers of Quick under the early settlement agreement and CHF 115 million of unused amounts were released. For further details refer to note 3 section “Impact from COVID-19”.
Number of employees Dec. 31, 2020 Dec. 31, 2019
EMEA 54,560 58,086
Americas 14,848 15,712
Asia-Pacific 8,841 9,363
Total employees 78,249 83,161
Full-time equivalents of employees (unaudited) 72,021 78,448
Full-time equivalents of temporary staff (unaudited) 21,217 20,665
Full-time equivalents (total/unaudited) 93,238 99,113
66Other notes

Consolidated Financial Statements 2020
Reconciliation of the effective tax rate
The contributing factors for the difference between the expected
tax rate (the Group’s overall expected tax rate is calculated as the
weighted average tax rate based on earnings before tax of each
subsidiary and can change on a yearly basis) and the effective tax
are as follows:
Deferred tax assets of CHF 1 million (2019: CHF 16 million) relating
to actuarial losses of CHF 8 million before tax (2019 actuarial
losses of CHF 66 million) arising from defined benefit plans were
recognised in other comprehensive income.
23 Financial income and expenses
CHF million 2020 2019
Interest income 3 8
Exchange differences, net 6 3
Financial income 9 11
Interest expenses on other interest-bearing liabilities –6 –10
Interest expenses on lease liabilities –14 –17
Discount unwind on contingent consideration liabilities –2 –2
Financial expenses –22 –29
Net financial result –13 –18
24 Income tax
CHF million 2020 2019
Current tax expense
— in current year 303 299
— under/(over) provided in previous years 1 –2
304 297
Deferred tax expense from
— changes in temporary differences and tax losses –34 –50
Income tax 270 247
67
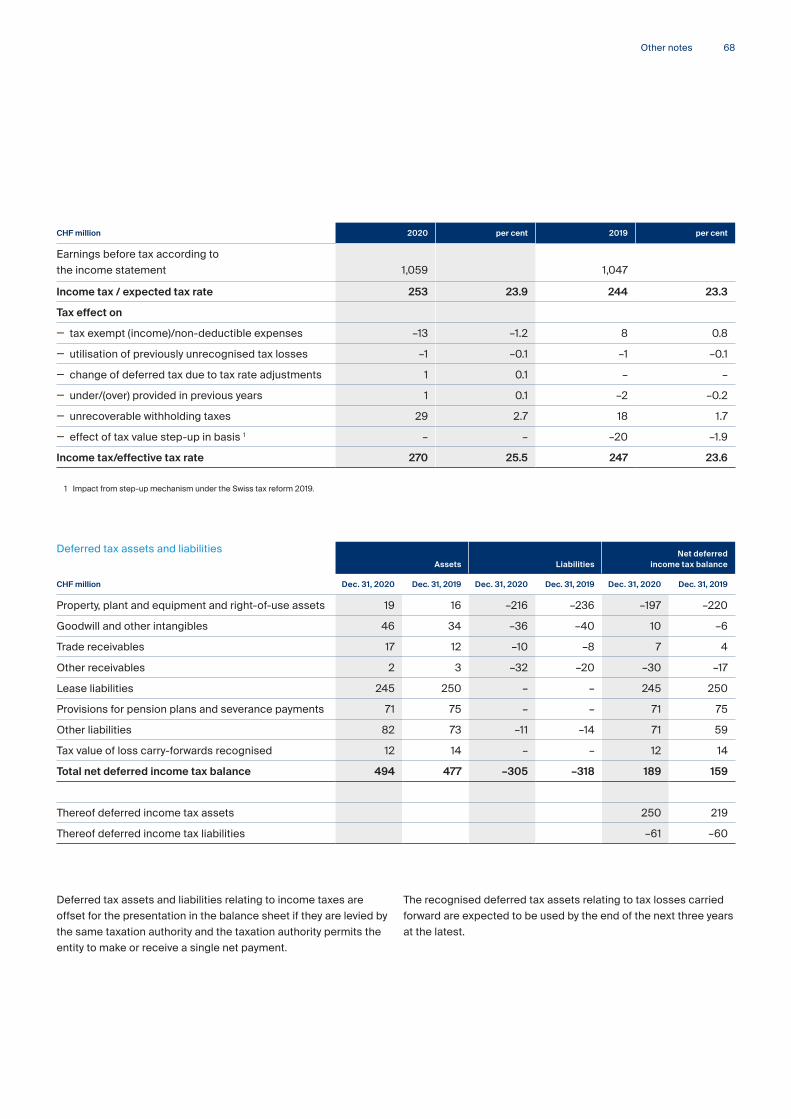
Deferred tax assets and liabilities relating to income taxes are
offset for the presentation in the balance sheet if they are levied by
the same taxation authority and the taxation authority permits the
entity to make or receive a single net payment.
The recognised deferred tax assets relating to tax losses carried
forward are expected to be used by the end of the next three years
at the latest.
CHF million 2020 per cent 2019 per cent
Earnings before tax according to
the income statement 1,059 1,047
Income tax / expected tax rate 253 23.9 244 23.3
Tax effect on
— tax exempt (income)/non-deductible expenses –13 –1.2 8 0.8
— utilisation of previously unrecognised tax losses –1 –0.1 –1 –0.1
— change of deferred tax due to tax rate adjustments 1 0.1 – –
— under/(over) provided in previous years 1 0.1 –2 –0.2
— unrecoverable withholding taxes 29 2.7 18 1.7
— effect of tax value step-up in basis 1 – – –20 –1.9
Income tax/effective tax rate 270 25.5 247 23.6
1 Impact from step-up mechanism under the Swiss tax reform 2019.
Deferred tax assets and liabilities Assets
Liabilities
Net deferred income tax balance
CHF million Dec. 31, 2020 Dec. 31, 2019 Dec. 31, 2020 Dec. 31, 2019 Dec. 31, 2020 Dec. 31, 2019
Property, plant and equipment and right-of-use assets 19 16 –216 –236 –197 –220
Goodwill and other intangibles 46 34 –36 –40 10 –6
Trade receivables 17 12 –10 –8 7 4
Other receivables 2 3 –32 –20 –30 –17
Lease liabilities 245 250 – – 245 250
Provisions for pension plans and severance payments 71 75 – – 71 75
Other liabilities 82 73 –11 –14 71 59
Tax value of loss carry-forwards recognised 12 14 – – 12 14
Total net deferred income tax balance 494 477 –305 –318 189 159
Thereof deferred income tax assets 250 219
Thereof deferred income tax liabilities –61 –60
68Other notes
Consolidated Financial Statements 2020
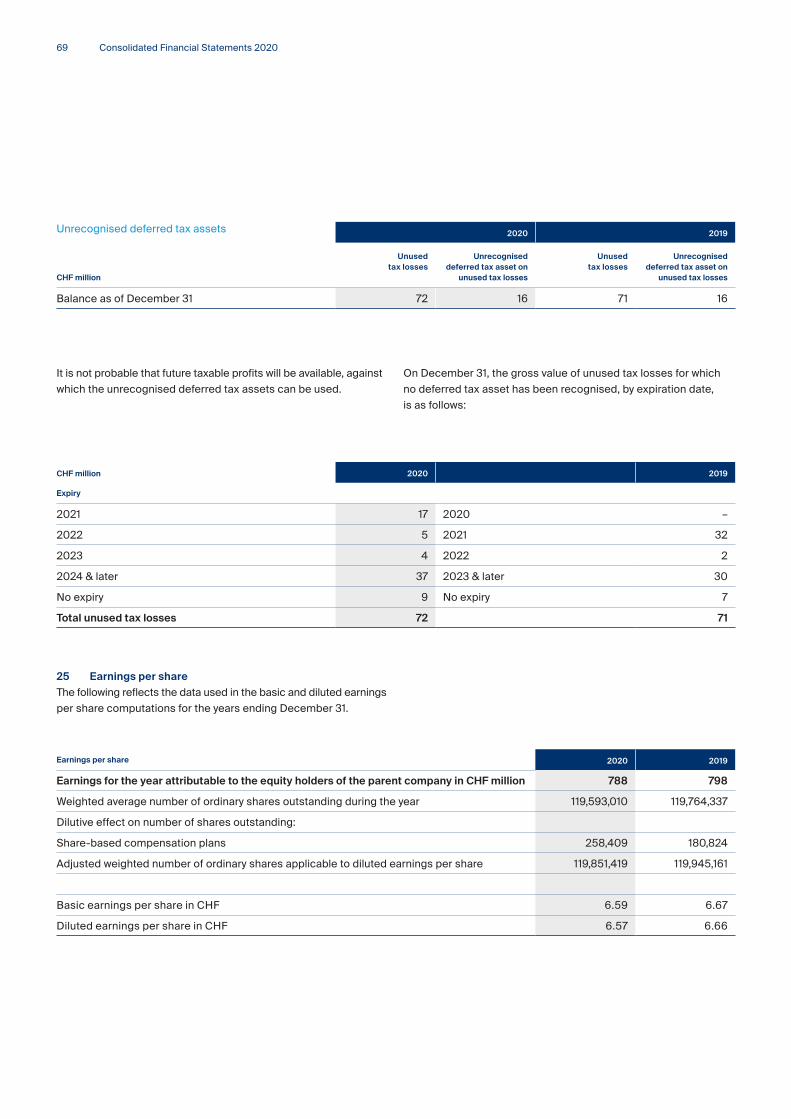
It is not probable that future taxable profits will be available, against
which the unrecognised deferred tax assets can be used.
25 Earnings per share
The following reflects the data used in the basic and diluted earnings
per share computations for the years ending December 31.
On December 31, the gross value of unused tax losses for which
no deferred tax asset has been recognised, by expiration date,
is as follows:
Unrecognised deferred tax assets 2020 2019
CHF million
Unused tax losses
Unrecognised deferred tax asset on
unused tax losses
Unused tax losses
Unrecognised deferred tax asset on
unused tax losses
Balance as of December 31 72 16 71 16
CHF million 2020 2019
Expiry
2021 17 2020 –
2022 5 2021 32
2023 4 2022 2
2024 & later 37 2023 & later 30
No expiry 9 No expiry 7
Total unused tax losses 72 71
Earnings per share 2020 2019
Earnings for the year attributable to the equity holders of the parent company in CHF million 788 798
Weighted average number of ordinary shares outstanding during the year 119,593,010 119,764,337
Dilutive effect on number of shares outstanding:
Share-based compensation plans 258,409 180,824
Adjusted weighted number of ordinary shares applicable to diluted earnings per share 119,851,419 119,945,161
Basic earnings per share in CHF 6.59 6.67
Diluted earnings per share in CHF 6.57 6.66
69
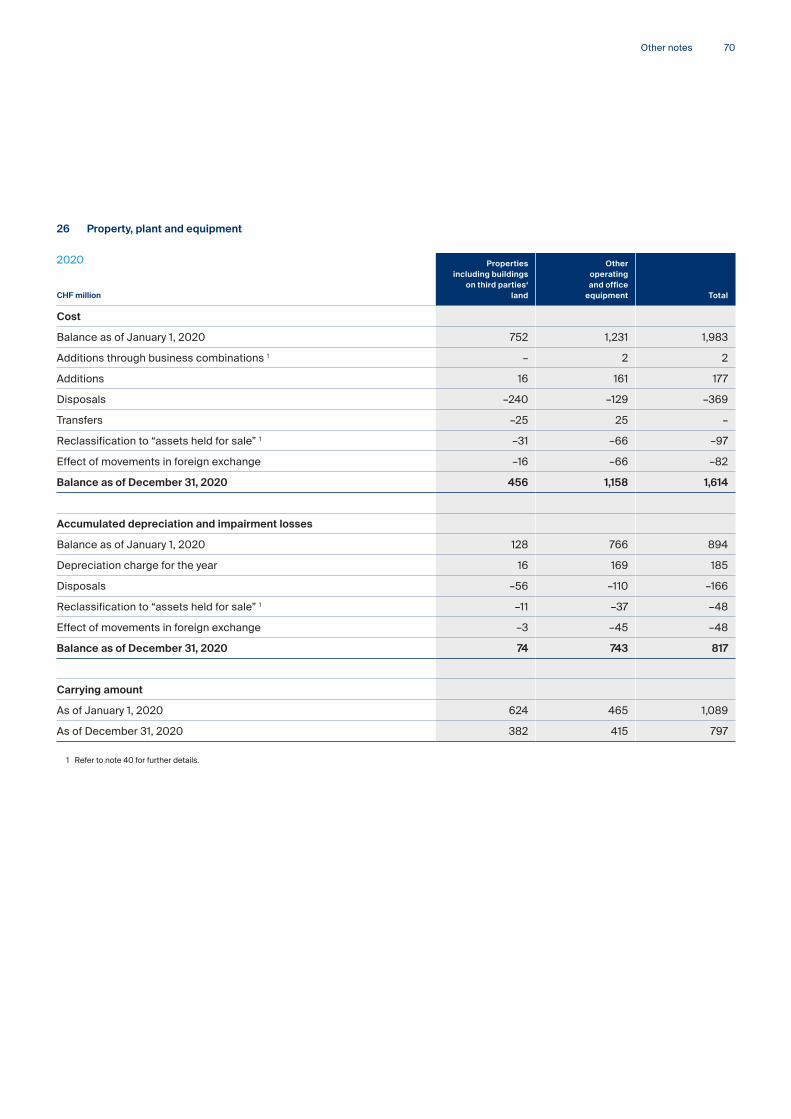
26 Property, plant and equipment
2020
CHF million
Properties including buildings
on third parties‘ land
Other operatingand office
equipment Total
Cost
Balance as of January 1, 2020 752 1,231 1,983
Additions through business combinations 1 – 2 2
Additions 16 161 177
Disposals –240 –129 –369
Transfers –25 25 –
Reclassification to “assets held for sale” 1 –31 –66 –97
Effect of movements in foreign exchange –16 –66 –82
Balance as of December 31, 2020 456 1,158 1,614
Accumulated depreciation and impairment losses
Balance as of January 1, 2020 128 766 894
Depreciation charge for the year 16 169 185
Disposals –56 –110 –166
Reclassification to “assets held for sale” 1 –11 –37 –48
Effect of movements in foreign exchange –3 –45 –48
Balance as of December 31, 2020 74 743 817
Carrying amount
As of January 1, 2020 624 465 1,089
As of December 31, 2020 382 415 797
1 Refer to note 40 for further details.
70Other notes
Consolidated Financial Statements 2020
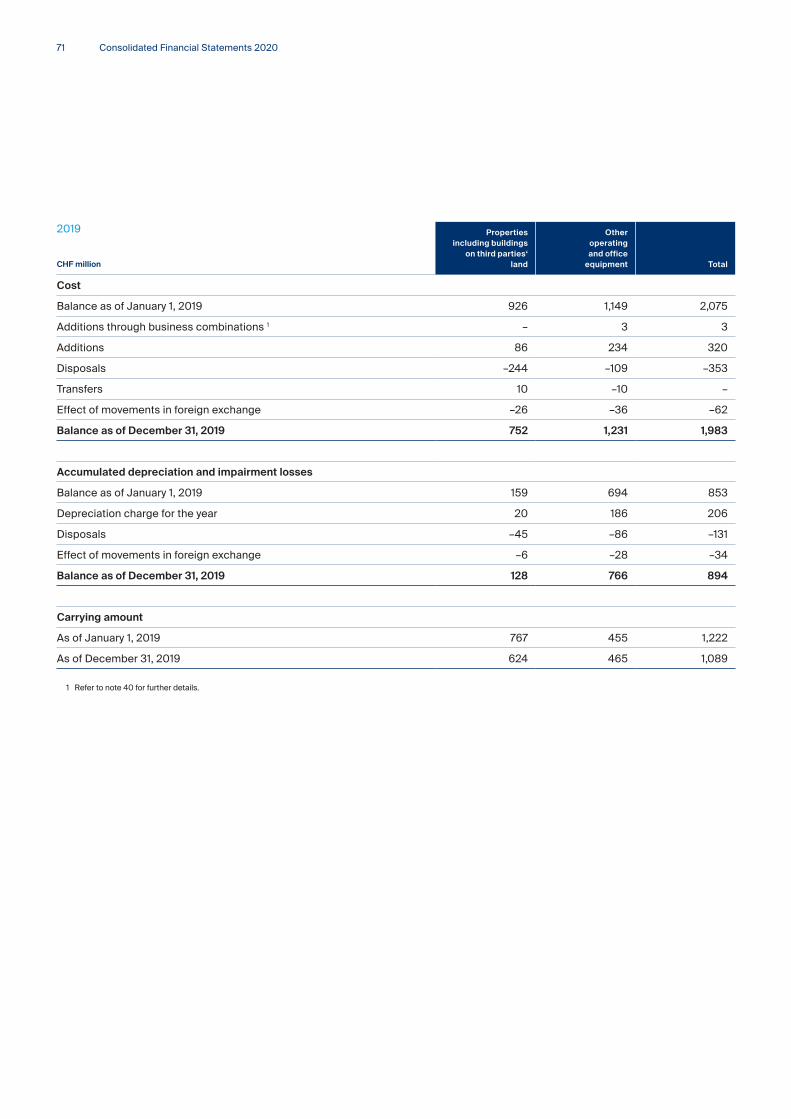
2019
CHF million
Properties including buildings
on third parties‘ land
Other operatingand office
equipment Total
Cost
Balance as of January 1, 2019 926 1,149 2,075
Additions through business combinations 1 – 3 3
Additions 86 234 320
Disposals –244 –109 –353
Transfers 10 –10 –
Effect of movements in foreign exchange –26 –36 –62
Balance as of December 31, 2019 752 1,231 1,983
Accumulated depreciation and impairment losses
Balance as of January 1, 2019 159 694 853
Depreciation charge for the year 20 186 206
Disposals –45 –86 –131
Effect of movements in foreign exchange –6 –28 –34
Balance as of December 31, 2019 128 766 894
Carrying amount
As of January 1, 2019 767 455 1,222
As of December 31, 2019 624 465 1,089
1 Refer to note 40 for further details.
71

27 Leases
Right-of-use assets
2020
CHF millionRight-of-use assets
properties, buildings
Right-of-use assets other operating
and office equipment Total
Cost
Balance as of January 1, 2020 1,692 207 1,899
Additions through business combinations 1 21 6 27
Additions 418 94 512
Depreciation charge for the year –459 –47 –506
Modifications and reassessments –47 –16 –63
Reclassification to “assets held for sale” 1 –232 –56 –288
Effect of movements in foreign exchange –75 –6 –81
Balance as of December 31, 2020 1,318 182 1,500
1 Refer to note 40 for further details.
2019
CHF millionRight-of-use assets
properties, buildings
Right-of-use assets other operating and
office equipment Total
Cost
Balance as of January 1, 2019 1,575 182 1,757
Additions 598 90 688
Depreciation charge for the year –441 –56 –497
Modifications and reassessments –13 –5 –18
Effect of movements in foreign exchange –27 –4 –31
Balance as of December 31, 2019 1,692 207 1,899
72Other notes
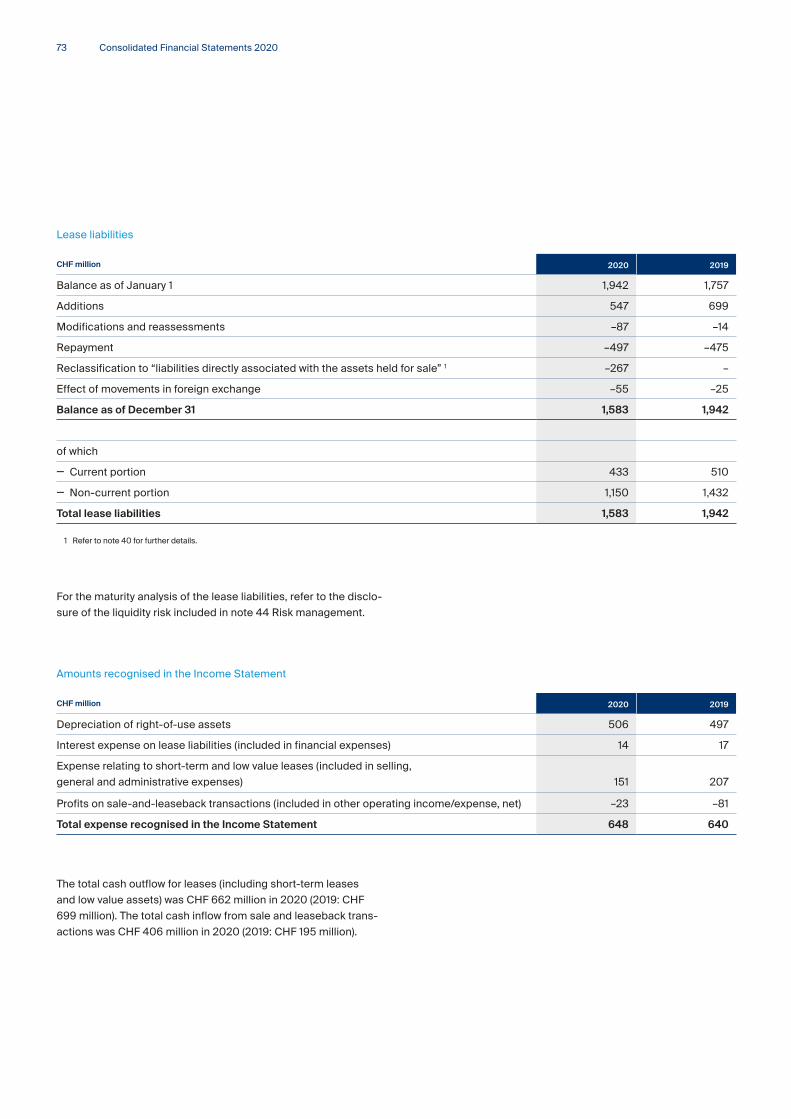
Consolidated Financial Statements 2020
For the maturity analysis of the lease liabilities, refer to the disclo-
sure of the liquidity risk included in note 44 Risk management.
The total cash outflow for leases (including short-term leases
and low value assets) was CHF 662 million in 2020 (2019: CHF
699 million). The total cash inflow from sale and leaseback trans-
actions was CHF 406 million in 2020 (2019: CHF 195 million).
Amounts recognised in the Income Statement
CHF million 2020 2019
Depreciation of right-of-use assets 506 497
Interest expense on lease liabilities (included in financial expenses) 14 17
Expense relating to short-term and low value leases (included in selling,
general and administrative expenses) 151 207
Profits on sale-and-leaseback transactions (included in other operating income/expense, net) –23 –81
Total expense recognised in the Income Statement 648 640
Lease liabilities
CHF million 2020 2019
Balance as of January 1 1,942 1,757
Additions 547 699
Modifications and reassessments –87 –14
Repayment –497 –475
Reclassification to “liabilities directly associated with the assets held for sale” 1 –267 –
Effect of movements in foreign exchange –55 –25
Balance as of December 31 1,583 1,942
of which
— Current portion 433 510
— Non-current portion 1,150 1,432
Total lease liabilities 1,583 1,942
1 Refer to note 40 for further details.
73

28 Goodwill and other intangibles
2020
CHF million GoodwillOther
intangibles 1
Cost
Balance as of January 1, 2020 1,234 883
Additions through business combinations 2 25 10
Additions – 9
Deletions – –14
Reclassification to “assets held for sale” 2 –18 –
Effect of movements in foreign exchange –73 –35
Balance as of December 31, 2020 1,168 853
Accumulated amortisation and impairment losses
Balance as of January 1, 2020 14 698
Amortisation charge – 40
Impairment charge 3 – 52
Deletions – –14
Effect of movements in foreign exchange –1 –24
Balance as of December 31, 2020 13 752
Carrying amount:
As of January 1, 2020 1,220 185
As of December 31, 2020 1,155 101
1 Other intangibles mainly comprise customer contracts/lists, trademarks, field office agent contracts and software.2 Refer to note 40 for further details.3 Due to the down-trading of major aviation customers caused by the COVID-19 pandemic, the Group has fully impaired the respective customer
lists in the reportable segment Air Logistics of CHF 52 million. Refer to note 3 section “Impact from COVID-19” for further details.
74Other notes

Consolidated Financial Statements 2020
2019
CHF million GoodwillOther
intangibles 1
Cost
Balance as of January 1, 2019 1,184 868
Additions through business combinations 2 75 26
Additions – 10
Deletions – –2
Effect of movements in foreign exchange –25 –19
Balance as of December 31, 2019 1,234 883
Accumulated amortisation and impairment losses
Balance as of January 1, 2019 14 653
Amortisation charge – 54
Impairment charge 3 – 11
Deletions – –2
Effect of movements in foreign exchange – –18
Balance as of December 31, 2019 14 698
Carrying amount:
As of January 1, 2019 1,170 215
As of December 31, 2019 1,220 185 1 Other intangibles mainly comprise customer contracts/lists, trademarks, field office agent contracts and software.2 Refer to note 40 for further details.3 Due to the loss of certain customers in the reportable segments Air Logistics and Road Logistics, an impairment charge on the
respective customer lists of CHF 9 million in Air Logistics and CHF 2 million in Road Logistics had to be recognised.
75

Sea Logistics Air Logistics Road Logistics Contract Logistics Total Group
Carrying amount of goodwill
in CHF million 2020 35 394 335 391 1,155
Carrying amount of goodwill
in CHF million 2019 37 433 326 424 1,220
Basis for recoverable amount Value in use Value in use Value in use Value in use
Pre-tax discount rate
in per cent 2020 9.1 9.0 9.0 8.9
Pre-tax discount rate
in per cent 2019 8.6 – 13.6 8.6 – 16.0 8.7 – 13.6 8.6 – 13.6
Projection period 3 years 3 years 3 years 3 years
Terminal growth rate
in per cent 2020 1.5 1.5 1.5 1.5
Terminal growth rate
in per cent 2019 1.5 1.5 1.5 1.5
Impairment testing of goodwill
Over the last decade, the Group’s acquisition strategy has expan-
ded from being decentralised and focused on local markets to
increasingly include a focus on global scale with the intention to
broaden the Group’s geographic presence, enhance the service
offering and to realise synergies and economies of scale through
globally centralised and standardised processes as well as cross-
regional roll-outs of acquired businesses. The Management Board
(the chief operational decision maker, CODM) assesses the per-
formance of its acquisitions on a global and business unit level.
As a consequence of this development, the Group reassessed the
allocation level of goodwill for the purpose of impairment testing.
In 2020, the Group redefined the level of goodwill impairment
testing from a country or regional and business unit to a global
business unit level – in line with how the CODM assesses the
performance of its acquisitions. This is considered a change in cir-
cumstances accounted for prospectively and therefore prior years
are not impacted. No impairment of goodwill would have arisen in
2020 if testing had continued to be performed on the previous
basis. The Group has performed impairment tests of goodwill at
the end of the financial years 2020 and 2019.
Following a business combination, goodwill is allocated to aggre-
gated cash-generating units which are expected to benefit from
the synergies of the corresponding business combination. For
the purposes of goodwill impairment testing, the cash-generating
units are aggregated into the global business units – the level at
which the Management Board conducts reviews. The allocation
of goodwill to the reportable segments (business units) is further
illustrated in note 19.
For the goodwill allocated to the aggregated cash-generating
units, the impairment tests are based on calculations of value in
use. Cash flow projections are based on actual operating results
and three-year business plans. Cash flows beyond the three-year
period are extrapolated by using estimated long-term growth rates.
The growth rates do not exceed the long-term average growth
rate for the logistics industry in which the cash-generating units
operate. Future cash flows are discounted based on the weighted
average cost of capital (WACC).
Key assumptions used for value-in-use calculations of goodwill:
76Other notes
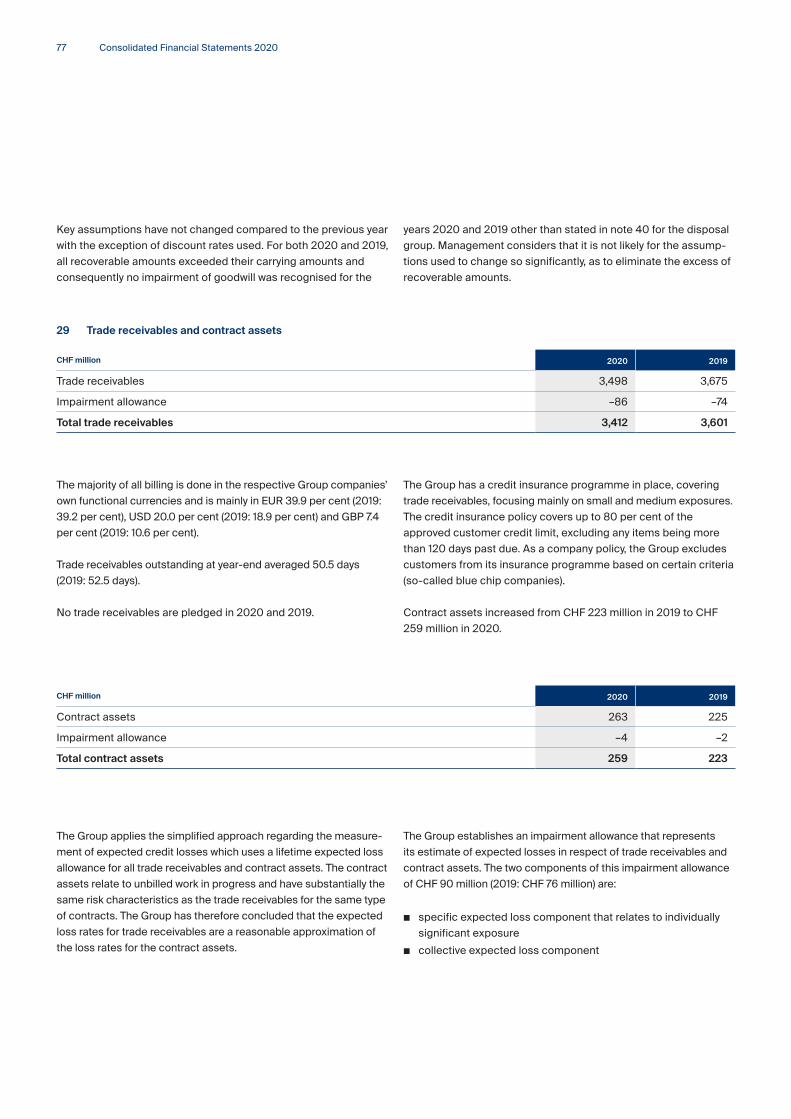
Consolidated Financial Statements 2020
The Group has a credit insurance programme in place, covering
trade receivables, focusing mainly on small and medium exposures.
The credit insurance policy covers up to 80 per cent of the
approved customer credit limit, excluding any items being more
than 120 days past due. As a company policy, the Group excludes
customers from its insurance programme based on certain criteria
(so-called blue chip companies).
Contract assets increased from CHF 223 million in 2019 to CHF
259 million in 2020.
The majority of all billing is done in the respective Group companies’
own functional currencies and is mainly in EUR 39.9 per cent (2019:
39.2 per cent), USD 20.0 per cent (2019: 18.9 per cent) and GBP 7.4
per cent (2019: 10.6 per cent).
Trade receivables outstanding at year-end averaged 50.5 days
(2019: 52.5 days).
No trade receivables are pledged in 2020 and 2019.
29 Trade receivables and contract assets
CHF million 2020 2019
Trade receivables 3,498 3,675
Impairment allowance –86 –74
Total trade receivables 3,412 3,601
Key assumptions have not changed compared to the previous year
with the exception of discount rates used. For both 2020 and 2019,
all recoverable amounts exceeded their carrying amounts and
consequently no impairment of goodwill was recognised for the
years 2020 and 2019 other than stated in note 40 for the disposal
group. Management considers that it is not likely for the assump-
tions used to change so significantly, as to eliminate the excess of
recoverable amounts.
CHF million 2020 2019
Contract assets 263 225
Impairment allowance –4 –2
Total contract assets 259 223
The Group establishes an impairment allowance that represents
its estimate of expected losses in respect of trade receivables and
contract assets. The two components of this impairment allowance
of CHF 90 million (2019: CHF 76 million) are:
■ specific expected loss component that relates to individually
significant exposure
■ collective expected loss component
The Group applies the simplified approach regarding the measure-
ment of expected credit losses which uses a lifetime expected loss
allowance for all trade receivables and contract assets. The contract
assets relate to unbilled work in progress and have substantially the
same risk characteristics as the trade receivables for the same type
of contracts. The Group has therefore concluded that the expected
loss rates for trade receivables are a reasonable approximation of
the loss rates for the contract assets.
77

2020 2019
CHF millionSpecific
allowance Collectiveallowance
Totalallowance
Specific allowance
Collectiveallowance
Totalallowance
Balance as of January 1 41 35 76 34 31 65
Additional impairment losses recognised 31 44 75 22 15 37
Reversal of impairment losses and write-offs –35 –26 –61 –15 –11 –26
Balance as of December 31 37 53 90 41 35 76
For trade receivables that are covered by credit insurance, no
impairment allowance has been created.
The movement in the impairment allowance on trade receivables
and contract assets during the year was as follows:
2020 2019
CHF millionTrade
receivablesImpairment allowance
on trade receivablesTrade
receivablesImpairment allowance
on trade receivables
Default probability < 1 per cent 1,467 19 1,470 10
Default probability 1 to 3 per cent 1,857 26 1,981 17
Default probability 3 to 10 per cent 97 2 115 3
Default probability 10 to 30 per cent 31 5 64 9
Default probability > 30 per cent 46 34 45 35
Total 3,498 86 3,675 74
The specific expected loss allowance relates to specific receiva-
bles under legal disputes, based on the expected legal outcome.
The impairment allowance for individually significant exposures is
CHF 37 million at year-end 2020 (2019: CHF 41 million).
The collective expected credit loss is determined based on the
probability of default of each receivable. The customer’s public
rating is taken into consideration, if available; otherwise industry-
specific default rates are used. These rates are adjusted to reflect
current and forward-looking information on macroeconomic
factors affecting the ability of the customer to settle the receiva-
bles. The Group has identified the gross domestic product and the
unemployment rate of the countries in which it sells the services to
be the most relevant factors, and accordingly adjusts the probabi-
lity of default.
On this basis, the loss allowance as at December 31, 2020, the
Group has established a collective impairment allowance of CHF
53 million, which represents 1.4 per cent of total outstanding trade
receivables and contract assets (2019: CHF 35 million/0.9 per cent).
78Other notes
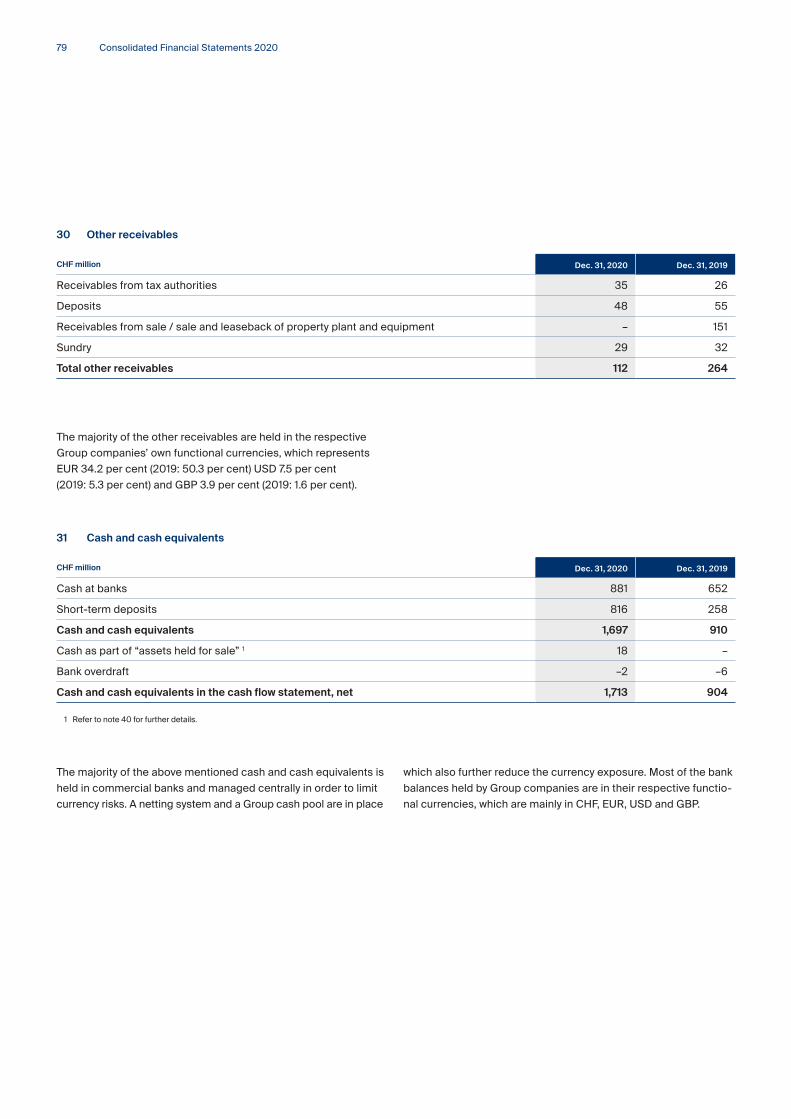
Consolidated Financial Statements 2020
The majority of the above mentioned cash and cash equivalents is
held in commercial banks and managed centrally in order to limit
currency risks. A netting system and a Group cash pool are in place
which also further reduce the currency exposure. Most of the bank
balances held by Group companies are in their respective functio-
nal currencies, which are mainly in CHF, EUR, USD and GBP.
The majority of the other receivables are held in the respective
Group companies’ own functional currencies, which represents
EUR 34.2 per cent (2019: 50.3 per cent) USD 7.5 per cent
(2019: 5.3 per cent) and GBP 3.9 per cent (2019: 1.6 per cent).
30 Other receivables
CHF million Dec. 31, 2020 Dec. 31, 2019
Receivables from tax authorities 35 26
Deposits 48 55
Receivables from sale / sale and leaseback of property plant and equipment – 151
Sundry 29 32
Total other receivables 112 264
31 Cash and cash equivalents
CHF million Dec. 31, 2020 Dec. 31, 2019
Cash at banks 881 652
Short-term deposits 816 258
Cash and cash equivalents 1,697 910
Cash as part of “assets held for sale” 1 18 –
Bank overdraft –2 –6
Cash and cash equivalents in the cash flow statement, net 1,713 904
1 Refer to note 40 for further details.
79

In 2020 the Company matched 67,506 treasury shares of which
the main portion relates to the matured share matching plan 2017
(2019: 760 treasury shares sold, 58,508 matched for the matured
share matching plan 2016) for less than CHF 1 million (2019: less
than CHF 1 million) under the employee share-based compensa-
tion plans. In addition, the Company purchased 277,457 treasury
shares for CHF 37 million (2019: none).
The dividend payment 2020 to owners amounted to CHF 4.00
per share or CHF 478 million (2019: CHF 6.00 per share or
CHF 718 million).
On December 31, 2020, the Company had 416,151 treasury shares
(2019: 206,200), of which 416,151 (2019: 206,200) are reserved
under the share-based compensation plans; refer to note 34 for
more information.
Dividends
The proposed dividend payment, subject to approval by the Annual
General Meeting, is as follows:
32 Equity
Share capital and treasury shares 2020
Balance Dec. 31 Jan. 1
Main shareholders
Registered shares of nominal
CHF 1 per share CHF millionCapital share
per centVoting share
per cent
Registered shares of nominal
CHF 1 per share
Kuehne Holding AG,
Schindellegi (Feusisberg) 63,900,000 64 53.3 53.4 63,900,000
Public shareholders 55,683,849 56 46.4 46.6 55,893,800
Entitled to voting rights
and dividends 119,583,849 120 99.7 100.0 119,793,800
Treasury shares 416,151 – 0.3 206,200
Total 120,000,000 120 100.0 120,000,000
Year per share CHF million
2021 CHF 4.50 538
80Other notes

Consolidated Financial Statements 2020
Authorised and conditional share capital
The Annual General Meeting held on May 5, 2020, extended its
approval of authorised share capital up to a maximum of CHF 20
million by a further two years until May 5, 2022.
The Annual General Meeting held on May 2, 2005, approved a
conditional share capital increase up to a maximum of CHF 12 million
and to add a respective section in the Articles of Association.
The Annual General Meeting held on May 5, 2015, approved a condi-
tional share capital up to a maximum of CHF 2 million for the provision
of the employee share-based compensation plans of the Company.
So far no use has been made of these rights. There is no resolution
of the Board of Directors outstanding for further issuance of either
authorised or conditional capital.
Capital Management
The Group defines the capital managed as the Group’s total equity
including non-controlling interests. The Group’s main objectives
when managing capital are:
■ To safeguard the Group’s ability to continue as a going concern,
so that it can continue to provide services to its customers;
■ To provide an adequate return to investors based on the level of
risk undertaken;
■ To have the necessary financial resources available to allow
the Group to invest in areas that may deliver future benefits for
customers and investors.
Capital is monitored on the basis of the equity ratio and its deve-
lopment is shown in the table below. The Group is not subject to
regulatory capital adequacy requirements as known in the financial
services industry.
Share capital and treasury shares 2019
Balance Dec. 31 Jan. 1
Main shareholders
Registered shares of nominal
CHF 1 per share CHF millionCapital share
per centVoting share
per cent
Registered shares of nominal
CHF 1 per share
Kuehne Holding AG,
Schindellegi (Feusisberg) 63,900,000 64 53.3 53.3 63,900,000
Public shareholders 55,893,800 56 46.5 46.7 55,834,531
Entitled to voting rights
and dividends 119,793,800 120 99.8 100.0 119,734,531
Treasury shares 206,200 – 0.2 265,469
Total 120,000,000 120 100.0 120,000,000
CHF million 2020 2019 2018 2017 2016
Total equity 2,413 2,322 2,324 2,327 2,165
Total assets 1 9,851 9,825 7,878 7,457 6,331
Equity ratio in per cent 24.5 23.6 29.5 31.2 34.2
1 Figures prior to 2019 have not been restated for the impact of IFRS 16 Leases.
81
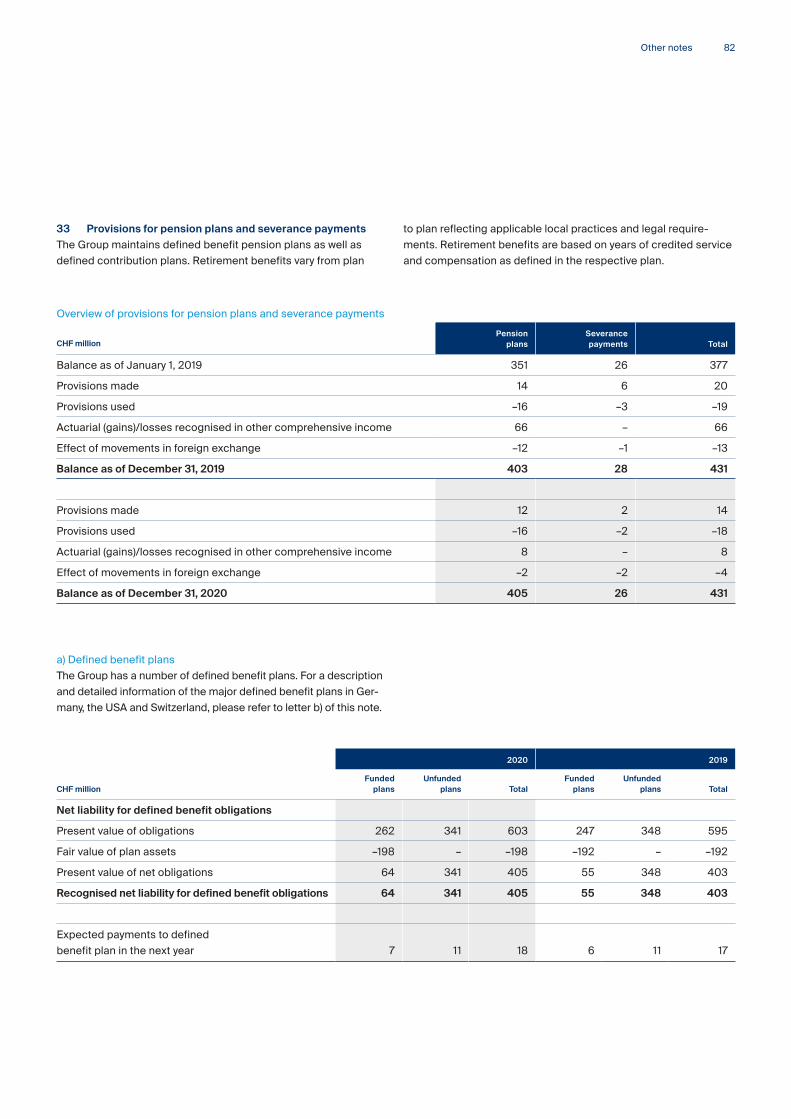
to plan reflecting applicable local practices and legal require-
ments. Retirement benefits are based on years of credited service
and compensation as defined in the respective plan.
33 Provisions for pension plans and severance payments
The Group maintains defined benefit pension plans as well as
defined contribution plans. Retirement benefits vary from plan
a) Defined benefit plans
The Group has a number of defined benefit plans. For a description
and detailed information of the major defined benefit plans in Ger-
many, the USA and Switzerland, please refer to letter b) of this note.
Overview of provisions for pension plans and severance payments
CHF millionPension
plansSeverancepayments Total
Balance as of January 1, 2019 351 26 377
Provisions made 14 6 20
Provisions used –16 –3 –19
Actuarial (gains)/losses recognised in other comprehensive income 66 – 66
Effect of movements in foreign exchange –12 –1 –13
Balance as of December 31, 2019 403 28 431
Provisions made 12 2 14
Provisions used –16 –2 –18
Actuarial (gains)/losses recognised in other comprehensive income 8 – 8
Effect of movements in foreign exchange –2 –2 –4
Balance as of December 31, 2020 405 26 431
2020 2019
CHF millionFunded
plans Unfunded
plans TotalFunded
plansUnfunded
plans Total
Net liability for defined benefit obligations
Present value of obligations 262 341 603 247 348 595
Fair value of plan assets –198 – –198 –192 – –192
Present value of net obligations 64 341 405 55 348 403
Recognised net liability for defined benefit obligations 64 341 405 55 348 403
Expected payments to defined
benefit plan in the next year 7 11 18 6 11 17
82Other notes
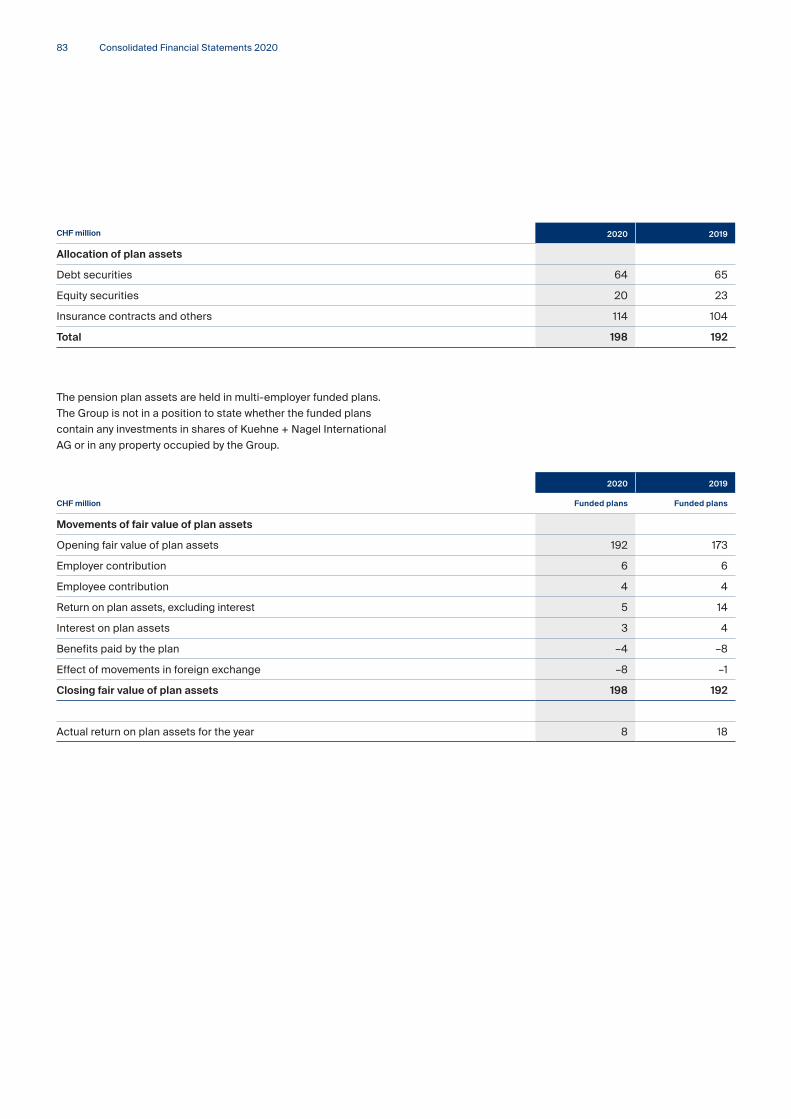
Consolidated Financial Statements 2020
The pension plan assets are held in multi-employer funded plans.
The Group is not in a position to state whether the funded plans
contain any investments in shares of Kuehne + Nagel International
AG or in any property occupied by the Group.
CHF million 2020 2019
Allocation of plan assets
Debt securities 64 65
Equity securities 20 23
Insurance contracts and others 114 104
Total 198 192
2020 2019
CHF million Funded plans Funded plans
Movements of fair value of plan assets
Opening fair value of plan assets 192 173
Employer contribution 6 6
Employee contribution 4 4
Return on plan assets, excluding interest 5 14
Interest on plan assets 3 4
Benefits paid by the plan –4 –8
Effect of movements in foreign exchange –8 –1
Closing fair value of plan assets 198 192
Actual return on plan assets for the year 8 18
83

2020 2019
CHF millionFunded
plans Unfunded
plans TotalFunded
plansUnfunded
plans Total
Movements of present value of
defined benefit obligations
Opening liability for defined benefit obligations 247 348 595 212 312 524
Current service costs 7 5 12 7 5 12
Interest costs 3 3 6 5 6 11
Employee contribution 4 – 4 4 – 4
Actuarial (gains)/losses recognised
in other comprehensive income:
— due to changes in demographic assumptions –1 – –1 –1 – –1
— due to changes in financial assumptions 11 3 14 35 50 85
— due to experience (gains)/losses 4 –3 1 –2 –2 –4
Benefits paid by the plan –4 –11 –15 –8 –10 –18
Past service costs - amendments –1 –2 –3 –4 – –4
Past service costs - curtailment – –1 –1 – – –
Effect of movements in foreign exchange –8 –1 –9 –1 –13 –14
Closing liability for defined benefit obligations 262 341 603 247 348 595
Expense recognised in the income statement
Service costs 7 2 9 3 5 8
Net interest on the net defined benefit liability – 3 3 – 6 6
Expense recognised in personnel
expenses (refer to note 20) 7 5 12 3 11 14
Actuarial gains/(losses) recognised in
other comprehensive income
Cumulative amount as of January 1 –56 –152 –208 –39 –108 –147
Recognised during the year –8 – –8 –18 –48 –66
Effect of movements in foreign exchange 2 1 3 1 4 5
Cumulative amount as of December 31 –62 –151 –213 –56 –152 –208
84Other notes

Consolidated Financial Statements 2020
Sensitivities of significant actuarial assumptions
The discount rate and future salary increases were identified
as significant actuarial assumptions. An increase/decrease of
The duration in years corresponds to the average weighted period.
The sensitivity analysis is based on reasonably possible changes
as of the end of the reporting year. Each change in a significant
actuarial assumption was analysed separately as part of the test.
0.25 percentage points in the respective assumption would have
the following impact on the defined benefit obligation:
Interdependencies between individual assumptions were not
taken into account.
Active Deferred Retired Total
Plan participants 2020 2019 2020 2019 2020 2019 2020 2019
Number of plan participants 13,626 11,968 1,258 1,314 2,415 2,387 17,299 15,669
Present value of defined
benefit obligations
In CHF million 314 309 69 69 220 217 603 595
Share in per cent 52.1 51.9 11.4 11.6 36.5 36.5 100.0 100.0
Duration in years 21.2 22.9 16.9 18.5 10.7 11.0 16.9 18.1
2020 2019
Per centFunded
plans Unfunded
plans TotalFunded
plansUnfunded
plans Total
Discount rate 0.3 0.6 0.6 0.6 0.9 0.9
Future salary increases 1.4 2.0 1.9 1.5 2.2 2.1
Future pension increases – 1.2 1.2 – 1.4 1.4
2020 2019
CHF millionFunded
plans Unfunded
plans TotalFunded
plansUnfunded
plans Total
Reasonably possible change +/- in percentage points 0.25 0.25 0.25 0.25 0.25 0.25
Discount rate
Change of defined benefit obligation -/+ 11 15 26 10 14 24
Future salary increases
Change of defined benefit obligation +/- 1 2 3 1 2 3
Weighted actuarial assumptions
at the balance sheet date
85

fits to be provided. Payments are made by Kuehne+Nagel only.
Risks in relation to guarantees provided, such as investment risk,
asset volatility, salary increase and life expectancy, are borne by
the Group.
Pensions are calculated as a percentage of contributory base
salary multiplied with the years of service. The normal retirement
age for the plan is 65. Members can draw retirement benefits early
with a proportionate reduction of the pension.
The plan is closed to new entrants, who instead can participate in a
defined contribution plan.
b) Major defined benefit plans
The Group maintains significant defined benefit pension plans in
Germany, the USA and in Switzerland constituting 90.4 per cent
(2019: 89.6 per cent) of the defined benefit obligations and 86.9
per cent (2019: 85.9 per cent) of the plan assets.
Germany
There is one major unfunded defined benefit pension plan in Ger-
many that provides retirement and disability benefits to employees
and their dependents. This plan is based on an internal pension
scheme (Versorgungsordnung), with the employers’ retirement
benefits law (Betriebsrentengesetz) specifying the minimum bene-
The duration in years corresponds to the average weighted period.
CHF million 2020 2019
Recognised liability for defined benefit obligations 317 320
Expense recognised in personnel expenses 6 9
Actuarial gains / (losses) recognised in other comprehensive income –1 –45
Number of plan participants 3,244 3,311
Duration in years 16.7 18.0
Weighted actuarial assumptions at the balance sheet date
Per cent 2020 2019
Discount rate 0.60 0.85
Future salary increases 2.00 2.00
Future pension increases 1.50 1.75
Mortality table Dr. K. Heubeck
2018 G
Dr. K. Heubeck
2018 G
86Other notes

Consolidated Financial Statements 2020
risks include mainly investment risks (as there is a guaranteed
return on account balances), asset volatility and life expectancy.
The monthly contributions to the pension plans are paid by the
employees as well as by the employer. The contributions are
calculated as a percentage of the contributory salary and vary
depending on the age of the employee. The pension plans provide
a lifetime pension to members at the ordinary retirement age
as defined in the Swiss Pension law. The pension is calculated
as a percentage of the individual plan participant’s pension
account at retirement date. A portion of the benefit, up to the
full amount under certain conditions, can be taken as lump sum
payment at retirement. Members can draw retirement benefits
early from the age of 58, with a proportionate reduction of the
pension.
Switzerland
The Swiss pension plans are defined benefit plans that provide
retirement and disability benefits to employees and their depen-
dents. Swiss pension plans are governed by the Swiss Federal
Law on Occupational Retirement, Survivor’s and Disability Pension
Plans (BVG), which stipulates that pension plans have to be
managed by independent, legally autonomous units. A pension
plan’s governing body (Board of Trustees) is responsible for the
investment of the plan’s assets and must be composed of equal
numbers of employee’s and employer’s representatives. The various
insurance benefits are governed in regulations, with the BVG
specifying the minimum benefits that are to be provided. As a con-
sequence, there are a number of guarantees provided within the
pension funds which expose them to the risks of underfunding and
may require the Group to provide additional contributions. Such
The duration in years corresponds to the average weighted period.
CHF million 2020 2019
Net liability for defined benefit obligations
Present value of obligations 158 141
Fair value of plan assets –107 –98
Recognised net liability for defined benefit obligations 51 43
Allocation of plan assets
Insurance contracts and others 107 98
Expense recognised in the Income Statement
Service costs 6 2
Actuarial gains/(losses) recognised in other comprehensive income –7 –14
Number of plan participants 508 502
Duration in years 19.3 19.3
Weighted actuarial assumptions at the balance sheet date
Per cent 2020 2019
Discount rate 0.00 0.15
Future salary increases 1.50 1.50
Mortality table BVG 2015
Generational
BVG 2015
Generational
87

Contributions are based on the salary of the employee. The
normal retirement age is 65, with a minimum of five years of
service. The plan provides a lifetime pension at normal retirement,
which is based on a percentage of the highest average monthly
compensation over a five-year period (limited to USD 100,000),
multiplied by credited service under the plan. Members can draw
retirement benefits early, with a proportionate reduction of the
pension, at the age of 55 if the employee has a minimum of 10
years of service.
The plan is closed to new entrants and its benefits are frozen.
New employees are instead covered by a defined contribution plan.
USA
The US pension plan is a defined benefit pension plan that
provides retirement and disability benefits to employees and
their dependents. The various insurance benefits are governed
by regulations. The US plan is qualified under and is managed in
accordance with the requirements of US federal law. In accordan-
ce with federal law, there are plan fiduciaries that are responsible
for the governance of the plan. Fiduciaries also are responsible
for the investment of the plan’s assets, which are held in a pension
trust that is legally separate from the employer. The plan is entirely
funded by Kuehne+Nagel. Risks in relation to guarantees provided,
such as investment risk, asset volatility, salary increase and life
expectancy, are borne by the Group.
The duration in years corresponds to the average weighted period.
CHF million 2020 2019
Net liability for defined benefit obligations
Present value of obligations 70 72
Fair value of plan assets –65 –67
Recognised net liability for defined benefit obligations 5 5
Allocation of plan assets
Debt securities 57 57
Equity securities 7 9
Insurance contracts and others 1 1
Total plan assets 65 67
Actual return on plan assets for the year 7 10
Actuarial gains/(losses) recognised in other comprehensive income – –3
Number of plan participants 1,330 1,337
Duration in years 13.8 13.8
Weighted actuarial assumptions at the balance sheet date
Per cent 2020 2019
Discount rate 2.50 3.10
Mortality table Scale MP-2020
released by SOA
in October 2020
Scale MP-2019
released by SOA
in October 2019
88Other notes
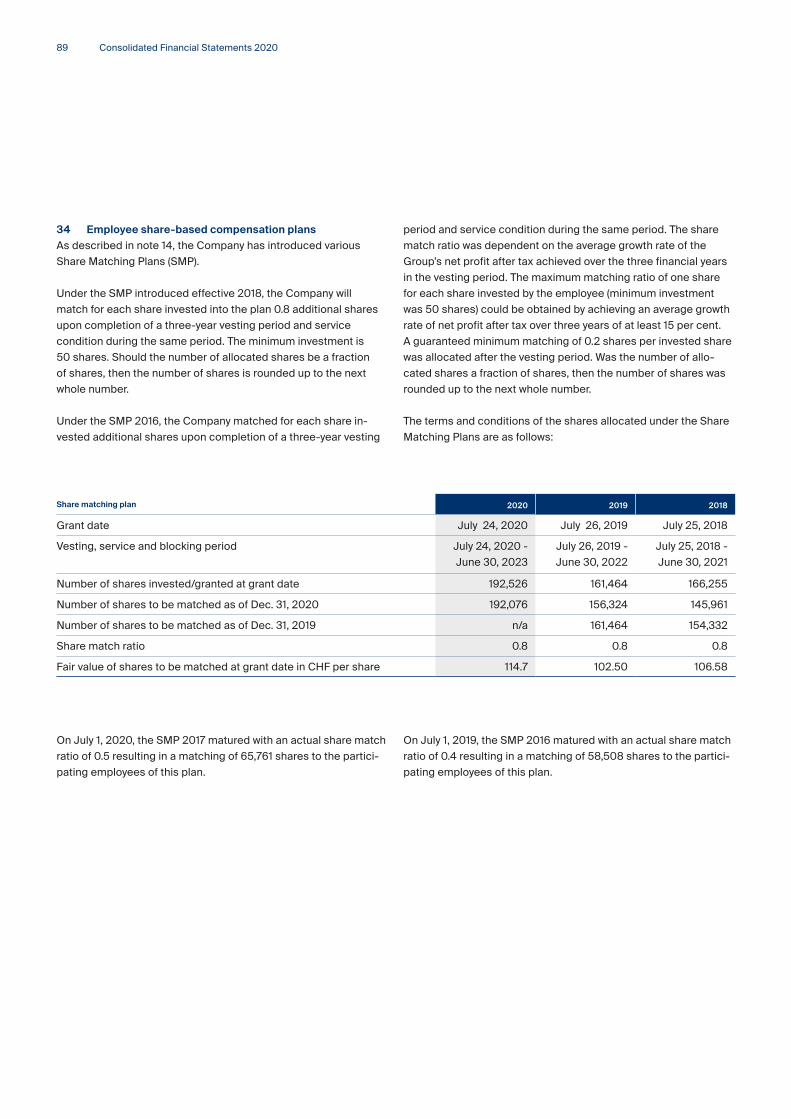
Consolidated Financial Statements 2020
period and service condition during the same period. The share
match ratio was dependent on the average growth rate of the
Group’s net profit after tax achieved over the three financial years
in the vesting period. The maximum matching ratio of one share
for each share invested by the employee (minimum investment
was 50 shares) could be obtained by achieving an average growth
rate of net profit after tax over three years of at least 15 per cent.
A guaranteed minimum matching of 0.2 shares per invested share
was allocated after the vesting period. Was the number of allo-
cated shares a fraction of shares, then the number of shares was
rounded up to the next whole number.
The terms and conditions of the shares allocated under the Share
Matching Plans are as follows:
On July 1, 2019, the SMP 2016 matured with an actual share match
ratio of 0.4 resulting in a matching of 58,508 shares to the partici-
pating employees of this plan.
34 Employee share-based compensation plans
As described in note 14, the Company has introduced various
Share Matching Plans (SMP).
Under the SMP introduced effective 2018, the Company will
match for each share invested into the plan 0.8 additional shares
upon completion of a three-year vesting period and service
condition during the same period. The minimum investment is
50 shares. Should the number of allocated shares be a fraction
of shares, then the number of shares is rounded up to the next
whole number.
Under the SMP 2016, the Company matched for each share in-
vested additional shares upon completion of a three-year vesting
On July 1, 2020, the SMP 2017 matured with an actual share match
ratio of 0.5 resulting in a matching of 65,761 shares to the partici-
pating employees of this plan.
Share matching plan 2020 2019 2018
Grant date July 24, 2020 July 26, 2019 July 25, 2018
Vesting, service and blocking period July 24, 2020 -
June 30, 2023
July 26, 2019 -
June 30, 2022
July 25, 2018 -
June 30, 2021
Number of shares invested/granted at grant date 192,526 161,464 166,255
Number of shares to be matched as of Dec. 31, 2020 192,076 156,324 145,961
Number of shares to be matched as of Dec. 31, 2019 n/a 161,464 154,332
Share match ratio 0.8 0.8 0.8
Fair value of shares to be matched at grant date in CHF per share 114.7 102.50 106.58
89
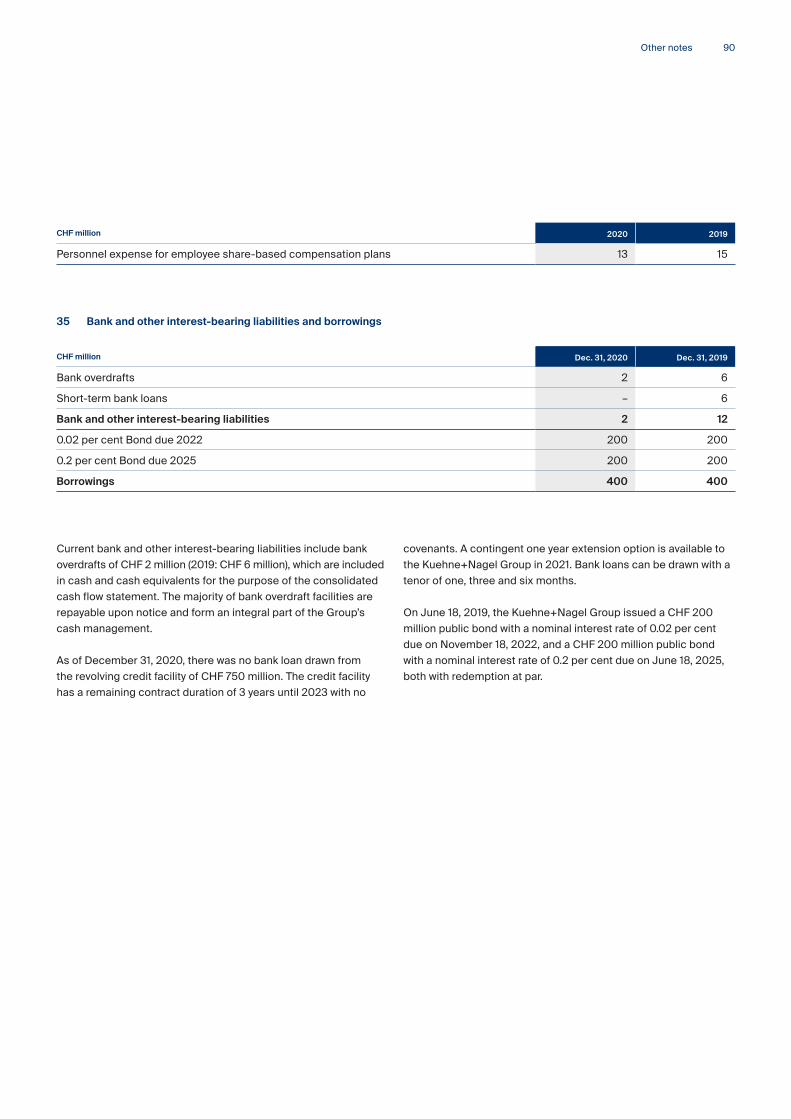
Current bank and other interest-bearing liabilities include bank
overdrafts of CHF 2 million (2019: CHF 6 million), which are included
in cash and cash equivalents for the purpose of the consolidated
cash flow statement. The majority of bank overdraft facilities are
repayable upon notice and form an integral part of the Group’s
cash management.
As of December 31, 2020, there was no bank loan drawn from
the revolving credit facility of CHF 750 million. The credit facility
has a remaining contract duration of 3 years until 2023 with no
covenants. A contingent one year extension option is available to
the Kuehne+Nagel Group in 2021. Bank loans can be drawn with a
tenor of one, three and six months.
On June 18, 2019, the Kuehne+Nagel Group issued a CHF 200
million public bond with a nominal interest rate of 0.02 per cent
due on November 18, 2022, and a CHF 200 million public bond
with a nominal interest rate of 0.2 per cent due on June 18, 2025,
both with redemption at par.
CHF million 2020 2019
Personnel expense for employee share-based compensation plans 13 15
35 Bank and other interest-bearing liabilities and borrowings
CHF million Dec. 31, 2020 Dec. 31, 2019
Bank overdrafts 2 6
Short-term bank loans – 6
Bank and other interest-bearing liabilities 2 12
0.02 per cent Bond due 2022 200 200
0.2 per cent Bond due 2025 200 200
Borrowings 400 400
90Other notes

Consolidated Financial Statements 2020
36 Provisions
The movements in provisions were as follows:
CHF millionClaim
provisions 1
Provision fordeductible of
transport liabilityinsurance 2 Others 3
Totalprovision
Balance as of January 1, 2019 47 29 39 115
Provisions used –10 –13 –10 –33
Provisions reversed –7 – –3 –10
Provisions made 30 3 21 54
Effect of movements in foreign exchange –1 – – –1
Balance as of December 31, 2019 59 19 47 125
of which
— Current portion 46 9 25 80
— Non-current portion 13 10 22 45
Total provisions 59 19 47 125
Balance as of January 1, 2020 59 19 47 125
Provisions used –16 –11 –10 –37
Provisions reversed –7 – –2 –9
Provisions made 34 4 34 72
Reclassification to “liabilities directly
associated with the assets held for sale” – – –25 –25
Effect of movements in foreign exchange –3 – –2 –5
Balance as of December 31, 2020 67 12 42 121
of which
— Current portion 54 5 27 86
— Non-current portion 13 7 15 35
Total provisions 67 12 42 121
1 Some Group companies are involved in legal proceedings on various issues (disputes about logistics services, antitrust etc.). Some legal proceedings have been settled, and cor-responding payments have been made. Since October 2007 various competition authorities have investigated certain antitrust allegations against international freight forwarding companies, inter alia against Kuehne+Nagel. During 2015 the French Competition Authority (FCA) has concluded an investigation of certain antitrust allegations in France, mainly against domestic freight forwarding companies, inter alia Alloin Transports (Alloin), a company which was acquired by Kuehne+Nagel in 2009. The decision of the FCA, according to which Alloin/Kuehne+Nagel paid a fine of CHF 34 million (EUR 32 million) was appealed to the Paris Court of Appeals in 2016. In 2017 Kuehne+Nagel was able to settle certain claims, which included a partial recourse claim against the sellers of Alloin. On July 19, 2018, the Paris Court of Appeals in first instance upheld the decision of the FCA against all claimants. Alloin/Kuehne+Nagel have appealed the decision to the French Supreme Court (Court de Cassation) on December 19, 2018. See also note 41.
2 An additional provision for deductibles in case of transport liability has been recognised for the current year’s exposure.3 Other provisions mainly consist of provisions for dilapidation costs amounting to CHF 30 million (2019: CHF 35 million).
91
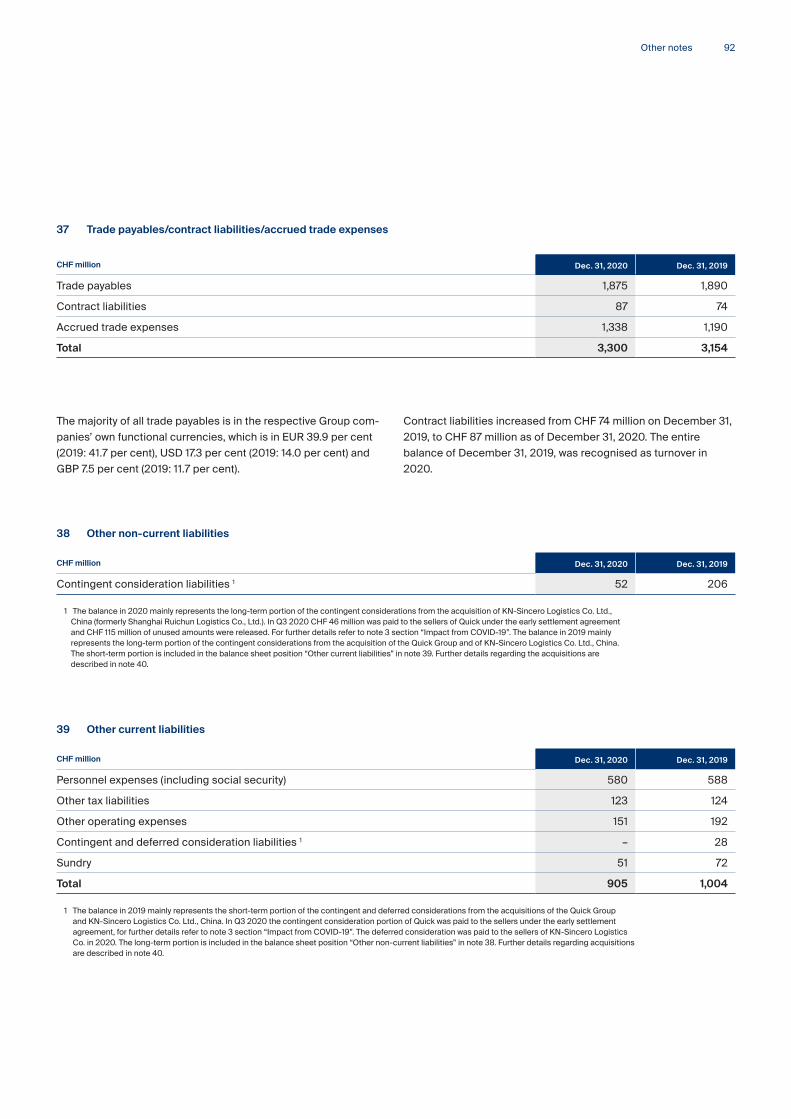
Contract liabilities increased from CHF 74 million on December 31,
2019, to CHF 87 million as of December 31, 2020. The entire
balance of December 31, 2019, was recognised as turnover in
2020.
The majority of all trade payables is in the respective Group com-
panies’ own functional currencies, which is in EUR 39.9 per cent
(2019: 41.7 per cent), USD 17.3 per cent (2019: 14.0 per cent) and
GBP 7.5 per cent (2019: 11.7 per cent).
37 Trade payables/contract liabilities/accrued trade expenses
CHF million Dec. 31, 2020 Dec. 31, 2019
Trade payables 1,875 1,890
Contract liabilities 87 74
Accrued trade expenses 1,338 1,190
Total 3,300 3,154
38 Other non-current liabilities
CHF million Dec. 31, 2020 Dec. 31, 2019
Contingent consideration liabilities 1 52 206
1 The balance in 2020 mainly represents the long-term portion of the contingent considerations from the acquisition of KN-Sincero Logistics Co. Ltd., China (formerly Shanghai Ruichun Logistics Co., Ltd.). In Q3 2020 CHF 46 million was paid to the sellers of Quick under the early settlement agreement and CHF 115 million of unused amounts were released. For further details refer to note 3 section “Impact from COVID-19”. The balance in 2019 mainly represents the long-term portion of the contingent considerations from the acquisition of the Quick Group and of KN-Sincero Logistics Co. Ltd., China. The short-term portion is included in the balance sheet position “Other current liabilities” in note 39. Further details regarding the acquisitions are described in note 40.
39 Other current liabilities
CHF million Dec. 31, 2020 Dec. 31, 2019
Personnel expenses (including social security) 580 588
Other tax liabilities 123 124
Other operating expenses 151 192
Contingent and deferred consideration liabilities 1 – 28
Sundry 51 72
Total 905 1,004
1 The balance in 2019 mainly represents the short-term portion of the contingent and deferred considerations from the acquisitions of the Quick Group and KN-Sincero Logistics Co. Ltd., China. In Q3 2020 the contingent consideration portion of Quick was paid to the sellers under the early settlement agreement, for further details refer to note 3 section “Impact from COVID-19”. The deferred consideration was paid to the sellers of KN-Sincero Logistics Co. in 2020. The long-term portion is included in the balance sheet position “Other non-current liabilities” in note 38. Further details regarding acquisitions are described in note 40.
92Other notes

Consolidated Financial Statements 2020
The trade receivables comprise gross contractual amounts due of
CHF 17 million, and all amounts are expected to be collectible.
Goodwill of CHF 25 million arose on the acquisition and represents
management expertise and workforce, which do not meet the defi-
nition of an intangible asset to be recognised separately. Goodwill
is not expected to be tax deductible.
Acquisition-related costs (included in the line item “selling, general
and administrative expenses” in the income statement) are below
CHF 1 million.
No material adjustments to the values previously reported were
deemed necessary after having finalised the acquisition accounting
in 2020.
Effective January 7, 2020 the Group acquired 100 per cent of the
shares of the road logistics activities of Rotrexma 2 Holding BV
(Rotra), a company headquartered in the Netherlands, together
with its subsidiaries. With approximately 800 employees and a
yearly net revenue of above CHF 110 million the Group of compa-
nies operates a fleet of over 200 trucks, providing Europe-wide
overland transportation as well as contract logistics services for
Dutch, Belgian and international customers. It manages cross-
dock facilities in the Netherlands and in Belgium. The purchase
price of CHF 38 million was paid in cash.
Other intangibles of CHF 10 million recognised on the acquisition
represent customer contracts and non-contractual customer lists
having a useful life of five years.
40 Acquisitions and agreed-upon divestments
2020 Acquisitions
CHF millionRecognised fair
values
Property, plant and equipment 2
Right-of-use assets 27
Other intangibles 10
Trade receivables 17
Other current assets 1
Acquired cash and cash equivalents (net) 3
Subtotal assets 60
Non-current lease liabilities –23
Other non current liabilities –3
Trade payables –11
Current lease liabilities –4
Other current liabilities –6
Total identifiable assets and liabilities, net 13
Goodwill 25
Purchase price, paid in cash 38
Acquired cash and cash equivalents (net) –3
Net cash outflow 35
93
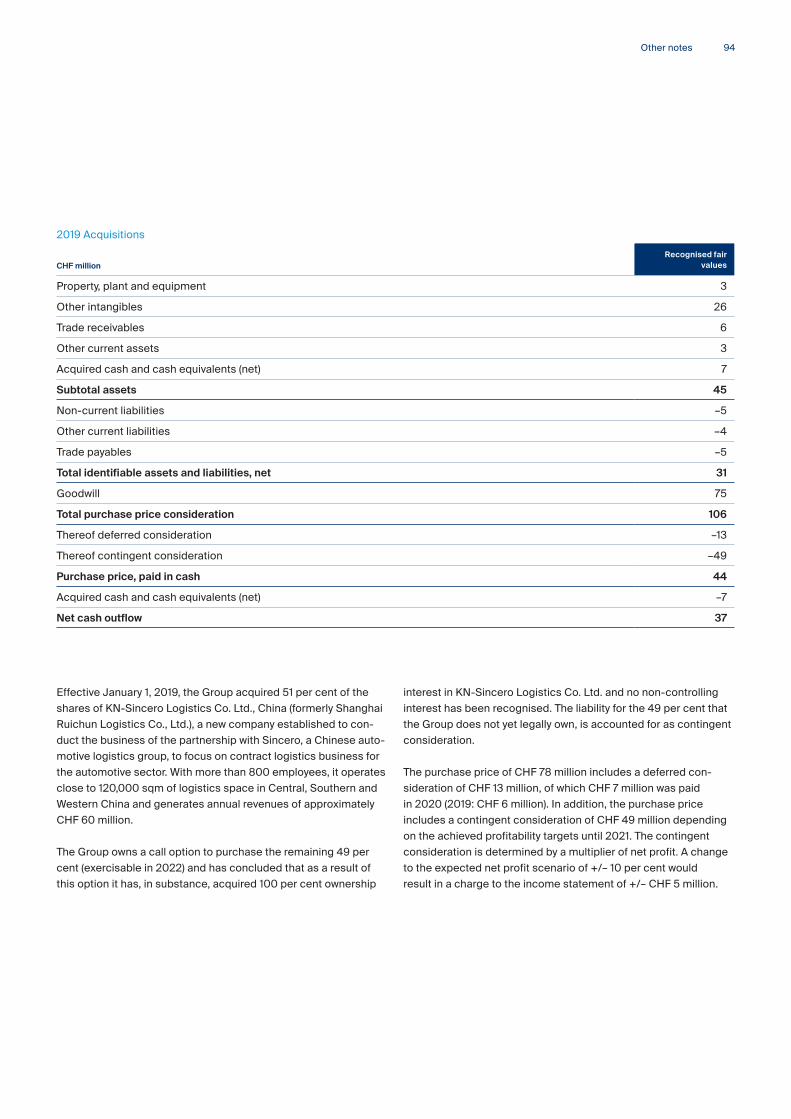
interest in KN-Sincero Logistics Co. Ltd. and no non-controlling
interest has been recognised. The liability for the 49 per cent that
the Group does not yet legally own, is accounted for as contingent
consideration.
The purchase price of CHF 78 million includes a deferred con-
sideration of CHF 13 million, of which CHF 7 million was paid
in 2020 (2019: CHF 6 million). In addition, the purchase price
includes a contingent consideration of CHF 49 million depending
on the achieved profitability targets until 2021. The contingent
consideration is determined by a multiplier of net profit. A change
to the expected net profit scenario of +/– 10 per cent would
result in a charge to the income statement of +/– CHF 5 million.
Effective January 1, 2019, the Group acquired 51 per cent of the
shares of KN-Sincero Logistics Co. Ltd., China (formerly Shanghai
Ruichun Logistics Co., Ltd.), a new company established to con-
duct the business of the partnership with Sincero, a Chinese auto-
motive logistics group, to focus on contract logistics business for
the automotive sector. With more than 800 employees, it operates
close to 120,000 sqm of logistics space in Central, Southern and
Western China and generates annual revenues of approximately
CHF 60 million.
The Group owns a call option to purchase the remaining 49 per
cent (exercisable in 2022) and has concluded that as a result of
this option it has, in substance, acquired 100 per cent ownership
2019 Acquisitions
CHF millionRecognised fair
values
Property, plant and equipment 3
Other intangibles 26
Trade receivables 6
Other current assets 3
Acquired cash and cash equivalents (net) 7
Subtotal assets 45
Non-current liabilities –5
Other current liabilities –4
Trade payables –5
Total identifiable assets and liabilities, net 31
Goodwill 75
Total purchase price consideration 106
Thereof deferred consideration –13
Thereof contingent consideration –49
Purchase price, paid in cash 44
Acquired cash and cash equivalents (net) –7
Net cash outflow 37
94Other notes

Consolidated Financial Statements 2020
If the acquisitions had occurred on January 1, 2019, the Group’s
net turnover would have been CHF 21,168 million and consolidated
earnings for the period would have been CHF 800 million.
No material adjustments to the values previously reported were
deemed necessary after having finalised the acquisition accoun-
ting in 2020.
Agreed upon divestment
On March 8, 2020, Kuehne+Nagel entered into a binding agree-
ment to sell a major part of its contract logistics portfolio in the
United Kingdom to XPO Logistics, Inc. (NYSE: XPO). The scope
of the transaction includes the drinks logistics, food services and
retail & technology businesses, whereby the pharma & healthcare
businesses are retained. In 2020, which was adversely impacted
by the COVID-19 crisis, these operations contributed CHF 630
million turnover, gross profit of CHF 515 million and a loss for the
period of CHF 14 million, excluding any transaction costs and
impairment charges.
On December 31, 2020, the assets and liabilities related to this
divestment are classified as assets held for sale (CHF 434 million)
and liabilities directly associated with the assets held for sale
(CHF 419 million) and are presented separately in the Balance
Sheet. Impairments of goodwill allocated to the disposal group of
CHF 18 million as well as CHF 49 million of the other assets were
recognised to reduce the net carrying amount of the assets held
for sale to their fair value less costs to sell. In addition, the Group
recorded transaction costs of CHF 4 million (included in the line
item “selling, general and administrative expenses” in the Income
Statement). The transaction closed on January 1, 2021.
Effective July 1, 2019, the Group acquired the business of World-
wide Perishables Canada Co., specialized in seafood logistics.
With a strong footprint on the East Coast, the business will streng-
then the existing Kuehne+Nagel perishables network in Canada.
The purchase price of CHF 5 million was paid in cash.
Effective September 10, 2019, the Group acquired 100 per cent
of the shares of Joebstl Group, a medium-sized logistics group
of companies headquartered in Wundschuh, Austria. The Joebstl
Group offers international and domestic groupage, and full-truck-
load and less-than-truckload services mainly in Eastern Europe to
customers in Austria and Slovenia. The purchase price of CHF 23
million was paid in cash.
Acquisition-related costs (included in the line item “selling, general
and administrative expenses” in the income statement) are below
CHF 1 million.
The trade receivables comprise gross contractual amounts due of
CHF 6 million, of which none were expected to be uncollectible at
the acquisition date.
Other intangibles of CHF 26 million recognised on the acquisitions
represent contractual and non-contractual customer lists having a
useful life of one to six years.
Goodwill of CHF 75 million arose on the acquisitions and repre-
sents management expertise and workforce which do not meet
the definition of an intangible asset to be recognised separately.
Goodwill is not expected to be tax deductible.
95
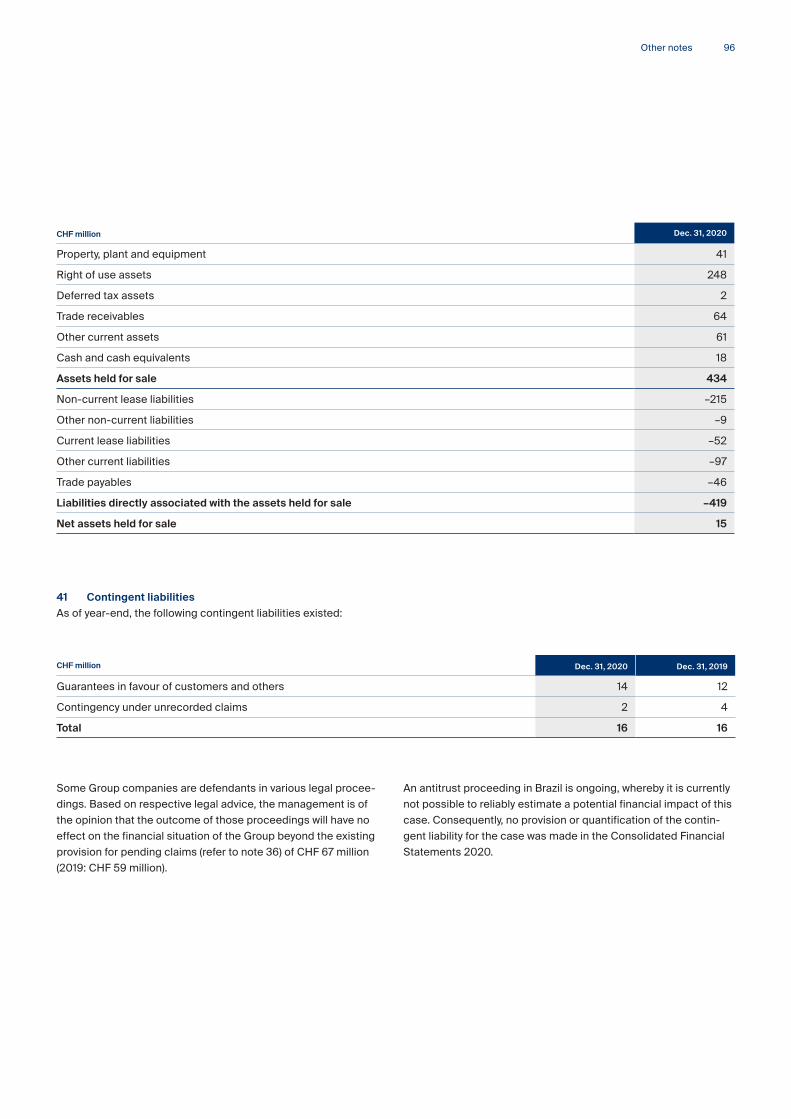
41 Contingent liabilities
As of year-end, the following contingent liabilities existed:
CHF million Dec. 31, 2020 Dec. 31, 2019
Guarantees in favour of customers and others 14 12
Contingency under unrecorded claims 2 4
Total 16 16
CHF million Dec. 31, 2020
Property, plant and equipment 41
Right of use assets 248
Deferred tax assets 2
Trade receivables 64
Other current assets 61
Cash and cash equivalents 18
Assets held for sale 434
Non-current lease liabilities –215
Other non-current liabilities –9
Current lease liabilities –52
Other current liabilities –97
Trade payables –46
Liabilities directly associated with the assets held for sale –419
Net assets held for sale 15
Some Group companies are defendants in various legal procee-
dings. Based on respective legal advice, the management is of
the opinion that the outcome of those proceedings will have no
effect on the financial situation of the Group beyond the existing
provision for pending claims (refer to note 36) of CHF 67 million
(2019: CHF 59 million).
An antitrust proceeding in Brazil is ongoing, whereby it is currently
not possible to reliably estimate a potential financial impact of this
case. Consequently, no provision or quantification of the contin-
gent liability for the case was made in the Consolidated Financial
Statements 2020.
96Other notes

Consolidated Financial Statements 2020
42 Other financial commitments
As of year-end, the following financial commitments mainly related
to short-term and low value leases existed:
Details regarding the leases recognised in the income statement
are described in note 27.
43 Capital commitments
As of year-end, the following capital commitments existed in
respect of non-cancellable purchase contracts.
As of December 31, 2020
CHF millionProperties
and buildings
Operatingand office
equipment Total
2021 22 53 75
2022–2025 12 54 66
Later 2 – 2
Total 36 107 143
As of December 31, 2019
CHF millionProperties
and buildings
Operatingand office
equipment Total
2020 34 64 98
2021–2024 15 74 89
Later – 1 1
Total 49 139 188
CHF million Dec. 31, 2020 Dec. 31, 2019
Italy 4 2
Great Britain 16 10
Total 20 12
97
In accordance with its financial risk policies, the Group manages
its market risk exposures by using financial instruments when
deemed appropriate. It is the Group’s policy and practice neither
to enter into derivative transactions for trading or speculative
purposes, nor for any purpose unrelated to business transactions.
Market risk
Market risk is the risk that changes of market prices due to interest
rates and foreign exchange rates are affecting the Group’s results
and financial position.
Interest rate risk
Interest rate risk arises from movements in interest rates which
could have effects on the Group’s results and financial position.
Changes in interest rates may cause variations in interest income
and expenses resulting from interest-bearing assets and liabilities.
Interest rate risk is the risk that the fair value or the future cash
flows of a financial instrument will fluctuate because of changes
in market interest rates. Loans and investments at variable interest
rates expose the Group to cash flow interest rate risk. Loans and
investments at fixed interest rates expose the Group to fair value
interest rate risk in case they are measured at fair value.
Exposure
The Group’s exposure to interest rate risk relates primarily to its
bank loans and to the Group’s investments of its excess funds.
The Group’s exposure to changes in interest rates is limited due to
the short-term nature of investments of excess funds and borro-
wings. The Group does not use derivative financial instruments
to hedge its interest rate risk in respect of investments of excess
funds or loans.
44 Risk management
Group risk management
Kuehne+Nagel has a centralised risk management in place.
The Risk and Compliance Committee ensures that the Group has
implemented an effective and adequate risk management system
and process. The overall strategical risk exposure of the Group
was assessed, for operational risks an independent risk assess-
ment procedure was adopted, and an assessment of financial
risks was performed. Identified material risks are monitored on an
ongoing basis and mitigating actions and controls are implemented.
Risk management, objectives and policies are described in the
Status Report on page 16.
Financial risk management
The Group is exposed to various financial risks arising from its
underlying operations and finance activities. The Group is primarily
exposed to market risk (i.e. interest rate and currency risk) and to
credit and liquidity risk.
Financial risk management within the Group is governed by poli-
cies and guidelines approved by the senior management. These
policies and guidelines cover interest rate risk, currency risk, credit
risk and liquidity risk. Group policies and guidelines also cover
areas such as cash management, investment of excess funds and
the raising of short and long-term debt. Compliance with the poli-
cies and guidelines is managed by independent functions within
the Group. The objective of financial risk management is to contain,
where deemed appropriate, exposures to the various types of
financial risks mentioned above in order to limit any negative impact
on the Group’s results and financial position.
98Other notes
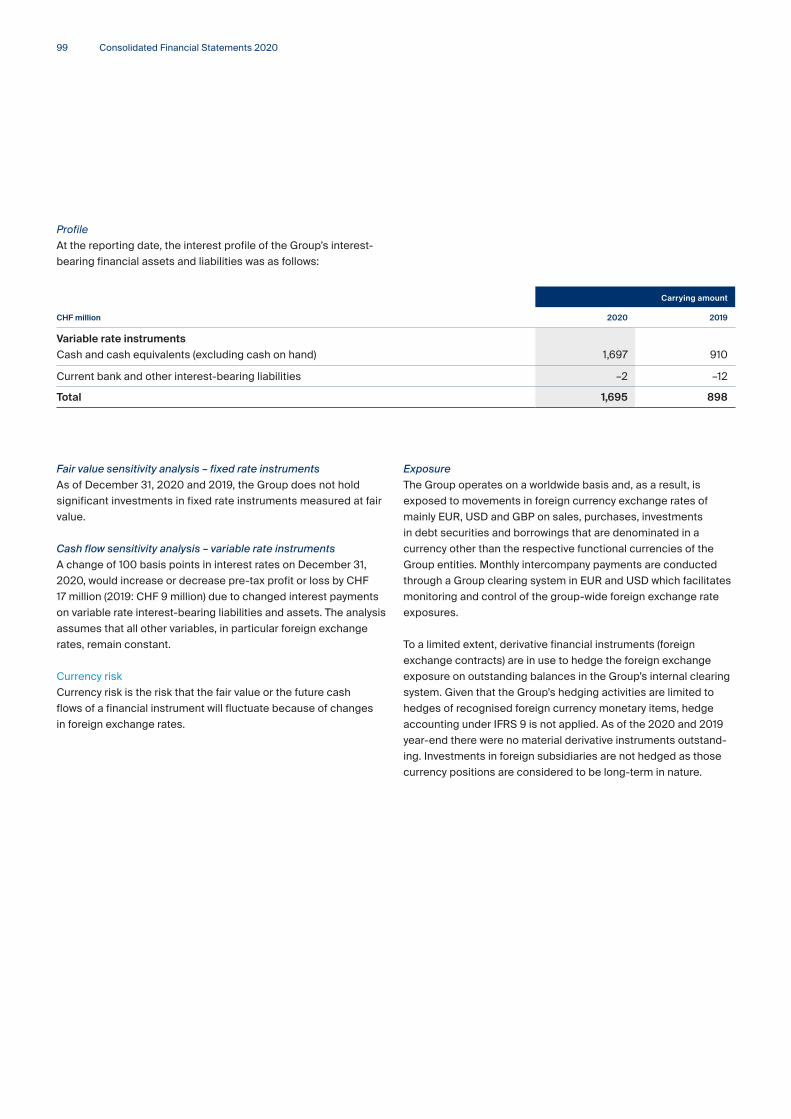
Consolidated Financial Statements 2020
Exposure
The Group operates on a worldwide basis and, as a result, is
exposed to movements in foreign currency exchange rates of
mainly EUR, USD and GBP on sales, purchases, investments
in debt securities and borrowings that are denominated in a
currency other than the respective functional currencies of the
Group entities. Monthly intercompany payments are conducted
through a Group clearing system in EUR and USD which facilitates
monitoring and control of the group-wide foreign exchange rate
exposures.
To a limited extent, derivative financial instruments (foreign
exchange contracts) are in use to hedge the foreign exchange
exposure on outstanding balances in the Group’s internal clearing
system. Given that the Group’s hedging activities are limited to
hedges of recognised foreign currency monetary items, hedge
accounting under IFRS 9 is not applied. As of the 2020 and 2019
year-end there were no material derivative instruments outstand-
ing. Investments in foreign subsidiaries are not hedged as those
currency positions are considered to be long-term in nature.
Fair value sensitivity analysis – fixed rate instruments
As of December 31, 2020 and 2019, the Group does not hold
significant investments in fixed rate instruments measured at fair
value.
Cash flow sensitivity analysis – variable rate instruments
A change of 100 basis points in interest rates on December 31,
2020, would increase or decrease pre-tax profit or loss by CHF
17 million (2019: CHF 9 million) due to changed interest payments
on variable rate interest-bearing liabilities and assets. The analysis
assumes that all other variables, in particular foreign exchange
rates, remain constant.
Currency risk
Currency risk is the risk that the fair value or the future cash
flows of a financial instrument will fluctuate because of changes
in foreign exchange rates.
Carrying amount
CHF million 2020 2019
Variable rate instruments
Cash and cash equivalents (excluding cash on hand) 1,697 910
Current bank and other interest-bearing liabilities –2 –12
Total 1,695 898
Profile
At the reporting date, the interest profile of the Group’s interest-
bearing financial assets and liabilities was as follows:
99

2020 2019
CHF million EUR USD GBP EUR USD GBP
Cash and cash equivalents 1 81 108 82 152 87 77
Trade receivables 58 394 5 69 336 52
Interest-bearing liabilities – 1 – – – –
Trade payables –47 –136 –1 –47 –116 –2
Net balance sheet exposure 92 367 86 174 307 127
1 Mainly represents cash pool balances in CHF with subsidiaries with functional currency EUR and USD.
Sensitivity analysis
A ten per cent strengthening respectively weakening of the
CHF against the following currencies on December 31, would
have had the following effect on the amounts shown below. This
analysis assumes that all other variables, in particular interest
rates, remain constant.
The majority of all trade related billings and payments as well as
all payments of interest-bearing liabilities and lease liabilities
are made in the respective functional currencies of the Group
entities.
2020
CHF million 1 CHF/EUR 1 CHF/USD 1 GBP/EUR 1 GBP/USD 1 USD/EUR
Reasonably possible change +/–
in per cent 10.0 10.0 10.0 10.0 10.0
Effect on income statement +/–
(pre-tax) 9.2 36.7 7.7 30.5 10.3
As of year-end the Group’s exposure to foreign currency risk was
as follows:
100Other notes
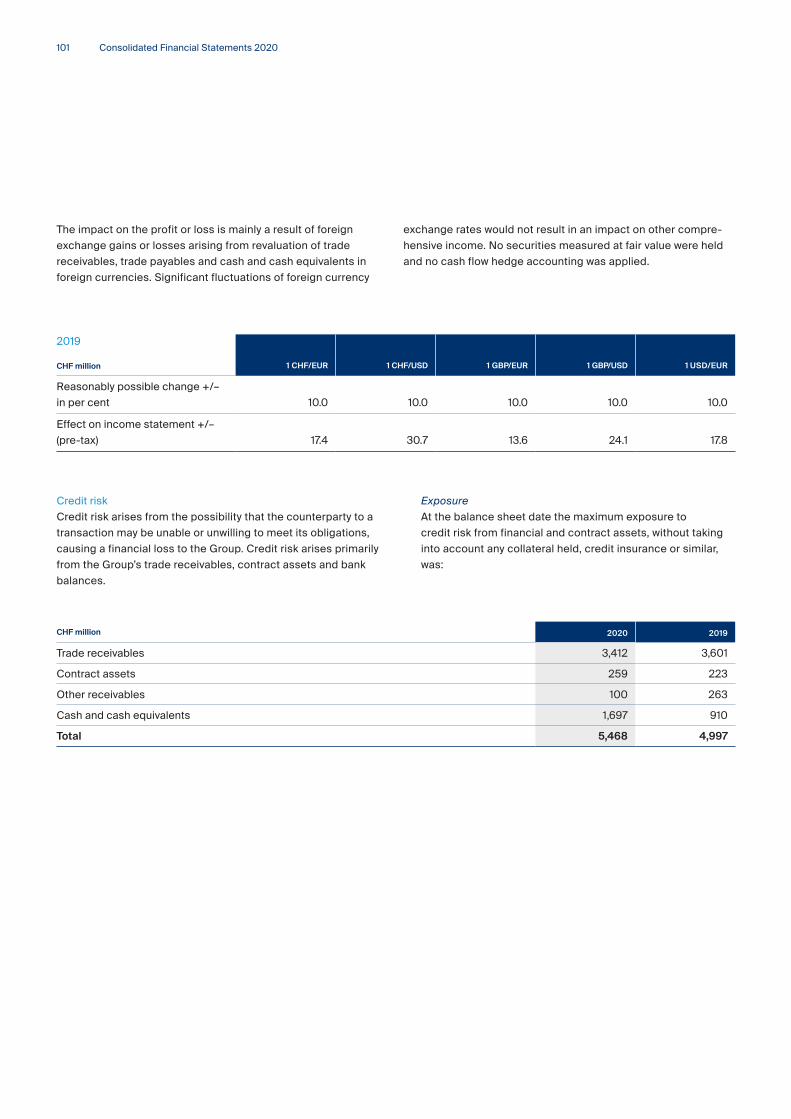
Consolidated Financial Statements 2020
CHF million 2020 2019
Trade receivables 3,412 3,601
Contract assets 259 223
Other receivables 100 263
Cash and cash equivalents 1,697 910
Total 5,468 4,997
exchange rates would not result in an impact on other compre-
hensive income. No securities measured at fair value were held
and no cash flow hedge accounting was applied.
Exposure
At the balance sheet date the maximum exposure to
credit risk from financial and contract assets, without taking
into account any collateral held, credit insurance or similar,
was:
The impact on the profit or loss is mainly a result of foreign
exchange gains or losses arising from revaluation of trade
receivables, trade payables and cash and cash equivalents in
foreign currencies. Significant fluctuations of foreign currency
Credit risk
Credit risk arises from the possibility that the counterparty to a
transaction may be unable or unwilling to meet its obligations,
causing a financial loss to the Group. Credit risk arises primarily
from the Group’s trade receivables, contract assets and bank
balances.
2019
CHF million 1 CHF/EUR 1 CHF/USD 1 GBP/EUR 1 GBP/USD 1 USD/EUR
Reasonably possible change +/–
in per cent 10.0 10.0 10.0 10.0 10.0
Effect on income statement +/–
(pre-tax) 17.4 30.7 13.6 24.1 17.8
101
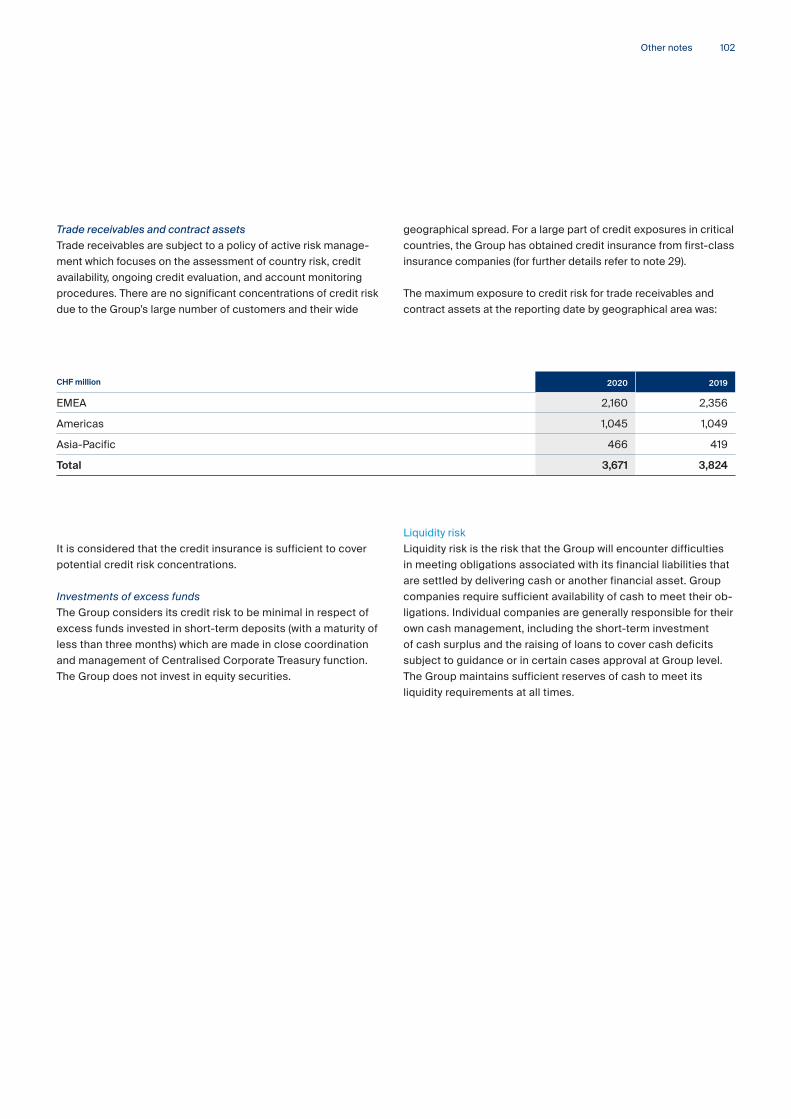
geographical spread. For a large part of credit exposures in critical
countries, the Group has obtained credit insurance from first-class
insurance companies (for further details refer to note 29).
The maximum exposure to credit risk for trade receivables and
contract assets at the reporting date by geographical area was:
Liquidity risk
Liquidity risk is the risk that the Group will encounter difficulties
in meeting obligations associated with its financial liabilities that
are settled by delivering cash or another financial asset. Group
companies require sufficient availability of cash to meet their ob-
ligations. Individual companies are generally responsible for their
own cash management, including the short-term investment
of cash surplus and the raising of loans to cover cash deficits
subject to guidance or in certain cases approval at Group level.
The Group maintains sufficient reserves of cash to meet its
liquidity requirements at all times.
Trade receivables and contract assets
Trade receivables are subject to a policy of active risk manage-
ment which focuses on the assessment of country risk, credit
availability, ongoing credit evaluation, and account monitoring
procedures. There are no significant concentrations of credit risk
due to the Group’s large number of customers and their wide
It is considered that the credit insurance is sufficient to cover
potential credit risk concentrations.
Investments of excess funds
The Group considers its credit risk to be minimal in respect of
excess funds invested in short-term deposits (with a maturity of
less than three months) which are made in close coordination
and management of Centralised Corporate Treasury function.
The Group does not invest in equity securities.
CHF million 2020 2019
EMEA 2,160 2,356
Americas 1,045 1,049
Asia-Pacific 466 419
Total 3,671 3,824
102Other notes

Consolidated Financial Statements 2020
The following are the contractual maturities of financial liabilities
(undiscounted), including interest payments and excluding the
impact of netting agreements:
2020
CHF millionCarryingamounts
Contractualcash flow
Up to6 months
6–12 months
1–5 years
Over5 years
Bank and other interest-bearing liabilities 2 2 2 – – –
Borrowings 400 402 – – 402
Trade payables 1,875 1,875 1,875 – – –
Accrued trade expenses 1,338 1,338 1,338 – – –
Contingent consideration liabilities 52 54 – – 54 –
Other liabilities 232 232 232 – – –
Lease liabilities 1 1,583 1,604 230 208 867 299
Total 5,482 5,507 3,677 208 1,323 299
1 The majority of lease payments over five years falls due until 2030.
2019
CHF millionCarryingamounts
Contractualcash flow
Up to6 months
6–12 months
1–5 years
Over5 years
Bank and other interest-bearing liabilities 12 12 11 1 – –
Borrowings 400 402 – – 202 200
Trade payables 1,890 1,890 1,890 – – –
Accrued trade expenses 1,190 1,190 1,190 – – –
Contingent and deferred consideration liabilities 234 238 28 – 210 –
Other liabilities 252 252 252 – –
Lease liabilities 1 1,942 1,981 271 247 1,100 363
Total 5,920 5,965 3,642 248 1,512 563
1 The majority of lease payments over five years falls due until 2028.
It is not expected that the cash flow included in the above matu-
rity analysis could occur at significantly different points in time or
at significantly different amounts.
103

45 Fair value of financial assets and liabilities
As of December 31, 2020
CHF millionFinancial assets
at FVPLFinancial assets
at amortised costTotal
carrying amountTotal
fair value
Trade receivables – 3,412 3,412 3,412
Other receivables 6 106 112 112
Total 6 3,518 3,524 3,524
As of December 31, 2019
CHF millionFinancial assets
at FVPLFinancial assets
at amortised costTotal
carrying amountTotal
fair value
Trade receivables – 3,601 3,601 3,601
Other receivables 2 261 263 263
Total 2 3,862 3,864 3,864
CHF millionFinancial liabilities
at FVPLFinancial liabilities
at amortised costTotal
carrying amountTotal
fair value
Borrowings – 400 400 400
Bank and other interest-bearing liabilities – 2 2 2
Trade payables – 1,875 1,875 1,875
Accrued trade expenses – 1,338 1,338 1,338
Contingent consideration liabilities 52 – 52 52
Other liabilities – 232 232 232
Total 52 3,847 3,899 3,899
CHF millionFinancial liabilities
at FVPLFinancial liabilities
at amortised costTotal
carrying amountTotal
fair value
Borrowings – 400 400 404
Bank and other interest-bearing liabilities – 12 12 12
Trade payables – 1,890 1,890 1,890
Accrued trade expenses – 1,190 1,190 1,190
Contingent and deferred
consideration liabilities 227 7 234 234
Other liabilities – 252 252 252
Total 227 3,751 3,978 3,982
104Other notes

Consolidated Financial Statements 2020
■ Level 2: Input other than quoted prices included within
Level 1 that are observable for the instrument, either directly
or indirectly,
■ Level 3: Valuation techniques using significant unobservable
inputs.
The fair value of the derivative instruments (forward foreign
exchange contracts) is determined based on current and
available market data. Pricing models commonly used in the
market are used, taking into account relevant parameters such
as forward rates, spot rates, discount rates, yield curves and
volatility.
Contingent considerations, resulting from business combina-
tions, are valued at fair value at the acquisition date as part of
the business combination. When the contingent consideration
meets the definition of a financial liability, it is subsequently
measured to fair value at each reporting date. The determina-
tion of the fair value is based on discounted cash flows. The key
assumptions take into consideration the probability of meeting
each performance target and the discount factor. Management
has reassessed the estimated performance targets (significant
unobservable input, level 3), other than the Quick early settle-
ment no significant change compared to December 31, 2019
has resulted.
On June 18, 2019, the Kuehne+Nagel Group issued a CHF 200
million public bond with a nominal interest rate of 0.02 per cent
due on November 18, 2022, and a CHF 200 million public bond
with a nominal interest rate of 0.2 per cent due on June 18, 2025,
both with redemption at par (quoted prices, level 1 fair value
of CHF 400 million on December 31, 2020, CHF 404 million in
2019). There are no other non-current fixed rate interest-bearing
loans or other liabilities outstanding (December 31, 2019: none).
The fair values of financial assets and liabilities carried at amor-
tised cost are approximately equal to their carrying amounts.
Other than the early settlement agreement with the sellers of
Quick, no significant impact resulted from the remeasurement
of the liabilities measured at fair value through profit and loss
(FVPL) in 2020 and 2019. For further details on the early set-
tlement agreement Quick, refer to note 3 section “Impact from
COVID-19”.
The Group’s financial instruments measured at fair value have
been categorised into below mentioned levels, reflecting the
significance of inputs used in estimating fair values:
■ Level 1: Quoted prices (unadjusted) in active markets for
identical instruments.
Level 3 fair values
CHF millionContingent
consideration liabilities
Balance as of January 1, 2020 227
Utilised for settlements 1 –46
Total (gains)/losses included in the income statement
— Unused amounts reversed - recorded within other operating income/expenses, net 1 –115
— Discount unwind – recorded within financial expenses 2
Total (gains)/losses included in other comprehensive income
Effects of movements in foreign exchange –16
Balance as of December 31, 2020 52
of which
— Current portion –
— Non-current portion 52
1 In Q3 2020, CHF 46 million was paid to the sellers of the Quick Group under the early settlement agreement and CHF 115 million of unused amounts were released. For further details refer to note 3 section “Impact from COVID-19”.
105
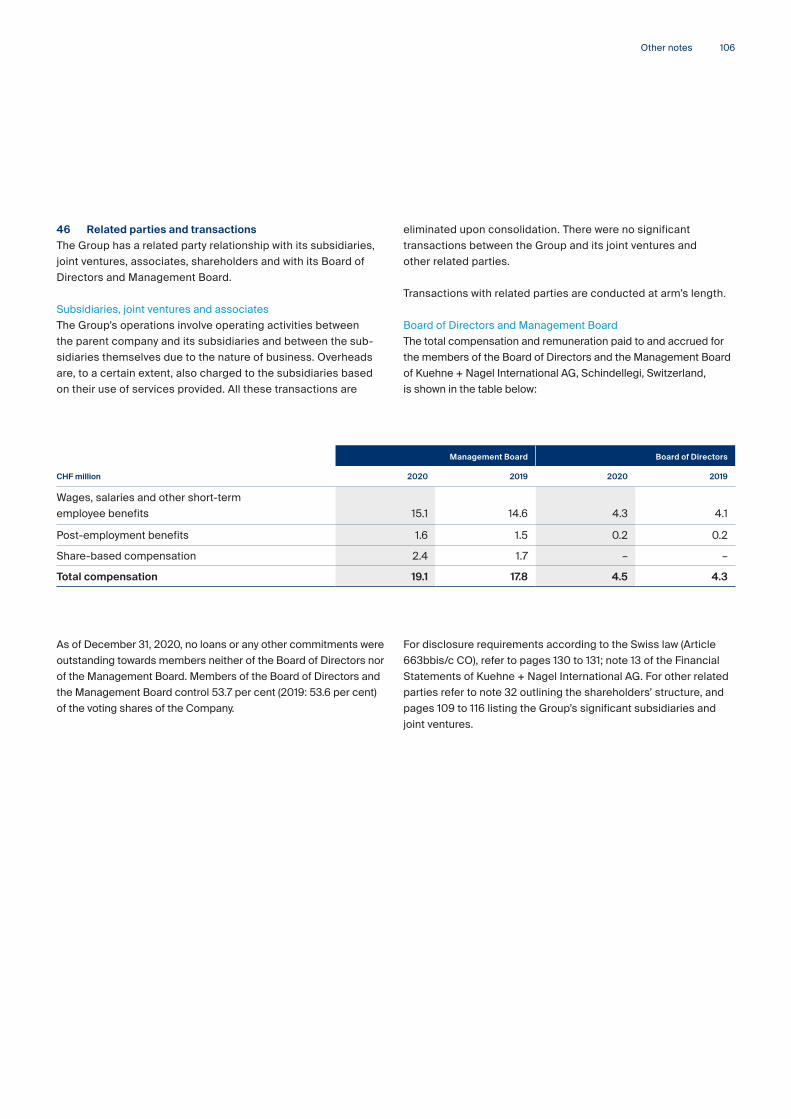
eliminated upon consolidation. There were no significant
transactions between the Group and its joint ventures and
other related parties.
Transactions with related parties are conducted at arm’s length.
Board of Directors and Management Board
The total compensation and remuneration paid to and accrued for
the members of the Board of Directors and the Management Board
of Kuehne + Nagel International AG, Schindellegi, Switzerland,
is shown in the table below:
For disclosure requirements according to the Swiss law (Article
663bbis/c CO), refer to pages 130 to 131; note 13 of the Financial
Statements of Kuehne + Nagel International AG. For other related
parties refer to note 32 outlining the shareholders’ structure, and
pages 109 to 116 listing the Group’s significant subsidiaries and
joint ventures.
46 Related parties and transactions
The Group has a related party relationship with its subsidiaries,
joint ventures, associates, shareholders and with its Board of
Directors and Management Board.
Subsidiaries, joint ventures and associates
The Group’s operations involve operating activities between
the parent company and its subsidiaries and between the sub-
sidiaries themselves due to the nature of business. Overheads
are, to a certain extent, also charged to the subsidiaries based
on their use of services provided. All these transactions are
As of December 31, 2020, no loans or any other commitments were
outstanding towards members neither of the Board of Directors nor
of the Management Board. Members of the Board of Directors and
the Management Board control 53.7 per cent (2019: 53.6 per cent)
of the voting shares of the Company.
Management Board Board of Directors
CHF million 2020 2019 2020 2019
Wages, salaries and other short-term
employee benefits 15.1 14.6 4.3 4.1
Post-employment benefits 1.6 1.5 0.2 0.2
Share-based compensation 2.4 1.7 – –
Total compensation 19.1 17.8 4.5 4.3
106Other notes

Consolidated Financial Statements 2020
In relation to binding agreement to sell a major part of its Contract
Logistics business in the United Kingdom to XPO Logistics, Inc.
(NYSE: XPO), the Group recorded impairment charges on goodwill
of CHF 18 million as well as CHF 49 million on other assets held
for sale to reduce the net carrying amount of the assets held for
sale to their fair value less costs to sell. For further details refer to
note 40.
In 2020, the Group recorded impairment charges of CHF 18 million
on goodwill (2019: no impairment), CHF 52 million on other
intangible assets (2019: CHF 11 million) and CHF 49 million on
assets held for sale (2019: no impairment) resulting in a total
impairment charge of CHF 119 million (2019: CHF 11 million). The
carrying amount of other intangibles is CHF 101 million (2019:
CHF 185 million), and that of property, plant and equipment is
CHF 797 million (2019: CHF 1,089 million).
Impairment tests are based on value-in-use calculations, which
involve a variety of assumptions such as estimates of future cash
inflows and outflows and choice of a discount rate. Actual cash
flows might, for example, differ significantly from management’s
current best estimate. Changes in market environment or the
evolution of technologies might have an impact on future cash
flows and result in recognition of impairment losses.
Fair value of contingent considerations
Contingent considerations, resulting from business combinations,
are measured at fair value at the acquisition date as part of the
business combination. When a contingent consideration meets
the definition of a financial liability, it is subsequently remeasured
to fair value at each reporting date. The determination of fair value
is based on discounted cash flows. The key assumptions take into
consideration the probability of meeting each performance target
and the discount factor.
As part of the accounting for the acquisitions of KN-Sincero
Logistics Co. Ltd. (formerly Shanghai Ruichun Logistics Co., Ltd.),
a contingent consideration with an estimated fair value of CHF 49
million was recognised at the acquisition date. As of December 31,
2020, the Group has recognised total contingent consideration
liabilities of CHF 52 million (2019: CHF 227 million). The contingent
consideration is classified as other financial liability. For further
details see notes 40 and 45.
47 Accounting estimates and judgements
The management has carefully considered the development,
selection and disclosure of the Group’s critical accounting policies
and estimates as well as the application of these policies and
estimates. Refer to note 3 and 28 for further details on changes in
accounting estimates.
Acquisition accounting
Intangible assets acquired in a business combination are required
to be recognised separately from goodwill and amortised over
their useful life if they are subject to contractual or legal rights or
are separately transferable. The Group has separately recognised
customer contracts/lists, brands and field office agent contracts
in acquisitions made (see note 28).
The fair value of these acquired intangible assets is based on
valuation techniques, which require input based on assumptions
about the future. The management uses its best knowledge to
estimate fair value of acquired intangible assets as of the acquisi-
tion date. The value of intangible assets is tested for impairment
when there is an indication that they might be impaired (see
below). The management must also make assumptions about the
useful life of the acquired intangible assets which might be
affected by external factors such as increased competition.
Carrying amount of goodwill, other intangibles
and property, plant and equipment
The Group tests its goodwill with a total carrying amount of CHF
1,155 million (2019: CHF 1,220 million) for impairment every year as
disclosed in note 10.
The Group also assesses annually whether there is any indication
that other intangible assets or property, plant and equipment may
be impaired. In such a case, the assets are tested for impairment.
In addition to the yearly impairment testing, the Group considered
the COVID-19 outbreak and the possible impact as a triggering
event in 2020. The recoverable amounts of the aggregated CGUs
clearly exceeded their carrying amounts. As a result of the impair-
ment testing, no impairment loss on goodwill was recognised in
2020 and 2019, other than mentioned in the next paragraph.
However, due to the down-trading of several aviation customers,
other intangible assets (customer lists) with the carrying amount
of CHF 52 million were impaired in 2020. Please refer to note 3
section “Impact from COVID-19” for further details.
107

48 Post balance sheet events
On March 8, 2020, Kuehne+Nagel entered into a binding agree-
ment to sell a major part of its contract logistics portfolio in the
United Kingdom to XPO Logistics, Inc. (NYSE: XPO). The scope of
the transaction includes the drinks logistics, food services and
retail & technology businesses, whereby the pharma & healthcare
businesses are retained. The transaction closed on January 1,
2021. For further details on the transaction and its implications
on the Consolidated Financial Statements refer to note 40.
On February 22, 2021, the Group entered into an agreement to
acquire 87.3% of the shares of Apex International Corporation
(Apex), one of the leading Asian freight forwarders, especially in
the transpacific and intra-Asia. The Group of companies is a
renowned specialist for air logistics services, founded in China
in 2001 and headquartered in Shanghai and Hong Kong. With
approximately 1,600 employees, Apex generates a yearly turnover
in excess of CHF 2.1 billion. In 2020, it handled a total air freight
volume of approximately 750,000 tons and sea freight volume of
190,000 TEU. The acquisition of Apex follows the Group’s strategic
growth ambition in Asia. The purchase price in the range between
CHF 1.1 and 1.2 billion will be financed by the Company’s own funds
and, if needed, by available credit lines. The acquisition is subject
to customary closing conditions, including merger clearance
by the competent competition authorities. The transaction is
expected to close in the third quarter of 2021.
There have been no other material events between December 31,
2020, and the date of authorisation of the Consolidated Financial
Statements that would require adjustments of the Consolidated
Financial Statements or disclosure.
49 Resolution of the Board of Directors
The Consolidated Financial Statements of the Group were
authorised for issue by the Board of Directors on March 2,
2021. A resolution to approve the Consolidated Financial State-
ments will be proposed at the Annual General Meeting on
May 4, 2021.
Defined benefit pension plans
The Group has recognised a liability for defined benefit pension
plans in the amount of CHF 405 million (2019: CHF 403 million).
A number of assumptions are made in order to calculate the
liability, including discount rate and future salary increases. A
relatively minor change in any of these assumptions can have
a significant impact on the carrying amount of the defined
benefit obligation.
Accrued trade expenses and deferred income
Freight forwarding transactions which are completed and for
which the costs are not fully received, are accrued for expected
costs based on best estimate. For transactions which are not
complete on account of pending service at cut-off date or
transactions for which revenue is earned and relevant costs
cannot be estimated, the related revenue is deferred. The Group
management’s judgement is involved in the estimate of costs and
deferral of revenue and their completeness.
Income tax
Judgement and estimates are required when determining
deferred as well as current tax assets and liabilities. The manage-
ment believes that its estimates, based on information such as the
interpretation of tax laws, are reasonable. Changes in tax laws and
rates, interpretations of tax laws, earnings before tax, and taxable
profit might have an impact on the amounts recognised as tax
assets and liabilities.
The Group has recognised a net deferred tax asset of CHF 189
million (2019: CHF 159 million). Furthermore, the Group has
unrecognised deferred tax assets relating to unused tax losses
of CHF 16 million (2019: CHF 16 million). Based on estimates such
as the probability of realising these tax benefits, available taxable
temporary differences, and periods of reversals of such differences,
the management does not believe that the criteria to recognise
deferred tax assets are met (see note 24).
Provisions and contingent liabilities
The Group has recognised provisions for an amount of CHF
121 million (2019: CHF 125 million) related to legal claims and
other exposures in the freight forwarding and logistics operations
(see note 36). The provisions represent the best estimate of the
risks, whereby the final amount required is subject to uncer-
tainty.
108Other notes
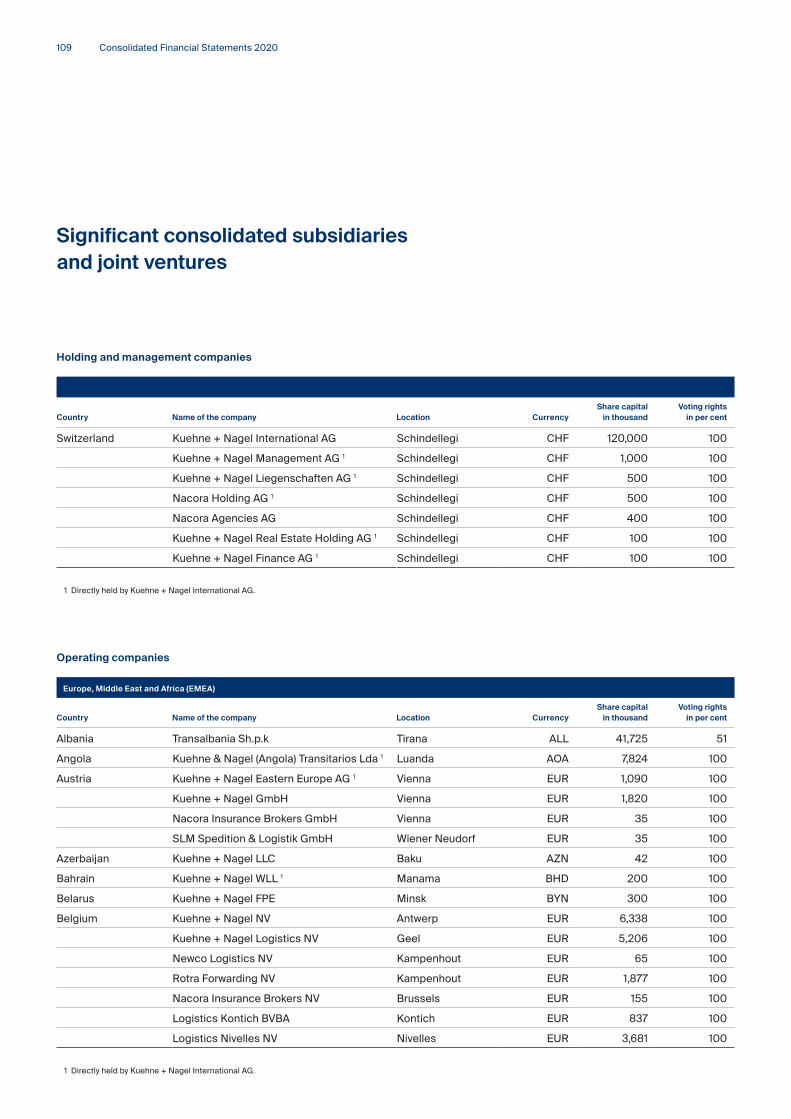
Consolidated Financial Statements 2020
Holding and management companies
Country Name of the company Location CurrencyShare capital
in thousandVoting rights
in per cent
Switzerland Kuehne + Nagel International AG Schindellegi CHF 120,000 100
Kuehne + Nagel Management AG 1 Schindellegi CHF 1,000 100
Kuehne + Nagel Liegenschaften AG 1 Schindellegi CHF 500 100
Nacora Holding AG 1 Schindellegi CHF 500 100
Nacora Agencies AG Schindellegi CHF 400 100
Kuehne + Nagel Real Estate Holding AG 1 Schindellegi CHF 100 100
Kuehne + Nagel Finance AG 1 Schindellegi CHF 100 100
1 Directly held by Kuehne + Nagel International AG.
Operating companies
Europe, Middle East and Africa (EMEA)
Country Name of the company Location CurrencyShare capital
in thousandVoting rights
in per cent
Albania Transalbania Sh.p.k Tirana ALL 41,725 51
Angola Kuehne & Nagel (Angola) Transitarios Lda 1 Luanda AOA 7,824 100
Austria Kuehne + Nagel Eastern Europe AG 1 Vienna EUR 1,090 100
Kuehne + Nagel GmbH Vienna EUR 1,820 100
Nacora Insurance Brokers GmbH Vienna EUR 35 100
SLM Spedition & Logistik GmbH Wiener Neudorf EUR 35 100
Azerbaijan Kuehne + Nagel LLC Baku AZN 42 100
Bahrain Kuehne + Nagel WLL 1 Manama BHD 200 100
Belarus Kuehne + Nagel FPE Minsk BYN 300 100
Belgium Kuehne + Nagel NV Antwerp EUR 6,338 100
Kuehne + Nagel Logistics NV Geel EUR 5,206 100
Newco Logistics NV Kampenhout EUR 65 100
Rotra Forwarding NV Kampenhout EUR 1,877 100
Nacora Insurance Brokers NV Brussels EUR 155 100
Logistics Kontich BVBA Kontich EUR 837 100
Logistics Nivelles NV Nivelles EUR 3,681 100
1 Directly held by Kuehne + Nagel International AG.
Significant consolidated subsidiaries and joint ventures
109

Significant consolidated subsidiaries and joint ventures
Europe, Middle East and Africa (EMEA)
Country Name of the company Location CurrencyShare capital
in thousandVoting rights
in per cent
Bosnia and
Herzegovina
Kuehne + Nagel doo Sarajevo BAM
95
100
Bulgaria Kuehne + Nagel EOOD Sofia BGN 365 100
Croatia Kuehne + Nagel d.o.o. Zagreb HRK 4,300 100
Cyprus Nakufreight Limited Nicosia EUR 17 100
Czech Republic Kuehne + Nagel spol. s. r.o. Prague CZK 21,000 100
Denmark Kuehne + Nagel A/S 1 Copenhagen DKK 5,001 100
Egypt Kuehne + Nagel Ltd. 1 Cairo EGP 1,000 100
Estonia Kuehne + Nagel AS Tallinn EUR 26 100
Kuehne + Nagel IT Service Centre AS Tallinn EUR 25 100
Finland Oy Kuehne + Nagel Ltd Helsinki EUR 200 100
France Kuehne + Nagel SAS Ferrières EUR 17,380 100
Kuehne + Nagel Parts SASU Trappes EUR 87 100
Nacora Courtage d’Assurances SAS Paris EUR 40 100
Kuehne + Nagel Aerospace & Industry SAS Ferrières EUR 37 100
Kuehne + Nagel EASYLOG SAS Ferrières EUR 37 100
Kuehne + Nagel Road SAS Villefranche EUR 4,000 100
IM Overland SARL Villefranche EUR 8 100
Almeca SNC Villefranche EUR 32 100
Kuehne + Nagel Participations Sarl Ferrières EUR 113,697 100
K Logistics Sarl Le Meux EUR 91 100
Kuehne + Nagel Solutions Saint Vulbas EUR 10 100
Kuehne + Nagel Insitu SASU Chalon sur Saone EUR 10 100
Quick International France SAS Villepinte EUR 50 100
Germany Kuehne + Nagel (AG & Co.) KG Bremen EUR 15,000 100
KN Airlift GmbH Frankfurt EUR 256 100
Stute Logistics (AG & Co.) KG Bremen EUR 1,023 100
CS Parts Logistics GmbH Bremen EUR 426 50
Kuehne + Nagel Euroshipping GmbH Regensburg EUR 256 51
Stute Aftermarket Services GmbH-DE Bremen EUR 357 100
STUTE OTS GmbH Hamburg EUR 25 100
Nacora Versicherungsmakler GmbH Hamburg EUR 79 100
Gustav. F. Huebener GmbH Hamburg EUR 31 100
Kuehne + Nagel Logistics Langenau GmbH Langenau EUR 25 100
Kuehne + Nagel Intermodal GmbH Bielefeld EUR 300 100
Aba Logistics GmbH (Joint Venture) Fulda EUR 200 50
Donau Transport und Umschlags GmbH
(Joint Venture)
Regensburg
EUR 108
50
Anchor Risk Services GmbH Hamburg EUR 25 100
1 Directly held by Kuehne + Nagel International AG.
110

Consolidated Financial Statements 2020
Europe, Middle East and Africa (EMEA)
Country Name of the company Location CurrencyShare capital
in thousandVoting rights
in per cent
Great Britain Kuehne + Nagel (UK) Limited Uxbridge EUR 46,300 100
Kuehne + Nagel Limited Uxbridge GBP 8,867 100
Nacora Insurance Brokers Limited Uxbridge GBP 150 100
Kuehne + Nagel Drinks Logistics Limited Milton Keynes GBP – 100
Kuehne + Nagel Drinkflow Logistics Ltd. Milton Keynes GBP 877 100
Kuehne + Nagel Drinkflow Logistics
(Holdings) Ltd. Milton Keynes GBP 6,123 100
Quick International Couriers (UK) Limited Colnbrook GBP – 100
Greece Kuehne + Nagel AE Athens EUR 10,028 100
Nacora Brokins International AE Athens EUR 60 60
Sindos Railcontainer Services AE
(Joint Venture) Thessaloniki EUR
3,038 50
Hungary Kuehne + Nagel Kft Budapest HUF 134,600 100
Iraq Jawharat Al-Sharq Co. for General Trans-
portation and Logistics Services L.L.C. Baghdad
USD
85
100
Kuehne + Nagel for General Transportation
and Logistics Services L.L.C. Erbil
USD
45
100
Ireland Kuehne & Nagel (Ireland) Limited Dublin EUR 500 100
Israel Amex Ltd. Holon ILS 2 91
Italy Kuehne + Nagel Srl Milan EUR 4,589 100
Nacora Srl Milan EUR 104 100
Jordan Kuehne and Nagel Jordan Ltd. Amman JOD 300 100
Kazakhstan Kuehne + Nagel LLC Almaty KZT 7,100 100
Kenya Kuehne + Nagel Limited 1 Nairobi KES 63,995 100
Blue Anchor Line Limited Nairobi KES 500 100
Trillvane Limited Nairobi KES 750 100
Kuwait Kuehne + Nagel Company W.L.L. 1 Kuwait KWD 150 100
Latvia Kuehne + Nagel SIA Riga EUR 142 100
Lebanon KN-ITS SAL (Joint Venture) 1 Beirut LBP 113,000 50
Lithuania Kuehne & Nagel UAB Vilnius EUR 232 100
Luxembourg Kuehne + Nagel S.a.r.l. Contern EUR 5,750 100
Kuehne + Nagel AG Contern EUR 31 100
Kuehne + Nagel Investments S.a.r.l. 1 Contern EUR 200 100
Nacora (Luxembourg) S.a.r.l. Contern EUR 125 100
Kuehne + Nagel Beteiligungs-AG 1 Contern EUR 10,277 100
Malta Kuehne + Nagel Limited Hamrun EUR 14 100
Mauritius KN (Mauritius) Limited 1 Port Louis MUR 4,000 100
Morocco Kuehne + Nagel SAS Casablanca MAD 300 100
1 Directly held by Kuehne + Nagel International AG.
111

Europe, Middle East and Africa (EMEA)
Country Name of the company Location CurrencyShare capital
in thousandVoting rights
in per cent
Mozambique Kuehne & Nagel Mocambique Lda. 1 Maputo MZN 125,883 100
Namibia Kuehne and Nagel (Pty) Ltd. 1 Windhoek NAD 340 100
Netherlands Kuehne + Nagel N.V. Rotterdam EUR 3,325 100
Kuehne + Nagel Investments B.V. 1 Rotterdam EUR 50 100
Nacora Assurantiekantoor B.V. Rotterdam EUR 45 100
Kuehne + Nagel Logistics B.V. Veghel EUR 25 100
North Macedonia Kuehne + Nagel d.o.o.e.l. Skopje MKD 3,216 100
Norway Kuehne + Nagel AS 1 Oslo NOK 3,100 100
Oman Universal Freight Services LLC Muscat OMR 250 70
Poland Kuehne + Nagel Sp.z o.o. Poznan PLN 14,869 100
Kuehne + Nagel Real Estate Sp.z.o.o. Gadki PLN 1,451 100
Portugal Kuehne + Nagel Lda Porto EUR 200 100
Qatar Kuehne + Nagel L.L.C. 1 Doha QAR 1,900 100
Romania Kuehne + Nagel SRL Bucharest RON 2,543 100
Truck Supply Europe Srl Ploiesti RON 442 100
S.C. Rotra Forwarding Srl Ploiesti RON 213 100
Russia OOO Kuehne + Nagel Moscow RUB 1,339,036 100
OOO Kuehne & Nagel Sakhalin Sakhalin RUB 500 100
OOO Nacora Moscow RUB 278 100
Saudi Arabia Kuehne and Nagel Limited 1 Jeddah SAR 1,000 100
Serbia Kuehne + Nagel d.o.o. Belgrade RSD 3,039 100
Kuehne + Nagel Shared
Service Centre d.o.o.
Belgrade
RSD
15,000
100
Slovakia Kuehne + Nagel s r.o. Bratislava EUR 470 100
Slovenia Kuehne + Nagel d.o.o. Ljubljana EUR 10 100
JOEBSTL I d.o.o. Ljubljana EUR 84 100
South Africa Kuehne + Nagel (Proprietary) Limited 1 Johannesburg ZAR 1,652 70
Nacora Insurance Brokers
(Proprietary) Limited
Johannesburg ZAR
35 100
Spain Kuehne & Nagel S.A.U. Madrid EUR 60 100
Kuehne Nagel Investments S.L.U. Madrid EUR 3 100
Nacora Correduria de Seguros S.A Barcelona EUR 150 100
Sweden Kuehne & Nagel AB Stockholm SEK 500 100
Kuehne & Nagel Investment AB 1 Stockholm EUR 112 100
Nacora International Insurance Brokers AB Stockholm SEK 100 100
Switzerland Kuehne + Nagel AG Opfikon CHF 3,000 100
Nacora Insurance Brokers AG Opfikon CHF 100 100
1 Directly held by Kuehne + Nagel International AG.
112Significant consolidated subsidiaries and joint ventures
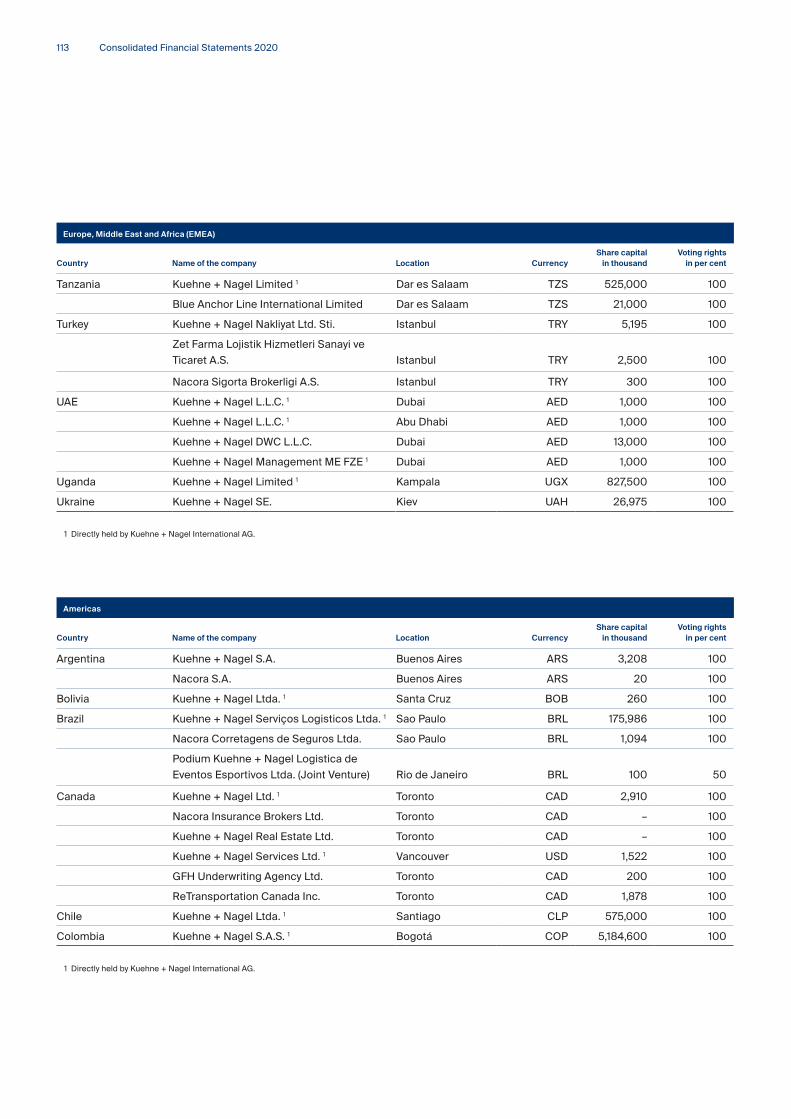
Consolidated Financial Statements 2020
Europe, Middle East and Africa (EMEA)
Country Name of the company Location CurrencyShare capital
in thousandVoting rights
in per cent
Tanzania Kuehne + Nagel Limited 1 Dar es Salaam TZS 525,000 100
Blue Anchor Line International Limited Dar es Salaam TZS 21,000 100
Turkey Kuehne + Nagel Nakliyat Ltd. Sti. Istanbul TRY 5,195 100
Zet Farma Lojistik Hizmetleri Sanayi ve
Ticaret A.S. Istanbul TRY 2,500 100
Nacora Sigorta Brokerligi A.S. Istanbul TRY 300 100
UAE Kuehne + Nagel L.L.C. 1 Dubai AED 1,000 100
Kuehne + Nagel L.L.C. 1 Abu Dhabi AED 1,000 100
Kuehne + Nagel DWC L.L.C. Dubai AED 13,000 100
Kuehne + Nagel Management ME FZE 1 Dubai AED 1,000 100
Uganda Kuehne + Nagel Limited 1 Kampala UGX 827,500 100
Ukraine Kuehne + Nagel SE. Kiev UAH 26,975 100
1 Directly held by Kuehne + Nagel International AG.
Americas
Country Name of the company Location CurrencyShare capital
in thousandVoting rights
in per cent
Argentina Kuehne + Nagel S.A. Buenos Aires ARS 3,208 100
Nacora S.A. Buenos Aires ARS 20 100
Bolivia Kuehne + Nagel Ltda. 1 Santa Cruz BOB 260 100
Brazil Kuehne + Nagel Serviços Logisticos Ltda. 1 Sao Paulo BRL 175,986 100
Nacora Corretagens de Seguros Ltda. Sao Paulo BRL 1,094 100
Podium Kuehne + Nagel Logistica de
Eventos Esportivos Ltda. (Joint Venture)
Rio de Janeiro BRL
100
50
Canada Kuehne + Nagel Ltd. 1 Toronto CAD 2,910 100
Nacora Insurance Brokers Ltd. Toronto CAD – 100
Kuehne + Nagel Real Estate Ltd. Toronto CAD – 100
Kuehne + Nagel Services Ltd. 1 Vancouver USD 1,522 100
GFH Underwriting Agency Ltd. Toronto CAD 200 100
ReTransportation Canada Inc. Toronto CAD 1,878 100
Chile Kuehne + Nagel Ltda. 1 Santiago CLP 575,000 100
Colombia Kuehne + Nagel S.A.S. 1 Bogotá COP 5,184,600 100
1 Directly held by Kuehne + Nagel International AG.
113

Americas
Country Name of the company Location CurrencyShare capital
in thousandVoting rights
in per cent
Agencia de Aduanas
KN Colombia S.A.S. Nivel 2 1
Bogotá COP
595,000
100
Nacora LTDA Agencia de Seguros Bogotá COP 20,000 100
Costa Rica Kuehne + Nagel S.A. 1 San Jose CRC – 100
KN Shared Service Centre S.A. 1 San Jose CRC – 100
Cuba Kuehne Nagel Logistic Services S.A. Havana CUC – 100
Dominican Republic Nakufreight SAS (Joint Venture) Santo Domingo DOP 3,000 50
Ecuador Kuehne + Nagel S. A. 1 Quito USD 7 100
El Salvador Kuehne + Nagel S.A. de C.V. 1 San Salvador USD 69 100
Guatemala Kuehne + Nagel S.A. 1 Guatemala GTQ 4,245 100
Honduras Kuehne + Nagel S.A. 1 San Pedro Sula HNL 25 100
Mexico Kuehne + Nagel S.A. de C.V. 1 Mexico City MXN 24,447 100
Kuehne + Nagel Servicios
Administrativos S.A. de C.V. 1 Mexico City MXN 50 100
Nacora Mexico Agente
de Seguros S.A. de C.V. Mexico City MXN 50 100
Nicaragua Kuehne + Nagel S.A. 1 Managua NIO 13,735 100
Panama Kuehne + Nagel S.A. Colon USD 1 100
Kuehne + Nagel Management S.A. 1 Colon USD 10 100
Peru Kuehne + Nagel S.A. 1 Lima PEN 11,067 100
Trinidad & Tobago Kuehne + Nagel Ltd. Port of Spain TTD 31 100
Uruguay Kuehne + Nagel S.A. 1 Montevideo UYU 3,908 100
USA Kuehne + Nagel Investment Inc. Jersey City USD 1,400 100
Kuehne + Nagel Inc. Jersey City USD 1,861 100
Nacora Insurance Brokers Inc. Jersey City USD 25 100
Kuehne + Nagel Special Logistics Inc. Dulles USD 30 100
Kuehne + Nagel Real Estate USA Inc. Jersey City USD – 100
Kuehne + Nagel Nevada, Inc. McCarran USD 2 100
ReTransportation Inc. Memphis USD 543 100
ReTrans Freight Inc. Fall River USD 23,229 100
Commodity Forwarders Inc. Los Angeles USD 1,220 100
Q International Courier, LLC Jamaica USD – 100
Venezuela Kuehne + Nagel S.A. 1 Caracas VES – 100
KN Venezuela Aduanas C.A. Caracas VES – 100
1 Directly held by Kuehne + Nagel International AG.
114Significant consolidated subsidiaries and joint ventures
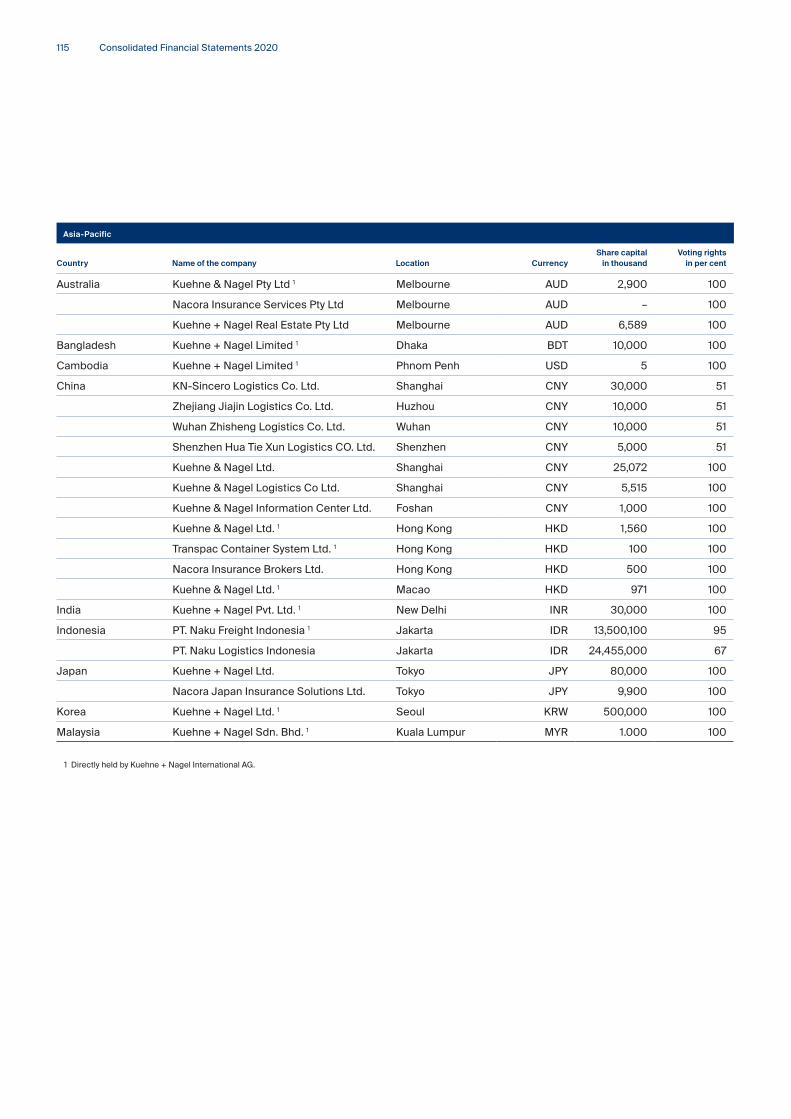
Consolidated Financial Statements 2020
Asia-Pacific
Country Name of the company Location CurrencyShare capital
in thousandVoting rights
in per cent
Australia Kuehne & Nagel Pty Ltd 1 Melbourne AUD 2,900 100
Nacora Insurance Services Pty Ltd Melbourne AUD – 100
Kuehne + Nagel Real Estate Pty Ltd Melbourne AUD 6,589 100
Bangladesh Kuehne + Nagel Limited 1 Dhaka BDT 10,000 100
Cambodia Kuehne + Nagel Limited 1 Phnom Penh USD 5 100
China KN-Sincero Logistics Co. Ltd. Shanghai CNY 30,000 51
Zhejiang Jiajin Logistics Co. Ltd. Huzhou CNY 10,000 51
Wuhan Zhisheng Logistics Co. Ltd. Wuhan CNY 10,000 51
Shenzhen Hua Tie Xun Logistics CO. Ltd. Shenzhen CNY 5,000 51
Kuehne & Nagel Ltd. Shanghai CNY 25,072 100
Kuehne & Nagel Logistics Co Ltd. Shanghai CNY 5,515 100
Kuehne & Nagel Information Center Ltd. Foshan CNY 1,000 100
Kuehne & Nagel Ltd. 1 Hong Kong HKD 1,560 100
Transpac Container System Ltd. 1 Hong Kong HKD 100 100
Nacora Insurance Brokers Ltd. Hong Kong HKD 500 100
Kuehne & Nagel Ltd. 1 Macao HKD 971 100
India Kuehne + Nagel Pvt. Ltd. 1 New Delhi INR 30,000 100
Indonesia PT. Naku Freight Indonesia 1 Jakarta IDR 13,500,100 95
PT. Naku Logistics Indonesia Jakarta IDR 24,455,000 67
Japan Kuehne + Nagel Ltd. Tokyo JPY 80,000 100
Nacora Japan Insurance Solutions Ltd. Tokyo JPY 9,900 100
Korea Kuehne + Nagel Ltd. 1 Seoul KRW 500,000 100
Malaysia Kuehne + Nagel Sdn. Bhd. 1 Kuala Lumpur MYR 1.000 100
1 Directly held by Kuehne + Nagel International AG.
115

Asia-Pacific
Country Name of the company Location CurrencyShare capital
in thousandVoting rights
in per cent
Nacora (Malaysia) Sdn. Bhd. Kuala Lumpur MYR 100 100
Maldives Kuehne + Nagel Private Limited 1 Male USD 1 100
Myanmar Kuehne + Nagel Ltd. 1 Yangon USD 50 100
New Zealand Kuehne + Nagel Limited 1 Auckland NZD 25,200 100
Nacora Insurance Services Limited Auckland NZD 10 100
Pakistan Kuehne + Nagel (Private) Limited. 1 Karachi PKR 9,800 100
Philippines Kuehne + Nagel Inc. 1 Manila PHP 5,000 100
Kuehne + Nagel Logistics
Solutions Inc. 1 Manila PHP 5,000 100
Kuehne + Nagel Shared Service Center Inc. Cebu CNY 10,500 51
Singapore Kuehne + Nagel Pte. Ltd. 1 Singapore SGD 72,250 100
Modern Office Pte. Ltd. Singapore USD 6,401 100
Nacora Insurance Agency Pte. Ltd. Singapore SGD 100 100
Kuehne + Nagel (Asia Pacific)
Management Pte. Ltd. 1 Singapore SGD
5,229 100
Kuehne + Nagel Real Estate Pte Ltd Singapore SGD 72,000 100
Kuehne+Nagel (Asia Pacific)
Holding Pte Ltd 1 Singapore SGD 10,169 100
Sri Lanka Kuehne & Nagel (Pvt) Ltd. 1 Colombo LKR 2,502 100
Taiwan Kuehne + Nagel Ltd. Taipei TWD 20,000 100
Nacora Insurance Brokers Ltd. Taipei TWD 10,000 100
Thailand Kuehne + Nagel Limited 1 Bangkok THB 20,000 100
Vietnam Kuehne + Nagel Company Limited 1 Ho Chi Minh City VND 155,022,000 100
1 Directly held by Kuehne + Nagel International AG.
116Significant consolidated subsidiaries and joint ventures
Consolidated Financial Statements 2020
Opinion
We have audited the consolidated financial statements of Kuehne +
Nagel International AG and its subsidiaries (the Group), which
comprise the balance sheet as at 31 December 2020 and the
income statement, the statement of comprehensive income,
statement of changes in equity and statement of cash flows for the
year then ended, and notes to the consolidated financial state-
ments, including a summary of significant accounting policies.
In our opinion, the consolidated financial statements (pages 41 to
116) give a true and fair view of the consolidated financial position
of the Group as at 31 December 2020, and its consolidated
financial performance and its consolidated cash flows for the year
then ended in accordance with International Financial Reporting
Standards (IFRS) and comply with Swiss law.
Basis for opinion
We conducted our audit in accordance with Swiss law, Internation-
al Standards on Auditing (ISAs) and Swiss Auditing Standards.
Our responsibilities under those provisions and standards are
further described in the Auditor’s Responsibilities for the Audit of
the consolidated financial statements section of our report.
We are independent of the Group in accordance with the provi-
sions of Swiss law and the requirements of the Swiss audit profes-
sion, as well as the International Code of Ethics for Professional
Accountants (including International Independence Standards) of
the International Ethics Standards Board for Accountants (IESBA
Code) and we have fulfilled our other ethical responsibilities in
accordance with these requirements.
We believe that the audit evidence we have obtained is sufficient
and appropriate to provide a basis for our opinion.
Key audit matters
Key audit matters are those matters that, in our professional judg-
ment, were of most significance in our audit of the consolidated
financial statements of the current period. These matters were
addressed in the context of our audit of the consolidated financial
statements as a whole, and in forming our opinion thereon, and
we do not provide a separate opinion on these matters. For each
matter below, our description of how our audit addressed the
matter is provided in that context.
We have fulfilled the responsibilities described in the Auditor’s
responsibilities for the audit of the consolidated financial state-
ments section of our report, including in relation to these matters.
Accordingly, our audit included the performance of procedures
designed to respond to our assessment of the risks of material
misstatement of the consolidated financial statements. The results
of our audit procedures, including the procedures performed to
address the matters below, provide the basis for our audit opinion
on the consolidated financial statements.
Report of the statutory auditor on the Consolidated Financial Statements to the General Meeting of Kuehne + Nagel International AG, Schindellegi(Feusisberg), Switzerland
117

Report of the staturory auditor
Valuation of goodwill
Area of focus Our audit response
As of 31 December 2020, the Group has recorded goodwill of
CHF 1,155 million.
The carrying value of goodwill is tested annually for impairment.
The impairment assessment for goodwill is dependent on the
estimation of, amongst others, future cash flows and the discount
rates applied.
Due to the significance of the carrying values of goodwill and the
judgment involved in performing the impairment tests, this matter
was considered to be significant to our audit.
The accounting policies regarding goodwill applied by the Group
are explained in the notes to the consolidated financial statements
in section 9. Further details on goodwill and the annual impairment
tests are disclosed in note 28 to the consolidated financial state-
ments.
We tested, with the support of our valuation specialists, the
appropriateness of the Group’s valuation model and evaluated
management’s key assumptions, including growth rates used
in the cash flow projections during the forecast period, the
terminal growth rate assumption and the discount rate. Further,
we assessed the historical accuracy of management’s esti-
mates and considered their ability to produce accurate long-
term forecasts. Our work moreover included an evaluation
of management’s sensitivity analysis on changes to the key
assumptions, in order to quantify the downside changes in
assumptions that could result in an impairment.
Our audit procedures did not lead to any reservations concer-
ning the valuation of goodwill and other intangible assets with
indefinite useful lives.
Valuation of Income Tax Positions
Area of focus Our audit response
As of 31 December 2020, the Group has recorded deferred tax
assets of CHF 189 million (net). Further, the Group operates across
a wide range of tax jurisdictions around the world and is therefore
occasionally challenged by local tax authorities, mainly regarding
its cross-border transfer pricing arrangements.
The group records deferred tax assets for temporary differences
and tax loss carry forwards to the extent that it is probable that
future taxable profit will be available against which these deferred
tax assets can be used. Where there is uncertainty over income
tax treatments, the Group recognizes the related tax assets or
liabilities applying management’s best estimate.
Due to the significant judgment involved in forecasting timing
and level of future taxable profits and in accounting for uncertain
tax treatments, this matter was considered to be significant to
our audit.
The accounting policies regarding current and deferred income
taxes applied by the Group are explained in the notes to the
consolidated financial statements in section 17. Further details
on current and deferred income tax positions are disclosed in
note 24 to the consolidated financial statements.
We evaluated, with the support of our taxation specialists, the
model used to recognize deferred tax assets and liabilities and
the tax rates applied. We evaluated management’s forecasts
regarding timing and level of future taxable profits by comparing
these future taxable profits to historical results and assessed
any significant assumptions impacting these profits. Further,
we assessed correspondence with relevant tax authorities,
evaluated the historical accuracy of management’s estimates
and ensured the consistency between management’s estimates
regarding future taxable profits and other available prospective
financial information, such as future cash flow estimates.
Our audit procedures did not lead to any reservations concer-
ning the valuation of income tax positions.
118
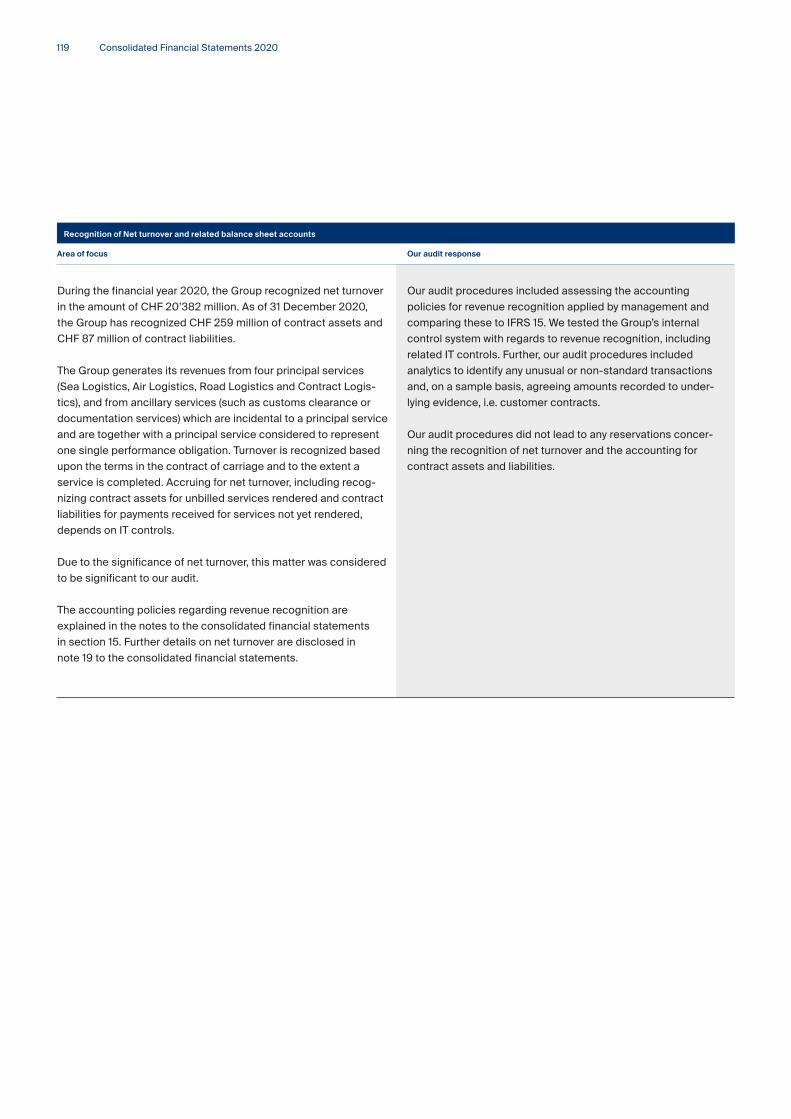
Consolidated Financial Statements 2020
Recognition of Net turnover and related balance sheet accounts
Area of focus Our audit response
During the financial year 2020, the Group recognized net turnover
in the amount of CHF 20’382 million. As of 31 December 2020,
the Group has recognized CHF 259 million of contract assets and
CHF 87 million of contract liabilities.
The Group generates its revenues from four principal services
(Sea Logistics, Air Logistics, Road Logistics and Contract Logis-
tics), and from ancillary services (such as customs clearance or
documentation services) which are incidental to a principal service
and are together with a principal service considered to represent
one single performance obligation. Turnover is recognized based
upon the terms in the contract of carriage and to the extent a
service is completed. Accruing for net turnover, including recog-
nizing contract assets for unbilled services rendered and contract
liabilities for payments received for services not yet rendered,
depends on IT controls.
Due to the significance of net turnover, this matter was considered
to be significant to our audit.
The accounting policies regarding revenue recognition are
explained in the notes to the consolidated financial statements
in section 15. Further details on net turnover are disclosed in
note 19 to the consolidated financial statements.
Our audit procedures included assessing the accounting
policies for revenue recognition applied by management and
comparing these to IFRS 15. We tested the Group’s internal
control system with regards to revenue recognition, including
related IT controls. Further, our audit procedures included
analytics to identify any unusual or non-standard transactions
and, on a sample basis, agreeing amounts recorded to under-
lying evidence, i.e. customer contracts.
Our audit procedures did not lead to any reservations concer-
ning the recognition of net turnover and the accounting for
contract assets and liabilities.
119
Auditor’s responsibilities for the audit
of the consolidated financial statements
Our objectives are to obtain reasonable assurance
about whether the consolidated financial statements as
a whole are free from material misstatement, whether
due to fraud or error, and to issue an auditor’s report that
includes our opinion. Reasonable assurance is a high
level of assurance, but is not a guarantee that an audit
conducted in accordance with Swiss law, ISAs and Swiss
Auditing Standards will always detect a material miss-
tatement when it exists. Misstatements can arise from
fraud or error and are considered material if, individually
or in the aggregate, they could reasonably be expected
to influence the economic decisions of users taken on
the basis of these consolidated financial statements.
A further description of our responsibilities for the audit
of the consolidated financial statements is located at the
website of EXPERTsuisse: http://www.expertsuisse.ch/
en/audit-report-for-public-companies. This description
forms part of our auditor’s report.
Report on other legal and regulatory requirements
In accordance with article 728a para. 1 item 3 CO and
the Swiss Auditing Standard 890, we confirm that an
internal control system exists, which has been designed
for the preparation of consolidated financial statements
according to the instructions of the Board of Directors.
We recommend that the consolidated financial state-
ments submitted to you be approved.
Ernst & Young Ltd
Christian Schibler Andreas Traxler
Licensed audit expert Licensed audit expert
(Auditor in charge)
Zurich, March 2, 2021
Other information in the Annual Report
The Board of Directors is responsible for the other infor-
mation in the Annual Report. The other information com-
prises all information included in the Annual Report, but
does not include the consolidated financial statements,
the stand-alone financial statements, remuneration report
and our auditor’s reports thereon.
Our opinion on the consolidated financial statements
does not cover the other information in the Annual Report
and we do not express any form of assurance conclusion
thereon.
In connection with our audit of the consolidated financial
statements, our responsibility is to read the other informa-
tion in the Annual Report and, in doing so, consider whet-
her the other information is materially inconsistent with
the consolidated financial statements or our knowledge
obtained in the audit, or otherwise appears to be materi-
ally misstated. If, based on the work we have performed,
we conclude that there is a material misstatement of this
other information, we are required to report that fact. We
have nothing to report in this regard.
Responsibility of the Board of Directors
for the consolidated financial statements
The Board of Directors is responsible for the preparation
of the consolidated financial statements that give a true
and fair view in accordance with IFRS and the provisions
of Swiss law, and for such internal control as the Board of
Directors determines is necessary to enable the prepa-
ration of consolidated financial statements that are free
from material misstatement, whether due to fraud or error.
In preparing the consolidated financial statements,
the Board of Directors is responsible for assessing the
Group’s ability to continue as a going concern, disclosing,
as applicable, matters related to going concern and using
the going concern basis of accounting unless the Board
of Directors either intends to liquidate the Group or to
cease operations, or has no realistic alternative but to
do so.
120Report of the staturory auditor

Kuehne + Nagel International AG
Kuehne + Nagel House
P.O. Box 67
CH-8834 Schindellegi
+41 (0) 44 786 95 11
www.kuehne-nagel.com