consolidated financial statements | … · the consolidated financial statements of ci have been...
TRANSCRIPT

CONSOLIDATED FINANCIAL STATEMENTS
31 | DECEMBER | 2015
CI FINANCIAL CORP.

| 2 |
TO THE SHAREHOLDERS OF CI FINANCIAL CORP.
We have audited the accompanying consolidated financial statements of CI Financial Corp. [“CI”], which comprise the consolidated statements of financial position as at December 31, 2015 and 2014, and the consolidated statements of income and comprehensive income, changes in shareholders’ equity and cash flows for the years then ended, and a summary of significant accounting policies and other explanatory information.
Management’s responsibility for the consolidated financial statementsManagement is responsible for the preparation and fair presentation of these consolidated financial statements in accordance with International Financial Reporting Standards, and for such internal control as management determines is necessary to enable the preparation of consolidated financial statements that are free from material misstatement, whether due to fraud or error.
Auditors’ responsibilityOur responsibility is to express an opinion on these consolidated financial statements based on our audits. We conducted our audits in accordance with Canadian generally accepted auditing standards. Those standards require that we comply with ethical requirements and plan and perform the audit to obtain reasonable assurance about whether the consolidated financial statements are free from material misstatement.
An audit involves performing procedures to obtain audit evidence about the amounts and disclosures in the consolidated financial statements. The procedures selected depend on the auditors’ judgment, including the assessment of the risks of material misstatement of the consolidated financial statements, whether due to fraud or error. In making those risk assessments, the auditors consider internal control relevant to the entity’s preparation and fair presentation of the consolidated financial statements in order to design audit procedures that are appropriate in the circumstances, but not for the purpose of expressing an opinion on the effectiveness of the entity’s internal control. An audit also includes evaluating the appropriateness of accounting policies used and the reasonableness of accounting estimates made by management, as well as evaluating the overall presentation of the consolidated financial statements.
We believe that the audit evidence we have obtained in our audits is sufficient and appropriate to provide a basis for our audit opinion.
OpinionIn our opinion, the consolidated financial statements present fairly, in all material respects, the financial position of CI as at December 31, 2015 and 2014, and its financial performance and its cash flows for the years then ended in accordance with International Financial Reporting Standards.
Toronto, CanadaFebruary 10, 2016
| INDEPENDENT AUDITORS’ REPORT |

| 3 |
[in thousands of Canadian dollars]
As at December 31, 2015
$
As at December 31, 2014
$
ASSETS
Current
Cash and cash equivalents 56,598 51,246 Client and trust funds on deposit 158,891 130,665 Marketable securities 78,700 83,718 Accounts receivable and prepaid expenses 122,459 98,881 Total current assets 416,648 364,510 Capital assets, net [note 3] 33,166 37,952 Deferred sales commissions, net of accumulated amortization of $428,274 [December 31, 2014 – $469,645] 351,414 401,321 Intangibles [note 4] 2,295,985 2,189,091 Other assets [notes 5 and 7] 200,154 23,093 Total assets 3,297,367 3,015,967 LIABILITIES AND EQUITY
Current
Accounts payable and accrued liabilities 168,257 172,674 Provision for other liabilities [note 7] 23,043 1,293 Dividends payable [note 9] 60,728 59,161 Client and trust funds payable 156,164 128,715 Income taxes payable [note 10] 14,188 38,940 Current portion of long-term debt [note 6] 2,000 2,000 Total current liabilities 424,380 402,783 Deferred lease inducement 12,907 14,238 Long-term debt [note 6] 557,347 305,392 Provision for other liabilities [note 7] 29,554 19,251 Deferred income taxes [note 10] 376,214 367,865 Total liabilities 1,400,402 1,109,529 Equity
Share capital [note 8(a)] 1,960,622 1,968,692 Contributed surplus 13,615 10,386 Deficit (86,827) (84,692)Accumulated other comprehensive income 6,690 8,311 Total equity attributable to the shareholders of the Company 1,894,100 1,902,697 Non-controlling interests 2,865 3,741 Total equity 1,896,965 1,906,438 Total liabilities and equity 3,297,367 3,015,967 (see accompanying notes)
On behalf of the Board of Directors:William T. Holland
Director
Paul Derksen
Director
| CONSOLIDATED STATEMENTS OF FINANCIAL POSITION |

| 4 |
[in thousands of Canadian dollars, except per share amounts]
2015
$
2014
$
REVENUE
Management fees 1,787,854 1,669,125 Administration fees 146,648 141,346 Redemption fees 19,011 20,361 Gain on sale of marketable securities 5,869 379 Other income [note 5] 38,265 44,706
1,997,647 1,875,917
EXPENSES
Selling, general and administrative [note 17] 372,456 341,751 Trailer fees 553,622 511,610 Investment dealer fees 119,638 113,198 Amortization of deferred sales commissions 141,033 151,969 Amortization of intangibles [note 4] 7,350 4,571 Interest [note 6] 14,078 18,056 Other [note 5] 31,904 16,870
1,240,081 1,158,025 Income before income taxes 757,566 717,892
Provision for income taxes [note 10]
Current 219,487 204,769 Deferred (14,539) (12,234)
204,948 192,535 Net income for the year 552,618 525,357 Net income (loss) attributable to non-controlling interests (876) 313 Net income attributable to shareholders 553,494 525,044
Other comprehensive income (loss), net of tax
Unrealized gain on available-for-sale financial assets, net of income taxes of $221 [2014 – $298] 1,448 1,956 Reversal of gains to net income on available-for-sale financial assets, net of income taxes of ($468) [2014 – ($50)] (3,069) (329)Total other comprehensive income (loss), net of tax (1,621) 1,627 Comprehensive income for the year 550,997 526,984 Comprehensive income (loss) attributable to non-controlling interests (876) 313 Comprehensive income attributable to shareholders 551,873 526,671 Basic earnings per share attributable to shareholders [note 8(c)] $1.99 $1.85 Diluted earnings per share attributable to shareholders [note 8(c)] $1.98 $1.84 (see accompanying notes)
| CONSOLIDATED STATEMENTS OF INCOME AND COMPREHENSIVE INCOME |
For the years ended December 31

| 5 |
[in thousands of Canadian dollars]
Share capital
[note 8(a)]
$
Contributed
surplus
$
Deficit
$
Accumulated
other
comprehensive
income
$
Total
shareholders’
equity
$
Non-
controlling
interests
$
Total
equity
$
Balance, January 1, 2015 1,968,692 10,386 (84,692) 8,311 1,902,697 3,741 1,906,438
Comprehensive income — — 553,494 (1,621) 551,873 (876) 550,997
Dividends declared [note 9] — — (363,751) — (363,751) — (363,751)
Shares repurchased (51,708) — (191,878) — (243,586) — (243,586)
Business combination [note 2] 40,576 — — — 40,576 — 40,576
Issuance of share capital on exercise of options 3,062 (2,992) — — 70 — 70
Compensation expense for equity-based plans — 6,221 — — 6,221 — 6,221
Change during the year (8,070) 3,229 (2,135) (1,621) (8,597) (876) (9,473)
Balance, December 31, 2015 1,960,622 13,615 (86,827) 6,690 1,894,100 2,865 1,896,965
Balance, January 1, 2014 1,987,642 8,350 (183,349) 6,684 1,819,327 4,295 1,823,622 Comprehensive income — — 525,044 1,627 526,671 313 526,984 Dividends declared [note 9] — — (340,528) — (340,528) (867) (341,395)Shares repurchased (22,229) — (85,859) — (108,088) — (108,088)Issuance of share capital on exercise of options 3,279 (3,170) — — 109 — 109 Compensation expense for equity-based plans — 5,206 — — 5,206 — 5,206 Change during the year (18,950) 2,036 98,657 1,627 83,370 (554) 82,816 Balance, December 31, 2014 1,968,692 10,386 (84,692) 8,311 1,902,697 3,741 1,906,438(see accompanying notes)
| CONSOLIDATED STATEMENTS OF CHANGES IN SHAREHOLDERS’ EQUITY |
For the years ended December 31
| 6 |
[in thousands of Canadian dollars]
2015
$
2014
$
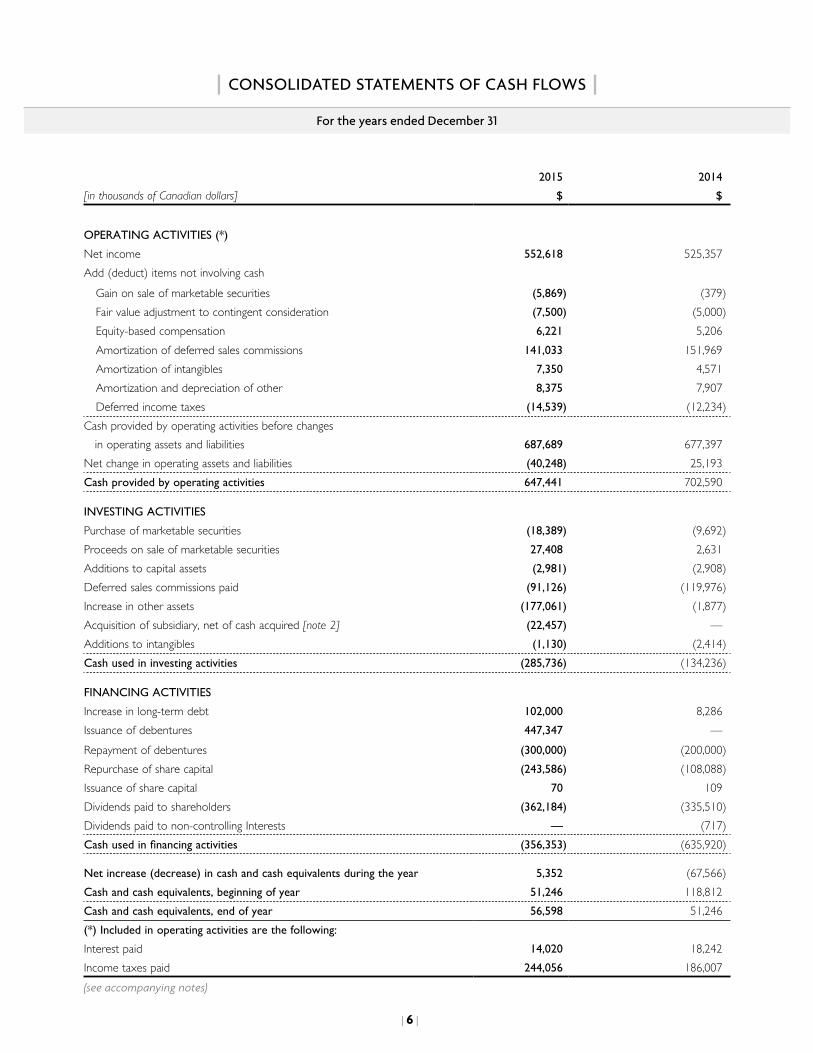
OPERATING ACTIVITIES (*)
Net income 552,618 525,357 Add (deduct) items not involving cash
Gain on sale of marketable securities (5,869) (379)Fair value adjustment to contingent consideration (7,500) (5,000)Equity-based compensation 6,221 5,206 Amortization of deferred sales commissions 141,033 151,969 Amortization of intangibles 7,350 4,571 Amortization and depreciation of other 8,375 7,907 Deferred income taxes (14,539) (12,234)
Cash provided by operating activities before changes in operating assets and liabilities 687,689 677,397 Net change in operating assets and liabilities (40,248) 25,193Cash provided by operating activities 647,441 702,590
INVESTING ACTIVITIES
Purchase of marketable securities (18,389) (9,692)Proceeds on sale of marketable securities 27,408 2,631 Additions to capital assets (2,981) (2,908)Deferred sales commissions paid (91,126) (119,976)Increase in other assets (177,061) (1,877)Acquisition of subsidiary, net of cash acquired [note 2] (22,457) — Additions to intangibles (1,130) (2,414)Cash used in investing activities (285,736) (134,236)
FINANCING ACTIVITIES
Increase in long-term debt 102,000 8,286 Issuance of debentures 447,347 —Repayment of debentures (300,000) (200,000)Repurchase of share capital (243,586) (108,088)Issuance of share capital 70 109 Dividends paid to shareholders (362,184) (335,510)Dividends paid to non-controlling Interests — (717)Cash used in financing activities (356,353) (635,920)
Net increase (decrease) in cash and cash equivalents during the year 5,352 (67,566)Cash and cash equivalents, beginning of year 51,246 118,812 Cash and cash equivalents, end of year 56,598 51,246 (*) Included in operating activities are the following:
Interest paid 14,020 18,242 Income taxes paid 244,056 186,007 (see accompanying notes)
For the years ended December 31
| CONSOLIDATED STATEMENTS OF CASH FLOWS |

DECEMBER 31, 2015 and 2014 [in thousands of dollars, except per share amounts]
| 7 |
| NOTES TO CONSOLIDATED FINANCIAL STATEMENTS |
CI Financial Corp. [“CI”] is incorporated under the laws of the Province of Ontario. CI’s primary business is the management and distribution of a broad range of financial products and services, including mutual funds, segregated funds, exchange traded funds, financial planning, insurance, investment advice, wealth management and estate and succession planning.
1. SUMMARY OF SIGNIFICANT ACCOUNTING POLICIES
These consolidated financial statements of CI have been prepared in accordance with International Financial Reporting Standards [“IFRS”] as issued by the International Accounting Standards Board [“IASB”].
These consolidated financial statements were authorized for issuance by the Board of Directors of CI on February 10, 2016.
BASIS OF PRESENTATION
The consolidated financial statements of CI have been prepared on a historical cost basis, except for certain financial instruments that have been measured at fair value. The consolidated financial statements have been prepared on a going concern basis. CI’s presentation currency is the Canadian dollar. The functional currency of CI and its subsidiaries is also the Canadian dollar.
BASIS OF CONSOLIDATION
The consolidated financial statements include the accounts of CI, CI Investments Inc. [“CI Investments”] and Assante Wealth Management (Canada) Ltd. [“AWM”] and their subsidiaries, which are entities over which CI has control. Control exists when CI has the power, directly or indirectly, to govern the financial and operating policies of an entity, is exposed to variable returns from its activities, and is able to use its power to affect such variable returns to which it is exposed. Hereinafter, CI and its subsidiaries are referred to as CI.
CI holds a controlling 65% interest in Marret Asset Management Inc. [“Marret”]. A non-controlling interest is recorded in the consolidated statement of income and comprehensive income to reflect the non-controlling interest’s share of the net income and comprehensive income, and a non-controlling interest is recorded within equity in the consolidated statement of financial position to reflect the non-controlling interest’s share of the net assets of Marret.
CI manages a range of mutual funds, segregated funds, structured products and other funds that meet the definition of structured entities under IFRS. CI earns fees for providing management and administrative services to these investment funds. Fees are calculated on assets under management in these funds which totalled $111.1 billion as at December 31, 2015 [2014 – $102.9 billion]. CI does not consolidate these investment funds because the form of fees and ownership interest are not significant enough to meet the definition of control under IFRS. CI provides no guarantees against the risk of financial loss to the investors of these investment funds.

DECEMBER 31, 2015 and 2014 [in thousands of dollars, except per share amounts]
| 8 |
| NOTES TO CONSOLIDATED FINANCIAL STATEMENTS |
REVENUE RECOGNITION
Revenue is recognized to the extent that it is probable that economic benefits will flow to CI and the revenue can be reliably measured. Revenue is measured at the fair value of the consideration received or receivable. In addition to these general principles, CI applies the following specific revenue recognition policies:
Management fees are based upon the net asset value of the funds managed by CI and are recognized on an accrual basis.
Administration fees and other income are recognized as services are provided under contractual arrangements. Administration fees include commission revenue, which is recorded on a trade date basis and advisory fees, which are recorded when the services related to the underlying engagements are completed.
Redemption fees payable by securityholders of deferred sales charge mutual funds, the sales commission of which was financed by CI, are recognized as revenue on the trade date of the redemption of the applicable mutual fund securities.
FINANCIAL INSTRUMENTS
Financial assets are classified at fair value through profit or loss [“FVPL”], available-for-sale [“AFS”] or loans and receivables. Financial liabilities are classified as FVPL or other.
Financial instruments are recognized initially at fair value. Transaction costs that are directly attributable to the acquisition or issue of a financial instrument classified as other than at FVPL are added to the carrying amount of the asset or liability. Financial instruments classified as FVPL are carried at fair value in the statement of financial position and any gains or losses are recorded in net income in the period in which they arise. Financial instruments classified as FVPL include cash and cash equivalents as well as contingent consideration included in provision for other liabilities.
Financial assets classified as AFS are carried at fair value in the statement of financial position. Movements in the fair value are recorded in other comprehensive income until disposed, at which time the cumulative amount recorded in comprehensive income is recognized in net income. Where there is objective evidence that an AFS asset is impaired, the cumulative impairment loss is reclassified from other comprehensive income to net income with subsequent movements also recognized in net income. Financial assets classified as AFS include marketable securities.
Loans and receivables and other financial liabilities are recognized at amortized cost using the effective interest rate method. Such accounts include client and trust funds on deposits, accounts receivable, accounts payable and accrued liabilities, dividends payable, client and trust funds payable, provision for other liabilities and long-term debt.
Cash and cash equivalents
Cash and cash equivalents include cash on deposit, highly liquid investments and interest bearing deposits with original maturities of 90 days or less.
DECEMBER 31, 2015 and 2014 [in thousands of dollars, except per share amounts]
| 9 |
| NOTES TO CONSOLIDATED FINANCIAL STATEMENTS |
Client and trust funds
Client and trust funds on deposit include amounts representing cash held in trust with Canadian financial institutions for clients in respect of self-administered Registered Retirement Savings Plans and Registered Retirement Income Funds, and amounts received from clients for which the settlement date on the purchase of securities has not occurred or accounts in which the clients maintain a cash balance. Client and trust funds on deposit also include amounts for client transactions that are entered into on either a cash or margin basis and recorded on the trade date of the transaction. Amounts are due from clients on the settlement date of the transaction for cash accounts. For margin accounts, CI extends credit to a client for the purchase of securities, collateralized by the financial instruments in the client’s account. Amounts loaned are limited by margin regulations of the Investment Industry Regulatory Organization of Canada [“IIROC”] and other regulatory authorities, and are subject to CI’s credit review and daily monitoring procedures. The corresponding liabilities related to the above accounts and transactions are included in client and trust funds payable.
Marketable securities
Marketable securities consist of investments in mutual fund securities. Marketable securities are measured at fair value and recognized on trade date. Mutual fund securities are valued using the net asset value per unit of each fund. Realized and unrealized gains and losses are recognized using average cost. Except for impairment losses, gains and losses in the fair value of marketable securities are recorded as other comprehensive income until disposed of, at which time any gain or loss is recorded in net income. When a decline in fair value is other than temporary and there is objective evidence of impairment, the cumulative loss that had been recognized directly in other comprehensive income is removed and recognized in net income, even though the financial asset has not been derecognized. Distributions from mutual fund securities are recorded as other income. Distributions that are reinvested increase the cost base of the marketable securities.
FAIR VALUE MEASUREMENT
CI uses valuation techniques to determine the fair value of financial instruments where active market quotes are not available. This involves developing estimates and assumptions consistent with how market participants would price the instrument. CI bases its assumptions on observable data as far as possible but this is not always available. In that case management uses the best information available.
All assets and liabilities for which fair value is measured or disclosed in the financial statements are categorized within the fair value hierarchy, described as follows, based on the lowest level input that is significant to the fair value measurement as a whole:
• Level 1 – valuation based on quoted prices (unadjusted) observed in active markets for identical assets or liabilities.
• Level 2 – valuation techniques based on inputs that are quoted prices of similar instruments in active markets; quoted prices for identical or similar instruments in markets that are not active; inputs other than quoted prices used in a valuation model that are observable for that instrument; and inputs that are derived from or corroborated by observable market data by correlation or other means.
• Level 3 – valuation techniques with significant unobservable market inputs.
For assets and liabilities that are recognized in the financial statements on a recurring basis, CI determines whether transfers have occurred between levels in the hierarchy by re-assessing categorization at the end of each reporting period.

DECEMBER 31, 2015 and 2014 [in thousands of dollars, except per share amounts]
| 10 |
| NOTES TO CONSOLIDATED FINANCIAL STATEMENTS |
CAPITAL ASSETS
Capital assets are recorded at cost less accumulated amortization. These assets are amortized over their estimated useful lives as follows:
Computer hardware Straight-line over three yearsOffice equipment Straight-line over five yearsLeasehold improvements Straight-line over the term of the lease
BUSINESS COMBINATIONS
The acquisition method of accounting is used to account for the acquisition of subsidiaries by CI, whereby the purchase consideration is allocated to the identifiable assets and liabilities on the basis of fair value at the date of acquisition. Provisional fair values allocated at a reporting date are finalized as soon as the relevant information is available, within a period not to exceed twelve months from the acquisition date, with retroactive restatement of the impact of adjustments to those provisional fair values effective as at the acquisition date.
CI elects on a transaction-by-transaction basis whether to measure any non-controlling interest at fair value, or at the proportionate share of the recognized amount of the identifiable net assets of the acquired subsidiary, at the acquisition date.
Consideration transferred includes the fair values of the assets transferred, liabilities incurred and equity interests issued by CI. Consideration also includes the fair value of any contingent consideration. Subsequent to the acquisition, contingent consideration that is based on an earnings target and classified as a liability is measured at fair value with any resulting gain or loss recognized in net income. Acquisition-related costs are expensed as incurred.
INTANGIBLES
Fund contracts
Fund administration contracts and fund management contracts [collectively, “fund contracts”] are recorded net of any write-down for impairment. CI evaluates the carrying amounts of fund contracts for potential impairment by comparing the recoverable amount with their carrying amounts. These evaluations are performed on an annual basis or more frequently if events or changes in circumstances indicate a potential impairment. Any impairment would be written off to income.
Fund administration contracts are amortized on a straight-line basis over 25 years. Fund management contracts with a finite life are amortized on a straight-line basis over a period of up to 20 years, depending on the contractual terms of such agreements and management’s best estimate of their useful lives. Fund management contracts with an indefinite life are not amortized.

DECEMBER 31, 2015 and 2014 [in thousands of dollars, except per share amounts]
| 11 |
| NOTES TO CONSOLIDATED FINANCIAL STATEMENTS |
Goodwill
Goodwill is recorded as the excess of purchase price over identifiable assets acquired. Following initial recognition, goodwill is stated at cost less any accumulated impairment losses. Goodwill is evaluated for impairment at least annually and any impairment is recognized immediately in income and not subsequently reversed. Goodwill is allocated to the appropriate cash-generating unit for the purpose of impairment testing.
Other intangibles
Other intangibles include the costs of trademarks and computer software, capitalized where it is probable that future economic benefits that are attributable to the assets will flow to CI and the cost of the assets can be measured reliably. Computer software is recorded initially at cost and amortized over its expected useful life of two to ten years on a straight-line basis. Trademarks have an indefinite life and are not amortized.
Deferred sales commissions
Commissions paid on sales of deferred sales charge mutual funds represent commissions paid by CI to brokers and dealers, and are recorded on the trade date of the sale of the applicable mutual fund product. Deferred sales commissions are amortized over the expected investment period of 24 to 84 months on a straight-line basis from the date recorded. When redemptions occur, the actual investment period is shorter than expected, and the unamortized deferred sales commission related to the original investment in the mutual funds is charged to net income and included in the amortization of deferred sales commissions.
EQUITY-BASED COMPENSATION
CI uses the fair value method to account for equity-settled employee incentive share options. The value of the equity-based compensation, as at the date of grant, is recognized over the applicable vesting period as compensation expense with a corresponding increase in contributed surplus. When options are exercised, the proceeds received, together with the amount in contributed surplus, are credited to share capital.
The amount recognized as an expense is adjusted to reflect the number of awards for which the related service conditions are expected to be met, such that the amount ultimately recognized as an expense is based on the number of awards that do meet the related service condition at the vesting date.
DEFERRED LEASE INDUCEMENTS
Lease inducements are deferred and amortized on a straight-line basis over the term of the lease.

DECEMBER 31, 2015 and 2014 [in thousands of dollars, except per share amounts]
| 12 |
| NOTES TO CONSOLIDATED FINANCIAL STATEMENTS |
INCOME TAXES
Current income tax liabilities are measured at the amount expected to be paid to tax authorities, net of recoveries based on the tax rates and laws enacted or substantively enacted at the statement of financial position date.
The liability method of tax allocation is used in accounting for income taxes. Under this method, deferred income tax assets and liabilities are determined based on differences between the carrying amount and tax basis of assets and liabilities and measured using the substantively enacted tax rates and laws that will be in effect when the differences are expected to reverse. Deferred tax assets are recognized to the extent that it is probable that taxable profits will be available against which deductible temporary differences can be utilized. Deferred tax liabilities are generally recognized for all taxable temporary differences.
Deferred tax liabilities are recognized for taxable temporary differences arising in investments in subsidiaries and joint ventures except where the reversal of the temporary difference can be controlled and it is probable that the difference will not reverse in the foreseeable future. Deferred tax liabilities are not recognized on temporary differences that arise from the initial recognition of goodwill which is not deductible for tax purposes. Deferred tax assets and liabilities are not recognized in respect of temporary differences that arise on initial recognition of assets and liabilities acquired other than in a business combination.
PROVISION FOR OTHER LIABILITIES
A provision for other liabilities is recognized if, as a result of a past event, CI has a present legal or constructive obligation that can be estimated reliably, and it is probable that an outflow of economic benefits will be required to settle the obligation. In the event that the time value of money is material, provisions are determined by discounting the expected future cash flows at a pre-tax rate that reflects a current market assessment of the time value of money and the risks specific to the liability.
FOREIGN CURRENCY TRANSLATION
Monetary assets and liabilities are translated into Canadian dollars using the exchange rates in effect at the statement of financial position date. Non-monetary assets and liabilities are translated into Canadian dollars using historical exchange rates. Revenue and expenses are translated at average rates prevailing during the month. Other foreign currency transactions are translated into Canadian dollars using the exchange rate in effect on the transaction date. Translation exchange gains and losses are included in other income in the month in which they occur.

DECEMBER 31, 2015 and 2014 [in thousands of dollars, except per share amounts]
| 13 |
| NOTES TO CONSOLIDATED FINANCIAL STATEMENTS |
CRITICAL ACCOUNTING ESTIMATES AND JUDGMENTS
In the process of applying CI’s accounting policies, management has made significant judgments involving estimates and assumptions which are summarized as follows:
(i) Impairment of intangible assets
Finite life intangible assets, including deferred sales commissions, are reviewed for impairment whenever events or changes in circumstances indicate that the carrying amount may not be recoverable. Indefinite life intangible assets, including goodwill, are tested for impairment annually or more frequently if changes in circumstances indicate that the carrying amount may be impaired. The values associated with intangibles involve estimates and assumptions, including those with respect to future cash inflows and outflows, discount rates and asset lives. These estimates require significant judgment regarding market growth rates, fund flow assumptions, expected margins and costs which could affect CI’s future results if the current estimates of future performance and fair values change. These determinations also affect the amount of amortization expense on intangible assets with finite lives recognized in future periods.
(ii) Deferred tax assets
Deferred tax assets are recognized for unused tax losses to the extent that it is probable that taxable profits will be available against which the losses can be utilized. Significant management judgment is required to determine the amount of deferred tax assets that can be recognized, based upon the likely timing and level of future taxable profits together with future tax planning strategies.
(iii) Provision for other liabilities
Due to the nature of provisions, a considerable part of their determination is based on estimates and judgments, including assumptions concerning the future. The actual outcome of these uncertain factors may be materially different from the estimates, causing differences with the estimated provisions. Further details are provided in Note 7.
(iv) Share-based payments
The cost of employee services received (compensation expense) in exchange for awards of equity instruments recognized is estimated using a Black-Scholes option valuation model which requires the use of assumptions. Further details regarding the assumptions used in the option pricing model are provided in Note 8 [b].
(v) Business combinations
Business combinations require management to exercise judgement in measuring the fair value of the assets acquired and liabilities and contingent liabilities incurred or assumed.

DECEMBER 31, 2015 and 2014 [in thousands of dollars, except per share amounts]
| 14 |
| NOTES TO CONSOLIDATED FINANCIAL STATEMENTS |
2. BUSINESS ACQUISITION
On November 30, 2015, CI acquired 100% of First Asset Capital Corp. [“First Asset”] and its subsidiaries, an investment management company, for cash consideration of $26,924, equity consideration of $40,576 and contingent consideration payable in cash or common shares with an estimated fair value of $20,000. CI accounted for the acquisition using the acquisition method of accounting and the results of operations have been consolidated from the date of the transaction.
Details of the net assets acquired as at November 30, 2015, at fair value, are as follows:
$
Cash and cash equivalents 4,467Accounts receivable and prepaid expenses 593Management contracts 87,300Accounts payable and accrued liabilities (5,539)Long-term debt (2,000)Deferred tax liability (23,135)Fair value of identifiable net assets 61,686
Goodwill on acquisition 25,814Total acquired cost 87,500
The acquired fund management contracts with a fair value of $87,300 have an indefinite life. The goodwill on acquisition is not deductible for income tax purposes. Goodwill of $25,814 relates to the Asset Management segment.
Details of consideration as at the date of acquisition is as follows:
$
Cash 26,924Common shares issued, at fair value 40,576Contingent consideration liability, at fair value 20,000Total consideration 87,500
CI issued 1,301 common shares valued at $31.20 per common share as consideration for First Asset.

DECEMBER 31, 2015 and 2014 [in thousands of dollars, except per share amounts]
| 15 |
| NOTES TO CONSOLIDATED FINANCIAL STATEMENTS |
The acquisition agreement provided for contingent consideration payable in cash or common shares of CI, five years from the date of acquisition, if certain financial targets are met based on earnings before interest, tax, depreciation and amortization [“EBITDA”]. While it is not possible to determine the exact amount of contingent consideration, the potential undiscounted amount of all future payments that CI could be required to make under the agreement is unlimited. CI has estimated the fair value of the contingent consideration to be $20,000 as at December 31, 2015 which was estimated using a discounted cash flow approach. The fair value measurement is based on significant inputs that are not observable in the market, which IFRS 13 Fair Value Measurement refers to as Level 3 inputs.
Cash inflow on acquisition is as follows:
$
Net cash acquired (included in cash flows from investing activities) 4,467Transaction costs (included in cash flows from operating activities) (83)Net cash inflow on acquisition 4,384

DECEMBER 31, 2015 and 2014 [in thousands of dollars, except per share amounts]
| 16 |
| NOTES TO CONSOLIDATED FINANCIAL STATEMENTS |
3. CAPITAL ASSETS
Capital assets consist of the following:
Computer hardware
$
Office equipment
$
Leasehold improvements
$Total
$
Cost
Balance, December 31, 2013 11,567 10,525 59,343 81,435
Additions 1,517 636 755 2,908Retired (1,919) (44) (1,219) (3,182)Balance, December 31, 2014 11,165 11,117 58,879 81,161
Additions 1,687 610 684 2,981Retired (1,869) — (324) (2,193)Balance, December 31, 2015 10,983 11,727 59,239 81,949
Accumulated depreciation
Balance, December 31, 2013 9,266 7,507 21,945 38,718
Depreciation 1,368 1,299 5,006 7,673Retired (1,919) (44) (1,219) (3,182)Balance, December 31, 2014 8,715 8,762 25,732 43,209
Depreciation 1,631 1,336 4,800 7,767Retired (1,869) — (324) (2,193)Balance, December 31, 2015 8,477 10,098 30,208 48,783
Carrying amounts
At December 31, 2013 2,301 3,018 37,398 42,717
At December 31, 2014 2,450 2,355 33,147 37,952
At December 31, 2015 2,506 1,629 29,031 33,166

DECEMBER 31, 2015 and 2014 [in thousands of dollars, except per share amounts]
| 17 |
| NOTES TO CONSOLIDATED FINANCIAL STATEMENTS |
4. INTANGIBLES
Intangible assets consist of the following:
Goodwill $
Fund administration
contracts $
Fund management
contracts finite life
$
Fund management
contracts indefinite life
$
Other intangibles
$Total
$
Cost
Balance, December 31, 2013 1,137,308 37,600 43,010 999,082 24,368 2,241,368
Additions — — — — 2,414 2,414Balance, December 31, 2014 1,137,308 37,600 43,010 999,082 26,782 2,243,782
Additions 25,814 — — 87,300 1,130 114,244Retired — — — — (85) (85)Balance, December 31, 2015 1,163,122 37,600 43,010 1,086,382 27,827 2,357,941
Accumulated amortization
Balance, December 31, 2013 — 15,064 17,358 — 17,698 50,120
Amortization — 1,504 2,055 — 1,012 4,571Balance, December 31, 2014 — 16,568 19,413 — 18,710 54,691
Amortization — 1,504 4,758 — 1,088 7,350Retired — — — — (85) (85)Balance, December 31, 2015 — 18,072 24,171 — 19,713 61,956
Carrying amounts
At December 31, 2013 1,137,308 22,536 25,652 999,082 6,670 2,191,248
At December 31, 2014 1,137,308 21,032 23,597 999,082 8,072 2,189,091
At December 31, 2015 1,163,122 19,528 18,839 1,086,382 8,114 2,295,985
Remaining term N/A 12.9 – 13.4 yrs 11.2 – 17.9 yrs N/A 0.1 – 8.9 yrs
(a) Cash-generating units
CI has two cash-generating units [“CGU”] for the purpose of assessing the carrying amount of the allocated goodwill and intangible assets, being the asset management and asset administration operating segments as described in Note 15.

DECEMBER 31, 2015 and 2014 [in thousands of dollars, except per share amounts]
| 18 |
| NOTES TO CONSOLIDATED FINANCIAL STATEMENTS |
(b) Impairment testing of goodwill
As at December 31, 2015, CI has allocated goodwill of $970,540 [2014 – $944,726] to the asset management segment and $192,582 [2014 – $192,582] to the asset administration operating segment. The recoverable amounts of goodwill for the asset management and asset administration operating segments as at December 31, 2015 and 2014 have been determined based on a fair value less costs to sell calculation. For the asset management segment, CI uses two approaches to determine the goodwill valuation. The first methodology compares CI’s market capitalization against the carrying amount of goodwill for the segment. Market capitalization is based on the share price of CI, a level 1 fair value input. The second methodology, applies a trading multiple, a level 3 fair value input, to CI’s assets under management. This methodology is also used to determine the fair value of the asset administration segment however a trading multiple is applied to CI’s assets under administration. This methodology is commonly used in the marketplace by independent equity research analysts.
The calculation of the recoverable amounts exceeds the carrying amounts of both the asset management and the asset administration operating segments, including goodwill. CI’s current market capitalization provides additional evidence that the recoverable amount of these operating segments is in excess of the carrying amounts.
(c) Impairment testing of fund contracts
As at December 31, 2015, CI had indefinite life fund management contracts within the asset management CGU of $1,086,382 [2014 – $999,082]. These are contracts for the management of open end funds, which have no expiry or termination provisions. The fair value of indefinite life intangibles within the asset management operating segment as at December 31, 2015 and 2014 has been determined based on a value in use calculation, using 10 year forecasts and a terminal value for the period thereafter. CI uses a 10 year period to reflect the fact that following an acquisition, it may take several years to integrate operations and benefit from synergies. The key assumptions used in the forecast calculation include assumptions on market appreciation, net sales of funds and operating margins. Market appreciation rates are determined using historical inflation adjusted index returns adjusted for CI’s average management fee. Net sales are determined based on the historical two year average as well as management’s forecasts for future sales. Inputs to the operating margin include estimates for management and trailer fees using current average fee rates and historical rates for selling, general and administrative costs that are applied to forecasted average assets under management over the 10 year period. The terminal value has been calculated assuming a long-term growth rate of 2% per annum in perpetuity based on a long-term real GDP growth rate as at December 31, 2015 and 2014. A discount rate of 8.11% per annum has been applied to the recoverable calculation as at December 31, 2015 [2014 – 7.25%].
The calculation of the recoverable amount exceeds the carrying amount of indefinite life management contracts as at December 31, 2015 and 2014.

DECEMBER 31, 2015 and 2014 [in thousands of dollars, except per share amounts]
| 19 |
| NOTES TO CONSOLIDATED FINANCIAL STATEMENTS |
5. OTHER ASSETS, INCOME AND EXPENSE
Other assets consists mainly of deposits with the Canada Revenue Agency (“CRA”) discussed in Note 7, long-term investments, long-term accounts receivable, loans granted under CI’s employee share purchase plan and loans extended to investment advisors under CI’s hiring and incentive program.
CI has an employee share purchase loan program for key employees. These loans are renewable yearly and bear interest at prescribed rates. As at December 31, 2015, the carrying amount of employee share purchase loans is $5,777 [2014 – $6,722] and is included in other assets. These loans become due immediately upon termination of employment or sale of the shares that are held as collateral. As at December 31, 2015, the shares held as collateral have a market value of approximately $12,341 [2014 – $13,869].
CI has a hiring and retention incentive program whereby loans are extended to current investment advisors. These loans are initially recorded at their fair value, may bear interest at prescribed rates and are contractually forgiven on a straight-line basis over the applicable contractual period, which varies in length from three to seven years. CI utilizes the effective interest rate method to amortize the forgiven amount. The forgiven amount is included in selling, general and administrative expenses. As at December 31, 2015, loans to investment advisors of $6,999 [2014 – $5,058] are included in other assets. These loans become due on demand upon termination or breach in the terms of the agreements.
Other income consists mainly of fees received for the administration of third-party mutual funds, custody fees, investment income, foreign exchange gains (losses), interest income and the revenue earned by Marret. Other income also includes the fair value adjustment to the contingent consideration discussed in Note 7. Other expenses consist mainly of distribution fees to limited partnerships, legal settlements, amortization of debenture transaction costs and the expenses incurred by Marret. In 2015, other expenses also includes an accrual for remediation payments discussed in Note 7.

DECEMBER 31, 2015 and 2014 [in thousands of dollars, except per share amounts]
| 20 |
| NOTES TO CONSOLIDATED FINANCIAL STATEMENTS |
6. LONG-TERM DEBT
Long-term debt consists of the following:
As at
December 31, 2015
$
As at
December 31, 2014
$
Credit facility
Prime rate loan 2,000 —Banker’s acceptances 110,000 8,000
112,000 8,000
Debentures
$450 million, 2.645% due December 7, 2020 447,347 —$300 million, 3.940% until December 13, 2015 and floating rate until December 14, 2016 — 299,392
447,347 299,392Long-term debt 559,347 307,392Current portion of long-term debt 2,000 2,000
Credit facility
Effective December 11, 2015, CI renewed its revolving credit facility with two chartered banks. Amounts may be borrowed under the facility in Canadian dollars through prime rate loans, which bear interest at the greater of the bank’s prime rate and the Canadian Deposit Offering Rate plus 1.00%, or bankers’ acceptances, which bear interest at bankers’ acceptance rates plus 0.90%. Amounts may also be borrowed in U.S. dollars through base rate loans, which bear interest at the greater of the bank’s reference rate for loans made by it in Canada in U.S. funds and the federal funds effective rate plus 1.00%, or LIBOR loans which bear interest at LIBOR plus 0.90%.
CI may also borrow under this facility in the form of letters of credit, which bear a fee of 0.90% on any undrawn portion. As at December 31, 2015 and 2014, CI had not accessed the facility by way of letters of credit.
Loans are made by the banks under a three-year revolving credit facility, with the outstanding principal balance due upon maturity on December 11, 2018.
The credit facility contains a number of financial covenants that require CI to meet certain financial ratios and financial condition tests. CI is within its financial covenants with respect to its credit facility, which require that the funded debt to annualized earnings before interest, taxes, depreciation and amortization ratio remain below 2.5:1 and that CI’s assets under management not fall below $60 billion, calculated based on a rolling 30-day average. There can be no assurance that future borrowings or equity financing will be available to CI or available on acceptable terms.
DECEMBER 31, 2015 and 2014 [in thousands of dollars, except per share amounts]
| 21 |
| NOTES TO CONSOLIDATED FINANCIAL STATEMENTS |
Debentures
On December 7, 2015, CI completed an offering pursuant to which it issued $450,000 principal amount of debentures due December 7, 2020 [the “2020 Debentures”]. The 2020 Debentures were issued at par for gross proceeds of $450,000. The proceeds, net of transaction costs, were used in part to repay the debentures due December 14, 2016 [the “2016 Debentures”] of $300,000 and to pay down the amount borrowed under the credit facility. Interest on the 2020 Debentures is paid semi-annually in arrears at a rate of 2.645%. Interest attributable to the 2020 Debentures was $783 for the period from December 7 to December 31, 2015. Interest expense attributable to the 2016 Debentures was $11,302 for the period January 1 to December 14, 2015 [Year 2014 – $11,820].
On December 16, 2014, $200,000 in outstanding debentures matured [the “2014 Debentures”]. Interest attributable to the 2014 Debentures was $5,468 for the year ended December 31, 2014.
Issuance costs and the issuance discount are amortized over the term of the Debentures using the effective interest rate method. The amortization expense related to the discount and transaction costs for CI’s issued 2016 Debentures for the year ended December 31, 2015 was $607 [2014 – $522] which is included in other expenses.
CI may, at its option, redeem the 2020 Debentures in whole or in part, from time to time, on not less than 30 nor more than 60 days’ prior notice to the registered holder, at a redemption price which is equal to the greater of par or the Government of Canada yield, plus 42.5 basis points. CI considers this embedded prepayment option to be closely related to the Debentures and, as such, does not account for it separately as a derivative.
In the event that both a change of control occurs and the rating of the 2020 Debentures is lowered to below investment grade by two out of three rating agencies as defined as below BBB- by Standard and Poor’s, BBB (low) by DBRS Limited and Baa3 by Moody’s Investor Service, Inc., CI will be required to make an offer to repurchase all or, at the option of each holder, any part of each holder’s Debentures at a purchase price payable in cash equivalent to 101% of the outstanding principal amount of the Debentures together with accrued and unpaid interest, to the date of purchase.
DECEMBER 31, 2015 and 2014 [in thousands of dollars, except per share amounts]
| 22 |
| NOTES TO CONSOLIDATED FINANCIAL STATEMENTS |
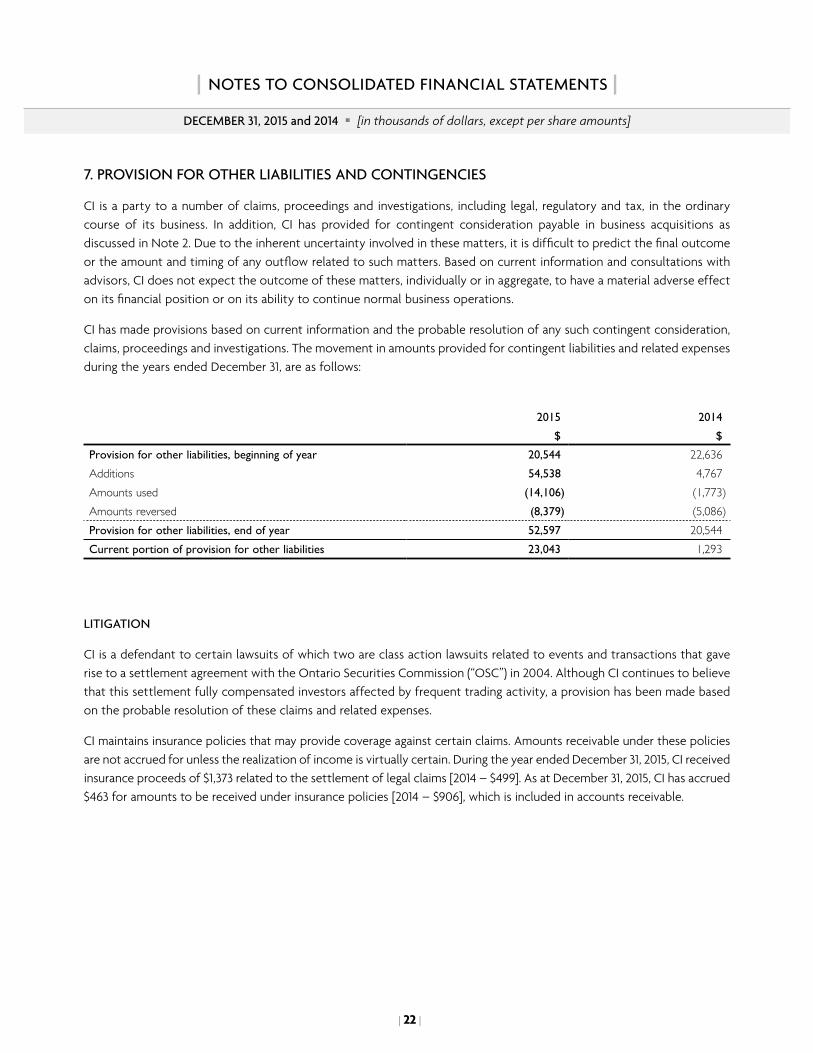
7. PROVISION FOR OTHER LIABILITIES AND CONTINGENCIES
CI is a party to a number of claims, proceedings and investigations, including legal, regulatory and tax, in the ordinary course of its business. In addition, CI has provided for contingent consideration payable in business acquisitions as discussed in Note 2. Due to the inherent uncertainty involved in these matters, it is difficult to predict the final outcome or the amount and timing of any outflow related to such matters. Based on current information and consultations with advisors, CI does not expect the outcome of these matters, individually or in aggregate, to have a material adverse effect on its financial position or on its ability to continue normal business operations.
CI has made provisions based on current information and the probable resolution of any such contingent consideration, claims, proceedings and investigations. The movement in amounts provided for contingent liabilities and related expenses during the years ended December 31, are as follows:
2015
$
2014
$
Provision for other liabilities, beginning of year 20,544 22,636Additions 54,538 4,767Amounts used (14,106) (1,773)Amounts reversed (8,379) (5,086)Provision for other liabilities, end of year 52,597 20,544Current portion of provision for other liabilities 23,043 1,293
LITIGATION
CI is a defendant to certain lawsuits of which two are class action lawsuits related to events and transactions that gave rise to a settlement agreement with the Ontario Securities Commission (“OSC”) in 2004. Although CI continues to believe that this settlement fully compensated investors affected by frequent trading activity, a provision has been made based on the probable resolution of these claims and related expenses.
CI maintains insurance policies that may provide coverage against certain claims. Amounts receivable under these policies are not accrued for unless the realization of income is virtually certain. During the year ended December 31, 2015, CI received insurance proceeds of $1,373 related to the settlement of legal claims [2014 – $499]. As at December 31, 2015, CI has accrued $463 for amounts to be received under insurance policies [2014 – $906], which is included in accounts receivable.

DECEMBER 31, 2015 and 2014 [in thousands of dollars, except per share amounts]
| 23 |
| NOTES TO CONSOLIDATED FINANCIAL STATEMENTS |
TAXATION
CI is subject to various uncertainties concerning the interpretation and application of Canadian tax laws. If tax authorities disagree with CI’s application of such tax laws, CI’s profitability and cash flows could be adversely affected. CI Investments is considered a large case file by the CRA, and as such, is subject to audit each year. There is a significant lag between the end of a fiscal year and when such audits are completed. Therefore, at any given time, several years may be open for audit and/or adjustment.
During 2015, CI received notices of reassessment (“NOR”) from the CRA and the Ontario and Alberta Ministries of Finance relating to the interest rate charged on subordinated notes within CI’s income trust structure from 2006 to 2008. The NORs were in the amount of $275,208 including interest. However, notwithstanding the filing of a notice of objection, CI has made the required minimum payments of $172,115, which will remain on account until the dispute is resolved, which may take considerable time. The amount deposited has been included in other assets as at December 31, 2015. While CI believes it will be able to successfully defend its position, CI recorded a provision of $4,000 during the year 2015 for expenses to mount this defense. As at December 31, 2015, a provision of $3,821 remains.
REMEDIATION
In April 2015, CI Investments discovered an administrative error. Approximately $156.1 million of interest had not been properly recorded as an asset in the accounting records of certain funds, with the result being that the net asset values of these funds, and any funds that had invested in these funds, had been understated for several years. CI Investments self-reported the error to the OSC and on February 10, 2016 entered into a no-contest settlement agreement with the OSC in connection with the administrative error. CI has made a provision of $10.75 million, net of recoveries, for the cost of this settlement as well as the costs to remediate.
CONTINGENT CONSIDERATION
CI entered into an acquisition agreement with the shareholders of First Asset that provides for contingent consideration to be paid. Details of this agreement and the basis of calculation of the fair value of the contingent consideration are summarized in Note 2.
CI entered into an acquisition agreement with the shareholders of Marret that provided for contingent consideration payable in common shares of CI in the amount of $12,500, three years from the date of acquisition, if certain financial targets were met based on EBITDA generated during that period. Included in other income for the year ended December 31, 2015 is a fair value adjustment of $7,500 [2014 – $5,000] to reduce the estimated fair value of the contingent consideration to be nil [December 31, 2014 – $7,500].

DECEMBER 31, 2015 and 2014 [in thousands of dollars, except per share amounts]
| 24 |
| NOTES TO CONSOLIDATED FINANCIAL STATEMENTS |
8. SHARE CAPITAL
A summary of the changes to CI’s share capital for the period is as follows:
[A] AUTHORIZED AND ISSUEDNumber of shares
[in thousands]
Stated value
$
Authorized
An unlimited number of common shares of CI
Issued
Common shares, balance, December 31, 2013 284,396 1,987,642
Issuance of share capital on exercise of share options 493 3,279Share repurchases (3,181) (22,229)Common shares, balance, December 31, 2014 281,708 1,968,692
Issuance for acquisition of subsidiary 1,301 40,576Issuance of share capital on exercise of share options 417 3,062Share repurchases (7,399) (51,708)Common shares, balance, December 31, 2015 276,027 1,960,622
During the year ended December 31, 2015, 7,399 [2014 – 3,181 shares] shares were repurchased under a normal course issuer bid at an average cost of $32.92 per share for total consideration of $243,586 [2014 – $33.98 per share for total consideration at $108,088]. Deficit was increased by $191,878 during the year 2015 [2014 – $85,859] for the cost of the shares repurchased in excess of their stated value.

DECEMBER 31, 2015 and 2014 [in thousands of dollars, except per share amounts]
| 25 |
| NOTES TO CONSOLIDATED FINANCIAL STATEMENTS |
[B] EMPLOYEE INCENTIVE SHARE OPTION PLAN
CI has an employee incentive share option plan [the “Share Option Plan”], as amended and restated, for the executives and key employees of CI.
During the year, CI granted 2,992 options [2014 – 2,223 options] to employees. The fair value method of accounting is used for the valuation of the 2015 and 2014 share option grants. Compensation expense is recognized over the three-year vesting period, with an offset to contributed surplus. When exercised, amounts originally recorded against contributed surplus as well as any consideration paid by the option holder is credited to share capital. The fair value of the 2015 and 2014 option grants was estimated using the Black-Scholes option-pricing model with the following weighted-average assumptions:
Year of grant 2015 2015 2014 2014
# of options grants [in thousands] 220 2,772 260 1,963Vesting terms 1/3 at end of each year 1/3 at end of each year 1/3 at end of each year 1/3 at end of each yearDividend yield 4.125% – 4.296% 4.358% – 4.539% 4.033% – 4.286% 3.911% – 4.156%Expected volatility (*) 16% 16% 15.5% 15.5%Risk-free interest rate 0.980% – 1.057% 0.913% – 0.998% 1.499% – 1.718% 1.477% – 1.773%Expected life [years] 2.4 – 3.4 2.4 – 3.4 2.8 – 3.9 2.8 – 3.9Forfeiture rate 0% 1.4% – 6.5% 0% 1.4% – 4.7%Fair value per stock option $2.55 – $2.84 $2.36 – $2.62 $2.61 – $2.92 $2.71 – $3.06Exercise price $35.88 $33.96 $34.52 $35.60(*) Based on historical volatility of CI’s share price.
The maximum number of shares that may be issued under the Share Option Plan is 14,000 shares. As at December 31, 2015, there are 6,951 shares [2014 – 5,552 shares] reserved for issuance on exercise of share options. These options vest over periods of up to five years, may be exercised at prices ranging from $21.55 to $35.88 per share and expire at dates up to 2020.

DECEMBER 31, 2015 and 2014 [in thousands of dollars, except per share amounts]
| 26 |
| NOTES TO CONSOLIDATED FINANCIAL STATEMENTS |
A summary of the changes in the Share Option Plan is as follows:
Number of options
[in thousands]
Weighted average
exercise price
$
Options outstanding, December 31, 2013 4,771 24.00
Options exercisable, December 31, 2013 807 20.47
Options granted 2,223 35.47Options exercised (*) (1,338) 22.22Options cancelled (104) 30.12Options outstanding, December 31, 2014 5,552 28.91
Options exercisable, December 31, 2014 1,335 23.48
Options granted 2,992 34.10Options exercised (*) (1,400) 23.27Options cancelled (193) 33.41Options outstanding, December 31, 2015 6,951 32.15
Options exercisable, December 31, 2015 1,994 28.62
(*) Weighted-average share price of options exercised was $33.16 during the year 2015 [2014 – $35.07]
The equity-based compensation expense under the Share Option Plan for the year ended December 31, 2015 of $6,221 [2014 – $5,206] has been included in selling, general and administrative expenses. Options outstanding and exercisable as at December 31, 2015 are as follows:
Exercise price
$
Number of
options outstanding
[in thousands]
Weighted average
remaining contractual life
[years]
Number of
options exercisable
[in thousands]
21.55 115 0.1 11521.73 69 1.4 6921.98 401 1.1 40127.03 1,248 2.1 62730.27 125 2.4 8333.96 2,678 4.1 ––34.52 229 3.4 7635.60 1,866 3.1 62335.88 220 4.3 ––21.55 to 35.88 6,951 3.2 1,994

DECEMBER 31, 2015 and 2014 [in thousands of dollars, except per share amounts]
| 27 |
| NOTES TO CONSOLIDATED FINANCIAL STATEMENTS |
[C] BASIC AND DILUTED EARNINGS PER SHARE
The following table presents the calculation of basic and diluted earnings per common share for the years ended December 31:
[in thousands] 2015 2014
Numerator:
Net income attributable to shareholders of the Company – basic and diluted $553,494 $525,044
Denominator:
Weighted average number of common shares – basic 278,832 283,667Weighted average effect of dilutive stock options (*) 590 982Weighted average number of common shares – diluted 279,422 284,649
Net earnings per common share attributable to shareholders
Basic $1.99 $1.85Diluted $1.98 $1.84(*) The determination of the weighted average number of common shares – diluted excludes 4,993 thousand shares related to stock
options that were anti-dilutive for the year ended December 31, 2015 [2014 – 2,173 thousand shares].
[D] MAXIMUM SHARE DILUTION
The following table presents the maximum number of shares that would be outstanding if all the outstanding options as at January 31, 2016 were exercised and outstanding:
[in thousands]
Shares outstanding at January 31, 2016 275,700Options to purchase shares 6,845
282,545

DECEMBER 31, 2015 and 2014 [in thousands of dollars, except per share amounts]
| 28 |
| NOTES TO CONSOLIDATED FINANCIAL STATEMENTS |
9. DIVIDENDS
The following dividends were paid by CI during the year ended December 31, 2015:
Record date Payment date
Cash dividend
per share $
Total dividend
amount $
December 31, 2014 January 15, 2015 0.105 29,640January 31, 2015 February 13, 2015 0.105 29,600February 28, 2015 March 13, 2015 0.105 29,649March 31, 2015 April 15, 2015 0.105 29,616April 30, 2015 May 15, 2015 0.105 29,522May 31, 2015 June 15, 2015 0.11 30,854June 30, 2015 July 15, 2015 0.11 30,712July 31, 2015 August 14, 2015 0.11 30,631August 31, 2015 September 15, 2015 0.11 30,580September 30, 2015 October 15, 2015 0.11 30,469October 31, 2015 November 13, 2015 0.11 30,404November 30, 2015 December 15, 2015 0.11 30,507Paid during the year ended December 31, 2015 362,184
The following dividends were declared but not paid by CI during the year ended December 31, 2015:
Record date Payment date
Cash dividend
per share $
Total dividend
amount $
December 31, 2015 January 15, 2016 0.11 30,364January 31, 2016 February 12, 2016 0.11 30,364Declared and accrued as at December 31, 2015 60,728
DECEMBER 31, 2015 and 2014 [in thousands of dollars, except per share amounts]
| 29 |
| NOTES TO CONSOLIDATED FINANCIAL STATEMENTS |
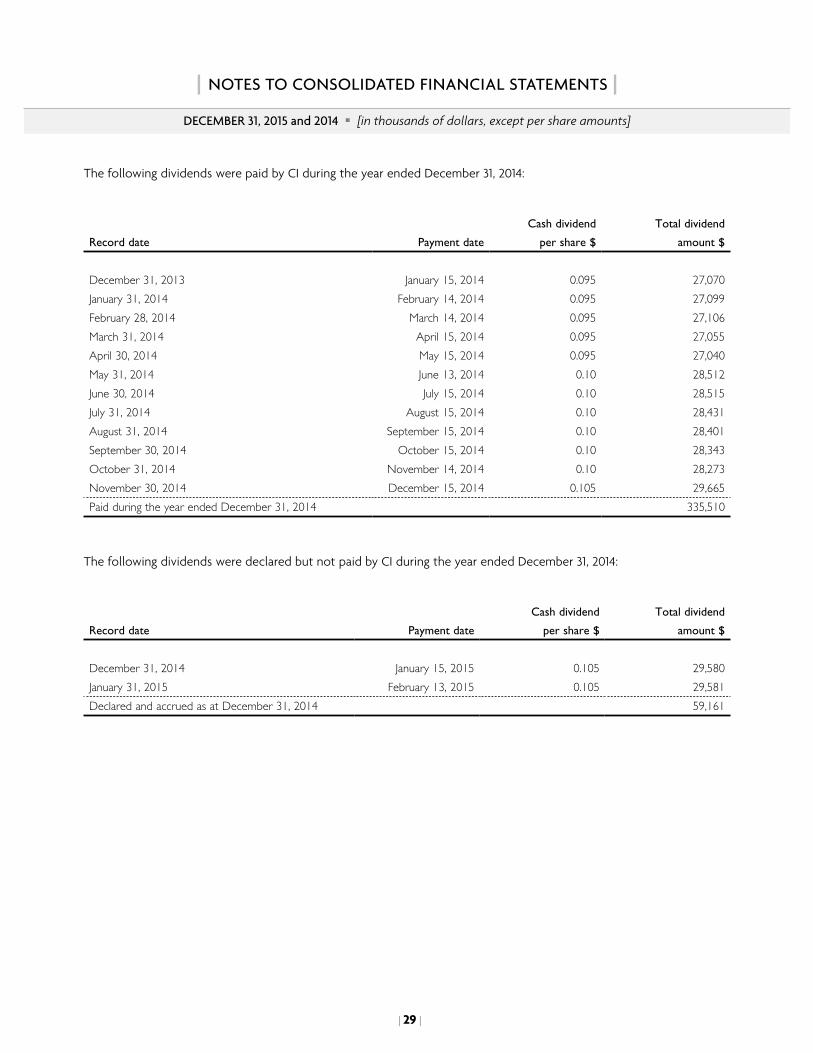
The following dividends were paid by CI during the year ended December 31, 2014:
Record date Payment date
Cash dividend
per share $
Total dividend
amount $
December 31, 2013 January 15, 2014 0.095 27,070January 31, 2014 February 14, 2014 0.095 27,099February 28, 2014 March 14, 2014 0.095 27,106March 31, 2014 April 15, 2014 0.095 27,055April 30, 2014 May 15, 2014 0.095 27,040May 31, 2014 June 13, 2014 0.10 28,512June 30, 2014 July 15, 2014 0.10 28,515July 31, 2014 August 15, 2014 0.10 28,431August 31, 2014 September 15, 2014 0.10 28,401September 30, 2014 October 15, 2014 0.10 28,343October 31, 2014 November 14, 2014 0.10 28,273November 30, 2014 December 15, 2014 0.105 29,665Paid during the year ended December 31, 2014 335,510
The following dividends were declared but not paid by CI during the year ended December 31, 2014:
Record date Payment date
Cash dividend
per share $
Total dividend
amount $
December 31, 2014 January 15, 2015 0.105 29,580January 31, 2015 February 13, 2015 0.105 29,581Declared and accrued as at December 31, 2014 59,161

DECEMBER 31, 2015 and 2014 [in thousands of dollars, except per share amounts]
| 30 |
| NOTES TO CONSOLIDATED FINANCIAL STATEMENTS |
10. INCOME TAXES
[a] The following are the major components of income tax expense for the years ended December 31:
2015
$
2014
$
Statement of Income
Current income tax expenseBased on taxable income of the current year 219,531 204,329Adjustments in respect of prior years (44) 440
219,487 204,769
Deferred income tax expense Origination and reversal of temporary differences (14,403) (11,103)Other (136) (1,131)
(14,539) (12,234)Income tax expense reported in the statement of income 204,948 192,535 Statement of Other Comprehensive Income
Deferred income taxes Unrealized gain on available-for-sale financial assets 221 298 Reversal of gains to net income on available-for-sale financial assets (468) (50)Income tax expense reported in the statement of other comprehensive income (247) 248
[b] The following is a reconciliation between CI’s statutory and effective income tax rates for the years ended December 31:
2015
$
2014
$
Combined Canadian federal and provincial income tax rate 26.5 26.5Increase (decrease) in income taxes resulting from Impact of rate changes on deferred income taxes — (0.2) Recovery of prior years’ provisions for settled tax items 0.1 0.1 Other, net 0.5 0.4
27.1 26.8

DECEMBER 31, 2015 and 2014 [in thousands of dollars, except per share amounts]
| 31 |
| NOTES TO CONSOLIDATED FINANCIAL STATEMENTS |
[c] Deferred income taxes reflect the net tax effects of temporary differences between the carrying amounts of assets and liabilities for financial reporting purposes and the amounts used for income tax purposes. Significant components of CI’s deferred income tax liabilities and assets are as follows at December 31, 2015:
As at December 31,
2014$
Recognized in net income
$
Recognized in other
comprehensive income
$
Business acquisition
[note 2] $
As at December 31,
2015 $
Deferred income tax liabilities
Fund contracts 276,883 (629) — 23,135 299,389Deferred sales commissions 104,034 (13,263) — — 90,771Total deferred income tax liabilities 380,917 (13,892) — 23,135 390,160
Deferred income tax assets
Equity-based compensation 1,223 3,625 — — 4,848Non-capital loss carryforwards 1,933 (622) — — 1,311Provision for other liabilities 3,182 381 — — 3,563Other 6,714 (2,737) 247 4,224Total deferred income tax assets 13,052 647 247 — 13,946Net deferred income tax liabilities 367,865 (14,539) (247) 23,135 376,214
Significant components of CI’s deferred income tax liabilities and assets are as follows at December 31, 2014:
As at December 31, 2013
$
Recognized in net income
$
Recognized in other comprehensive
income $
As at December 31, 2014
$
Deferred income tax liabilities
Fund contracts 277,972 (1,089) — 276,883Deferred sales commissions 112,690 (8,656) — 104,034Total deferred income tax liabilities 390,662 (9,745) — 380,917
Deferred income tax assets
Equity-based compensation 985 238 — 1,223Non-capital loss carry forwards 1,829 104 — 1,933Provision for other liabilities 2,604 578 — 3,182Other 5,393 1,569 (248) 6,714Total deferred income tax assets 10,811 2,489 (248) 13,052Net deferred income tax liabilities 369,851 (12,234) 248 367,865

DECEMBER 31, 2015 and 2014 [in thousands of dollars, except per share amounts]
| 32 |
| NOTES TO CONSOLIDATED FINANCIAL STATEMENTS |
11. FINANCIAL INSTRUMENTS
Financial assets are classified into three categories, FVPL, loans and receivables and AFS. Financial liabilities are classified as FVPL or other.
The carrying amounts of the financial instruments are presented in the table below and are classified according to the following categories:
December 31, 2015
$
December 31, 2014
$
Financial assets
Fair value through profit or loss
Cash and cash equivalents 56,598 51,246Loans and receivables
Client and trust funds on deposit 158,891 130,665 Accounts receivable 109,893 88,154 Other assets 189,555 15,702Available-for-sale
Marketable securities 78,700 83,718Total financial assets 593,637 369,485
Financial liabilities
Fair value through profit or loss
Provision for other liabilities 20,000 7,500Other financial liabilities
Accounts payable and accrued liabilities 159,148 161,923 Provision for other liabilities 32,597 13,044 Dividends payable 60,728 59,161 Client and trust funds payable 156,164 128,715 Long-term debt 559,347 307,392Total financial liabilities 987,984 677,735

DECEMBER 31, 2015 and 2014 [in thousands of dollars, except per share amounts]
| 33 |
| NOTES TO CONSOLIDATED FINANCIAL STATEMENTS |
CI’s financial assets at December 31, 2015 and 2014 include CI’s marketable securities which consist of investments in mutual fund securities. Mutual fund securities are valued using the net asset value per unit of each fund, which represents the underlying net assets at fair values determined using closing market prices. CI considers mutual fund securities that are valued daily to be level 1 in the fair value hierarchy and those mutual fund securities valued less frequently to be level 2 in the fair value hierarchy. As at December 31, 2015, CI’s marketable securities of $78,700 [2014 – $83,718] are carried at fair value of which $21,734 have been classified as level 1 in the fair value hierarchy and $56,966 as level 2 in the fair value hierarchy [2014 – $13,226 as level 1 in the fair value hierarchy and $70,492 as level 2 in the fair value hierarchy]. There have been no transfers between level 1 and level 2 during the year.
Included in provision for other liabilities, as at December 31, 2015 is contingent consideration of $20,000 related to the First Asset acquisition and nil related to the Marret acquisition [2014 – $7,500 related to the Marret acquisition] carried at fair value and classified as level 3 in the fair value hierarchy. Long-term debt as at December 31, 2015 includes Debentures with a fair value of $453,870 [2014 – $305,601], as determined by quoted market prices and have been classified as level 1 in the fair value hierarchy.
12. RISK MANAGEMENT
Risk management is an integrated process with independent oversight. Management has developed an enterprise wide approach to risk management that involves executives in each core business unit and operating area of CI. Using a quantitative and qualitative analysis, risk factors are assessed and procedures are implemented to mitigate the various events that could impact CI’s financial position and results of operations.
CI’s financial instruments bear the following financial risks:
[A] MARKET RISK
Market risk is the risk of a financial loss resulting from adverse changes in underlying market factors, such as interest rates, foreign exchange rates, and equity prices. The corporate finance group reviews the exposure to interest rate risk, foreign exchange risk and equity risk by identifying, monitoring and reporting potential market risks to the Chief Financial Officer. A description of each component of market risk is described below:
• Interest rate risk is the risk of gain or loss due to the volatility of interest rates.
• Foreign exchange risk is the risk of gain or loss due to volatility of foreign exchange rates.
• Equity risk is the risk of gain or loss due to the changes in the prices and the volatility of individual equity instruments and equity indexes.

DECEMBER 31, 2015 and 2014 [in thousands of dollars, except per share amounts]
| 34 |
| NOTES TO CONSOLIDATED FINANCIAL STATEMENTS |
CI’s financial performance is indirectly exposed to market risk. Any decline in financial markets or lack of sustained growth in such markets may result in a corresponding decline in the performance and may adversely affect CI’s assets under management and financial results.
[i] Interest rate risk
Interest rate risk arises from the possibility that changes in interest rates will affect the value of financial instruments. Fluctuations in interest rates have a direct impact on the interest payments CI makes on its long-term debt.
Debt outstanding on CI’s credit facility of $112,000 [2014 – $8,000] is borrowed at a floating interest rate. Based on the amount borrowed under the credit facility as at December 31, 2015, each 0.50% increase or decrease in interest rates would result in annual interest expense increasing or decreasing by $560 [2014 – $40], respectively.
[ii] Foreign exchange risk
As at December 31, 2015, net financial assets of $11,174 [2014 – $9,051] were denominated in U.S. currency. A 10% increase or decrease in U.S. exchange rates would result in a foreign exchange gain or loss of $1,117 [2014 – $905], respectively. CI may enter into forward contracts to manage its foreign exchange exposure.
[iii] Equity risk
CI’s marketable securities as at December 31, 2015 of $78,700 [2014 – $83,718] are exposed to equity risk. Based on the carrying amount of these assets, an increase or decrease in equity market prices by 10% would result in estimated gains or losses of $7,870 [2014 – $8,372], respectively.
[B] LIQUIDITY RISK
Liquidity risk arises from the possibility that CI will encounter difficulties in meeting its financial obligations as they fall due. CI manages its liquidity risk through a combination of cash received from operations as well as borrowings under its revolving credit facility. Liquidity is monitored through a daily cash management process that includes the projection of cash flows to ensure CI meets its funding obligations.

DECEMBER 31, 2015 and 2014 [in thousands of dollars, except per share amounts]
| 35 |
| NOTES TO CONSOLIDATED FINANCIAL STATEMENTS |
CI’s liabilities have contractual maturities, excluding interest payments, as follows:
Total
$
2016
$
2017
$
2018
$
2019$
2020$
Accounts payable and accrued liabilities 159,148 159,148 — — — —Dividends payable 60,728 60,728 — — — —Client and trust funds payable 156,164 156,164 — — — —Long-term debt 562,000 2,000 — 110,000 — 450,000Provision for other liabilities 20,000 — — — 20,000Total 958,040 378,040 — 110,000 — 470,000
[C] CREDIT RISK
Credit risk is the risk of loss associated with the inability of a third party to fulfill its payment obligations. CI is exposed to the risk that third parties that owe it money, securities or other assets will not perform their obligations.
As at December 31, 2015, financial assets of $458,339 [2014 – $234,521], represented by client and trust funds on deposit of $158,891 [2014 – $130,665], accounts receivable of $109,893 [2014 – $88,154] and other assets of $189,555 [2014 – $15,702], were exposed to credit risk. CI does not have a significant exposure to any individual counterparty. Credit risk is mitigated by regularly monitoring the credit performance of each individual counterparty and holding collateral, where appropriate.
Client and trust funds on deposit consist mainly of cash deposits or unsettled trade receivables. CI may also extend amounts to clients on a margin basis for security purchases. Margin loans are due on demand and are collateralized by the financial instruments in the client’s account. CI faces a risk of financial loss in the event a client fails to meet a margin call if market prices for securities held as collateral decline and if CI is unable to recover sufficient value from the collateral held. The credit extended is limited by regulatory requirements and by CI’s internal credit policy. Credit risk is managed by dealing with counterparties CI believes to be creditworthy and by actively monitoring credit and margin exposure and the financial health of the counterparties.
Credit risk associated with accounts receivable is limited as the balance primarily consists of trade receivables that are outstanding for less than 90 days.
Other assets consists mainly of deposits with the CRA discussed in Note 7, long-term investments, long-term accounts receivable, loans granted under CI’s employee share purchase plan and loans extended to investment advisors under CI’s hiring and incentive program. Employee loans are collateralized by CI shares and become due immediately upon termination of the employee or upon the sale of the shares held as collateral. Commissions may be used to offset loan amounts made to investment advisors in the event of default. Credit risk associated with other assets is limited given the nature of the relationship with the counterparties.

DECEMBER 31, 2015 and 2014 [in thousands of dollars, except per share amounts]
| 36 |
| NOTES TO CONSOLIDATED FINANCIAL STATEMENTS |
13. CAPITAL MANAGEMENT
CI’s objectives in managing capital are to maintain a capital structure that allows CI to meet its growth strategies and build long-term shareholder value, while satisfying its financial obligations and meeting its long-term debt covenants. CI’s capital is comprised of shareholders’ equity and long-term debt (including current portion of long-term debt).
CI and its subsidiaries are subject to minimum regulatory capital requirements whereby sufficient cash and other liquid assets must be on hand to maintain capital requirements rather than using them in connection with its business. As at December 31, 2015, cash and cash equivalents of $8,282 was required to be on hand for regulatory capital maintenance. Failure to maintain required regulatory capital by CI may result in fines, suspension or revocation of registration by the relevant securities regulator. CI from time to time provides loans to its subsidiaries for operating purposes and may choose to subordinate these loans in favour of general creditors. The repayment of subordinated loans is subject to regulatory approval. As at December 31, 2015 and 2014, CI met its capital requirements.
CI’s capital consists of the following:
As at
December 31, 2015
$
As atDecember 31, 2014
$
Shareholders’ equity 1,894,100 1,902,697Long-term debt 559,347 307,392Total capital 2,453,447 2,210,089

DECEMBER 31, 2015 and 2014 [in thousands of dollars, except per share amounts]
| 37 |
| NOTES TO CONSOLIDATED FINANCIAL STATEMENTS |
14. COMMITMENTS
LEASE COMMITMENTS
CI has entered into leases relating to the rental of office premises and computer equipment. CI has the option to renew certain leases. The approximate future minimum annual rental payments under such leases are as follows:
$
2016 12,3922017 11,7062018 10,8232019 10,4032020 9,7702021 and thereafter 46,069
ADVISOR SERVICES AGREEMENTS
CI is a party to certain advisor services agreements, which provide that the advisor has the option to require CI to purchase a practice that cannot otherwise be transitioned to a qualified buyer. The purchase price would be in accordance with a pre-determined formula contained in the advisor services agreements.
INDEMNITIES
CI has agreed to indemnify its directors and officers, and certain of its employees in accordance with its by-laws. CI maintains insurance policies that may provide coverage against certain claims.

DECEMBER 31, 2015 and 2014 [in thousands of dollars, except per share amounts]
| 38 |
| NOTES TO CONSOLIDATED FINANCIAL STATEMENTS |
15. SEGMENTED INFORMATION
CI has two reportable segments: asset management and asset administration. These segments reflect CI’s internal financial reporting and performance measurement.
The asset management segment includes the operating results and financial position of CI Investments, CI Private Counsel LP, Marret and First Asset which derive their revenues principally from the fees earned on the management of several families of mutual funds, segregated funds and exchange traded funds.
The asset administration segment includes the operating results and financial position of AWM and its subsidiaries, including Assante Capital Management Ltd. and Assante Financial Management Ltd. These companies derive their revenues principally from commissions and fees earned on the sale of mutual funds and other financial products, and ongoing service to clients.
Segmented information as at and for the year ended December 31, 2015 is as follows:
Asset
Management
$
Asset
Administration
$
Intersegment
eliminations
$
Total
$
Management fees 1,787,854 — — 1,787,854
Administration fees — 296,869 (150,221) 146,648
Other revenue 41,203 21,942 — 63,145
Total revenue 1,829,057 318,811 (150,221) 1,997,647
Selling, general and administrative 305,608 66,848 — 372,456
Trailer fees 577,888 — (24,266) 553,622
Investment dealer fees — 242,853 (123,215) 119,638
Amortization of deferred sales commissions and intangibles 149,840 2,203 (3,660) 148,383
Other expenses 23,850 8,054 — 31,904
Total expenses 1,057,186 319,958 (151,141) 1,226,003
Income before income taxes
and non-segmented items 771,871 (1,147) 920 771,644
Interest expense (14,078)
Provision for income taxes (204,948)
Net income for the year 552,618
Identifiable assets 755,029 302,030 (9,196) 1,047,863
Indefinite life intangiblesGoodwill 970,540 192,582 — 1,163,122
Fund contracts 1,086,382 — — 1,086,382
Total assets 2,811,951 494,612 (9,196) 3,297,367

DECEMBER 31, 2015 and 2014 [in thousands of dollars, except per share amounts]
| 39 |
| NOTES TO CONSOLIDATED FINANCIAL STATEMENTS |
Segmented information as at and for the year ended December 31, 2014 is as follows:
Asset
Management
$
Asset
Administration
$
Intersegment
eliminations
$
Total
$
Management fees 1,669,125 — — 1,669,125 Administration fees — 276,723 (135,377) 141,346 Other revenue 44,779 20,667 — 65,446 Total revenue 1,713,904 297,390 (135,377) 1,875,917
Selling, general and administrative 279,196 62,555 — 341,751 Trailer fees 533,396 — (21,786) 511,610 Investment dealer fees — 223,332 (110,134) 113,198 Amortization of deferred sales commissions and intangibles 158,107 2,203 (3,770) 156,540
Other expenses 10,052 6,818 — 16,870 Total expenses 980,751 294,908 (135,690) 1,139,969 Income before income taxes
and non-segmented items 733,153 2,482 313 735,948 Interest expense (18,056)Provision for income taxes (192,535)Net income for the year 525,357
Identifiable assets 560,572 329,481 (10,476) 879,577 Indefinite life intangiblesGoodwill 944,726 192,582 — 1,137,308 Fund contracts 999,082 — — 999,082 Total assets 2,504,380 522,063 (10,476) 3,015,967

DECEMBER 31, 2015 and 2014 [in thousands of dollars, except per share amounts]
| 40 |
| NOTES TO CONSOLIDATED FINANCIAL STATEMENTS |
16. COMPENSATION OF KEY MANAGEMENT
The remuneration of directors and other key management personnel of CI during the years ended December 31, is as follows:
2015$
2014$
Salaries 12,931 12,752Equity-based compensation 878 1,188Total 13,809 13,940
17. SELLING, GENERAL AND ADMINISTRATIVE
Included in selling, general and administrative expenses [“SG&A”] are salaries and benefits of $200,091 for the year ended December 31, 2015 [2014 – $182,647]. Also included in SG&A is depreciation of capital assets of $7,760 for the year ended December 31, 2015 [2014 – $7,673]. Other SG&A of $164,605 for the year ended December 31, 2015, primarily includes marketing, lease and information technology expenses as well as professional and regulatory fees [2014 – $151,431].

DECEMBER 31, 2015 and 2014 [in thousands of dollars, except per share amounts]
| 41 |
| NOTES TO CONSOLIDATED FINANCIAL STATEMENTS |
18. FUTURE ACCOUNTING CHANGES
The following standards have been issued, but are not yet effective on the date of issuance of CI’s financial statements. CI is currently evaluating the impact of the application of these standards on the financial statements and will adopt these standards when they become effective.
IFRS 9:
IFRS 9 Financial Instruments (“IFRS 9”) was issued in July 2014 and will replace IAS 39 Financial Instruments: Recognition and Measurement (“IAS 39”). IFRS 9 provides a new approach for the classification of financial assets, which shall be based on the cash flow characteristics of the asset and the business model of the portfolio in which the asset is held. This final version includes requirements on: (1) Classification and measurement of financial assets and liabilities; (2) Impairment; and (3) Hedge accounting. Accounting for macro hedging has been decoupled from IFRS 9 and will not be considered and issued as a separate standard. For financial liabilities designated at fair value through profit or loss, IFRS 9 requires the presentation of the effects of changes in the liability’s credit risk in OCI instead of net income. IFRS 9 is effective for annual periods beginning on or after January 1, 2018. Retrospective application is required, but comparative information is not compulsory.
IFRS 15:
IFRS 15 Revenue from Contracts with Customers (“IFRS 15”) was issued in May 2014. IFRS 15 replaces prior guidance, including IAS 18 Revenue. The principles in IFRS 15 provide a more structured approach to measuring and recognizing revenue. The new guidance includes a five-step recognition and measurement approach, requirements for accounting of contract costs, and enhanced quantitative and qualitative disclosure requirements. Under IFRS 15, revenue is recognized at an amount that reflects the consideration to which an entity expects to be entitled in exchange for transferring goods or services to a customer. The standard is effective for annual periods beginning on or after January 1, 2018 and is to be applied retrospectively.
IFRS 16:
IFRS 16 Leases (“IFRS”) was issued in January 2016 and will replace the previous lease standard, IAS 17 Leases, and related Interpretations. The new standard requires lessees to recognize assets and liabilities for most leases. IRFS 16 is effective for annual periods beginning on or after January 1, 2019.
This Report contains forward-looking statements with respect to CI, including its business operations and strategy and financial
performance and condition. Although management believes that the expectations reflected in such forward-looking statements are
reasonable, such statements involve risks and uncertainties. Actual results may differ materially from those expressed or implied by
such forward-looking statements. Factors that could cause results to differ materially include, among other things, general economic
and market factors, including interest rates, business competition, changes in government regulations or in tax laws, and other factors
discussed in materials filed with applicable securities regulatory authorities from time to time.