consolidated financial statements for the interim period
TRANSCRIPT

1
Consolidated Financial Statements for the Interim Period Ended September 30, 2005 These financial statements have been prepared for reference only in accordance with accounting November 8, 2005 principles and practices generally accepted in Japan. Oriental Land Co., Ltd. Stock exchange listing: Tokyo 1-1 Maihama, Urayasu, Chiba 279-8511, Japan Code number: 4661 http://www.olc.co.jp Board of Directors meeting: November 8, 2005 Name of Major Stockholder: Keisei Electric Railway Co., Ltd. Use of U.S. accounting standards: No Voting right: 20.43% Representative: Yoshiro Fukushima, President and Representative Director Contact: Kenjiro Mizushima, Director, Finance/Accounting Division 1. Results for the Interim Period Ended September 30, 2005 (April 1, 2005 - September 30, 2005) (1) Revenues and Income Note: All amounts are rounded down to the nearest million yen. Revenues
(¥ million) Year-on-year change (%)
OperatingIncome
(¥ million)
Year-on-year change (%)
Ordinary income
(¥ million)
Year-on-yearchange (%)
Interim period ended Sept. 30, 2005 Interim period ended Sept. 30, 2004
156,291 157,197
(0.6) (3.8)
11,381 14,296
(20.4) (28.1)
9,737 13,503
(27.9) (24.5)
Year ended March 31, 2005 331,094 34,561 30,836 Net income
(¥ million) Year-on-yearchange (%) Earnings per share (¥) Earnings per share (diluted)
(¥) Interim period ended Sept. 30, 2005 Interim period ended Sept. 30, 2004
5,515 7,187
(23.3) (28.3)
56.78 71.79
— —
Year ended March 31, 2005 17,224 171.19 — Notes: 1. Equity in earnings of affiliates: Interim period ended Sept. 30, 2005: ¥35 million;
Interim period ended Sept. 30, 2004: ¥(901) million; Year ended March 31, 2005: ¥(429) million 2. Average number of shares outstanding (consolidated): Interim period ended Sept. 30, 2005: 97,142,578 shares;
Interim period ended Sept. 30, 2004: 100,121,182 shares; Year ended March 31, 2005: 100,121,101 shares 3. Changes in accounting methods: None 4. Year-on-year change for revenues, operating income, ordinary income, and net income represent comparisons with the
previous interim period. (2) Financial Position Total assets
(¥ million) Stockholders’ equity
(¥ million) Stockholders’ equity
/total assets (%) Stockholders’ equity
per share (¥) Interim period ended Sept. 30, 2005Interim period ended Sept. 30, 2004
644,463 637,498
365,341 379,112
56.7 59.5
3,840.83 3,786.53
Year ended March 31, 2005 660,224 389,606 59.0 3,890.51 Note: Number of shares outstanding at end of period (consolidated): Interim period ended Sept. 30, 2005: 95,120,648 shares;
Interim period ended Sept. 30, 2004: 100,121,126 shares; Year ended March 31, 2005: 100,120,857 shares (3) Cash Flows Cash flows from
operating activities (¥ million)
Cash flows from investing activities
(¥ million)
Cash flows from financing activities
(¥ million)
Cash and cash equivalents at end of
period (¥ million) Interim period ended Sept. 30, 2005Interim period ended Sept. 30, 2004
21,785 22,780
(21,337) 6,297
(16,299) (14,602)
42,725 44,127
Year ended March 31, 2005 59,915 (21,110) (9,830) 58,577 (4) Scope of consolidation and application of the equity method
Consolidated subsidiaries: 18 companies Unconsolidated subsidiaries accounted for by the equity method: None Affiliated companies accounted for by the equity method: 4 companies
(5) Changes in scope of consolidation and application of the equity method: Consolidation: (New) 1 company (Eliminated) None Equity method: (New) None (Eliminated) None
2. Projected Results for the Fiscal Year Ending March 31, 2006 (April 1, 2005 - March 31, 2006) Revenues
(¥ million) Ordinary income
(¥ million) Net income (¥ million)
Year ending March 31, 2006 334,700 25,000 14,400 Reference: Estimated earnings per share (full year of the fiscal year ending March 31, 2006): ¥150.49 Note: Cautionary Remark Regarding Forward-Looking Statements Statements made in this document with respect to Oriental Land’s plans, strategies, beliefs and other statements that are not historical facts are forward-looking statements based on the assumptions and beliefs of the Company’s management in light of the information currently available to it and involve risks and uncertainties which may affect the Company’s future performance. Please refer to page 10-11 of the attached materials for items concerning the projected results.

2
1. Outline of Oriental Land Group Our Group includes Oriental Land Co., Ltd. (“The Company”), 18 consolidated subsidiaries, 4 affiliated companies that are accounted for by the equity method and 2 other affiliates, with the main businesses being the management and operation of theme parks and commercial facilities. The main operations of each business segment and the main affiliates and other companies conducting each business during the interim period were as follows:
Segment Main Operations Main Companies1
Theme Parks
Management and operation of theme parks Management and operation of Tokyo DisneySea
Hotel MiraCosta
Oriental Land Co., Ltd. (listed company)
Maihama Resort Hotels Co., Ltd.
Commercial Facilities
Management and operation of Ikspiari2
Management and operation of Disney Ambassador
Hotel Management of Camp Nepos3
Ikspiari Co., Ltd. Maihama Resort Hotels Co., Ltd. Oriental Land Co., Ltd. (listed company)
Retail Business Management and operation of Disney Store Japan Retail Networks Co., Ltd.
Other Businesses
Management of Palm & Fountain Terrace Hotel Management and operation of monorail Operation of employee cafeterias Management and operation of themed restaurants,
and others
Maihama Resort Line Co., Ltd. Maihama Resort Line Co., Ltd. Bay Food Services Co., Ltd. RC Japan Co., Ltd. and thirteen other companies
Notes: 1. Company names and number of companies listed in the Main Companies column all refer to consolidated subsidiaries except Oriental Land Co., Ltd.
2. Ikspiari is a complex that consists of shops, restaurants, a cinema complex, Camp Nepos and other facilities. 3. Camp Nepos is a facility that provides original programs to nurture children’s imaginations.
2. Management Policies (1) Corporate Mission and Policies Our corporate mission is to “provide enjoyment and create magic, inspired by imagination and a sense of adventure, and guided by a desire to fulfill dreams.” This mission is intended to offer today’s individuals the dreams that may be dwelling at the bottom of their hearts, refreshing impressions, and enjoyment and real peace of mind that rejuvenate people. In order to realize the above corporate mission, our Group is united and committed to act in compliance with the following six management policies:
1. Management that communicates 2. Providing the public with original, high-quality value 3. Respect for the individuality of employees, and extension of support to maintain high morale 4. Continuous innovation and evolution in management 5. Profitable growth and contribution to society 6. Harmony and coexistence with society
Based on these corporate policies, the Oriental Land Group will work with stockholders to target growth and further development by fully deploying all of our resources. (2) Policy on Distribution of Profit We believe that higher corporate value and stable dividends are important ways of returning profits to our stockholders. For the time being, we will internally retain net cash generated from each business segment to make additional investments in Tokyo Disney Resort and invest in new businesses for further growth, thereby enhancing our corporate value.

3
Based on this policy, the interim dividend for the year ending March 31, 2006 is ¥20 per share. We also plan to pay a year-end dividend of ¥20 per share. Therefore, cash dividends applicable to the year are scheduled to total ¥40 per share, up ¥5 from the fiscal year ended March 31, 2005. (3) Basic Policy for Reduction of Investment Unit To attract more individual investors and improve the liquidity of our stocks, we changed the investment unit of 1,000 shares to 100 shares when we went public. We will carefully study the possibility of further reduction of the investment unit, considering the composition and number of our stockholders and other factors. . (4) Basic Policy and Implementation Status Regarding Corporate Governance A. Basic Policy Regarding Corporate Governance Enhancing corporate governance is an important management issue for Oriental Land. In addition to working to ensure efficient management, such as speedy decision-making, we are making continuous efforts to strengthen our compliance structure, through measures including thorough maintenance of legal standards and enhancement of legality oversight through corporate auditor and internal auditing department. Moreover, we will raise management transparency and fairness through comprehensive information disclosure. B. Corporate Governance Measures and Implementation Status [Status of corporate governance in the management systems regarding decision-making, execution and supervision in the Company’s management] • We have complemented our auditor system by introducing an executive officer system as of May 16, 2005.
This system is intended to establish a stronger Group management structure that can deal more effectively with changes in the operating environment and expand our business foundation. By introducing this system, we are working to further accelerate decision-making by promoting the transfer of authority to executive officers, clearly separating responsibility for supervision and execution, and strengthening management’s supervisory function by orienting the responsibilities of directors toward supervision.
• We appoint two outside directors, and three out of four auditors are appointed from outside. • Board of Directors meetings are held regularly once a month, and are attended by both standing and non-
standing auditors. The directors conduct discussions in line with the corporate mission and policies and to ensure that there are no violations of any laws or the Articles of Incorporation. Directors and auditors, who have different responsibilities, provide checks and balances from their respective points of view.
• Regarding our compliance system, we have established a Compliance Committee to organize our system for legal compliance in business activities, as well as to draw up and publicize a code of ethics for the behavior of managers and employees, with the aim of maintaining and improving compliance awareness among managers and employees. In addition to committee members, we receive counsel from our corporate lawyers, who have specialized knowledge. Furthermore, we have established a contact for receiving direct inquiries from employees concerning compliance.
• We have no standing outside management. • We have established an Auditing Department for internal audit of strict adherence to the law and to company
regulations and of efficient execution, and are working to enhance internal regulation. Internal audit aims to improve management efficiency and profitability through examination and evaluation of whether or not operations are being conducted efficiently and properly in line with management policies, plans and internal regulations. In line with the Basic Audit Plan, the Board of Corporate Auditors works to ensure an effective audit by receiving reports from directors and employees, reviewing important documents and holding discussions on topics including the state of important meetings and audit results.
• In order to ensure the accuracy of the corporate audit, we receive a report on our financial statements from independent auditors for a third-party viewpoint.
• In conducting the internal audit, the Auditing Department, standing corporate auditors and independent auditors hold trilateral meetings and regular meetings for reporting audit results to standing corporate auditors from the Auditing Department, in addition to exchanging correspondence and holding other meetings with those parties on an ad hoc basis.

4
[Summary of personal and equity relationships, transaction relationships and other concerns between the Company and the Company’s outside directors and outside auditors] Regarding the two outside directors and three outside auditors, two directors and one former director are from Keisei Electric Railway Co., Ltd., and two directors are from Mitsui Fudosan Co., Ltd., both of which are other affiliates of Oriental Land. Regarding main transaction relationships, Keisei Electric Railway rents a dormitory for single employees, and Mitsui Fudosan is an official sponsor of Tokyo Disneyland. [Implementation of measures to strengthen the Company’s corporate governance in the most recent year (the year leading up to the end of the most recent reporting period)] • In the area of information security, we established an Information Security Management Committee, and
formulated and are administering a security policy for information asset management that covers all executives and employees. In addition, we are working to bolster security by strengthening supervision of our servers, limiting access to servers for repair, maintenance and administration, and other measures.
• We have decided to implement a comprehensive, continuous risk management cycle. Through this
management cycle, we will uncover all conceivable risks (obstacles to achievement of the Oriental Land Group’s business objectives). Also, we will establish and conduct precautionary measures for high-urgency risks based on priority ranking, while continuing to enhance these precautionary measures. In addition, we are establishing a Risk Management Committee to operate, control and monitor relevant risk management cycles, and are further strengthening protection against incidents, improprieties and associated losses.
• With the aim of establishing and maintaining high-quality corporate governance, we revised the Audit
Standards for Corporate Auditors and the Regulations for the Board of Corporate Auditors to further clarify the duties and positions of the Corporate Auditors.
Regarding the status of implementation of other measures, in order to increase management transparency, in addition to the annual General Meeting of Stockholders and the announcements of operating results, we accurately and fully disclosed information in a timely manner when major events occurred that were judged to have a significant impact on stockholders’ interests. With regard to media reports about the company that had been contracted to supply cleaning services at Oriental Land’s headquarters building, we immediately terminated our contract with said company as soon as its relationship with an individual who had been involved in antisocial activities came to light. However, a later investigation revealed that Oriental Land had paid funds to other companies with a close relationship with the company in question. Transactions with this sort of company have caused Oriental Land to lose the trust of all those who come in contact with it. Investigations of existing business partners are currently continuing with the cooperation of a third party. At present, we believe it is our foremost duty to regain the trust of the public as quickly as possible, and we are working to improve our management of business partners by further strengthening our investigative framework for any company we intend to deal with before we enter into a business contract with it. (5) Medium- and Long-term Strategies and Issues Looking at future economic conditions, the viewpoint that the economy has ended its lull is gradually spreading against a backdrop of firm private domestic demand, and there are signs of an improvement in personal consumption and employment conditions. However, conditions are expected to remain uncertain, with moderate growth in corporate earnings due to a sluggish expansion of exports and a slowdown in personal consumption due to curtailment of temporary tax cuts which will begin in 2006. Moreover, conditions in the amusement park and leisure land industry continue to provide little cause for optimism, due to factors such as slackening consumer spending and demographic changes. Under these conditions, the Oriental Land Group will focus on the following three medium- and long-term strategies aimed at further growth.
(a) Develop Tokyo Disney Resort into a “Destination Resort” (b) Expand businesses outside Maihama area (where Tokyo Disney Resort is located) (c) Strengthen management
We will work to develop Tokyo Disney Resort into a “Destination Resort” by enhancing its appeal as a

5
destination all guests will wish to visit again and again, whether on day trips to the theme parks, on visits to the movies or restaurants, or on multiple-day trips to enjoy all the resort while staying at hotels. In the theme parks, we will aim to improve the two parks’ ability to attract guests by providing new appeal at Tokyo Disneyland through aggressive replacements and renewals of existing facilities, and by improving the appeal and capacity of Tokyo DisneySea by successively introducing or providing new shows, entertainments and attractions such as “Raging Spirits” in July 2005, and in the next fiscal year, which ends March 31, 2007, a new daytime show in connection with special events held to celebrate its 5th year of operations and “Tower of Terror” in the fall. In operations other than the theme parks, we will open a third Disney Hotel in addition to the Disney Ambassador Hotel and Tokyo DisneySea Hotel MiraCosta and a permanent theater for Cirque du Soleil as a joint project with Cirque du Soleil and The Walt Disney Company in the year ending March 31, 2009. In addition, with regard to hotels, in February 2005 we opened the Palm & Fountain Terrace Hotel, which is directly managed by the Oriental Land Group, and introduced the new “Tokyo Disney Resort Partner Hotels” alliance system at the Palm & Fountain Terrace Hotel and three other hotels in the Shin-Urayasu area, comprising a total of four hotels. By implementing this new alliance system, we strengthen our ability to attract guests. In businesses outside the Maihama area, we will consider and carry out strategic closures and openings of Disney Stores after considering customer attributes and other factors. In addition, we will work to strengthen both development of products that more closely match customer preferences and trends, and our marketing and sales organization. In line with the above, we will consider expansion into “Power Your Heart with Happiness” business domains in line with the Oriental Land Group’s corporate philosophy, “Inspired by imagination and a sense of adventure, and guided by a desire to fulfill dreams, provide enjoyment and create magic,” and work to alleviate the concentration of business in the Maihama area as we aim for further growth and expansion. However, with regard to our medium-term targets announced in May 2004 of consolidated revenues of ¥360 billion or above and consolidated operating income of ¥45 billion or above by the fiscal year ending March 31, 2007, in consideration of trends in results starting from the previous fiscal year, a divergence has arisen from the time the targets were originally set, and consequently we are currently considering a revision. Aside from our business strategy, we will also conduct organizational and personnel reforms. As part of our organizational strategy, we are working to divide the current organizational structure into a Corporate Division that concentrates on the formulation of strategies for maximizing the corporate value of the entire Oriental Land Group, and a Park Division that will substantially delegate authority to enable speedy decision-making and problem solving. In personnel strategy, we will reform the employee system from the previous fiscal year with the aim of maximizing personnel performance, and will continue to take other measures including promoting further strengthening of employee training, mid-career employment of exceptional personnel and recruitment of contract employees. Through these strategies, we will endeavor to maximize the value of the Oriental Land Group to meet the expectations of our stockholders by generating high cash flow.

6
(6) Information Concerning Parent Companies and/or Major Stockholders A. Names of Parent Companies and/or Major Stockholders
(As of the interim period ended September 30, 2005) Parent Companies
and Major Stockholders
Description Voting Rights (%)
Stock Market Listing for Parent Companies and/or
Major Stockholders
Keisei Electric Railway Co., Ltd.
Disclosed when a publicly Listed company is an affiliate of a parent company and/or other major stockholder.
22.58 (2.14)
[0.97]
Tokyo Stock Exchange, First Section
Mitsui Fudosan Co., Ltd.
Disclosed when a publicly Listed company is an affiliate of a parent company and/or other major shareholder.
15.98 (0.02)
[0.45]
Tokyo Stock Exchange, First Section Osaka Securities Exchange, First Section
Notes: 1. Figures in parentheses in the Voting Rights column indicate percentage of indirect ownership and are included in the total percentage of voting rights.
2. Figures in brackets in the Voting Rights column indicate percentage of voting rights associated with shares held in trust accounts, and are in addition to the total percentage of voting rights.
B. Official Name of the Parent Company and/or Major Stockholder that Exerts Material Influence on Oriental
Land Co., Ltd., a Publicly Listed Company
Company Name Reason for Influence Keisei Electric Railway
Co., Ltd. Keisei Electric Railway Co., Ltd. is the major stockholder of Oriental Land Co., Ltd., controlling 20.43 percent of voting rights.
C. Relationship of Publicly Listed Company with Parent Companies and/or Major Stockholders, including
Position within Corporate Group Keisei Electric Railway Co., Ltd. controls 20.43 percent of voting rights, and Mitsui Fudosan Co., Ltd. controls 15.96 percent of voting rights. Oriental Land Co., Ltd. has two outside directors and three outside auditors. Two are directors of Keisei Electric Railway Co., Ltd.; one is a former directors of Keisei Electric Railway Co., Ltd. and two are directors of Mitsui Fudosan Co., Ltd. Oriental Land Co., Ltd. aims to vitalize its Board of Directors and Board of Auditors by including external viewpoints. D. Transactions with Parent Companies and/or Major Stockholders Keisei Electric Railway Co., Ltd. contributes to rental for single employee dormitory, and Mitsui Fudosan Co., Ltd. is an official sponsor of Tokyo Disneyland. However, the amount of each of these related party transactions is not reported, because it is not material.

7
3. Corporate Results and Financial Position (1) Overview of business results A. Summary of Consolidated Results for the Interim Period Ended September 30, 2005
(Millions of yen)
(Consolidated) Interim period ended Sept. 30, 2005
Interim period ended Sept. 30 2004
Increase (decrease)
Change from previous period (%)
Revenues 156,291 157,197 (905) (0.6) Operating Income 11,381 14,296 (2,914) (20.4) Ordinary Income 9,737 13,503 (3,765) (27.9) Net Income 5,515 7,187 (1,672) (23.3)
In the Theme Park Segment, the Group’s core business, we introduced the new attraction “Raging Spirits” at Tokyo DisneySea and aggressively implemented other new events at the two theme parks. In addition, we offered “theme resort” appeal through implementation of business initiatives that capitalized on seasonal products and took advantage of the unique features of the two Disney hotels, Ikspiari and other facilities. However, due to factors including Expo 2005 in Aichi, Japan, which began in March 2005, total attendance at the two theme parks decreased. As a result of the above, on a consolidated basis, revenues for the interim period were ¥156,291 million (down 0.6 percent compared with the same period of the previous fiscal year), operating income was ¥11,381 million (down 20.4 percent), ordinary income was ¥9,737 million (down 27.9 percent) and net income was ¥5,515 million (down 23.3 percent) B. Income Analysis [Revenues] Revenues were ¥156,291 million (down 0.6 percent compared with the same period of the previous fiscal year). Although the Palm & Fountain Terrace Hotel, which opened in February 2005, contributed to results for the period, and revenues per guest were slightly higher than in the same period of the previous fiscal year, total attendance of the two theme parks decreased due to factors including the Aichi Expo, and revenues of the Retail Business decreased. [Operating Income] Cost of revenues was ¥129,022 million (up 1.0 percent compared with the same period of the previous fiscal year). The operation of the Palm & Fountain Terrace Hotel generated operating expenses, and production expenses for entertainments and shows increased due to the larger scale of special events and other factors. Selling, general and administrative expenses were ¥15,887 million (up 5.0 percent) due to factors including higher personnel expenses due to reclassifications in connection with organizational reforms As a result of the above, operating income was ¥11,381 million (down 20.4 percent). [Ordinary Income] Nonoperating income was ¥783 million (down 67.6 percent compared with the same period of the previous fiscal year), due to factors including the absence of investment income in connection with the expiration of leveraged-lease investment recorded in the same period of the previous fiscal year. Nonoperating expenses were ¥2,427 million (down 24.3 percent), due to factors including the absence of equity in loss of affiliates recorded in the same period of the previous fiscal year. As a result of the above, ordinary income was ¥9,737 million (down 27.9 percent).

8
[Net Income] Net income was ¥5,515 million (down 23.3 percent compared with the same period of the previous fiscal year). Despite incurring an extraordinary loss on employee retirement benefit expenses in connection with a change in the retirement benefit system, the company did not record the extraordinary loss on one-time payment of the excess of cost over book value of affiliated company accounted for by the equity method that it recorded in the same period of the previous fiscal year. C. Summary of Results by Segment
Revenues (Sales to Outside Customers) (Millions of yen)
Interim period endedSept. 30, 2005
Interim period endedSept. 30, 2004
Increase (decrease)
Change from previous period (%)
Theme Parks 129,237 131,352 (2,114) (1.6) Commercial Facilities 10,711 10,792 (81) (0.8)
Retail Business 10,467 11,246 (778) (6.9) Other Businesses 5,874 3,806 2,068 54.3 Total 156,291 157,197 (905) (0.6)
Operating Income (Millions of yen)
Interim period endedSept. 30, 2005
Interim period endedSept. 30, 2004
Increase (decrease)
Change from previous period (%)
Theme Parks 9,739 11,247 (1,508) (13.4) Commercial Facilities 925 1,153 (228) (19.8)
Retail Business 511 1,426 (914) (64.1) Other Businesses 145 292 (146) (50.2) Eliminations and Corporate 59 175 (116) (66.3)
Total 11,381 14,296 (2,914) (20.4)
[Theme Park Segment] At Tokyo Disneyland, we conducted various special events including “Disney’s Rock Around The Mouse,” an enjoyable taste of America in the 1950s, starting in April; “Blazing Rhythms,” a popular annual event, from July; and “Disney’s Halloween” beginning in September. At Tokyo DisneySea, in July we introduced the first new attraction since the park opened: “Raging Spirits,” a roller coaster attraction that takes guests on a thrilling, high-speed ride through the excavation site of a collapsing stone statue of an ancient god. In addition, in April we introduced the “Ariel’s Greeting Grotto,” a location where guests can meet the character Ariel from the movie The Little Mermaid. We also conducted events including “Aladdin’s Whole New World,” a special event in which Aladdin and the Genie from the Disney movie Aladdin go on an adventure with other Disney characters, in May; and “Cape Cod Jamboree Nights,” a summer festival held annually at a small Cape Cod fishing village, in July. In merchandise sales, at Tokyo Disneyland, sales of regular products including fun caps, headbands that guests can wear to enjoy the park experience and other products were favorable. At Tokyo DisneySea, we sold numerous products related to special events. Among these, a game wagon where players can receive special goods, which was introduced as a new initiative, met with an extremely favorable response. In food and beverage sales, new lunch shows started at two restaurants in Tokyo Disneyland received an extremely positive response. At Tokyo DisneySea, set menus related to special events generated favorable sales, and we opened a counter-service restaurant called “Lost River Cookhouse” beside the new attraction “Raging Spirits,” and a food wagon called “Grotto Goodies” beside the “Ariel’s Greeting Grotto.” However, due to factors including the effects of the Aichi Expo, which opened in March and closed in September 2005, total attendance at the two theme parks for the interim period ended September 30, 2005 was 11,662 thousand (down 3.1 percent compared with the same period of the previous fiscal year).

9
Revenues per guest at the theme parks were approximately ¥9,150 (up 1.2 percent). The main factors in the increase were favorable sales of regular products at Tokyo Disneyland and products related to special events at Tokyo DisneySea. At Tokyo DisneySea Hotel MiraCosta, from April through July we conducted “Tokyo DisneySea Early Entry,” a special program exclusive to Disney hotel guests that allows entry to the park thirty minutes before it opens to the general public. In addition, we aggressively implemented a special menu service at hotel restaurants offering menus linked to events at Tokyo DisneySea. As a result of the above measures, revenues for the Theme Park Segment were ¥129,237 million (down 1.6 percent). Operating income was ¥9,739 million (down 13.4 percent), as decreased cost of ratios for merchandise, food and beverages were countered by increases in entertainment and show production expenses due to the larger scale of special events and in personnel expenses due to changes in the personnel system for part-time employees. [Commercial Facilities Segment] At Ikspiari, we conducted various special events including “Find Your Style!”, an event that began in April offering five lifestyles to mark the 5th year of operations, and promoted tenant turnover. At the Disney Ambassador Hotel, we conducted the “Disney Ambassador Hotel ‘Gala’ 5th Anniversary,” a large-scale event commemorating the 5th year of hotel operations, and implemented “Tokyo DisneySea Early Entry,” a special program exclusive to Disney hotel guests. In addition, at all restaurants in the Disney Ambassador Hotel, we offered distinctive special menus linked to park events. Moreover, we introduced new programs that capitalized on its features as a Disney hotel including “Castle Photo in Fantasyland,” offering wedding photo sessions inside Tokyo Disneyland. However, the Disney Ambassador Hotel was affected by factors including a slight decline in occupancy rates in the first quarter, and as a result, revenues for the Commercial Facilities Segment were ¥10,711 million (down 0.8 percent compared with the same period of the previous fiscal year) and operating income was ¥925 million (down 19.8 percent). [Retail Business Segment] At Disney Stores throughout Japan, we pursued various business initiatives including implementation of the “Disney PALS Travel Stamp” present campaign offering figure stamps featuring the Disney PALS series of unique-shaped Disney characters; and sales of “5th Anniversary Limited Edition Goods” to commemorate the 5th year of operations at Tokyo Disney Resort Store. In addition, while continuing strategic store closings, we newly opened the Machida 109 Store in April, the Sapporo Pivot Store in August and the Tennoji Mio Store in September. However, due to factors including a decline in the number of store customers as products being developed did not match the needs of customer segment that spends more per purchase, revenues for the Retail Business Segment were ¥10,467 million (down 6.9 percent compared with the same period of the previous fiscal year). Operating income was ¥511 million (down 64.1 percent), due to factors including increases in repair expenses and personnel expenses in connection with opening, closing and renewing stores, in addition to the decrease in revenues. [Other Business Segment] In the hotel business, the Palm & Fountain Terrace Hotel, which opened in February 2005, contributed to results for the period. In the monorail business, the Disney Resort Line continued to draw many guests visiting Tokyo Disney Resort. As a result of the above, revenues for the Other Business Segment were ¥5,874 million (up 54.3 percent compared with the same period of the previous year). However, operating income was ¥145 million (down 50.2 percent) due to factors including operating expenses generated by the Palm & Fountain Terrace Hotel and an increase in animation production expenses in the intellectual property business.

10
D. Forecast for the Fiscal Year Ending March 31, 2006 (Millions of yen)
(Consolidated) Forecast Year
Ending March 31, 2006
Year ended March 31, 2005
Increase (decrease)
Change from previous period (%)
Revenues 334,700 331,094 3,605 1.1 Theme Parks 276,500 276,336 163 0.1 Commercial Facilities 22,700 22,237 462 2.1 Retail Business 23,000 23,949 (949) (4.0)
Other Businesses 12,500 8,570 3,929 45.8 Operating Income 28,900 34,561 (5,661) (16.4) Ordinary Income 25,000 30,836 (5,836) (18.9) Net Income 14,400 17,224 (2,824) (16.4)
For the fiscal year ending March 31, 2006, we project total consolidated revenues of ¥334,700 million, operating income of ¥28,900 million, ordinary income of ¥25,000 million and net income of ¥14,400 million. [Theme Park Segment] At Tokyo Disneyland, we will continue to conduct various special events. In October, we held “Disney’s Halloween,” which began in September. In addition, starting in November we will hold “Christmas Fantasy,” a popular annual event, and beginning in January we will provide further appeal by offering special events including presenting “Disney Princess Days” and “Cinderellabration: Lights of Romance” at the same time. Moreover, this year we will again hold limited special programs that met with an extremely favorable response in the previous year: the Haunted Mansion “Holiday Nightmare” and the It’s a Small World “Very Merry Holiday.”
At Tokyo DisneySea, in addition to “Dramatic DisneySea 2005 at Tokyo DisneySea,” which was held from September to October, we will also continue to conduct various special events, including “Harborside Christmas” beginning in November, and “Disney’s Rhythms of the World” beginning in February.
As a result of the above measures, total attendance at the two theme parks is projected to be 25 million guests for the full fiscal year. At Tokyo DisneySea Hotel MiraCosta, we will continue to aim for high levels of occupancy rates and revenues per guest room by capitalizing on its qualities as a hotel combined with a theme park. Beginning in January, we will hold the “Disney Hotel Happy Coupon Campaign,” which will provide Disney hotel guests with discounts, presents and other benefits at designated stores including restaurants and Disney shops inside the two Disney hotels, merchandise stores inside the theme parks, the Disney shop “Bon Voyage” in front of Maihama Station and special Ikspiari stores including Disney Store at Tokyo Disney Resort. Based on the above, we project revenues in the Theme Park Segment of ¥276,500 million. [Commercial Facilities Segment] At Ikspiari, we will continue to conduct “Find Your Style!”, an event marking the 5th year of operations. In addition, we will continue aiming to increase the number of guests by introducing original Ikspiari events such as “Piari Christmas” and other highly entertaining events to attract guests in cooperation with Tokyo Disney Resort facilities. At the Disney Ambassador Hotel, we will continue to aim for a high level of occupancy rates and revenues per guest room by capitalizing on its qualities as a Disney hotel. In addition to offering the “Disney Hotel Happy Coupon Campaign” for Disney hotel guests beginning in January, we will conduct events including “Be a Disney Princess,” which will make all female guests feel like princesses, as part of the finale of the “Disney Ambassador Hotel ‘Gala’ 5th Anniversary,” a large-scale event commemorating the 5th year of hotel operations. Based on the above, we project revenues in the Commercial Facilities Segment of ¥22,700 million. [Retail Business Segment] At Disney Stores, we will strengthen sales activities by stimulating demand with gifts linked to events such as Christmas and Valentine’s Day and conducting promotions. In addition, we will open a Kawaguchi Ario Store in late November, bringing the total number of new and existing stores to 52. Furthermore, we introduced “Fantamiliar,” a members’ program that allows real-time

11
understanding of customer needs from guest purchasing histories for use in marketing strategies, at four stores in November, and we will introduce it at all stores from February 2006. Based on the above, we project revenues in the Retail Business Segment of ¥23,000 million. [Other Business Segment] In the hotel business, we will aggressively strengthen promotional activities and enhance sales channels to attract as many guests as possible for the Palm & Fountain Terrace Hotel, which is in its first full year of operations. In the businesses of other subsidiaries, we will make efforts to raise operating efficiency by generating synergy within the Group. Based on the above, we project revenues for the Other Business Segment of ¥12,500 million. (2) Financial Position A. Assets, Liabilities and Stockholders’ Equity [Assets] Total assets at the end of the period were ¥644,463 million (down 2.4 percent compared with the end of the previous fiscal year) Current assets were ¥77,182 million (down 13.9 percent) due to factors including a decrease in cash and time deposits in connection with the redemption of the fifth series of unsecured bonds (¥100 million) in April. Fixed assets were ¥567,273 million (down 0.6 percent). Although construction of new attractions progressed, property and equipment decreased due to depreciation and amortization of Tokyo Disney Resort facilities
[Liabilities] Total liabilities at the end of the interim period were ¥279,018 million (up 3.1 percent compared with the end of the previous fiscal year). Current liabilities were ¥83,550 million (up 10.3 percent). Although the company redeemed the fifth series of unsecured bonds, the second series of unsecured bonds (¥300 million) was reclassified from long-term liabilities to current liabilities. Long-term liabilities were ¥195,467 million (up 0.4 percent) due to factors including an increase in long-term debt (¥310 million) for capital reserve for the share buyback in June, despite the reclassification of the second series of unsecured bonds to current liabilities. Interest-bearing debt at the end of the interim period totaled ¥218,382 million (up 7.9 percent).
[Stockholders’ Equity] Total stockholders’ equity at the end of the interim period was ¥365,341 million (down 6.2 percent compared with the end of the previous fiscal year) due to factors including a decrease in the number of outstanding shares as a result of the share buyback, despite an increase in retained earnings, and the stockholders’ equity ratio was 56.7 percent (down 2.3 percentage points compared with the end of the previous fiscal year).

12
B. Cash Flows Cash and cash equivalents at the end of the interim period decreased ¥15,851 million from the beginning of the period to ¥42,725 million, as cash derived from operating activities and the sale and redemption of marketable securities was used to cover funds for new investments in or renewal and improvement of Tokyo Disney Resort facilities and to repay interest-bearing debt. [Cash Flows from Operating Activities] Income before income taxes for the interim period decreased compared with the same period of the previous fiscal year. In addition, payment of consumption taxes decreased. As a result, net cash provided by operating activities was ¥21,785 million (down ¥994 million compared with the same period of the previous fiscal year).
[Cash Flows from Investing Activities] Due to the absence in the interim period of the sale and redemption of marketable securities to fund the redemption of bonds (third series of unsecured bonds, ¥200 million) during the same period of the previous year, proceeds from sale and redemption of marketable securities decreased. At the same time, expenditures for new investments in or renewal and improvement of Tokyo Disney Resort facilities increased compared with the same period of the previous fiscal year. As a result, net cash used in investing activities was ¥21,337 million (down ¥27,634 million compared with the same period of the previous fiscal year).
[Cash Flows from Financing Activities] Net cash used in financing activities was ¥16,299 million (down ¥1,696 million compared with the same period of the previous fiscal year) due to the continuing steady redemption of bonds and repayment of debt, despite the absence of proceeds from the issuance of the sixth series of unsecured bonds that were recorded in the same period of the previous fiscal year. Trends in cash flow indicators are as follows:
Year ended March 31, 2004
Year ended March 31, 2005
Year ending March 31, 2006
Interim Year-end Interim Year-end Interim Stockholders’ equity ratio (%) 56.2 57.1 59.5 59.0 56.7 Stockholders’ equity ratio on
market value basis (%) 92.0 113.2 104.8 106.2 95.8
Debt repayment period (years) 4.7 3.4 4.3 3.4 5.0 Interest-coverage ratio (times) 10.3 14.0 11.5 15.4 11.2
Notes: Stockholders’ equity ratio: Stockholders’ equity/Total assets Stockholders’ equity ratio on market value basis: Total market value of stock/Total assets Debt repayment period: Interest-bearing debt/Cash flows from operations Interest-coverage ratio: Cash flows from operations/Interest paid
* All indicators are calculated from financial figures on a consolidated basis. * Total market value of stock is calculated by multiplying the total number of shares outstanding at the end of the
period (excluding treasury stock) by the closing stock price at the end of the period. * Cash flows from operations are cash flows from operating activities stated in the consolidated statements of c flows. * Interest-bearing debt includes all liabilities stated on the balance sheet on which interest is paid. * Debt repayment period for interim periods is calculated by multiplying cash flows from operations by two for
conversion to full year period. * Interest paid is as stated on the consolidated statements of cash flows.

13
C. Business Risk
Among matters concerning performance, financial and other information appearing in this document, the following risks may exert an important influence on the decisions of investors. Statements concerning the future in these Consolidated Financial Statements and Nonconsolidated Financial Statements represent the judgment of the Oriental Land Group as of November 8, 2005, the date of release. [Influence of Weather] In the Theme Park business, the Oriental Land Group’s core business, the number of guests to the theme parks is easily influenced by the weather (climate and temperature, etc.). Consequently, an extended period of inclement weather may exert an effect on the performance of the Oriental Land Group by decreasing the number of guests. [Influence of Natural Disasters] Due to the concentration of Oriental Land Group’s business infrastructure in Maihama, a disaster in the Maihama area could lead to adverse effects. Although the Company has given sufficient consideration to disaster resistance at all Tokyo Disney Resort facilities, there is a possibility that in the event of a disaster the damage caused to facilities and public transportation and the likely drop in consumer confidence would lead to a temporary decrease in the number of guests, adversely affecting performance. [Influence of Product Deficiencies and Problems] An incident (including attraction incidents, product liability or product tampering) involving the products and services of the core theme park business (including attractions, products and foods) could entail serious harm to the guests who are customers, and could result in material costs from factors, including decreased trust in the Group’s priority on safety, damage to the Group brand and lawsuits, that could exert an effect on the performance of the Oriental Land Group. [Handling of Internal Information] The Oriental Land Group takes full precautions in its business activities to prevent avoidable leaks of the personal information it maintains on guests and the proprietary information it maintains concerning business operations. These precautionary measures include strengthening surveillance systems for internal networks and limiting access to information. However, unforeseeable or unexpected instances of hacking of internal information, misuse of internal databases, leaks or falsification could lead to a decrease in trust in the Oriental Land Group or other negative consequences including lawsuits involving large expenses that may exert a material impact on the performance of the Group.

14
4. Interim Consolidated Financial Statements (1) Interim Consolidated Balance Sheets
(Millions of yen) Interim 2006
(at Sept. 30, 2005) Interim 2005
(at Sept. 30, 2004) Increase
(decrease) Fiscal 2005
(at March 31, 2005)
Amount % Amount % Amount Amount %
ASSETS
I. Current assets
1. Cash and time deposits
2. Trade notes and receivables
3. Marketable securities
4. Inventories
5. Others
6. Allowance for doubtful receivables
34,326
9,292
10,599
9,230
13,735
(0)
37,926
8,149
14,901
8,149
8,919
(0)
(3,600)
1,143
(4,302)
1,080
4,816
0
47,678
11,455
10,048
8,099
12,335
(1)
Total current assets 77,182 12.0 78,045 12.3 (862) 89,616 13.6
II. Fixed assets
(1) Property and equipment
1. Buildings and structures
2. Machinery and delivery equipment
3. Land
4. Construction in progress
5. Others
320,729
68,566
92,015
13,771
19,106
321,434
78,039
77,053
11,308
22,562
323,440
72,442
91,974
12,100
20,763
Total property and equipment 514,189 79.8 510,399 80.1 3,790 520,721 78.9
(2) Intangible fixed assets
1. Goodwill
2. Others
2,157
10,004
2,288
9,920
2,222
9,392
Total intangible fixed assets 12,161 1.9 12,208 1.9 (47) 11,615 1.7
(3) Investments and other assets
1. Others *3
2. Allowance for doubtful receivables
41,109
(187)
36,798
(215)
38,439
(181)
Total investments and other assets 40,922 6.3 36,582 5.7 4,339 38,258 5.8
Total fixed assets 567,273 88.0 559,190 87.7 8,082 570,594 86.4
III. Deferred assets 7 0.0 261 0.0 (254) 13 0.0
Total assets 644,463 100.0 637,498 100.0 6,964 660,224 100.0

15
(Millions of yen)
Interim 2006 (at Sept. 30, 2005)
Interim 2005 (at Sept. 30, 2004)
Increase (decrease)
Fiscal 2005 (at March 31, 2005)
Amount % Amount % Amount Amount %
LIABILITIES
I. Current liabilities
1. Notes and accounts payable
2. Current portion of bonds
3. Current portion of long-term debt
4. Accrued income taxes
5. Others
12,710
30,000
800
3,353
36,686
12,826
10,000
13,500
4,647
38,190
(115)
20,000
(12,700)
(1,294)
(1,503)
14,585
10,000
5,200
7,280
38,666
Total current liabilities 83,550 13.0 79,164 12.4 4,386 75,732 11.5
II. Long-term liabilities
1. Bonds
2. Long-term debt
3. Reserve for employee retirement benefits
4. Retirement allowances for directors
5. Others
120,000
50,000
2,243
—
23,224
150,000
3,800
2,055
515
22,741
(30,000)
46,200
187
(515)
482
150,000
19,000
2,052
557
23,168
Total long-term liabilities 195,467 30.3 179,112 28.1 16,354 194,778 29.5
Total liabilities 279,018 43.3 258,277 40.5 20,740 270,510 41.0
MINORITY INTERESTS
Minority interests 102 0.0 108 0.0 (5) 107 0.0
STOCKHOLDERS’ EQUITY
I. Common stock 63,201 9.8 63,201 9.9 — 63,201 9.6
II. Capital surplus 111,403 17.3 111,403 17.5 — 111,403 16.9
III. Earned surplus 214,153 33.2 201,955 31.7 12,197 210,725 31.9
IV. Net unrealized holding gains on securities 6,847
1.1
2,562
0.4
4,285 4,288
0.6
V. Treasury stock (30,263) (4.7) (9) (0.0) (30,253) (11) (0.0)
Total stockholders’ equity 365,341 56.7 379,112 59.5 (13,770) 389,606 59.0
Total liabilities, minority interests and stockholders’ equity 644,463
100.0
637,498
100.0
6,964 660,224
100.0
16
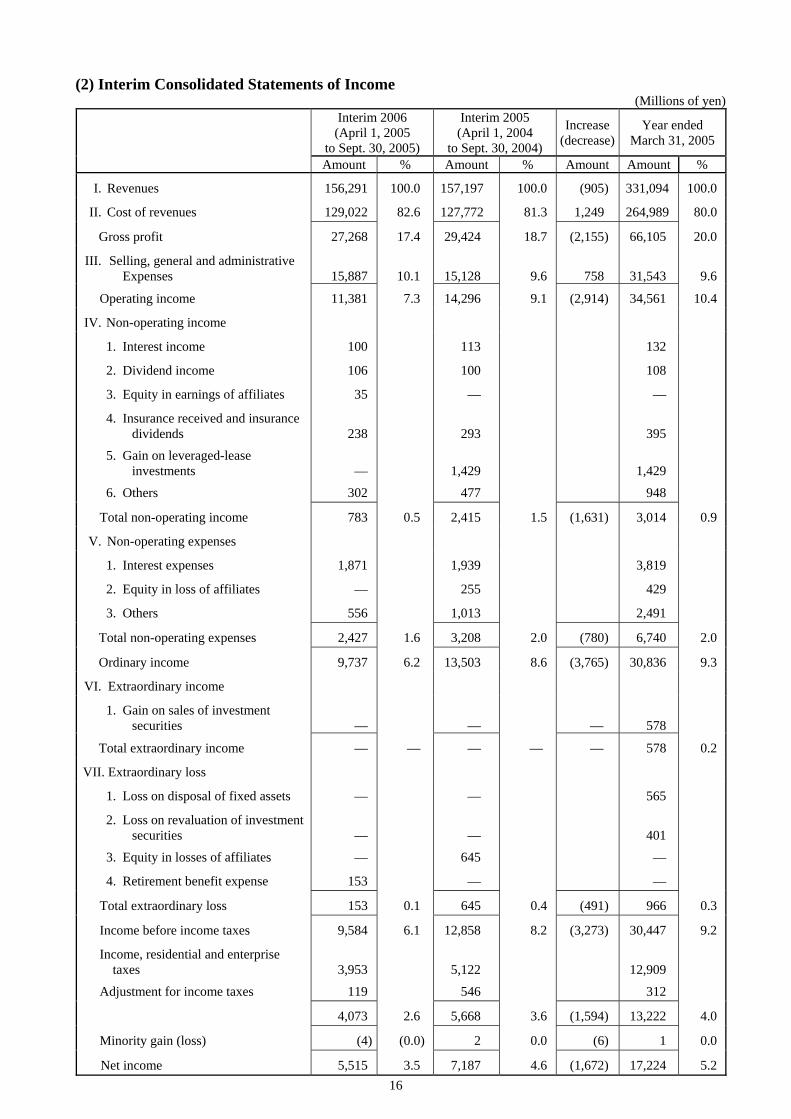
(2) Interim Consolidated Statements of Income (Millions of yen)
Interim 2006 (April 1, 2005
to Sept. 30, 2005)
Interim 2005 (April 1, 2004
to Sept. 30, 2004)
Increase (decrease)
Year ended March 31, 2005
Amount % Amount % Amount Amount %
I. Revenues 156,291 100.0 157,197 100.0 (905) 331,094 100.0
II. Cost of revenues 129,022 82.6 127,772 81.3 1,249 264,989 80.0
Gross profit 27,268 17.4 29,424 18.7 (2,155) 66,105 20.0
III. Selling, general and administrative Expenses 15,887
10.1
15,128
9.6
758
31,543
9.6
Operating income 11,381 7.3 14,296 9.1 (2,914) 34,561 10.4
IV. Non-operating income
1. Interest income
2. Dividend income
3. Equity in earnings of affiliates
4. Insurance received and insurance dividends 5. Gain on leveraged-lease investments
6. Others
100
106
35
238
—
302
113
100
—
293
1,429
477
132
108
—
395
1,429
948
Total non-operating income 783 0.5 2,415 1.5 (1,631) 3,014 0.9
V. Non-operating expenses
1. Interest expenses
2. Equity in loss of affiliates
3. Others
1,871
—
556
1,939
255
1,013
3,819
429
2,491
Total non-operating expenses 2,427 1.6 3,208 2.0 (780) 6,740 2.0
Ordinary income 9,737 6.2 13,503 8.6 (3,765) 30,836 9.3
VI. Extraordinary income
1. Gain on sales of investment securities —
—
—
578
Total extraordinary income — — — — — 578 0.2
VII. Extraordinary loss
1. Loss on disposal of fixed assets
2. Loss on revaluation of investment securities
3. Equity in losses of affiliates
4. Retirement benefit expense
—
—
—
153
—
—
645
—
565
401
—
—
Total extraordinary loss 153 0.1 645 0.4 (491) 966 0.3
Income before income taxes
Income, residential and enterprise taxes
Adjustment for income taxes
9,584
3,953
119
6.1
12,858
5,122
546
8.2
(3,273) 30,447
12,909
312
9.2
4,073 2.6 5,668 3.6 (1,594) 13,222 4.0
Minority gain (loss) (4) (0.0) 2 0.0 (6) 1 0.0
Net income 5,515 3.5 7,187 4.6 (1,672) 17,224 5.2

17
(3) Interim Consolidated Statements of Retained Earnings (Millions of yen)
Interim 2006 (April 1, 2005
to Sept. 30, 2005)
Interim 2005 (April 1, 2004
to Sept. 30, 2004)
Increase (decrease)
Year ended March 31, 2005
CAPITAL SURPLUS
I. Capital surplus at beginning of period 111,403 111,403 — 111,403
II. Capital surplus at end of period 111,403 111,403 — 111,403
EARNED SURPLUS
I. Earned surplus at beginning of period
II. Increases in earned surplus
1. Net income
2. Exclusion of an equity method affiliate
210,725
5,515
—
196,354
7,187
—
14,370 196,354
17,224
234
5,515 7,187 (1,672) 17,459
III. Decreases in earned surplus
1. Dividends
2. Bonuses to directors
[Bonuses to corporate auditors included
in above]
2,002
85
[6]
1,501
85
[6]
3,003
85
[6]
Total decreases in earned surplus 2,087 1,586 500 3,088
IV. Earned surplus at end of period 214,153 201,955 12,197 210,725

18
(4) Interim Consolidated Statements of Cash Flows (Millions of yen)
Interim 2006 (April 1, 2005
to Sept. 30, 2005)
Interim 2005 (April 1, 2004
to Sept. 30, 2004)
Increase (decrease)
Year ended March 31, 2005
I. Cash flows from operating activities
1. Income before income taxes
2. Depreciation and amortization, aggregate
3. Amortization of goodwill
4. (Decrease) increase in allowances
5. Interest and dividend income
6. Interest expenses
7. Exchange loss
8. Loss on disposal of fixed assets
9. Gain on sales of investment securities
10. Loss on revaluation of investment securities
11. Equity in losses of affiliates
12. (Increase) decrease in trade receivables
13. (Increase) decrease in inventories
14. Increase (decrease) in accounts payable
15. Decrease (increase) in consumption taxes
16. Others
9,584
21,492
65
(367)
(207)
1,871
(1)
—
—
—
(35)
2,375
(1,131)
(1,696)
109
(816)
12,858
22,181
65
107
(214)
1,939
(34)
—
—
—
901
2,354
(1,575)
(1,019)
(1,026)
(3,343)
(3,273)
(689)
—
(474)
7
(67)
32
—
—
—
(936)
21
444
(676)
1,135
2,526
30,447
44,554
130
113
(241)
3,819
15
565
(578)
401
429
(1,160)
(1,491)
1,272
(1,380)
950
Total adjustments 31,241 33,193 (1,951) 77,849
17. Interest and dividends received
18. Interest paid
19. Income taxes paid
207
(1,949)
(7,714)
222
(1,975)
(8,660)
(15)
25
946
251
(3,879)
(14,306)
Net cash provided by operating activities 21,785 22,780 (994) 59,915

19
(Millions of yen)
Interim 2006 (April 1, 2005
to Sept. 30, 2005)
Interim 2005 (April 1, 2004
to Sept. 30, 2004)
Increase (decrease)
Year ended March 31, 2005
II. Cash flows from investing activities
1. Addition to marketable securities
2. Proceeds from sales of marketable securities
3. Proceeds from maturity of marketable securities 4. Acquisition of fixed assets
5. Proceeds from sales of fixed assets
6. Addition to investment securities 7. Proceeds from sales of investment securities 8. Proceeds from maturity of investment securities
9. Lending of loans
10. Proceeds from collection of loans
11. Purchase of negotiable certificates of deposit
12. Payments for business transfers
13. Others
(5,700)
—
2,149
(14,867)
—
(3,006)
561
3,005
—
2
(1,000)
(835)
(1,647)
(4,199)
4,000
15,784
(11,910)
18
(3,034)
—
6,017
(0)
5
— —
(383)
(1,500)
(4,000)
(13,634) (2,956)
(18)
28
561
(3,012)
0
(3)
(1,000)
(835)
(1,263)
(6,349)
4,000
25,485
(45,946)
18
(3,385)
449
6,067
(1)
14
— —
(1,461)
Net cash used in investing activities (21,337) 6,297 (27,634) (21,110)
III. Cash flows from financing activities
1. Proceeds from long-term debt
2. Repayment of long-term debt
3. Proceeds from issuing bonds
4. Redemption of bonds
5. Dividends paid
6. Purchase of treasury stocks
7. Others
31,000
(4,400)
—
(10,000)
(1,992)
(30,251)
(655)
—
(12,400)
19,998
(20,000)
(1,491)
—
(709)
31,000
8,000
(19,998)
10,000
(501)
(30,251)
53
16,000
(21,500)
19,998
(20,000)
(2,987)
—
(1,340)
Net cash used in financing activities (16,299) (14,602) (1,696) (9,830)
IV. Effect of exchange rate changes on cash and cash equivalents
0
33
(33)
(16)
V. Net (decrease)increase in cash and cash equivalents
(15,851)
14,508
(30,359)
28,957
VI. Cash and cash equivalents at beginning of period
58,577
29,619
28,957
29,619
VII. Cash and cash equivalents at end of period 42,725 44,127 (1,402) 58,577

20
Nonconsolidated Financial Statements for the Interim Period Ended September 30, 2005 These financial statements have been prepared for reference only in accordance November 8, 2005 with accounting principles and practices generally accepted in Japan. Oriental Land Co., Ltd. Stock exchange listing: Tokyo 1-1 Maihama, Urayasu, Chiba 279-8511, Japan Code number: 4661 http://www.olc.co.jp Board of Directors meeting: November 8, 2005 Representative: Yoshiro Fukushima, President and Representative Director Start of payment of interim dividend: December 6, 2005 Contact: Kenjiro Mizushima, Director, Finance/Accounting Division Interim dividend system: Yes Stock unit system: Yes (1 unit=100 shares) 1. Results for the Interim Period Ended September 30, 2005 (April 1, 2005 - September 30, 2005) (1) Revenues and Income Note: All amounts are rounded down to the nearest million yen. Revenues
(¥ million) Year-on-year change (%)
Operatingincome
(¥ million)
Year-on-year change (%)
Ordinary income
(¥ million)
Year-on-yearchange (%)
Interim period ended Sept. 30, 2005 Interim period ended Sept. 30, 2004
127,151 129,174
(1.6) (4.8)
8,633 10,700
(19.3) (30.6)
11,985 16,151
(25.8) (7.8)
Year ended March 31, 2005 271,435 27,298 30,780 Net income
(¥ million) Year-on-year change (%) Earnings per share (¥)
Interim period ended Sept. 30, 2005 Interim period ended Sept. 30, 2004
9,020 11,280
(20.0) (2.4)
92.86 112.67
Year ended March 31, 2005 19,811 197.03 Notes: 1. Average number of shares outstanding: Interim period ended Sept. 30, 2005: 97,142,578 shares; Interim period ended Sept. 30, 2004: 100,121,182 shares; Year ended March 31, 2005: 100,121,101 shares 2. Changes in accounting methods: None 3. Year-on-year change for revenues, operating income, ordinary income, and net income represent comparisons with the previous
interim period. (2) Dividends
Dividends per share (¥) Interim Year-end
Interim period ended Sept. 30, 2005 Interim period ended Sept. 30, 2004
20.00 15.00
— —
Year ended March 31, 2005 — 35.00
(3) Financial Position Total assets
(¥ million) Shareholders’ equity
(¥ million) Shareholders’ equity
/ total assets (%) Shareholders’ equity
per share (¥) Interim period ended Sept. 30, 2005Interim period ended Sept. 30, 2004
642,249 629,765
371,667 383,672
57.9 60.9
3,907.33 3,832.08
Year ended March 31, 2005 654,511 392,426 60.0 3,918.68 Notes: 1. Number of shares outstanding at end of period: Interim period ended Sept. 30, 2005: 95,120,648 shares;
Interim period ended Sept. 30, 2004: 100,121,126 shares; Year ended March 31, 2005: 100,120,857 shares 2. Number of shares of treasury stock outstanding at end of period: Interim period ended Sept. 30, 2005: 5,001,892 shares; Interim period ended Sept. 30, 2004: 1,414 shares; Year ended March 31, 2005: 1,683 shares 2. Projected Results for Fiscal Year Ending March 31, 2006 (April 1, 2005 - March 31, 2006)
Annual dividends per share (¥) Revenues (¥ million)
Ordinary income (¥ million)
Net income (¥ million) Year-end
Year ending March 31, 2006 273,600 23,800 15,800 20.00 40.00 Reference: Estimated earnings per share (full year of the fiscal year ending March 31, 2006): ¥165.21 Cautionary Remark Regarding Forward-Looking Statements Statements made in this document with respect to Oriental Land’s plans, strategies, beliefs and other statements that are not historical facts are forward-looking statements based on the assumptions and beliefs of the Company’s management in light of the information currently available to it and involve risks and uncertainties which may affect the Company’s future performance.

21
5. Interim Nonconsolidated Financial Statements (1) Interim Nonconsolidated Balance Sheets
(Millions of yen) Interim 2006
(at Sept. 30, 2005) Interim 2005
(at Sept. 30, 2004) Increase
(decrease) Fiscal 2005
(at March 31, 2005) Amount % Amount % Amount Amount %
ASSETS
I. Current assets
1. Cash and time deposits
2. Trade receivables
3. Marketable securities
4. Inventories
5. Others
33,147
6,758
10,599
6,507
13,439
36,183
5,735
14,901
5,765
9,689
(3,036)
1,022
(4,302)
741
3,749
46,181
8,426
10,048
5,586
11,040
Total current assets 70,451 11.0 72,276 11.5 (1,824) 81,284 12.4
II. Fixed assets
(1) Property and equipment
1. Buildings
2. Structures
3. Machinery and equipment
4. Land
5. Construction in progress
6. Others
202,922
82,477
59,353
92,344
13,713
20,067
209,508
83,285
66,634
77,382
5,254
25,099
(6,586)
(808)
(7,280)
14,962
8,459
(5,031)
205,493
81,957
62,113
92,304
11,939
22,267
Total property and equipment 470,878 73.3 467,164 74.2 3,714 476,075 72.7
(2) Intangible fixed assets 9,396 1.5 9,536 1.5 (140) 8,838 1.4
(3) Investments and other assets
1. Long-term loans to affiliated companies
2. Investments and other assets
3. Allowance for doubtful receivables
44,00147,702
(183)
37,006 43,992
(212)
6,995 3,710
29
43,21145,277
(177)
Total investments and other assets 91,520 14.2 80,786 12.8 10,734 88,311 13.5
Total fixed assets 571,796 89.0 557,487 88.5 14,308 573,224 87.6
III. Deferred assets 1 0.0 1 0.0 (0) 1 0.0
Total assets 642,249 100.0 629,765 100.0 12,483 654,511 100.0

22
(Millions of yen)
Interim 2006 (at Sept. 30, 2005)
Interim 2005 (at Sept. 30, 2004)
Increase (decrease)
Fiscal 2005 (at March 31, 2005)
Amount % Amount % Amount Amount %
LIABILITIES
I. Current liabilities
1. Accounts payable
2. Current portion of bonds
3. Current portion of long-term debt
4. Accrued income taxes
5. Others
10,871
30,000
800
1,892
35,432
10,617
10,000
13,500
2,998
33,962
253
20,000
(12,700)
(1,106)
1,469
12,340
10,000
5,200
5,641
38,098
Total current liabilities 78,995 12.3 71,078 11.3 7,917 71,280 10.9
II. Long-term liabilities
1. Bonds
2. Long-term debt
3. Reserve for employee retirement benefits
4. Retirement allowances for directors 5. Others
120,000
50,000
1,815
—19,770
150,000
3,800
1,671
515
19,027
(30,000)
46,200
144
(515) 742
150,000
19,000
1,662
55719,584
Total long-term liabilities 191,586 29.8 175,015 27.8 16,571 190,804 29.1
Total liabilities 270,581 42.1 246,093 39.1 24,488 262,084 40.0
STOCKHOLDERS’ EQUITY
I. Common stock 63,201 9.8 63,201 10.0 — 63,201 9.7
II. Capital surplus
1. Additional paid-in capital 111,403 111,403 — 111,403
Total capital surplus 111,403 17.4 111,403 17.7 — 111,403 17.0
III. Earned surplus
1. Legal reserve
2. Voluntary reserve
3. Unappropriated retained earnings
1,142
206,200
13,136
1,142
191,200
14,174
—
15,000
(1,038)
1,142
191,200
21,202
Total earned surplus 220,478 34.3 206,516 32.8 13,961 213,545 32.6
IV. Net unrealized holding gains on securities 6,847
1.1
2,561
0.4
4,286 4,288
0.7
V. Treasury stock (30,263) (4.7) (9) (0.0) (30,253) (11) (0.0)
Total stockholders’ equity 371,667 57.9 383,672 60.9 (12,005) 392,426 60.0
Total liabilities and stockholders’ equity 642,249
100.0
629,765
100.0
12,483 654,511
100.0

23
(2) Interim Nonconsolidated Statements of Income (Millions of yen)
Interim 2006 (April 1, 2005
to Sept. 30, 2005)
Interim 2005 (April 1, 2004
to Sept. 30, 2004)
Increase (decrease)
Year ended March 31, 2005
Amount % Amount % Amount Amount %
I. Revenues 127,151 100.0 129,174 100.0 (2,023) 271,435 100.0
II. Operating expenses
(1) Cost of revenues 111,585 87.8 111,753 86.5 (168) 230,215 84.8
Gross profit 15,566 12.2 17,421 13.5 (1,855) 41,220 15.2
(2) General and administrative expenses 6,933
5.4
6,720
5.2
212
13,921
5.1
Operating income 8,633 6.8 10,700 8.3 (2,067) 27,298 10.1
III. Non-operating income 5,748 4.5 7,955 6.1 (2,206) 8,685 3.2
IV. Non-operating expenses 2,396 1.9 2,504 1.9 (107) 5,203 2.0
Ordinary income 11,985 9.4 16,151 12.5 (4,166) 30,780 11.3
V. Extraordinary income — — — — — 85 0.0
VI. Extraordinary loss 153 0.1 803 0.6 (650) 1,158 0.4
Income before income taxes 11,831 9.3 15,347 11.9 (3,516) 29,707 10.9
Income, residential and enterprise taxes 2,508
3,611
9,692
Adjustment for income taxes 303 456 204
2,811 2.2 4,067 3.2 (1,256) 9,896 3.6
Net income 9,020 7.1 11,280 8.7 (2,260) 19,811 7.3
Retained earning brought forward 4,115 2,893 1,222 2,893
Interim dividend — — — 1,501
Unappropriated retained earnings 13,136 14,174 (1,038) 21,202