consolidated financial statements julius baer group …
TRANSCRIPT

2 CONSOLIDATED FINANCIAL STATEMENTS2 Consolidated income statement3 Consolidated statement of comprehensive income4 Consolidated balance sheet6 Consolidated statement of changes in equity8 Consolidated statement of cash flows
10 SUMMARY OF SIGNIFICANT ACCOUNTING POLICIES
21 COMMENT ON RISK MANAGEMENT21 Risk management framework21 Risk tolerance framework22 Risk governance25 Risk culture26 Group risk landscape26 Capital planning and liquidity contingency plan27 Stress testing28 Risk reporting29 The three lines of defence30 Credit risk33 Market risk35 Treasury risk37 Non-financial risk
39 COMMENT ON CAPITAL MANAGEMENT39 Management of capital including regulatory capital42 Leverage ratio
43 INFORMATION ON THE CONSOLIDATED INCOME STATEMENT
43 Net interest income43 Net commission and fee income44 Net income from financial instruments measured at
FVTPL44 Other ordinary results44 Personnel expenses45 General expenses45 Income taxes
48 INFORMATION ON THE CONSOLIDATED BALANCE SHEET
48 Classification of financial assets and financial liabilities
50 Financial assets and financial liabilities measured at FVTPL
51 Financial assets measured at FVOCI52 Property, equipment and leases54 Goodwill and intangible assets57 Financial liabilities designated at fair value58 Debt issued61 Deferred tax assets62 Deferred tax liabilities63 Provisions68 Other assets68 Other liabilities68 Share capital
69 ADDITIONAL INFORMATION69 Earnings per share and shares outstanding70 Reporting by segment71 Pension plans76 Securities lending and borrowing transactions77 Derivative financial instruments79 Financial instruments – Fair values82 Financial instruments – Fair value determination88 Financial instruments – Expected credit losses 97 Financial instruments – Credit risk analysis98 Financial instruments – Collateral analysis99 Financial instruments – Offsetting 100 Market risk measures103 Interest rate risk measures109 Companies consolidated113 Investments in associates113 Unconsolidated structured entities114 Acquisitions and disposals116 Share-based payments and other
compensation plans120 Assets under management123 Requirements of Swiss banking law123 Events after the balance sheet date
Supporting material for the full-year results presentation of 1 February 2021.
CONSOLIDATED FINANCIAL STATEMENTS JULIUS BAER GROUP 2020 (AUDITED)

ConSolidated FinanCial StatementSFINANCIAL STATEMENTS JULIUS BAER GROUP 2020
2
CONSOLIDATED FINANCIAL STATEMENTS
CONSOLIDATED INCOME STATEMENT 2020 2019 Change
Note CHF m CHF m %
Interest income on financial instruments
measured at amortised cost or FVOCI 825.2 1,293.1 -36.2
Interest expense on financial instruments
measured at amortised cost 203.5 500.9 -59.4
Net interest income 1 621.7 792.2 -21.5
Commission and fee income 2,250.1 2,139.6 5.2
Commission expense 235.1 216.6 8.5
Net commission and fee income 2 2,015.0 1,922.9 4.8
Net income from financial instruments measured at FVTPL 3 943.5 618.1 52.6
Net credit losses/(recoveries) on financial assets 35.5 9.2 -
Other ordinary results 4 38.4 58.7 -34.6
operating income 3,583.1 3,382.9 5.9
Personnel expenses 5 1,595.5 1,616.2 -1.3
General expenses 6 710.7 850.8 -16.5
Depreciation of property and equipment 11 100.5 100.0 0.5
Amortisation and impairment of customer relationships 12 70.1 81.2 -13.7
Amortisation and impairment of intangible assets 12 260.4 168.5 54.6
operating expenses 2,737.2 2,816.7 -2.8
Profit before taxes 845.9 566.2 49.4
Income taxes 7 147.3 101.2 45.5
net profit 698.6 465.0 50.2
Attributable to:
Shareholders of Julius Baer Group Ltd. 698.0 464.8 50.2
Non-controlling interests 0.6 0.2 -
698.6 465.0 50.2
2020 2019 Change
Note CHF CHF %
Share information
Basic earnings per share (EPS) 20 3.25 2.14 51.5
Diluted earnings per share (EPS) 20 3.23 2.12 52.2
ConSolidated FinanCial StatementSFINANCIAL STATEMENTS JULIUS BAER GROUP 2020
3
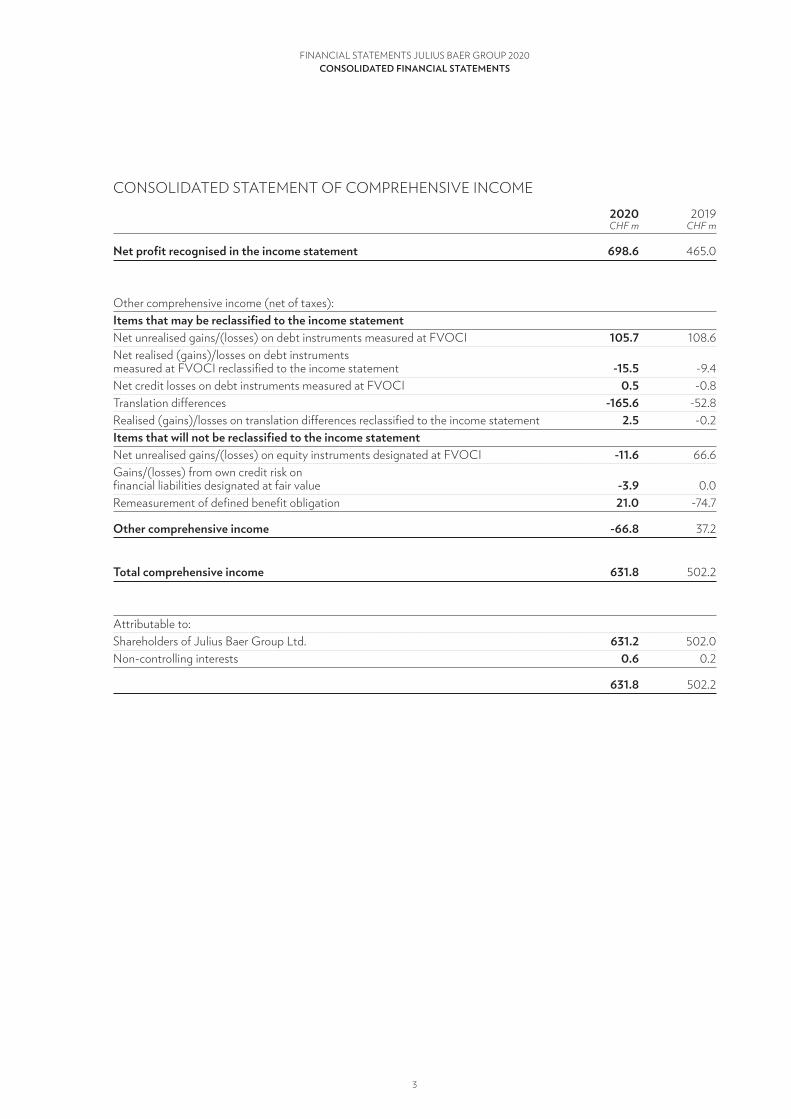
CONSOLIDATED STATEMENT OF COMPREHENSIVE INCOME 2020 2019
CHF m CHF m
net profit recognised in the income statement 698.6 465.0
Other comprehensive income (net of taxes):
items that may be reclassified to the income statement
Net unrealised gains/(losses) on debt instruments measured at FVOCI 105.7 108.6
Net realised (gains)/losses on debt instruments
measured at FVOCI reclassified to the income statement -15.5 -9.4
Net credit losses on debt instruments measured at FVOCI 0.5 -0.8
Translation differences -165.6 -52.8
Realised (gains)/losses on translation differences reclassified to the income statement 2.5 -0.2
items that will not be reclassified to the income statement
Net unrealised gains/(losses) on equity instruments designated at FVOCI -11.6 66.6
Gains/(losses) from own credit risk on
financial liabilities designated at fair value -3.9 0.0
Remeasurement of defined benefit obligation 21.0 -74.7
other comprehensive income -66.8 37.2
total comprehensive income 631.8 502.2
Attributable to:
Shareholders of Julius Baer Group Ltd. 631.2 502.0
Non-controlling interests 0.6 0.2
631.8 502.2

ConSolidated FinanCial StatementSFINANCIAL STATEMENTS JULIUS BAER GROUP 2020
4
CONSOLIDATED BALANCE SHEET 31.12.2020 31.12.2019
Note CHF m CHF m
assets
Cash 14,544.4 10,097.0
Due from banks 7,349.9 7,082.5
Loans 27 47,207.6 48,427.3
Financial assets measured at FVTPL 9/26 13,429.8 13,776.2
Derivative financial instruments 25 2,562.3 1,630.7
Financial assets designated at fair value 26 269.6 305.0
Financial assets measured at FVOCI 10/27 13,796.4 13,166.2
Investments in associates 30 21.2 23.3
Property and equipment 11 580.5 612.9
Goodwill and other intangible assets 12 2,637.4 2,866.1
Accrued income and prepaid expenses 363.7 397.0
Deferred tax assets 16 20.1 16.4
Other assets 18 6,354.1 3,634.5
total assets 109,137.0 102,035.2

ConSolidated FinanCial StatementSFINANCIAL STATEMENTS JULIUS BAER GROUP 2020
5
31.12.2020 31.12.2019
Note CHF m CHF m
liabilities and equity
Due to banks 5,087.9 3,160.0
Due to customers 77,784.5 72,913.1
Financial liabilities measured at FVTPL 9/26 896.5 613.8
Derivative financial instruments 25 2,554.6 2,120.8
Financial liabilities designated at fair value 14 13,154.8 13,281.1
Debt issued 15 1,478.2 1,893.0
Accrued expenses and deferred income 688.0 746.1
Current tax liabilities 209.8 205.3
Deferred tax liabilities 16 74.5 68.8
Provisions 17 115.9 201.3
Other liabilities 18 658.1 642.7
Total liabilities 102,702.8 95,845.8
Share capital 19 4.5 4.5
Retained earnings 6,931.9 6,557.4
Other components of equity -106.1 -18.4
Treasury shares -404.7 -363.2
Equity attributable to shareholders of Julius Baer Group Ltd. 6,425.6 6,180.2
Non-controlling interests 8.6 9.2
Total equity 6,434.1 6,189.4
total liabilities and equity 109,137.0 102,035.2
ConSolidated FinanCial StatementSFINANCIAL STATEMENTS JULIUS BAER GROUP 2020
6
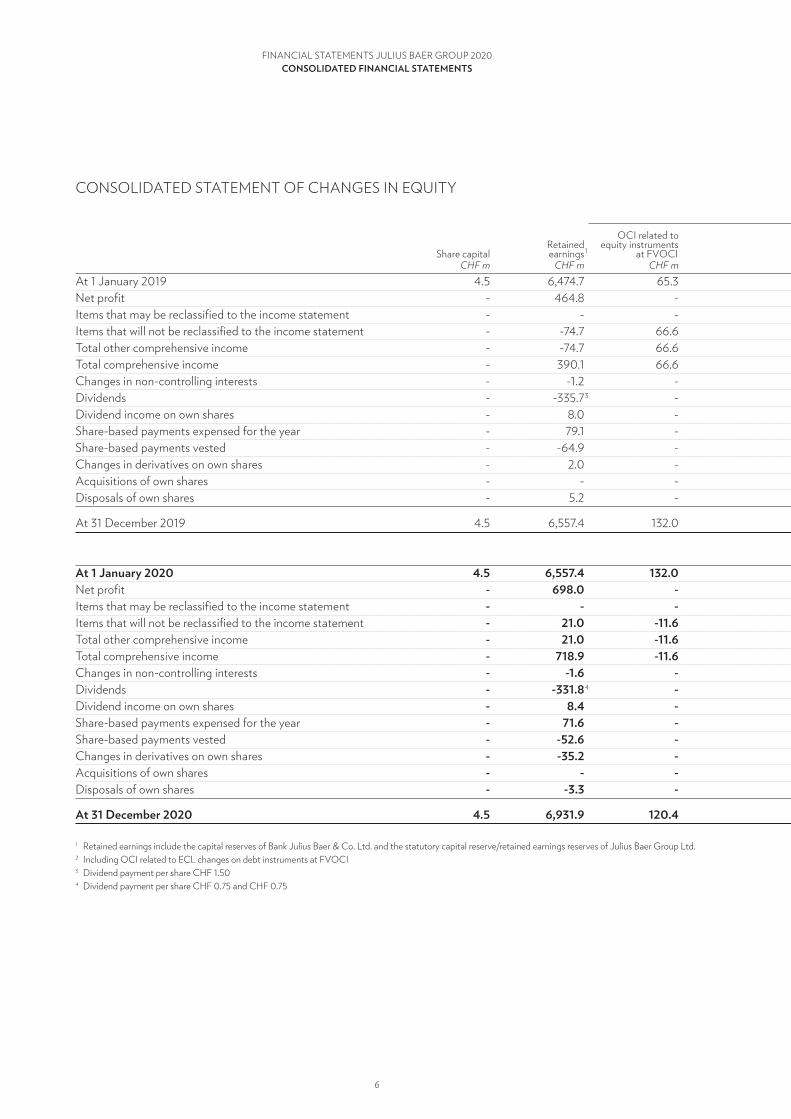
CONSOLIDATED STATEMENT OF CHANGES IN EQUITY Other components of equity
OCI related to OCI related to Own credit risk on Equity attributable
Retained equity instruments debt instruments financial liabilities Translation Treasury to shareholders of Non-controlling total
Share capital earnings 1 at FVOCI at FVOCI 2 designated at FV differences shares Julius Baer Group Ltd. interests equity
CHF m CHF m CHF m CHF m CHF m CHF m CHF m CHF m CHF m CHF m
At 1 January 2019 4.5 6,474.7 65.3 -64.9 0.0 -130.8 -308.9 6,039.9 1.9 6,041.9
Net profit - 464.8 - - - - - 464.8 0.2 465.0
Items that may be reclassified to the income statement - - - 98.4 - -53.1 - 45.3 -0.0 45.3
Items that will not be reclassified to the income statement - -74.7 66.6 - - - - -8.0 - -8.0
Total other comprehensive income - -74.7 66.6 98.4 - -53.1 - 37.2 -0.0 37.2
Total comprehensive income - 390.1 66.6 98.4 - -53.1 - 502.0 0.2 502.2
Changes in non-controlling interests - -1.2 - - - - - -1.2 8.8 7.5
Dividends - -335.7 3 - - - - - -335.7 -1.7 -337.5
Dividend income on own shares - 8.0 - - - - - 8.0 - 8.0
Share-based payments expensed for the year - 79.1 - - - - - 79.1 - 79.1
Share-based payments vested - -64.9 - - - - 64.9 - - -
Changes in derivatives on own shares - 2.0 - - - - 56.0 58.0 - 58.0
Acquisitions of own shares - - - - - - -394.7 -394.7 - -394.7
Disposals of own shares - 5.2 - - - - 219.5 224.7 - 224.7
At 31 December 2019 4.5 6,557.4 132.0 33.5 0.0 -183.9 -363.2 6,180.2 9.2 6,189.4
at 1 January 2020 4.5 6,557.4 132.0 33.5 0.0 -183.9 -363.2 6,180.2 9.2 6,189.4
Net profit - 698.0 - - - - - 698.0 0.6 698.6
Items that may be reclassified to the income statement - - - 90.8 - -163.0 - -72.2 -0.1 -72.3
Items that will not be reclassified to the income statement - 21.0 -11.6 - -3.9 - - 5.5 - 5.5
Total other comprehensive income - 21.0 -11.6 90.8 -3.9 -163.0 - -66.8 -0.1 -66.8
Total comprehensive income - 718.9 -11.6 90.8 -3.9 -163.0 - 631.2 0.6 631.8
Changes in non-controlling interests - -1.6 - - - - - -1.6 1.6 -
Dividends - -331.8 4 - - - - - -331.8 -2.7 -334.6
Dividend income on own shares - 8.4 - - - - - 8.4 - 8.4
Share-based payments expensed for the year - 71.6 - - - - - 71.6 - 71.6
Share-based payments vested - -52.6 - - - - 52.6 - - -
Changes in derivatives on own shares - -35.2 - - - - 42.4 7.3 - 7.3
Acquisitions of own shares - - - - - - -368.4 -368.4 - -368.4
Disposals of own shares - -3.3 - - - - 231.9 228.6 - 228.6
at 31 december 2020 4.5 6,931.9 120.4 124.2 -3.9 -346.9 -404.7 6,425.6 8.6 6,434.1
1 Retained earnings include the capital reserves of Bank Julius Baer & Co. Ltd. and the statutory capital reserve/retained earnings reserves of Julius Baer Group Ltd.2 Including OCI related to ECL changes on debt instruments at FVOCI3 Dividend payment per share CHF 1.504 Dividend payment per share CHF 0.75 and CHF 0.75

ConSolidated FinanCial StatementSFINANCIAL STATEMENTS JULIUS BAER GROUP 2020
7
Other components of equity
OCI related to OCI related to Own credit risk on Equity attributable
Retained equity instruments debt instruments financial liabilities Translation Treasury to shareholders of Non-controlling total
Share capital earnings 1 at FVOCI at FVOCI 2 designated at FV differences shares Julius Baer Group Ltd. interests equity
CHF m CHF m CHF m CHF m CHF m CHF m CHF m CHF m CHF m CHF m
At 1 January 2019 4.5 6,474.7 65.3 -64.9 0.0 -130.8 -308.9 6,039.9 1.9 6,041.9
Net profit - 464.8 - - - - - 464.8 0.2 465.0
Items that may be reclassified to the income statement - - - 98.4 - -53.1 - 45.3 -0.0 45.3
Items that will not be reclassified to the income statement - -74.7 66.6 - - - - -8.0 - -8.0
Total other comprehensive income - -74.7 66.6 98.4 - -53.1 - 37.2 -0.0 37.2
Total comprehensive income - 390.1 66.6 98.4 - -53.1 - 502.0 0.2 502.2
Changes in non-controlling interests - -1.2 - - - - - -1.2 8.8 7.5
Dividends - -335.7 3 - - - - - -335.7 -1.7 -337.5
Dividend income on own shares - 8.0 - - - - - 8.0 - 8.0
Share-based payments expensed for the year - 79.1 - - - - - 79.1 - 79.1
Share-based payments vested - -64.9 - - - - 64.9 - - -
Changes in derivatives on own shares - 2.0 - - - - 56.0 58.0 - 58.0
Acquisitions of own shares - - - - - - -394.7 -394.7 - -394.7
Disposals of own shares - 5.2 - - - - 219.5 224.7 - 224.7
At 31 December 2019 4.5 6,557.4 132.0 33.5 0.0 -183.9 -363.2 6,180.2 9.2 6,189.4
at 1 January 2020 4.5 6,557.4 132.0 33.5 0.0 -183.9 -363.2 6,180.2 9.2 6,189.4
Net profit - 698.0 - - - - - 698.0 0.6 698.6
Items that may be reclassified to the income statement - - - 90.8 - -163.0 - -72.2 -0.1 -72.3
Items that will not be reclassified to the income statement - 21.0 -11.6 - -3.9 - - 5.5 - 5.5
Total other comprehensive income - 21.0 -11.6 90.8 -3.9 -163.0 - -66.8 -0.1 -66.8
Total comprehensive income - 718.9 -11.6 90.8 -3.9 -163.0 - 631.2 0.6 631.8
Changes in non-controlling interests - -1.6 - - - - - -1.6 1.6 -
Dividends - -331.8 4 - - - - - -331.8 -2.7 -334.6
Dividend income on own shares - 8.4 - - - - - 8.4 - 8.4
Share-based payments expensed for the year - 71.6 - - - - - 71.6 - 71.6
Share-based payments vested - -52.6 - - - - 52.6 - - -
Changes in derivatives on own shares - -35.2 - - - - 42.4 7.3 - 7.3
Acquisitions of own shares - - - - - - -368.4 -368.4 - -368.4
Disposals of own shares - -3.3 - - - - 231.9 228.6 - 228.6
at 31 december 2020 4.5 6,931.9 120.4 124.2 -3.9 -346.9 -404.7 6,425.6 8.6 6,434.1
1 Retained earnings include the capital reserves of Bank Julius Baer & Co. Ltd. and the statutory capital reserve/retained earnings reserves of Julius Baer Group Ltd.2 Including OCI related to ECL changes on debt instruments at FVOCI3 Dividend payment per share CHF 1.504 Dividend payment per share CHF 0.75 and CHF 0.75

ConSolidated FinanCial StatementSFINANCIAL STATEMENTS JULIUS BAER GROUP 2020
8
CONSOLIDATED STATEMENT OF CASH FLOWS 2020 2019
CHF m CHF m
Net profit 698.6 465.0
Adjustments to reconcile net profit to cash flow from/(used in) operating activities:
Non-cash items included in net profit and other adjustments:
– Depreciation of property and equipment 100.5 100.0
– Amortisation and impairment of intangible assets 330.5 249.7
– Change in loss allowance 35.5 9.2
– Income from investment in associates - -0.7
– Deferred tax expense/(benefit) -3.7 -26.1
– Net loss/(gain) from investing activities -0.9 -23.3
– Other non-cash income and expenses 71.6 78.0
Net increase/decrease in operating assets and liabilities:
– Net due from/to banks 1,869.3 -3,409.9
– Net financial assets measured at FVTPL and derivative financial instruments 131.5 -3,980.1
– Net loans/due to customers 6,062.5 -1,705.3
– Issuance and repayment of financial liabilities designated at fair value -94.8 -428.7
– Accrued income, prepaid expenses and other assets -2,686.2 -296.3
– Accrued expenses, deferred income, other liabilities and provisions -192.7 68.1
Adjustment for income tax expenses 151.0 127.3
Income taxes paid -145.3 -121.3
Cash flow from operating activities 6,327.4 -8,894.5
Dividend from associates - 0.7
Purchase of property and equipment and intangible assets -185.5 -164.7
Disposal of property and equipment and intangible assets 0.5 0.3
Net (investment in)/divestment of financial assets measured at FVOCI -964.8 2,029.0
Acquisition of subsidiaries and businesses, net of cash and cash equivalents acquired 0.3 -13.5
Deferred payments of acquisition of subsidiaries and associates -13.1 -33.4
Cash flow from investing activities -1,162.6 1,818.4
Net movements in treasury shares and own equity derivative activity -124.1 -103.9
Dividend payments -331.8 -335.7
Changes in debt issued -349.9 392.8
Dividend payment to non-controlling interests -2.7 -1.7
Cash flow from financing activities -808.6 -48.6
net (decrease)/increase in cash and cash equivalents 4,356.2 -7,124.7

ConSolidated FinanCial StatementSFINANCIAL STATEMENTS JULIUS BAER GROUP 2020
9
2020 2019
CHF m CHF m
Cash and cash equivalents at the beginning of the year 18,566.0 25,628.8
Cash flow from operating activities 6,327.4 -8,894.5
Cash flow from investing activities -1,162.6 1,818.4
Cash flow from financing activities -808.6 -48.6
Effects of exchange rate changes on cash and cash equivalents 140.6 62.0
Cash and cash equivalents at the end of the year 23,062.8 18,566.0
31.12.2020 31.12.2019
CHF m CHF m
Cash and cash equivalents are structured as follows:
Cash 14,544.4 10,097.0
Debt instruments measured at fair value through other comprehensive income
(original maturity of less than three months) 1,325.8 1,485.2
Due from banks (original maturity of less than three months) 7,192.6 6,983.8
total 23,062.8 18,566.0
31.12.2020 31.12.2019
CHF m CHF m
additional information
Interest received 897.8 1,400.6
Interest paid -321.9 -746.7
Dividends on equities received (including associates) 225.5 206.0
31.12.2020 31.12.2019
CHF m CHF m
leases
Cash payments – leases -57.2 -59.3
Cash payments – interest paid -5.7 -6.6
Short-term lease payments -3.5 -4.3
total -66.4 -70.2

Summary oF SigniFiCant aCCounting PoliCieSFINANCIAL STATEMENTS JULIUS BAER GROUP 2020
10
SUMMARY OF SIGNIFICANT ACCOUNTING POLICIES
BASIS OF ACCOUNTING
Julius Baer Group Ltd. is a Swiss corporation which is committed to the wealth management business. The consolidated financial statements as at 31 December 2020 comprise those of Julius Baer Group Ltd. and all its subsidiaries (the Group). The Board of Directors approved these financial statements on 29 January 2021. In addition, they are submitted for approval to the Annual General Meeting on 14 April 2021.
Amounts in the consolidated financial statements are stated in Swiss francs. The consolidated financial statements are prepared in accordance with International Financial Reporting Standards (IFRS). Generally, the historical cost principle is applied, with the exception of financial assets measured at fair value through profit or loss or at fair value through other comprehensive income, derivative financial instru ments, as well as certain financial liabilities, which are measured at fair value, and precious metals that are measured at fair value less costs to sell.
USE OF ESTIMATES IN PREPARING THE CONSOLIDATED FINANCIAL STATEMENTS
In preparing the consolidated financial statements, management is required to make estimates and assumptions that affect reported income, expenses, assets, liabilities and disclosure of contingent liabilities. Actual results in future periods could differ from such estimates.
Estimates and assumptions are used mainly in the following areas of the consolidated financial statements and are in part discussed in the corresponding notes: determining fair values of financial instru ments, assessment of the business model when classifying financial instruments, uncertainties in measuring provisions and contingent liabilities, loss allowances (measurement of expected credit losses), pension assets and liabilities (measurement of defined benefit obligation), income taxes ( judgement regarding the interpretation of the applicable tax laws and the respective tax practice, such as
transfer pricing or deductible versus non-deductible items, and anticipation of tax audit issues), share-based payments, goodwill and other intangible assets (determination in a business combination and measurement of recoverable amount) and contingent considerations.
The outbreak of COVID-19 in 2020 has also resulted in enormous economic damage. Global gross domestic product (GDP) has contracted significantly in the first half of the year, and a sharp increase in the volatility of the prices for financial instruments was observed, especially at the beginning of the pandemic. Despite the ongoing impact of COVID-19 on the economies around the world, the Group’s relatively conservative lending policies related to Lombard loans and mortgages, as well as the Group’s treasury policy of investing in high-quality bonds, prevented it from material losses on its financial instruments across 2020.
Despite the widely held belief in a positive development of the world economy and hence the optimistic forecasts, management had to overhaul its significant judgements and assumptions, and the estimation uncertainty increased accordingly. Refer to the Notes on goodwill impairment and credit quality for details on the COVID-19 impact on the Group’s financial statements.
ACCOUNTING POLICIES
All Group companies apply uniform accounting and measurement principles, which have remained the same as in the previous year, except as outlined at the end of this summary of significant accounting policies addressing implemented changes in accounting policies.
Business combinationsIn a business combination, the acquirer obtains control over one or more businesses. The business combination is accounted for using the acquisition method. This involves recog nising the identifiable assets, including previously unrecognised intangible assets, and liabilities of the acquired business at acquisition-date fair value. Any excess of the consideration provided, such as assets or equity instruments issued and measured at acquisition-

Summary oF SigniFiCant aCCounting PoliCieSFINANCIAL STATEMENTS JULIUS BAER GROUP 2020
11
date fair value, over the identifiable net assets acquired, is recognised as goodwill. Transaction costs are expensed as incurred.
Subsidiaries and associates Investees in which Julius Baer Group Ltd. exercises control are fully consolidated. The following three elements constitute control:
– power over the investee;– exposure, or rights, to variable returns from
involvement with the investee; and– the ability to use power over the investee to
affect the amount of the investor’s returns.
If the Group is exposed to all three elements, it controls an investee. The assessment is based on all facts and circumstances and is reassessed as conditions may change.
A complete list of these companies is provided in Note 30A. The financial statements of subsidiaries are included in the consolidated financial statements from the date that control is transferred to the Group until the date that control ceases.
Companies in which Julius Baer Group Ltd. has the ability to exercise significant influence over the financial and operating policies are reported in the consolidated financial statements using the equity method. These associates are initially recorded at cost as of the date of acquisition. Subsequently, the carrying amount is adjusted for the post-acquisition change in the Group’s share of the associate’s net assets.
The effects of all intercompany transactions and balances are eliminated on consolidation. Gains and losses resulting from transactions with associates are recognised only to the extent of the unrelated investor’s interest in the associate.
Foreign currency translationThe Group companies prepare their financial statements in their respective functional currency. The balance sheets of Group companies that are denom inated in foreign currencies are translated into Swiss francs at the closing exchange rates on the balance sheet date. Average exchange rates for the reporting period are used for the income statements. Exchange diffe r ences arising from con solidation using closing and average exchange rates for the reporting period are recognised in other comprehensive income. When a foreign operation is disposed of such that control or significant in flu ence is lost, the cumulative amount in the translation reserve related to that foreign operation is reclas sified to the income statement as part of the gain or loss on disposal.
In the individual financial statements of the Group companies, income and expenses denominated in foreign currencies are translated at the exchange rate on the date of the respective transaction. Assets and liabilities are translated at the closing exchange rate on the balance sheet date. The resulting gains and losses on monetary assets and liabilities are recognised in the income statement as foreign exchange gains/losses.
The following exchange rates are used for the major currencies:
Average exchange
Year-end rates rates for the year
31.12.2020 31.12.2019 2020 2019
USD/CHF 0.8839 0.9682 0.9340 0.9930
EUR/CHF 1.0816 1.0870 1.0705 1.1110
GBP/CHF 1.2083 1.2827 1.2060 1.2720

Summary oF SigniFiCant aCCounting PoliCieSFINANCIAL STATEMENTS JULIUS BAER GROUP 2020
12
revenue recognitionThe Group uses a model for the recognition of revenues which features a contract-based five-step analysis of transactions to determine whether, how much and when revenue is recognised:
– identify the contract(s) with a customer (step 1);– identify the performance obligations in the
contract (step 2);– determine the transaction price (step 3);– allocate the transaction price to the
performance obligations in the contract (step 4);– recognise revenue when (or as) the Group
satisfies a performance obligation (step 5).
The Group recognises fee and commission income related to its wealth management-related services either at the time the service is performed, i.e. upon execution of a trans action, or in the corresponding periods over the life of a contract if services are provided over a certain period of time. In all cases, the fees and commissions must be based on a legally enforceable contract. Income and income com-ponents that are based on performance are recognised to the extent that it is highly probable that a significant reversal will not occur.
Financial instrumentsrecognitionAll financial instruments are initially measured at fair value; for financial instruments not at fair value through profit or loss, eligible transaction costs are included.
Foreign exchange, securities and derivatives transactions are recorded in the balance sheet on trade date. All other financial instruments are recorded on settlement date.
measurementTwo criteria are used to determine how financial assets should be classified and subsequently measured:
– the entity’s business model for managing the financial assets; and
– the contractual cash flow characteristics of the financial asset.
A business model refers to how an entity manages its financial assets in order to achieve a particular business objective and to generate cash flows:
– by collecting contractual cash flows, i.e. cash flows stem primarily from interest payments and repayment of principal;
– by selling the financial assets, i.e. cash flows stem primarily from buying and selling the financial asset; or
– by a combination of the two models above.
The additional criterion for determining the classification of a financial asset is whether the contractual cash flows are solely payments of principal and interest (SPPI criterion). Interest under this model mainly comprises returns for the time value of money, credit risk, administration costs and a profit margin. Interest is accounted for under the effective interest method.
Based on the analysis of the business model and the nature of the contractual cash flows, a financial asset is allocated at initial recognition to one of the three principal classification categories and subsequently measured at either:
– amortised cost;– fair value through other comprehensive income
(FVOCI); or– fair value through profit or loss (FVTPL).
Amortised cost: A debt instrument is measured at amortised cost if the following conditions are fulfilled:
– it is held within a business model whose objective is to hold financial assets in order to collect contractual cash flows; and
– it meets the SPPI criterion.
The Group originates Lombard and mortgage loans related to its business with wealth management clients. Such loans are held to maturity and to collect the contractual interests during the loan term. In addition, they fulfil the SPPI criterion. The Group’s loans are therefore measured at amortised cost.

Summary oF SigniFiCant aCCounting PoliCieSFINANCIAL STATEMENTS JULIUS BAER GROUP 2020
13
The Group holds balances with other banks, which are accounted for at amortised cost if the above conditions are fulfilled.
Fair value through other comprehensive income (FVOCI): A debt instrument is measured at fair value through other comprehensive income if it meets the following conditions:
– it is held within a business model in which assets are managed both in order to collect contractual cash flows and for sale; and
– it meets the SPPI criterion.
The Group acquires debt instruments (bonds, money market instruments) for its asset and liability man -age ment purposes, i.e. to collect the contractual cash flows, and/or for sale. The Group’s debt instruments in this portfolio are therefore measured at fair value through other comprehensive income if in addition the SPPI criterion is fulfilled as well.
Fair value through profit or loss (FVTPL): All financial assets which do not meet the SPPI criterion and/or are not held in a business model ‘held to collect’ or ‘held to collect or for sale’ are measured at fair value through profit or loss.
The Group applies this measurement principle to its trading portfolio, its derivatives and some financial instruments mandatorily measured at FVTPL.
In addition, at initial recognition, an entity has the option to irrevocably designate financial instruments as at FVTPL if doing so eliminates or significantly reduces a measurement or recognition inconsistency (an accounting mismatch) that would otherwise arise from measuring financial assets or liabilities, or recognise the gains or losses on them, on different bases.
The Group applies this fair value option to certain financial assets related to its issued structured notes.
Equity instruments: Equity instruments are generally accounted for at fair value through profit or loss. However, at initial recognition, an entity may make an irrevocable election, on an instrument-by-instrument basis, to present in other comprehensive income (OCI) changes in the fair value of the equity instrument that is not held for trading.
The Group applies the OCI option to its invest-ments in service providers which are necessary to run the Group’s daily business. All other equity investments, including the equities held for trading purposes, are measured at FVTPL.
Financial liabilities: Financial liabilities are classified and subsequently measured at amortised cost, except for instruments that are held for trading (including derivatives) which are recognised at FVTPL.
The Group applies this measurement principle to its amounts due to banks and customers (deposits) and its debt issued (bonds).
Financial liabilities may initially be desig nated as at fair value through profit or loss (the fair value option – see conditions above).
This fair value option for financial liabilities requires that the amount of change in fair value attributable to changes in the own credit risk of the liability be presented in other comprehensive income (OCI) without reclassi fi cation to the income statement. The remaining amount of total gain or loss is included in the income statement.
The Group applies the fair value option for its issued structured notes.
Summary oF SigniFiCant aCCounting PoliCieSFINANCIAL STATEMENTS JULIUS BAER GROUP 2020
14
expected credit losses (eCl)General ECL model: An entity is required to recognise expected credit losses at initial recognition of any financial instrument and to update the amount of expected credit losses recognised at each reporting date to reflect changes in the credit risk of the respective instruments.
In general, the expected credit loss model uses a dual measurement approach:
– if the credit risk of a debt instrument has not increased significantly since its initial recognition, the debt instrument will attract a loss allowance equal to the 12-month expected credit losses (‘stage 1’ ECL);
– if the credit risk of a debt instrument has increased significantly since its initial recognition, the debt instrument will attract a loss allowance equal to lifetime expected credit losses (‘stage 2’ ECL) or the debt instrument is impaired (‘stage 3’ ECL).
At initial recognition, the Group classifies all financial assets in stage 1, as it does not acquire or originate credit-impaired debt instruments.
Significant increase: If a significant increase in credit risk has occurred to the financial instrument, the instrument moves from stage 1 to stage 2. The threshold applied varies depending on the original credit quality of the counterparty. For assets with lower default probabilities at origination due to good credit quality of the counterparty, the threshold for a significant increase in credit risk is set at a higher level than for assets with higher default probabilities at origination. This implies that for financial assets with initially lower default probabilities a relatively higher deterioration in credit quality is needed to trigger a significant increase than for those assets with originally higher probabilities of default.
The model is symmetric, meaning that if the transfer condition (significant increase) is no longer met, the financial asset is transferred back into the 12-month expected credit losses category (stage 1).
Measurement of ECL: An entity should measure expected credit losses of a financial instrument in a way that reflects:
– an unbiased and probability-weighted amount that is determined by evaluating a range of possible outcomes, i.e. based on probability of default;
– the time value of money; and – reasonable and supportable information that is
available without undue cost or effort at the reporting date about past events, current conditions and forecast of future economic conditions.
Generally, ECL calculations are based on four components:
– Probability of default (PD),– Exposure at default (EAD),– Loss given default (LGD) and– Discount rate (IR).
These four components are used in the following basic formula: ECL = PD * EAD * LGD * IR
Recognition of the loss allowance and write-offs: The impairment loss recognised in the income statement (net impairment losses/[recoveries] on financial assets) is the amount required to adjust the loss allowances from the previous reporting date to the current reporting date due to the periodic detailed ECL calculation.
In the balance sheet, the loss allowance related to debt instruments measured at amortised cost is deducted directly from the asset. For debt instruments measured at FVOCI, the loss allowance is recognised in other comprehensive income (equity) and therefore does not reduce the carrying amount of the asset in the balance sheet. This ensures that the carrying amount of these assets is always measured at the fair value.
The gross carrying amount of a financial asset is written off when there is no reasonable expectation of recovery of the amount, i.e. the amount out-standing is deemed uncollectible or forgiven. The time of each write-off is individually determined on a case-by-case basis once the Credit Department decides that there is no reasonable expectation of

Summary oF SigniFiCant aCCounting PoliCieSFINANCIAL STATEMENTS JULIUS BAER GROUP 2020
15
recovery. For collateralised loans, only after foreclosure sale of the pledged assets a write-off takes place for any remaining uncovered balance.
CashCash includes notes and coins on hand, as well as balances held with central banks.
Securities lending and borrowing transactionsSecurities lending and borrowing transactions are collateralised by securities or cash. The transactions are usually conducted under standard agreements employed by the market participants; the counter-parties are subject to the Group’s normal credit risk process.
Securities borrowed as well as securities received by the Group as collateral under securities lending transactions are only recorded in the balance sheet if the Group obtains control of the contractual rights (risks and rewards of ownership) associated with these securities. Similarly, securities lent as well as secur ities provided by the Group as collateral under secur ities borrowing transactions are only derecognised from the balance sheet if the Group relinquishes control of the contractual rights associated with these securities. Securities lent and securities provided as collateral that remain in the balance sheet are re measured according to the respective position they are recorded in. The fair values of securities received or provided are monitored daily in order to provide or request additional collateral in accordance with the underlying agreements.
Cash collateral received is recognised with a corresponding obligation to return it, and cash collateral provided is derecognised and a corre s-ponding receivable reflecting the Group’s right to receive it back is recognised.
Fees received or paid in connection with securities lending and borrowing transactions are recognised as commission income or commission expenses on an accrual basis.
repurchase and reverse repurchase transactionsReverse repurchase transactions and repurchase transactions are considered secured financing transactions and are recorded at the value of the cash provided or received. The transactions are generally conducted under standard agreements employed by the market participants; the counter-parties are subject to the Group’s normal credit risk process.
Securities received and securities delivered are only recorded in the balance sheet or derecognised from the balance sheet if control of the contractual rights (risks and rewards of ownership) associated with these securities is relinquished as well. The fair values of the securities received or delivered are monitored daily in order to provide or request additional collateral in accordance with the underlying agreements.
Cash received is recognised with a corresponding obligation to return it, and cash provided is derec og-nised and a corresponding receivable reflecting the Group’s right to receive it back is recognised.
Interest income from reverse repurchase transactions and interest expenses from repurchase transactions are accrued in the corresponding periods over the life of the underlying transactions in the respective interest positions.
derivative financial instruments and hedgingDerivative financial instruments held for trading, including foreign exchange products, interest rate futures, forward rate agreements, currency and interest rate swaps, currency and interest rate options (written options as well as purchased options), are recognised at fair value through profit or loss. In order to calculate the fair value, correspond ing stock exchange prices, dis counted cash flow models and option pricing models are employed. Derivatives are reported as an asset position if their fair value is positive and as a liability position if their fair value is negative. Changes in fair value on trading pos-itions are recognised in net income from financial instruments measured at FVTPL.

Summary oF SigniFiCant aCCounting PoliCieSFINANCIAL STATEMENTS JULIUS BAER GROUP 2020
16
The Group continues to apply IAS 39 for hedge accounting, as permitted by IFRS 9. The Group uses derivative financial instruments for hedging the fair values (fair value hedges) or the net investments in foreign operations (net investment hedges) when transactions meet the specified criteria to obtain the respective hedge accounting treatment. Derivatives categorised as serving such purposes on their trade date are treated as hedging instruments in the financial statements if they fulfil the following criteria:
– existence of documentation that specifies the underlying transaction (balance sheet item or cash flow), the hedging instrument as well as the hedging strategy/relationship;
– effective and reliably measurable elimination of the hedged risks through the hedging transaction during the entire reporting period; and
– sustained high effectiveness of the hedging transaction. A hedge is regarded as highly effective if actual results are within a range of 80% to 125%.
Fair value hedges: Changes in the fair value of derivatives that are designated and qualify as fair value hedges are reported in the income statement. The changes in the fair value of the hedged item that are attributable to the risk hedged with the derivative are reflected in an adjustment to the carrying value of the hedged item and are also recognised in the income statement.
When fair value hedge accounting is discontinued prospectively, any hedging adjustment made previously to a hedged financial instrument is amortised to the income statement over the remaining term to maturity of the hedged item.
Net investment hedges: Derivative instruments or non-derivative financial assets and liabilities may be used and designated as the hedging instrument in a hedge of a net investment in a foreign operation. Gains or losses on the hedging instrument relating to the effective portion of the hedge are recognised in other comprehensive income and reported as translation differences within equity. Any ineffective portion of the changes in the fair value of the derivative is recognised immediately in profit or loss.
The amount recognised in OCI is fully or partially reclassified to profit or loss as a reclassification adjustment on disposal or partial disposal of the foreign operation.
Economic hedges: Certain derivative transactions represent financial hedging transactions and are in line with the risk management principles of the Group. However, in view of the strict and specific guidelines of IFRS, they do not fulfil the criteria to be treated as hedging relationships for accounting purposes. The derivatives are therefore reported as trading positions. Changes in fair value are recognised directly in the income statement in the corresponding period.
Property and equipmentProperty and equipment includes bank premises, IT, communication systems, leasehold improvements as well as other equipment. They are carried at cost less accumulated depreciation and impairment losses. Items of property and equipment are de pre-ciated over their estimated useful lives using the straight-line method.
Bank premises are depreciated over a period of 66 years. Leasehold improvements are depreciated over the shorter of the residual lease term or useful life. IT hardware is depreciated over three years and other items of property and equipment generally over five to ten years.
Leasehold improvements are investments made to customise buildings and offices occupied under lease contracts to make them suitable for the intended purpose. If a leased property must be returned to its original condition at the end of the lease term, the present value of the estimated re instatement costs is capitalised as part of the total leasehold improvement costs. At the same time, a liability for reinstatement costs is recognised to reflect the obligation incurred. The reinstatement costs are recognised in the income statement through depreciation of the capitalised leasehold improvements over their useful life.
Subsequent expenditure on an item of property and equipment is recognised in the carrying value of the item if it is probable that the Group

Summary oF SigniFiCant aCCounting PoliCieSFINANCIAL STATEMENTS JULIUS BAER GROUP 2020
17
will profit from the future economic benefits of the invest ment. Current maintenance and servicing costs are recognised in general expenses.
On each balance sheet date, the items of property and equipment are reviewed for indications of impairment. If such indications exist, it is determined whether the carrying amount of the item is fully recoverable. An impairment loss is recognised if the carrying amount exceeds the recoverable amount.
goodwill and intangible assetsGoodwill and intangible assets are classified into the following categories:
Goodwill: In a business combination, the acquiree’s identifiable assets and liabilities are recognised at their respective fair value at acquisition date. Goodwill is measured as the difference between the sum of the fair value of consideration transferred and the recognised amount of the identifiable assets acquired and liabilities assumed. Goodwill is not amortised; it is tested for impairment annually at the cash-generating-unit level, and an impair ment loss is recognised if the recoverable amount is less than its carrying amount.
Customer relationships: This position comprises long-term customer relationship intangibles from recent business combinations that are initially recognised at fair value at the date of acquisition. Customer relationships are amortised over their estimated useful life not exceeding ten years, using the straight-line method.
Software: The Group capitalises costs relating to the acquisition, installation and development of software if it is probable that the future economic benefits that are attributable to the asset will flow to the Group and that the costs of the asset can be identified and measured reliably. The capitalised software is amortised using the straight-line method over its useful life not exceeding ten years.
On each balance sheet date, the intangible assets with a finite life (customer relationships, software) are reviewed for indications of impairment. If such indications exist, it is determined whether the carrying
amount of the intangible assets is fully recoverable, and an impair ment loss is recognised if the carrying amount exceeds the recoverable amount.
ProvisionsA provision is recognised if, as a result of a past event, the Group has a legal or constructive present obligation existing on the balance sheet date that will probably lead to an outflow of resources and whose amount can be reliably estimated. The amount recognised as a provision is the best estimate of the consideration required to settle the obligation as at the balance sheet date, taking into account the risks and uncertainties related to the obligation. The recognition and release of provisions are recorded in the income statement through general expenses.
Restructuring provisions are recognised if a construct ive obligation is incurred, which requires commencement of an approved, detailed and formal restructuring plan or the announcement of its main features to the affected employees before the balance sheet date.
income taxesIncome tax expense comprises current and deferred taxes. The Group is subject to income taxes in numerous countries. Current income taxes are calculated on the basis of the applicable tax laws of the respective countries and are recognised as expense in the financial year in which the related taxable income arises. Liabilities related to current taxes are recog-nised in the balance sheet as current tax liabilities.
Deferred tax assets and deferred tax liabilities are taken into account for the expected future tax consequences of all temporary differences between the carrying amounts of assets and liabilities for financial reporting purposes and the correspond ing tax values.
Deferred tax assets arising from temporary dif fer ences and from loss carryforwards eligible for offsetting are capitalised if it is likely that sufficient taxable profits will be available against which those diffe r ences or loss carryforwards can be offset. Deferred tax assets are reviewed at each reporting date and are reduced to the extent that it is no longer prob able that the related tax benefit will be realised.

Summary oF SigniFiCant aCCounting PoliCieSFINANCIAL STATEMENTS JULIUS BAER GROUP 2020
18
Deferred tax assets and deferred tax liabilities are calculated at tax rates expected to apply in the period in which the tax assets will be realised or the tax liabilities settled.
Current tax assets and tax liabilities are offset against each other when they refer to the same taxable entity, concern the same tax authority, and an enforceable right to offset exists. The same rule applies to deferred tax assets and liabilities.
Current and deferred taxes are credited or charged directly to equity if the taxes refer to items that are credited or charged directly to equity.
Post-employment benefitsFor defined benefit plans, the net defined benefit liability recognised in other liabilities in the balance sheet is the present value of the defined benefit obligation less the fair value of the plan assets as of the reporting date. The Group applies the projected unit credit method to determine the present value of the defined benefit obligation and the current and past service cost. The corres ponding calculations are carried out by independent qualified actuaries.
All changes in the present value of the defined benefit obligation and in the fair value of the plan assets are recognised in the financial statements immediately in the period they occur. Service costs, including past service costs, and net interest on the net defined benefit liability are recognised in the income statement in personnel expenses. The Group determines the net interest expense based on the net defined benefit liability for the period by apply ing the discount rate used to measure the defined benefit obligation. The remeasurement of the net defined benefit liability which comprises movements in actuarial gains and losses and return on plan assets (excluding net interest cost) is recognised in other compre hensive income.
For defined contribution pension plans, the contributions are expensed when the employees render the corresponding service to the Group.
Share-based paymentsThe Group maintains various share-based payment plans in the form of share plans for its employees. When such payments are made to employees, the
fair value of these payments at grant date serves as the basis for calculating the personnel expenses. Share-based payments that are not subject to any further conditions are expensed immediately at grant date. Share-based payments that are subject to the completion of a service period or to other vesting conditions are expensed over the respective vesting period. The amount recognised as an expense is adjusted to reflect the number of share awards for which the related ser vices and non-market performance vesting conditions are expected to be met.
Share-based payment plans that are settled in own equity instruments (i.e. Julius Baer Group Ltd. shares) result in a corres ponding increase in equity and are not remeasured for subsequent changes in the fair value of the underlying equity instruments.
Share capitalThe share capital comprises all issued, fully paid shares of Julius Baer Group Ltd.
treasury shares and contracts on treasury sharesShares of Julius Baer Group Ltd. held by the Group are classified in equity as treasury shares and accounted for at weighted average cost. The differ ence between the proceeds from sales of treasury shares and their cost (net of taxes, if any) is recognised in retained earnings.
Contracts on shares of Julius Baer Group Ltd. that require settlement in a fixed number of shares for a fixed amount are recognised in treasury shares. Upon settlement of such contracts, the proceeds received (net of costs and any taxes) are recognised in retained earnings.
Contracts on shares of Julius Baer Group Ltd. that must be settled net in cash or that offer a choice of settlement methods are treated as derivative instruments, with changes in fair value recognised in net income from financial instruments measured at FVTPL.
For physically settled written put option contracts, the discounted strike price is deducted from equity and recorded as a liability at initial recognition. The liability is subsequently increased during the

Summary oF SigniFiCant aCCounting PoliCieSFINANCIAL STATEMENTS JULIUS BAER GROUP 2020
19
term of the contract up to the strike price using the effective interest method. Upon settlement of the contract the liability is derecognised.
earnings per share (ePS)Basic consolidated earnings per share is calculated by dividing the net profit for the reporting period attributable to shareholders of Julius Baer Group Ltd. by the weighted average number of shares out stand-ing during the reporting period.
Diluted consolidated earnings per share is calculated using the same method as for basic consolidated earnings per share, with the determinants adjusted to reflect the potential dilution that could occur if outstanding options, warrants, convertible debt securities or other contracts to issue shares were converted or exercised into shares.
Segment reportingDetermination of the operating segments is based on the management approach. The management approach reflects the way in which management organises the entity for making operating decisions and for assessing performance, based on discrete financial information. Therefore, the adoption of the management approach results in the disclosure of information for segments in substantially the same manner as they are reported internally and used by the entity’s chief operating decision maker for purposes of evaluating performance and making resource allocation decisions.
Contingent liabilities and irrevocable commitmentsContingent liabilities and irrevocable commitments are not recognised in the balance sheet. However, if an outflow of resources becomes probable and is a present obligation from a past event that can be reliably measured, a respective liability is recognised.
CHANGES IN ACCOUNTING POLICIES
As of 1 January 2020, the Group applied the following new standards for the first time. All these amendments had no material impact on the Group’s financial statements.
definition of material (amendments to iaS 1 and iaS 8)The amendments clarify the definition of ‘material’: Information is material if omitting, misstating or obscuring it could reasonably be expected to influence decisions that the primary users of general purpose financial statements make on the basis of those financial statements which provide financial information about a specific reporting entity. Information is obscured if it is communicated in a way that would have a similar effect for primary users of financial statements to omitting or misstating that information.
Materiality depends on the nature or magnitude of information, or both. An entity assesses whether information, either individually or in combination with other information, is material in the context of its financial statements as a whole.
interest rate Benchmark reform (amendments to iFrS 9, iaS 39 and iFrS 7)These first-phase amendments related to the interbank offered rates (IBOR) reform provide targeted relief for financial instruments qualifying for hedge accounting in the lead up to the IBOR reform by modifying some specific hedge accounting requirements. More specifically, an entity shall assume that the interest rate benchmark is not altered as a result of the interest rate benchmark reform. In addition, the amendments require companies to provide additional information to investors about their hedging relationships which are directly affected by these uncertainties. The amendments are mandatory and apply to all hedging relationships directly affected by uncertainties related to the IBOR reform.

Summary oF SigniFiCant aCCounting PoliCieSFINANCIAL STATEMENTS JULIUS BAER GROUP 2020
20
definition of a Business (amendments to iFrS 3)The amendments clarify the definition of a business, with the objective of assisting entities to determine whether a transaction should be accounted for as a business combination or as an asset acquisition.
iFrS 9 – expected credit lossesEnd of March 2020, the IASB issued a statement on accounting for expected credit losses (ECL) under IFRS 9 Financial Instruments due to the uncertainty resulting from the COVID-19 pandemic.
The core message that the applied models regarding the determination of the ECL should not be adjusted, but the input factors into the model may have to be adjusted based on management’s judgement, has been considered by the Group. The critical uncertainties existing in particular when assessing future macroeconomic conditions and whether a significant increase in credit risk has occurred, have been addressed accordingly. Refer to Note 27 Financial Instruments – Expected Credit Losses (especially the section Credit Quality Analysis) for the impact of the statement and the COVID-19 outbreak in general on the Group’s credit portfolio.
NEW STANDARDS AND INTER-PRETATIONS NOT YET ADOPTED
Certain new standards, revisions and interpretations of existing standards were published that must be applied in future financial periods. The Group plans not to adopt these in advance. A number of these changes may have an impact on the Group’s consolidated financial statements, as outlined below.
The following amendments may be relevant to the Group:
interest rate Benchmark reform – Phase 2 (amendments to iFrS 9, iaS 39 and iFrS 7 and iFrS 16)These second amendments related to the interbank offered rates (IBOR) reform address issues that might affect financial reporting, including the effects of changes to contractual cash flows or hedging relationships arising from the replacement of an interest rate benchmark with an alternative benchmark rate. The amendments provide practical relief from certain requirements in IFRS 9, IAS 39, IFRS 7 and IFRS 16 relating to changes in the basis for determining contractual cash flows of financial assets, financial liabilities and lease liabilities, and hedge accounting.
The amended standards will be effective 1 January 2021. The amendments are not expected to have a material impact on the Group’s financial statements.

Comment on riSk managementFINANCIAL STATEMENTS JULIUS BAER GROUP 2020
21
COMMENT ON RISK MANAGEMENT
In pursuing its strategy and business, Julius Baer Group (‘the Group’) is exposed to risks, e.g. events which may have an impact on its financial, business, regulatory and reputational standing. Risk
management as a result is an integral part of the Group’s business model and is designed to protect its franchise and reputation.
RISK MANAGEMENT FRAMEWORK
The Group’s Risk Management Framework (‘RMF’) links and integrates all relevant activities, govern-ance and processes of the Group to identify, assess, manage, monitor and report risks across the organisation.
Risk management activities are structured according to the Group’s Risk Categorisation which represents the material risks the organisation is exposed to.
Beside credit, market and treasury risk, the Group is exposed to non-financial risks, covering operational risk, compliance and legal risk, as well as strategic, business and reputational risk. The Risk Categorisation allows for individual assignment of responsibilities to Risk Type Owners (RTO), who maintain the risk management framework of each material risk type by means and in accordance with the RMF.
RISK TOLERANCE FRAMEWORK
Not all risks can be eliminated, fully controlled and mitigated at all times. However, the Group’s Risk Tolerance Framework (‘RTF’) supports and ensures that risk-taking is in line with the strategic objectives and within the Group’s overall risk capacity. The Group’s risk tolerance is defined as the aggregate level of risk, subject to appropriate mitigating actions, that the Group is willing to accept across all relevant risk categories. It is formalised by a set of qualitative risk statements and quantitative risk metrics along the Group’s key risk categories.
The risk capacity describes the maximum level of risk the Group can assume given the Group’s capabilities and resources taking account of capital, earnings and liquidity constraints (financial risk capacity), regulatory requirements and the firm’s reputational standing (regulatory and reputational risk capacity). The latter reflects all relevant laws and regulations that affect the overall business operations and conduct of the Group.

Comment on riSk managementFINANCIAL STATEMENTS JULIUS BAER GROUP 2020
22
Corporate Strategy
risk management Framework
risk Capacity
risk tolerance
risk Strategy Statements
risk tolerance metrics
The key components of the Group’s RTF are illustrated by the following figure:
RISK GOVERNANCE
The Group has established a robust Risk Governance, involving several stakeholders across the organisation and various committees, functions and business units.
The Board of Directors (BoD) is responsible for establishing the strategic course of the Group and the guiding principles for the Group’s corporate culture. It approves the Group-wide RMF and RTF. This ensures that risks are managed effectively at Group level and that suitable processes are in place.
Regular reporting enables the BoD to monitor whether the risk tolerance, policies, instructions and mandates are being complied with and whether they remain appropriate, given the Group’s business model, risk profile and strategy. In addition, the BoD regularly reviews reports analysing the Group’s risk exposure.

Comment on riSk managementFINANCIAL STATEMENTS JULIUS BAER GROUP 2020
23
governance & risk Committee
audit Committee
nomination & Compensation Committee
development & innovation Committee
• Ensuring requirements for proper compliance and the promotion of an adequate compliance/conduct culture and organisation are given the necessary attention
• Assessing the Group’s exposure to compliance/conduct issues as well as the Compliance Framework and related projects to address such matters, in particular as regards topics of AML, KYC, client on-boarding, monitoring and off-boarding, PEPs, economic and trade sanctions, anti-bribery and anti-corruption as well as client tax compliance
• Developing and upholding principles of corporate governance for the Company and the Group• Authorising certain market, credit and financial activities taking into consideration the respective risk
parameters• Ensuring the standards and methodologies for risk control which are employed to comply with
principle and risk profile adopted by the BoD and other bodies
• Examining and assessing compliance with laws and regulations, articles of incorporation, internal regulations and policies
• Discussing the financial statements, the scope and quality of the audit work performed and the appropriateness of the internal control systems (financial and non-financial)
• Drawing up the remuneration principles and policies aligned with the Group’s overall business strategy
• Annually reviewing compensation elements and sharing ownership programmes by considering possible impacts of regulatory developments and stakeholder feedback
• Assisting the BoD in the effective discharge of its responsibilities in accordance with applicable laws and regulations as well as principles of sound corporate governance
• Leading and preparing the long-term succession planning at the level of the BoD, CEO and the other members of the EBG/ExB
• Supporting the Board of Directors in its overall oversight responsibilities relating to long-term transformational challenges, business development, innovation and to respective plans as developed by the Executive Board
• Identifying and assessing existing and future trends in the areas such as structural changes in the financial industry, the business and operating model of the Group, the applied technology and innovation, as well as assessing their possible impact on the Group and new business opportunities
The Board of Directors has established the following committees to supervise specific risk management-related areas and to prepare topics for consideration by the complete board.
For further details, please refer to the Board of Directors section of this report.
The Executive Board (EBG) is overall responsible to develop and maintain the RMF and the RTF. It defines specific instructions with regard to risk
management, implements the RMF and enforces that the Group’s risk management practices are sound and in accordance with the business model, strategy plan, risk tolerances and the defined mitigating actions set therein.

Comment on riSk managementFINANCIAL STATEMENTS JULIUS BAER GROUP 2020
24
Credit Committee
risk Committee
group asset and liability management Committee
transformation Committee
Sustainability Board
• Measuring and supervising credit risk • Developing of policies governing credit risk, passing resolutions of credit business and credit
limits within its authorisation, delegating credit authority and sanctioning credit risk reports
• Reviewing and deciding on business conduct and risk standards, the ways in which risk is measured on an aggregate, Group-wide basis, the setting of aggregate and individual risk limits (quantitative and qualitative, as appropriate), and the policies and procedures in place to mitigate risks and the actions to be taken if risk limits are exceeded
• Ensuring appropriate measures are in place for businesses with increased reputational, compliance, legal and operational risk profiles
• Reviewing and assessing the Group’s information/cyber security strategy and the Group’s business continuity management strategy
• Pursuing the Group’s aims to ensure adequate liquidity and funding of activities and to optimise net interest earnings and present value of future cash flows
• Steering, monitoring and developing management of the Group’s financial assets and liabilities held in banking books or balance sheet in general
• Defining and overseeing and steering the Group’s transformation roadmap• Providing strategic steering of multiyear transformation programmes and significant
individual projects as well as acting as escalation body for intraproject issues
• Defines, oversees and steers the overall Corporate Sustainability and Responsible Investment strategy and roadmap of JB
• Providing strategic guidance and ensure overall coordination, alignment and prioritisation of the Corporate Sustainability and Responsible Investment roadmap within the Group
The following committees enable the Executive Board to delegate decision-making in the daily course of business.
For further details, please refer to the Executive Board section of this report.
Overall responsibility for the implementation of the Group’s RMF lies with those members of the Executive Board of Julius Baer Group Ltd. with designated independent risk management duties – the Chief Risk Officer (CRO) and the Chief Financial Officer (CFO), in cooperation with the Group General Counsel (GGC).
The CRO division develops and oversees the global framework for risk identification, assessment, management, monitoring and reporting within the risk tolerance for the various business activities for the Group, aiming at sustainable growth of the franchise. It accomplishes this mission by being an independent partner in constructively challenging the business activities from a risk management perspective.
The CRO division is responsible for the control of market risk (trading book and banking book), treasury risk (liquidity and financing risk of the banking book), operational risk as well as compliance and legal risk. Additionally, the CRO division oversees the interaction between risks and supports mitigation of risks together with other divisions. The CRO coordinates his activities with regard to legal risk (incl. regulatory risk) matters with the GGC.
The CFO division oversees the Group’s financial reporting, budgeting and strategic business analysis, including the tools used by the business units for performance follow-up. It is also responsible for balance sheet, capital, funding and liquidity management and the management and oversight of credit risks. The CFO’s duties thus include maintaining a sound ratio of eligible capital to risk-weighted positions and ensuring that sufficient liquidity is available. In doing so, the division maintains monitoring systems to ensure compliance with supervisory regulations on the above topics.

Comment on riSk managementFINANCIAL STATEMENTS JULIUS BAER GROUP 2020
25
RISK CULTURE
The Group recognises that successful risk management requires a combination of a sound risk culture, organisation and supporting processes as well as controls.
A sound risk culture is the key pillar in effectively managing risks. It promotes sound risk-taking and ensures that emerging risks or risk-taking activities beyond the Group’s risk tolerance are appropriately identified, assessed, escalated and addressed in a timely manner. To this effect, the following four levers are viewed as critical elements in ensuring a strong alignment between the expected behaviour standards and the strategic objectives of the Group:
– Strong leadership and tone from the top: The Board and senior management communicate clear expectations in managerial standards with respect of risk-taking and management, as well as leadership culture, transparency, collaboration, responsibility and accountability on all levels. The Board of Directors and the EBG set the Group’s Code of Business Conduct which outlines the principles of Care, Passion and Excellence to guide employee behaviour.
– Accountability and clear roles and responsibilities: In addition to a robust policy framework, the Group ensures that clearly defined roles, responsibilities and accountability standards for specific risks and risk areas are in place in each of the three lines of defences.
– Effective communication and challenge: The Group fosters a culture of open communication and constructive challenge in which decision-making processes encourage a range of views, allow for a continuous revalidation of current practices, stimulate a positive, critical attitude among staff members and promote an environment of open and effective employee engagement.
– Employee life cycle and incentives: Employees are rewarded for excellent performance including sound risk awareness and exemplary behaviour that will promote the long-term sustainable success of the organisation.
Based on Julius Baer’s long-standing core values ‘Care, Passion and Excellence’, a set of guiding principles and professional standards for ethical business conduct have been established and formalised in the Group’s Code of Ethics and Business Conduct (the Code).
The Code covers a range of topics, from values, beliefs and culture to how behaviour affects clients, employees and business activities. It supports the Group’s aspiration to act with the utmost professional expertise and integrity, and articulates the Group’s expectation to adhere to high standards of ethical business conduct and to comply with all applicable laws and regulations.
The Code is globally applicable and the principles described in the Code are reflected in the Group’s internal policies and procedures. To ensure adherence to the Code, employees are regularly trained on its content and provide regular confirmations of their understanding and compliance through a formal self-attestation framework. Non-adherence to the Code is reflected in the employee’s performance assessment and leads to disciplinary sanctions.
Consistent with the Group’s risk culture, employees are expected and encouraged to report any reasoned suspicion of misconduct. They are asked to discuss respective issues directly with their line management, Legal or Compliance, and/or Human Resources. Alternatively, other channels are available to report concerns, observations or complaints, such as contacting the Group’s Ombudsman or reporting the incident anonymously through the Group’s reporting tool (integrity line). The Group will not retaliate against any employee who reports a violation in good faith.
To support good practices and reinforce a sound risk culture, clear consequences are defined through performance management, compensation and disciplinary actions should an employee’s behaviour contribute to a financial loss, reputational damage, a breach of fiduciary duty or represent a policy infringement. To ensure that incentive and compensation systems are aligned with the Group’s

Comment on riSk managementFINANCIAL STATEMENTS JULIUS BAER GROUP 2020
26
risk standards and target risk culture, RMs and their line managers are subject to the new RM Compensation Framework introduced in 2020. The procedures dealing with policy breaches by employees are defined in a separate policy and regulation breach process to ensure a standardised global approach to sanction non-compliant behaviour as well as policy and regulation infringements. The process aims to
– ensure quality of decision and fair treatment of all employees,
– conduct consolidated analyses and reports with the objective of identifying and preven ting systemic risks,
– provide transparent information about the impact of non-compliant behaviour respectively policy and regulation breaches to employees, and
– ensure data protection and privacy.
Depending on the severity of the non-compliant behaviour, a variety of measures can be imposed, such as reprehension, reprimand, warning, promotion ban, financial sanction or termination of work contract.
GROUP RISK LANDSCAPE
In order to make risks transparent and to put them into perspective, a Risk Landscape is compiled annually and is continuously maintained. To comprehensively and holistically identify and assess existing and emerging risks as well as disclose them transparently to the BoD and EBG/ExB, the following multilayered approach is applied:
– A bottom-up ‘Risk and Control Self-Assessment’ of operational, legal and compliance risks performed by the Group’s entities and the business functions at Head Office and challenged by the second line of defence.
– This bottom-up assessment is complemented by the top-down ‘Risk Type Owner Assessments’ which are being performed annually by the RTOs for all operational, legal and compliance risk types.
– This process is supplemented by an annual stress risk assessment across all key risk categories with a view to quantify the total financial and business risk exposures under unlikely events and to put those in context of the Group’s overall risk capacity.
The Risk Landscape, which is discussed and evaluated at ExB and BoD level, is an integral part of the Group’s strategic capital planning process.
CAPITAL PLANNING AND LIQUIDITY CONTINGENCY PLAN
Regulatory capital standards require banks to calculate their capital requirements by quantifying all of the inherent risks the Group is exposed to.
In the capital planning process of the Group, the firm’s ability to withstand the impact of credit, market and other risk events is assessed. The current and future required capital is planned in relation to the strategic targets of the Group and is therefore an integral part of the yearly budgeting and midterm planning process. It provides a reliable forecast of available capital on the basis of business planning and budgeting, future profits, dividend policy and targeted corporate transactions.
In assessing whether the capital base is adequate, the Group takes into account the economic cycle and shows in its capital planning that it is in a position to meet its capital adequacy requirements over a three-year horizon even in the event of an economic downturn and revenues falling sharply and a funding stress scenario.
This includes the risk of unplanned pension liabilities since the present value of future pension obligations minus plan assets currently calculated under IAS 19 is recorded in retained earnings and as such, risk events could reduce the available eligible regulatory capital of the Group. Possible reasons are (i) increasing liabilities, in particular due to regulatory

Comment on riSk managementFINANCIAL STATEMENTS JULIUS BAER GROUP 2020
27
change, such as higher minimum guaranteed amounts and decreasing interest rates; or (ii) decreasing assets, e.g. due to reduced assumed returns on investments; or (iii) a combination of both, e.g. due to changes to the pension fund scheme, acquisitions, increasing longevity or assumption of higher risks due to reduced insurance offering. In case of extraordinary situations, the capital plans are reviewed on an ad hoc basis.
The Group Liquidity Contingency Plan sets out procedures and action plans for the various departments to respond to severe disruptions in the Group’s ability to fund some or all of the activities in a timely manner. It enhances the Group Liquidity and Funding Manual that outlines the quantitative and qualitative methodologies for managing liquidity and funding risks at the Group.
In order to trigger the Liquidity Contingency Plan, the CFO (deputised by the CRO) convokes the Liquidity Crisis Committee and Liquidity Analysis Committee, whose members and responsibilities are defined in the Contingency Plan. A trigger can be based either on the development of early warning indicators or based on an extraordinary event threatening the Group’s liquidity. Well defined escalation steps related to the number of triggered early warning indicators, which are monitored on a daily basis, are in place.
The Group Liquidity Contingency Plan is tested and reviewed at least once a year by the Group Asset and Liability Committee.
STRESS TESTING
The risks identified in the Risk Landscape process enter the capital planning process by means of direct stress impacts for financial risks and indirect stress impacts for idiosyncratic risks.
– Direct stress impacts, which are calibrated to the macroeconomic scenarios used as foundation of the capital plan, cover market-driven financial risk events, i.e. considering trading and non-trading market risk in the trading and banking book, as well as credit risk materialising in the Lombard lending, mortgages, and investment book.
– Indirect stress impacts are used to cover non-correlated or idiosyncratic risk events as identified in the Risk Landscape.
Further stress testing may be conducted regularly or ad hoc both on a singular business or risk level (to assess the exposure in certain areas of the business or in specific risk categories) as well as for single entities or Group-wide. It allows to estimate the potential impact on income, capital or liquidity (or other aspects if deemed relevant) resulting from significant changes in market conditions, credit environment, liquidity demands or other risk factors. All stress-testing activities are developed with input
from a broad range of stakeholders, and results are integrated into management decision-making processes for capital, market risk limits, credit risk strategy and funding strategy. There are three types of stress testing:
– Standardised stress testing procedures are applied to assess the viability of the business under less favourable conditions and are used as input for the formulation and implementation of preparative and contingency activities.
– Reverse stress testing aims to identify scenarios which might be particularly harmful for the Group. Whereas regular stress testing analyses the potential outcome of (historical or hypothetical) scenarios, reverse stress testing reveals potential causes of severe harm to the institution. Such reverse stress testing is performed at least annually in the context of the review of the Risk Landscape.
– Topical stress testing is being applied for a variety of specific topics to gain assurance that preventive, detective and responsive measures to defined scenarios are adequate.

Comment on riSk managementFINANCIAL STATEMENTS JULIUS BAER GROUP 2020
28
The following financial risks are regularly stress-tested and are reported on a regular basis to the EBG and BoD:
– Credit risk: pledged portfolios (consisting of securities, precious metals, derivative exposures, OTC interest options/swaps, foreign exchange [FX] margins) are stress-tested twice a year to assess potential negative market impact on the Lombard credit book. The negative impact on the mortgage book is evaluated by reducing the assigned property market value and stressing additionally pledged assets (e.g. pledged insurance policies, pledged portfolios, etc.).
– Market risk: on a daily basis, a set of granular and standardised scenarios are calculated and the results are measured against a set of limits. Further, once per week, historical stress tests serve as a source for insight of the risks in the trading book.
– Treasury risk: on a daily basis, liquidity stress tests serve to assess the liquidity posture of the Group.
Stress testing of non-financial risks is performed at least annually as part of the Group Risk Landscape process.
– Operational risk, compliance and legal risk as well as strategic, business and reputational risk are assessed and reported within a structured process concentrating on the major risks relevant for the Group. The compilation of such risks follows a stress scenario assumption, e.g. focusses on events which may happen, but only rarely, and whose severity, upon happening, is exceptionally high. In aiming to quantify the risks along the two dimensions ‘probability of occurrence’ and ‘impact’, a precedence of such risks is established allowing for focusing the discussion on the most relevant topics. In addition, the estimated losses are being used in reverse stress testing of the risk capacity.
RISK REPORTING
As a key component of an effective risk management framework, risk reporting is used to understand, monitor, manage and mitigate risks and escalate them to the senior management. It mainly aims at informing the respective levels of management up to the BoD and the EBG on the overall risk profile, particular risk exposures as well as the levels of the Group’s financial ratios and capital and risk indicators. It takes place in the form of regular financial risk and key ratios reports prepared by the CRO and CFO throughout the year.
The frequency and depth of the reporting is defined, assessed and aligned where appropriate by the recipients of the reports depending on the size and complexity of the respective areas. They are generally catered to provide reassurance on the adherence to risk tolerance, to provide escalation on respective non-adherence and to provide early warnings for exposures to approach of risk levels, which may in turn exceed the Group’s RTF.
The Governance & Risk Committee and the Audit Committee are periodically (at least quarterly) informed by EBG about the general risk situation through the Group Quarterly Risk Report prepared by the CRO. Once a year, the Group Quarterly Risk Report is also discussed in the BoD. Additionally, Management informs the BoD immediately in case of exceptional events. The Group allocates a sufficient level of resources to risk monitoring against approved risk limits. Processes are established for reporting changes in risks to the relevant management bodies and risk committees. This enables the BoD and the EBG to review their risk and crisis management frameworks early to implement new regulatory requirements, expand risk and crisis capabilities, and improve efficiency.
With regard to reporting of the adherence to risk tolerance thresholds, exposure reporting for risk tolerance metrics is integrated in the Quarterly Risk Report to the Governance & Risk Committee.

Comment on riSk managementFINANCIAL STATEMENTS JULIUS BAER GROUP 2020
29
First line of defence
• Comprises revenue-generating functions and other business units that incur risk
• Function heads are accountable for the risk that is being incurred in these functions
• Controls are operated to detect and prevent risk
Internal Control System
the ‘three lines of defence’ model
Functions operating across the group
third line of defence
• Comprises Internal Audit• Responsible for performing
periodic assurance to determine whether the first and second line are operating in accordance with their respective mandates
• Independent of first and second lines of defence
Second line of defence
• Comprises independent control functions
• Responsible for overseeing the activities of the business and providing challenge
• Reviews the performance of first-line controls and operates independent controls
THE THREE LINES OF DEFENCE
The Group has adopted the ‘Three Lines of Defence’ model as a guiding organisational framework for managing risk in the functions operating across the Group. This encompasses the Internal Control System (‘ICS’), which is, amongst others, the sum of controls and processes that operate across the three lines of defence to ensure that risk is being incurred in a deliberate and disciplined manner.
The Group seeks to follow an approach of assigning clear accountability in identifying, assessing, managing, monitoring and reporting risks. In doing so, the Group has implemented and continues to strengthen the ‘Three Lines of Defence’ model across its global business operations.
The ‘Three Lines of Defence’ model is defined according to the following key principles:

Comment on riSk managementFINANCIAL STATEMENTS JULIUS BAER GROUP 2020
30
CREDIT RISK
Credit risk is the risk of financial losses due to a client or a counterparty being either unable, or only partially able, to meet an obligation owed to the Group or to an individual Group company.
The Group’s focus either is to lend money to its wealth management clients on a collateralised basis in form of Lombard lending or mortgages in combination with core business.
Professional counterparty exposureThe Group engages in transactions with banks, brokers and selected institutional clients on both a secured and unsecured basis. This involves individual risk limits and settlement limits being approved for each counterparty. The credit exposures arising from these transactions are monitored on a daily basis, and netting agreements and collateral agreements are used to mitigate exposures further. As a result, the vast majority of the replacement values of the exposure arising from trading transactions are covered by collateral. The Group places excess liquidity with central banks. It also makes short-term money-market placements with banks and invests in high quality, repo-eligible bonds and secured debt instruments issued by governments, public institutions, banks and corporations.
The Group has implemented a workflow system for managing and monitoring credit risks in the due from banks book. Several controls are incorporated in the system to ensure timely risk management and granting of credit facilities according to delegated credit approval authorities. Credit approvals are processed using a four-eye principle. Approval authorities are continuously kept up to date taking into consideration a number of factors such as risk type, counterparty risk rating and exposure. The credit risks associated with all the counterparties and issuers are subject to a wide range of rules and limits.
These ensure that the Group’s consolidated credit exposure, both on a single-counterparty and a counterparty-group basis,
– is not subject to concentration by exposure type– is not disproportionate to the size, shareholders’
equity and scale of business of the counterparty– is clearly within the Group’s risk capacity and the
applicable regulatory limits.
The Group settles a substantial proportion of its trading and derivatives business indirectly through central counterparties (CCPs). The credit risks associated with CCPs are negligible, because the Group works through a variety of specialised service providers and therefore generally does not directly participate in the clearing systems concerned.
Given the focused nature of its activities, the Group is not exposed to any material correlation risk or wrong way risk (i.e. the risk which arises when exposure to a counterparty is negatively correlated to its credit quality). Furthermore, the Group holds cash collateral for the majority of the counterparty risk arising from its open derivatives positions. The Group’s securities lending business policies explicitly prohibit transactions involving correlation risk.
The Group has a general policy of avoiding group-rating triggers in its collateral agreements for derivatives transactions. As a result, were its rating to decline below a given level, the Group would not be required to provide additional collateral.
For professional counterparties a regular stress test is in place. The current exposure is stressed and set against current limits and against stressed equity of the counterparty. Additionally, a second stress test assesses the impact of a rating downgrade of the internal rating on the Group’s risk appetite.

Comment on riSk managementFINANCIAL STATEMENTS JULIUS BAER GROUP 2020
31
lombard lendingThe Group has a policy of lending to wealth management clients on a collateralised basis. The credit risk results from lending activities as well as actual and future receivables due to the Group.
The Group uses credit risk models and frameworks to assess the riskiness of its portfolio in line with the respective lending policies. On that basis, conservative lending values are set as a percentage of the collateral market value. Advanceable rates can be determined or adjusted for a specific security or for individual clients.
Every counterparty with a credit line is assigned an internal credit rating. The risk rating reflects the underlying credit risk and primarily depends on the collateral provided by the counterparty, collateral concentration and client-specific conditions. In the case of the rating classes R1 to R6 (neither past due nor impaired), the outstanding balances are serviced; the advancable value of the collateral (at fair value) pledged for collateralised exposures equals or exceeds the balances, and repayment of the balance is not in doubt. Balances in rating class R7 are past due, but the exposure is still covered by collateral. For balances in rating classes R7 to R10, loss allowances are established on a case-by-case basis.
The risk rating for the counterparty’s limit size also determines the approval authority level, the monitoring and review frequency.
The Group’s objective is to achieve a growth in Lombard lending commensurate with the evolution of its wealth management business. To that end, the Board of Directors for example defines corridor values for credit penetration (the ratio of lending to assets under management). In addition, the Group has implemented a set of regularly reviewed limits for the ongoing management and systematic monitoring of various credit risk concentrations in the Lombard business in line with its risk strategy.
This includes limits related to single asset collaterals, client groups, geographical (on country-of-risk level) or risk rating concentrations; all of these limits have the same significance and are adhered to equally. Any breach of the limits becoming apparent would be dealt with in line with the general risk governance policy described above. Furthermore, management triggers exist for these limits, which allows management to take the necessary actions at an early stage in order that any potential breach can be avoided. However, none of the internal risk limits has been exceeded during the business years 2020 and 2019; moreover, the current exposures are well below the set limits for all risk concentrations.
Additionally, an internal guideline for the maximum loan-to-deposit ratio, which is reviewed and validated periodically, is in place. The maximum ratio has not been exceeded during the business years 2020 and 2019.
Regular and ad hoc stress testings are performed. These are calibrated to reflect the prevailing market and political situation. The results are reviewed by the credit-monitoring units and reported to the relevant decision-making committees. All distressed and non-performing loans are identified at an early stage and managed proactively. Collateral shortfalls (e.g. margin calls) are processed on a daily basis and prioritised according to their severity.
The Group has implemented a workflow system for managing and monitoring Lombard risks. The system draws the relevant position data from the bookkeeping systems of Group companies which grant loans. The system is able to enrich this data with credit-specific information and to consolidate it with data on client and counterparty positions from the various booking centres. Several controls are incorporated in these systems. All Lombard risks are monitored daily, as are current limit usage and the quality of the collateral pledged. In addition, for clients with derivatives positions whose exposure requires intraday monitoring, real-time systems are also available.
Comment on riSk managementFINANCIAL STATEMENTS JULIUS BAER GROUP 2020
32
mortgagesThe Group grants mortgages to wealth management clients in Switzerland and in a limited number of international locations. The properties pledged are assessed and valued individually as part of the risk management process. These valuations are carried out based either on a factor model or by qualified internal and external appraisers. Maximum mortgage amounts are determined based on the characteristics of each property and client. An additional financial sustainability assessment is also carried out before a mortgage is granted. In many cases, supplementary collateral in form of securities is required in addition to the pledged property itself. Every mortgage is assigned a risk rating. The rating reflects the underlying credit risk which primarily depends on the counterparty assessment and the property. The risk rating for the requested limit size also determines the approval
level and review frequency. The Group tends to assign comparatively low mortgage values and adopt a relatively conservative approach to mortgage risk.
The Group conducts regular stress tests with different scenario size depending on the location and ad hoc portfolio analysis to assess potential negative market impacts on the mortgage book.
The mortgage positions are monitored in a supervision system globally. Additionally, a workflow system for monitoring and managing credit risks for the Swiss mortgage book is in place. Several controls are incorporated in these systems to ensure timely registration and collateral valuation, the granting of credit facilities according to delegated credit approval authorities, and formalised monitoring procedures.

Comment on riSk managementFINANCIAL STATEMENTS JULIUS BAER GROUP 2020
33
MARKET RISK
Market risk refers to the potential losses through changes in the valuation of its assets and liabilities because of changes in market prices, volatilities, correlations and other valuation-relevant factors.
It could be further separated into:
– Trading market risk, resulting from trading book transactions, being pursued with the intention of benefiting from actual or expected differences between the opening and closing price of proprietary positions, with the intention of benefiting from arbitrage profits, or with the intention of hedging risks from positions meeting aforementioned criteria
– Non-trading market risk, resulting from the management of financial assets and liabilities held in the Group’s banking books with exposures mainly to interest rate risk, currency risk, credit spread risk and equity risk
The Group assumes market risk exposure through activities of the subdivision Markets (trading market risk) and CFO (non-trading and trading market risk in the Treasury department) as well as through the purchase of participations and financial investments triggered by the authorised body.
Identification of trading and non-trading market risks is ensured with a strict product approval process including the assessment and validation of models, implementation in trading and risk systems to assure caption of all risk components. A regular review of positions and models in trading and banking books assures an ongoing identification of new risks or the need for changing models or processes.
The Group uses statistical measures to assess trading and non-trading market risks and to represent these risks in the Risk Landscape. These measures are part of the toolbox used in the day-to-day market risk management and measurement process. As an example, the Group calculates probability-loss curves using Value at Risk (‘VaR’) and Expected Shortfall measures. These curves determine the potential loss that may occur with a given probability over the next three years using the previous year’s market data (and the assumption
that after losses of four times the VaR, the risk positions would be hedged to avoid further losses). This is done separately for trading and non-trading market risk, producing two probability-loss curves.
Further, the Group performs market risk portfolio analyses and stress testing on a regular basis as well as in relation to specific events. Efforts are made to ensure that the net effect under various stressed conditions is taken into account in the risk assessment and monitoring processes. Purpose of market risk stress testing is
– to assess the adequacy of the Group’s financial resources for periods of severe stress and develop contingency plans for the Group if the need arises,
– to promote risk identification and add further insight into the need for setting new limits, and
– to serve as a supplement to the ongoing quality assurance for market risk management practices.
The stress testing programme provides additional perspectives on market risk by applying multiple methodologies to scenarios with various degrees of severity. The complexity of the methodologies ranges from simple sensitivity analyses to complex scenario stress testing (as required to meet the purpose of the stress test).
For trading market risk assumed in the Markets subdivision, the Market Risk and Product Control unit oversees the application of the framework set by the BoD. Authorities and responsibilities for trading activities are cascaded down from the EBG to the subdivision Head Markets to Business Line Heads and Trading Desk Heads.
For non-trading and trading market risk managed within the Treasury department, the Market Risk and Product Control unit oversees the application of the framework set by the BoD and the Group Asset and Liability Committee and issues additional rules and constraints as deemed required.
Market risk management activities are described in various key policies. A control environment for market risk has been implemented and integrated

Comment on riSk managementFINANCIAL STATEMENTS JULIUS BAER GROUP 2020
34
into key business processes. This ensures that products are approved to be in line with the strategy and risk tolerance, limits are in place and adhered to, front-to-back reconciliation processes are in place, and the valuation of positions follows a fair value approach.
The Group uses a variety of metrics and models to continuously measure and control market risk exposures. Limits are set using these models, reflecting the Group’s risk tolerance, including:
– VaR limits– Scenario and sensitivity limits– Nominal/market value limits, sensitivity (‘Greek’)
limits– Stress scenario limits– Stop loss limits and/or profit and loss volatility
limits– Intraday limits
Internal models are developed and maintained for the pricing and risk management of financial products that cannot be valued directly or risk-managed on the basis
of quoted market prices. These models are independently certified and regularly reviewed based on a risk-materiality assessment.
Non-trading market risk models are subject to regular reviews:
– Scenario model to assess the risk of losses caused by interest rate moves on balance sheet mismatch positions and/or model risk arising from assets or liabilities with no fixed maturity
– Scenario model to assess the risk of losses on the balance sheet FX exposure due to unfavourable currency movements
– Scenario model to assess the credit spread risk due to the change in credit risk premium required in the market for a given credit quality of an investment
Regulatory back-testing is performed daily to document the performance of the internal VaR model. Risk and pricing models are independently validated prior to implementation and are subject to formal periodic review.

Comment on riSk managementFINANCIAL STATEMENTS JULIUS BAER GROUP 2020
35
TREASURY RISK
Treasury risk consists of financing and liquidity risk.
Financing risk is the risk of the Group being unable to finance its existing or planned activities on an ongoing basis at acceptable prices. Liquidity risk, conversely, is the risk of the Group being unable to meet its payment obligations when they fall due.
The Treasury department of Bank Julius Baer & Co. Ltd. is responsible for the Group’s liquidity and funding activities. This includes executing the funding plan and managing the liquidity reserve. Liquidity management is centralised and conducted on a consolidated basis to ensure regulatory compliance at the Group level and compliance with internal requirements.
The Market Risk and Product Control unit as part of the Risk Management department validates and challenges the models and assumptions used by the first line of defence for reporting risk measures.
Treasury risk is inherent in basic banking activities such as accepting deposits and providing loans and credits. The transformation of short-term deposits into long-term loans exposes banks to maturity mismatches that cannot be eliminated. The Group manages this liquidity risk by holding sufficient liquidity to meet its obligations and follow its strategies – in particular regulatory obligations, business plans and rating ambitions – even in stressed situations. The key elements of the liquidity and financing risk framework are:
– Measurement of risk by using appropriate models– Liquidity ratios and limits– Stress testing– Fund transfer pricing system– Reporting
To identify risks and assure adherence to the liquidity and financing risk framework, the Group follows:
– a new product approval process assuring that any new business or product is assessed by all stakeholders;
– a daily analysis of positions by risk management; and
– a regular review of models used in the measurement of liquidity and financing risks.
The assessment of liquidity and financing risks is primarily drawn from stress testing results. The Group has a liquidity stress testing model in place that runs regular liquidity stress tests and enhanced liquidity stress tests taking into consideration longer time periods, currency shocks or contingent liquidity risks. While the Group recognises that stress testing and the modelling of future cash flows are subject to model uncertainty, the liquidity stress testing approach captures both funding liquidity risk (e.g. ‘bank run’ scenarios where an entity may not be able to meet its short-term liabilities) and asset liquidity risk (e.g. the risk that asset valuations may be subject to large haircuts in value).
The Group’s liquidity risk management includes incentive measures to maintain a sound balance of short-term liabilities vs. the size of its balance sheet. Furthermore, delegated to the Treasury department, liquidity risk management seeks to ensure that sufficiently large liquid assets are in place (and available for drawdown in normal markets and stressed markets).
The stress testing models and parameters are annually reviewed and approved by the Group’s Asset Liability Committee.

Comment on riSk managementFINANCIAL STATEMENTS JULIUS BAER GROUP 2020
36
Various policies and controls are in place to manage treasury risk. The Group Funding Liquidity Manual outlines the quantitative and qualitative methodologies for managing liquidity and funding risks at the Group, and complements the Group Liquidity Risk and Funding Policy. The manual contains the Group Liquidity Contingency Plan, which would be deployed in the event of a severe deterioration of the Group’s liquidity situation. The contingency plan defines responsibilities and lists potential liquidity-generating measures to be evaluated on a case-by-case basis.
Additionally, Group subsidiaries and branches may have issued local Liquidity Manuals and Contingency Plans.
The risk management and measurement of liquidity and financing risks is based on the following risk metrics:
– Liquidity stress tests– Liquidity Coverage Ratio (LCR). For additional
information to the LCR, refer to the separate Basel III Pillar 3 Report, published in the Financial Reporting section of the www.juliusbaer.com website (this will be available at the end of April 2021)
– Net Stable Funding Ratio (NSFR)– Funding gap analysis– Funding concentration analysis– Early warning indicators

Comment on riSk managementFINANCIAL STATEMENTS JULIUS BAER GROUP 2020
37
NON-FINANCIAL RISK
The Group is subject to various non-financial risks by providing services to clients and counterparties, by receiving services from third parties and by operating in a regulated industry.
Operational risk is the risk of loss resulting from inadequate or failed internal processes, people, systems, external events or fraud.
Compliance risk is the risk of financial loss or damage resulting from a breach of applicable laws and regulations or the non-adherence to internal or external rules and regulations or market practice. The loss or damage in such circumstances may take the form of fines and/or disgorgement imposed by regulatory and/or criminal authorities or other sanctions such as restrictions on business activities, the imposition of mandatory remedial measures (including monitoring) or even the loss of license.
Legal risk essentially comprises default and liability risk. Default risk is defined as the risk of loss or damage resulting from an entity being unable to enforce existing or anticipated rights against third parties. Liability risk, on the other hand, arises when an entity, or someone acting on its behalf, fails to meet an obligation owed to a third party or fails to respect the rights of a third party.
Strategic risk is defined as the risk of employing a strategy that fails to secure the adequate returns available from the capital employed in the long run. The Group is exposed to strategic risk in the pursuit of its growth strategy. It may arise from strategic decisions such as joint ventures, mergers and acquisitions, the pricing strategy and strategic recruiting or the lack of making timely decisions.
Sustainability risks are environmental, social or governance events or conditions which if they occur have or may have significant negative impacts on the assets, financial and earnings situation or the reputation.
Business risk is the risk arising from a bank’s long-term business strategy of pure wealth management. It deals with a bank not being able to keep up with changing competition dynamics and/or an unfavourable fiscal, political or regulatory environment.
Reputational risk describes the risk that the reputation the Group has with its stakeholders (including regulators, shareholders, clients, employees and the general public) deteriorates and the trust in its franchise and brand value is negatively influenced. The reputation may deteriorate due to cases in which stakeholders’ perception of the Group differs negatively from their expectations. Negative sentiment about an institution’s business practices can involve any aspect of its operations, but usually relates to topics of business ethics and integrity, or quality of products and services. The Group considers its reputation as the most important asset and the hardest one to re-establish in case of an unwanted deterioration. Thus, the Group does not take extreme positions regarding tax, regulatory, political or suitability risks. Transactions that would compromise its reputation should it become public is, by definition, an unacceptable risk to the Group.

Comment on riSk managementFINANCIAL STATEMENTS JULIUS BAER GROUP 2020
38
CYCLE
2. ASSESSMENT
3. MANAGEMENT
4. MONITORING
1. IDENTIFICATION5. REPORTING
RISK
CYCLE
The Group has defined the underlying risk management processes for every risk type along a Risk Management Cycle.
The continuous identification (step 1) of relevant risks is a key risk management activity. This relates to both emerging threats/risks as well as to increasing risk profiles. New risks may arise by developing and launching new products and services, a change in the regulatory landscape or a change to the business model.
The assessment (step 2) of identified risks consists of the qualitative analysis and quantification of the inherent risk, the control risk and finally the residual risk along defined risk management principles and methods. It also includes the development, testing and validation of models to measure risks, as well as stress testing procedures to assess and measure risks in pre-defined scenarios.
The day-to-day risk management (step 3) has to ensure an adequate response to identified risks and the set risk tolerance. It includes all activities from risk evaluation to the definition and implementation of risk mitigation measures, which aim to prevent or
reduce risks and damages, e.g. the setting of standards and controls, education and training, automation of processes, and the implementation of standards, limits and metrics.
Monitoring activities (step 4) include the performance of control activities or quality assurance procedures on implemented standards and controls to ensure that the risk profile and exposure is kept within the risk tolerance, e.g. via risk metrics (KRIs or KPIs) and limits.
The reporting (step 5) supports all hierarchy levels to have a transparent and accurate overview of the underlying risk profile and risk exposure. This includes also the timely escalation in case of breaches of set risk tolerances. The frequency and depth of the reporting is defined, assessed and aligned where appropriate by the recipients of the reports depending on the size and complexity of the respective areas.

Comment on CaPital managementFINANCIAL STATEMENTS JULIUS BAER GROUP 2020
39
COMMENT ON CAPITAL MANAGEMENT
MANAGEMENT OF CAPITAL INCLUDING REGULATORY CAPITAL
In managing its capital, the Group considers a variety of requirements and expectations. Sufficient capital must be in place to support current and projected business activities, according to both the Group’s own internal assessment and the require-ments of its regulators, in particular its lead regulator, the Swiss Financial Market Supervisory Authority (FINMA). Cap ital is also managed in order to achieve sound capital ratios and to ensure a strong external credit rating.
Ensuring compliance with minimum regulatory capital requirements and targeted capital ratios is central to capital adequacy management. In this ongoing process, the Group manages its capital on the basis of target capital ratios for common equity tier 1 capital and total cap ital. In the target-setting process, the Group takes into account the regulatory min imum capital requirements and regulatory expectations that the Group will hold additional capital above the min imum required for each capital category, the Group’s internal assessment of aggregate risk expos ure requiring equity capital provision, the views of rating agencies, and comparison to peer institutions based on the Group’s business mix and market presence.
In 2020 (and 2019), the scope of consolidation used for the calculation of capital adequacy is identical to that applied for accounting purposes. Note 30A provides an overview of the Group’s consolidated companies.
The Group’s calculations of its risk-weighted assets published in the Annual Report are identical to those carried out for regulatory reporting purposes.
The Basel III international standard approach requires CET1 equivalent to at least 4.5% of risk-weighted assets, plus a CET1 capital buffer of 2.5%, plus 1.5% of additional tier 1 (AT1) capital (or better- quality capital), plus 2% of supplementary tier 2 capital (or better-quality capital). In aggregate, this amounts to an overall capital requirement of at least 10.5% of risk-weighted assets. FINMA minimum capital requirements for the Group are 7.8% for CET1, 1.8% for AT1 and 2.4% for tier 2, which puts its overall minimum capital requirement at 12% of risk-weighted assets. At present, the Group is also required to hold an additional anticyclical CET1 capital buffer for commitments outside Switzerland. This adds a further 0.1% to its minimum capital requirement of 12% of risk-weighted assets. The capital held by the Group at 31 December 2020 and at 31 December 2019 was sufficient to meet the relevant BIS and FINMA requirements and internal capital buffers set by the EBG and BoD.

Comment on CaPital managementFINANCIAL STATEMENTS JULIUS BAER GROUP 2020
40
Capital ratios
31.12.2020 31.12.2019
Basel III Basel III
CHF m CHF m
risk-weighted positions
Credit risk 13,755.5 13,749.3
Non-counterparty-related risk 580.5 612.9
Market risk 1,116.7 670.8
Operational risk 5,668.0 5,461.7
total 21,120.7 20,494.6
eligible capital
CET1 capital 3,157.5 2,876.7
Tier 1 capital 4,296.3 4,420.9
of which hybrid tier 1 capital instruments1 1,138.8 1,544.2
Tier 2 capital 133.5 100.8
Total capital 4,429.7 4,521.7
CET1 capital ratio 14.9% 14.0%
Tier 1 capital ratio 20.3% 21.6%
Total capital ratio 21.0% 22.1%
1 The hybrid tier 1 instruments are tier 1 bonds issued by Julius Baer Group Ltd. (see Note 15 Debt issued).

Comment on CaPital managementFINANCIAL STATEMENTS JULIUS BAER GROUP 2020
41
Further details regarding tier 1 capital instruments can be found in the Capital Instruments section of www.juliusbaer.com. Also refer to debt issued, Note 15.
The principal adjustment to the Group’s total equity under IFRS for the purpose of determining total eligible capital is the deduction of intangible assets. These and other capital components are shown in the following table. In addition to the table below, a separate Basel III Pillar 3 Report has been prepared
which shows a full reconciliation between all components of the Group’s eligible regulatory capital and its reported IFRS balance sheet as at 31 December 2020. This report, which is published in the Financial Reporting section of www.juliusbaer.com, has been prepared in accordance with the FINMA regulations governing the disclosure of the composition of eligible regulatory capital and will be publicly available at the end of April 2021.
Capital components
31.12.2020 31.12.2019
Basel III Basel III
CHF m CHF m
Gross common equity tier 1 capital 6,434.1 6,198.6
of which non-controlling interests 8.6 9.2
Goodwill and other intangible assets -2,622.0 -2,841.8
Other deductions -654.6 -480.1
Common equity tier 1 capital 3,157.5 2,876.7
Tier 1 capital instruments 1,138.8 1,544.2
of which tier 1 bonds (Basel III-compliant capital instruments) 1,138.8 1,544.2
additional tier 1 capital 1,138.8 1,544.2
Tier 1 capital 4,296.3 4,420.9
Tier 2 capital 133.5 100.8
of which other tier 2 capital 133.5 100.8
total capital 4,429.7 4,521.7
Required capital (see table below) for credit risks arising from amounts due from banks, loans, financial assets measured at FVOCI and derivative financial instruments accounts for more than 65% (2019: 67%) of the total required capital. Capital
required for non-counterparty risk (2020: 3%; 2019: 3%) and market risk (2020: 5%; 2019: 3%) is of minor signifi cance. The capital required to cover operational risk accounts for 27% of total required capital (2019: 27%).

Comment on CaPital managementFINANCIAL STATEMENTS JULIUS BAER GROUP 2020
42
minimum capital requirement
31.12.2020 31.12.2019
Basel III Basel III
CHF m CHF m
Credit risk 1,100.4 1,099.9
Non-counterparty-related risk 46.4 49.0
Market risk 89.3 53.7
Operational risk 453.4 436.9
total 1,689.7 1,639.6
LEVERAGE RATIO
In addition to the existing requirement for banks to hold eligible capital proportionate to their risk-weighted assets, the leverage ratio is a non-risk-based metric. The leverage ratio is defined as the ratio between eligible (tier 1) core capital and total exposure. Total exposure encompasses all balance sheet and off-balance sheet positions, and the ‘Leverage Ratio’ circular defines how these are to be calculated. The minimum leverage ratio requirement is three percent for 2020 (and 2019).
Basel III regulations also require the publication of the leverage ratio. The relevant qualitative and quantitative information is contained in a separate disclosure report (Basel III Pillar 3 Report). The report will be published on the www.juliusbaer.com website and will be available at the end of April 2021.

inFormation on the ConSolidated inCome StatementFINANCIAL STATEMENTS JULIUS BAER GROUP 2020
43
INFORMATION ON THE CONSOLIDATED INCOME STATEMENT
NOTE 1 NET INTEREST INCOME 2020 2019 Change
CHF m CHF m %
Interest income on amounts due from banks 12.1 62.4 -80.6
Interest income on loans 651.5 949.5 -31.4
Interest income on debt instruments at FVOCI 134.4 258.1 -47.9
Negative interest received on financial liabilities 27.2 23.1 17.8
Interest income on financial instruments
measured at amortised cost or FVOCI 825.2 1,293.1 -36.2
Interest expense on amounts due to banks 13.3 28.1 -52.5
Interest expense on amounts due to customers 73.6 370.1 -80.1
Interest expense on debt issued 60.3 69.8 -13.7
Negative interest paid on financial assets 50.5 26.4 91.3
Interest expense on lease liabilities 5.7 6.5 -12.5
Interest expense on financial instruments
measured at amortised cost 203.5 500.9 -59.4
total 621.7 792.2 -21.5
NOTE 2 NET COMMISSION AND FEE INCOME 2020 2019 Change
CHF m CHF m %
Advisory and management fees 1,350.9 1,429.3 -5.5
Brokerage commissions and income from securities underwriting 816.1 609.5 33.9
Commission income from credit-related activities 21.5 9.4 130.3
Commission and fee income on other services 61.6 91.4 -32.6
Total commission and fee income 2,250.1 2,139.6 5.2
Commission expense 235.1 216.6 8.5
total 2,015.0 1,922.9 4.8

inFormation on the ConSolidated inCome StatementFINANCIAL STATEMENTS JULIUS BAER GROUP 2020
44
NOTE 3 NET INCOME FROM FINANCIAL INSTRUMENTS MEASURED AT FVTPL 2020 2019 Change
CHF m CHF m %
Net gains/(losses) from debt instruments and foreign exchange 534.8 491.0 8.9
Net gains/(losses) from equity instruments 408.6 127.1 221.5
total 943.5 618.1 52.6
NOTE 4 OTHER ORDINARY RESULTS 2020 2019 Change
CHF m CHF m %
Dividend income on equity instruments at FVOCI 1.8 17.5 -89.6
Result from disposal of debt instruments at FVOCI 15.9 9.9 61.0
Income from investments in associates - 0.7 -100.0
Real estate income 5.4 6.5 -17.5
Other ordinary income 18.0 24.8 -27.5
Other ordinary expenses 2.7 0.7 305.5
total 38.4 58.7 -34.6
NOTE 5 PERSONNEL EXPENSES 2020 2019 Change
CHF m CHF m %
Salaries and bonuses 1,266.1 1,272.0 -0.5
Contributions to staff pension plans (defined benefits) 86.1 82.5 4.5
Contributions to staff pension plans (defined contributions) 36.8 37.7 -2.6
Other social security contributions 100.7 101.6 -0.9
Share-based payments 71.6 79.1 -9.4
Other personnel expenses 34.2 43.3 -21.0
total 1,595.5 1,616.2 -1.3
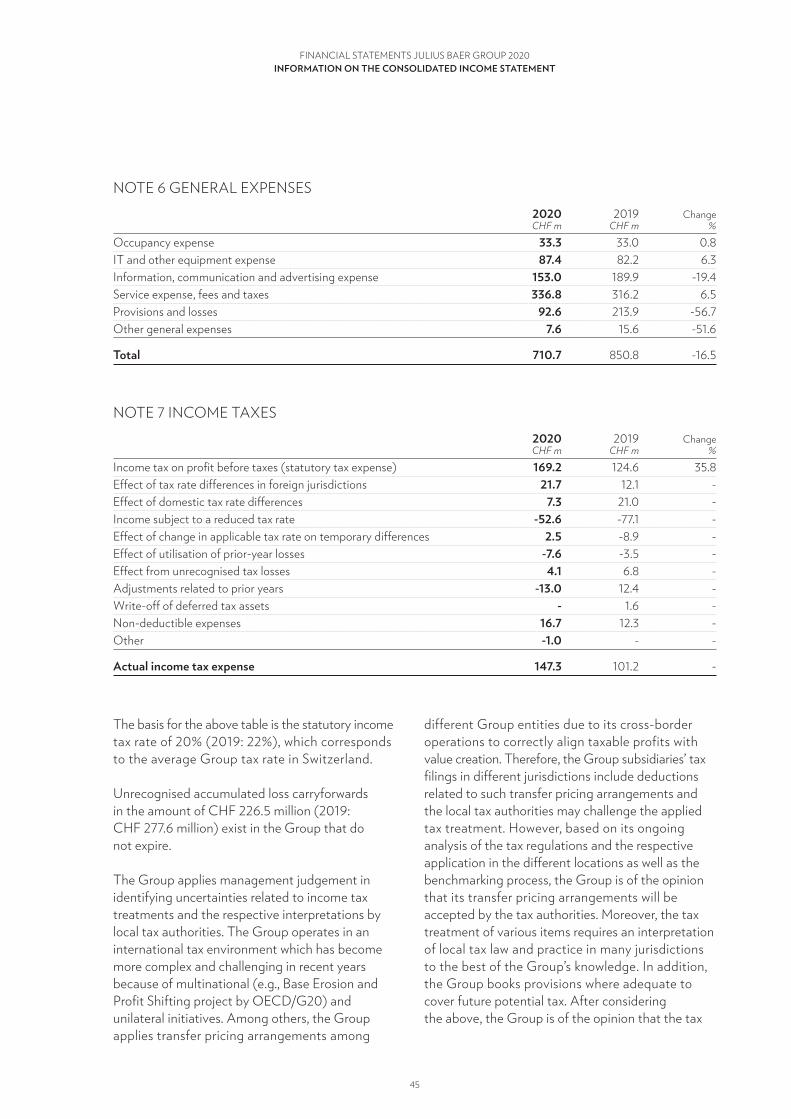
inFormation on the ConSolidated inCome StatementFINANCIAL STATEMENTS JULIUS BAER GROUP 2020
45
NOTE 6 GENERAL EXPENSES 2020 2019 Change
CHF m CHF m %
Occupancy expense 33.3 33.0 0.8
IT and other equipment expense 87.4 82.2 6.3
Information, communication and advertising expense 153.0 189.9 -19.4
Service expense, fees and taxes 336.8 316.2 6.5
Provisions and losses 92.6 213.9 -56.7
Other general expenses 7.6 15.6 -51.6
total 710.7 850.8 -16.5
NOTE 7 INCOME TAXES 2020 2019 Change
CHF m CHF m %
Income tax on profit before taxes (statutory tax expense) 169.2 124.6 35.8
Effect of tax rate differences in foreign jurisdictions 21.7 12.1 -
Effect of domestic tax rate differences 7.3 21.0 -
Income subject to a reduced tax rate -52.6 -77.1 -
Effect of change in applicable tax rate on temporary differences 2.5 -8.9 -
Effect of utilisation of prior-year losses -7.6 -3.5 -
Effect from unrecognised tax losses 4.1 6.8 -
Adjustments related to prior years -13.0 12.4 -
Write-off of deferred tax assets - 1.6 -
Non-deductible expenses 16.7 12.3 -
Other -1.0 - -
actual income tax expense 147.3 101.2 -
The basis for the above table is the statutory income tax rate of 20% (2019: 22%), which corresponds to the average Group tax rate in Switzerland.
Unrecognised accumulated loss carryforwards in the amount of CHF 226.5 million (2019: CHF 277.6 million) exist in the Group that do not expire.
The Group applies management judgement in identifying uncertainties related to income tax treatments and the respective interpretations by local tax authorities. The Group operates in an international tax environment which has become more complex and challenging in recent years because of multinational (e.g., Base Erosion and Profit Shifting project by OECD/G20) and unilateral initiatives. Among others, the Group applies transfer pricing arrangements among
different Group entities due to its cross-border operations to correctly align taxable profits with value creation. Therefore, the Group subsidiaries’ tax filings in different jurisdictions include deductions related to such transfer pricing arrangements and the local tax authorities may challenge the applied tax treatment. However, based on its ongoing analysis of the tax regulations and the respective application in the different locations as well as the benchmarking process, the Group is of the opinion that its transfer pricing arrangements will be accepted by the tax authorities. Moreover, the tax treatment of various items requires an interpretation of local tax law and practice in many jurisdictions to the best of the Group’s knowledge. In addition, the Group books provisions where adequate to cover future potential tax. After considering the above, the Group is of the opinion that the tax

inFormation on the ConSolidated inCome StatementFINANCIAL STATEMENTS JULIUS BAER GROUP 2020
46
expense and tax liabilities in the financial statements are adequate and based on reasonable judgements by tax professionals.
adoption of Swiss corporate tax reform (‘traF’)The tax reform has entered into force on 1 January 2020. The changes had no material impact on the tax liability as the transformation of Julius Baer
Group Ltd. out of the holding regime into the ordinary tax regime has been mostly absorbed by a general tax rate reduction in various Swiss cantons as well as new measures introduced as part of the TRAF. Additionally, the enacted tax rate reduction in certain cantons has been already reflected in the deferred tax positions in 2019.
2020 2019 Change
CHF m CHF m %
Domestic income taxes 75.5 34.2 120.9
Foreign income taxes 71.8 67.0 7.1
total 147.3 101.2 45.5
Current income taxes 151.0 127.3 18.6
Deferred income taxes -3.7 -26.1 86.0
total 147.3 101.2 45.5

inFormation on the ConSolidated inCome StatementFINANCIAL STATEMENTS JULIUS BAER GROUP 2020
47
tax effects relating to components of other comprehensive income
2020
Tax
Before-tax (expense)/ Net-of-tax
amount benefit amount
CHF m CHF m CHF m
items that may be reclassified to the income statement
Net unrealised gains/(losses) on debt instruments measured at FVOCI 111.5 -5.7 105.7
Net realised (gains)/losses on debt instruments
measured at FVOCI reclassified to the income statement -15.9 0.5 -15.5
Net credit losses on debt instruments measured at FVOCI 0.5 - 0.5
Translation differences -165.6 - -165.6
Realised (gains)/losses on translation differences
reclassified to the income statement 2.5 - 2.5
items that will not be reclassified to the income statement
Net unrealised gains/(losses) on equity instruments designated at FVOCI -14.3 2.7 -11.6
Own credit on financial liabilities designated at fair value -3.9 - -3.9
Remeasurement of defined benefit obligation 25.9 -4.9 21.0
other comprehensive income -59.3 -7.5 -66.8
2019
Tax
Before-tax (expense)/ Net-of-tax
amount benefit amount
CHF m CHF m CHF m
Items that may be reclassified to the income statement
Net unrealised gains/(losses) on debt instruments measured at FVOCI 123.7 -15.1 108.6
Net realised (gains)/losses on debt instruments
measured at FVOCI reclassified to the income statement -10.3 0.9 -9.4
Net credit losses on debt instruments measured at FVOCI -0.8 - -0.8
Translation differences -52.8 - -52.8
Realised (gains)/losses on translation differences
reclassified to the income statement -0.2 - -0.2
Items that will not be reclassified to the income statement
Net unrealised gains/(losses) on equity instruments designated at FVOCI 78.5 -11.8 66.6
Remeasurement of defined benefit obligation -83.0 8.3 -74.7
Other comprehensive income 54.9 -17.7 37.2

inFormation on the ConSolidated BalanCe SheetFINANCIAL STATEMENTS JULIUS BAER GROUP 2020
48
INFORMATION ON THE CONSOLIDATED BALANCE SHEET
NOTE 8 CLASSIFICATION OF FINANCIAL ASSETS AND FINANCIAL LIABILITIES 31.12.2020 FVOCI – FVOCI – Designated Debt Equity Amortised FVTPL as at FVTPL instruments instruments cost total CHF m CHF m CHF m CHF m CHF m CHF mFinancial assets Cash - - - - 14,544.4 14,544.4Due from banks - - - - 7,349.9 7,349.9Lombard loans - - - - 38,408.3 38,408.3Mortgages - - - - 8,799.3 8,799.3Financial assets measured at FVTPL 13,429.8 - - - - 13,429.8Derivative financial instruments 2,562.3 - - - - 2,562.3Financial assets designated at fair value - 269.6 - - - 269.6Financial assets measured at FVOCI - - 13,522.6 273.7 - 13,796.4Accrued income/other assets - - - - 360.8 360.8
total 15,992.1 269.6 13,522.6 273.7 69,462.7 99,520.7 Financial liabilities Due to banks - - - - 5,087.9 5,087.9Due to customers - - - - 77,784.5 77,784.5Financial liabilities measured at FVTPL 896.5 - - - - 896.5Derivative financial instruments 2,554.6 - - - - 2,554.6Financial liabilities designated at fair value - 13,154.8 - - - 13,154.8Debt issued - - - - 1,478.2 1,478.2Accrued expense/other liabilities - - - - 202.9 202.9Deferred payments related to acquisitions 18.8 - - - - 18.8
total 3,469.9 13,154.8 - - 84,553.6 101,178.3

inFormation on the ConSolidated BalanCe SheetFINANCIAL STATEMENTS JULIUS BAER GROUP 2020
49
31.12.2019 FVOCI – FVOCI – Designated Debt Equity Amortised FVTPL as at FVTPL instruments instruments cost Total CHF m CHF m CHF m CHF m CHF m CHF mFinancial assets Cash - - - - 10,097.0 10,097.0Due from banks - - - - 7,082.5 7,082.5Lombard loans - - - - 39,507.5 39,507.5Mortgages - - - - 8,919.8 8,919.8Financial assets measured at FVTPL 13,776.2 - - - - 13,776.2Derivative financial instruments 1,630.7 - - - - 1,630.7Financial assets designated at fair value - 305.0 - - - 305.0Financial assets measured at FVOCI - - 12,934.2 232.0 - 13,166.2Accrued income/other assets - - - - 396.5 396.5
Total 15,406.9 305.0 12,934.2 232.0 66,003.3 94,881.5 Financial liabilities Due to banks - - - - 3,160.0 3,160.0Due to customers - - - - 72,913.1 72,913.1Financial liabilities measured at FVTPL 613.8 - - - - 613.8Derivative financial instruments 2,120.8 - - - - 2,120.8Financial liabilities designated at fair value - 13,281.1 - - - 13,281.1Debt issued - - - - 1,893.0 1,893.0Accrued expense/other liabilities - - - - 250.2 250.2Deferred payments related to acquisitions 34.8 - - - - 34.8
Total 2,769.4 13,281.1 - - 78,216.3 94,266.7

inFormation on the ConSolidated BalanCe SheetFINANCIAL STATEMENTS JULIUS BAER GROUP 2020
50
NOTE 9 FINANCIAL ASSETS AND FINANCIAL LIABILITIES MEASURED AT FVTPL 31.12.2020 31.12.2019 Change
CHF m CHF m CHF m
Financial assets measured at FVtPl
Trading securities – debt FVTPL 3,388.5 2,407.7 980.8
of which quoted 2,655.4 2,133.4 522.0
of which unquoted 733.1 274.3 458.8
Trading securities – equity FVTPL 9,964.7 11,199.0 -1,234.3
of which quoted 8,028.1 7,939.0 89.0
of which unquoted 1,936.6 3,259.9 -1,323.3
Other securities mandatorily measured at FVTPL 76.5 169.5 -93.0
total 13,429.8 13,776.2 -346.4
Financial liabilities measured at FVtPl
Short positions – debt instruments FVTPL 239.5 143.9 95.6
of which quoted 222.1 138.9 83.3
of which unquoted 17.4 5.1 12.3
Short positions – equity instruments FVTPL 657.0 469.8 187.2
of which quoted 626.3 453.9 172.4
of which unquoted 30.7 16.0 14.8
total 896.5 613.8 282.7

inFormation on the ConSolidated BalanCe SheetFINANCIAL STATEMENTS JULIUS BAER GROUP 2020
51
NOTE 10 FINANCIAL ASSETS MEASURED AT FVOCI 31.12.2020 31.12.2019 Change
CHF m CHF m CHF m
Government and agency bonds 4,301.0 5,016.6 -715.6
Financial institution bonds 5,356.9 4,695.4 661.5
Corporate bonds 3,864.7 3,222.2 642.5
debt instruments at FVoCi 13,522.6 12,934.2 588.4
of which quoted 9,045.6 8,843.3 202.3
of which unquoted 4,477.0 4,090.9 386.1
equity instruments at FVoCi 273.7 232.0 41.7
of which unquoted 273.7 232.0 41.7
total 13,796.4 13,166.2 630.1

inFormation on the ConSolidated BalanCe SheetFINANCIAL STATEMENTS JULIUS BAER GROUP 2020
52
NOTE 11 PROPERTY, EQUIPMENT AND LEASES Other property total property Bank premises Leases and equipment and equipment
CHF m CHF m CHF m CHF m
historical cost
Balance on 01.01.2019 418.8 302.5 233.6 955.0
Translation differences - - -1.0 -1.0
Additions 4.5 29.0 23.7 57.1
Additions from
business combinations - - 0.6 0.6
Disposals/transfers1 - - 15.1 15.1
Balance on 31.12.2019 423.3 331.4 241.8 996.5
Translation differences - -2.9 -3.5 -6.3
Additions 4.8 45.1 22.1 72.0
Changes - 0.1 - 0.1
Disposals/transfers1 - 1.7 34.9 36.6
Balance on 31.12.2020 428.1 372.0 225.5 1,025.6
depreciation and impairment
Balance on 01.01.2019 126.4 - 173.3 299.7
Translation differences - -0.4 -0.8 -1.2
Charge for the period 11.1 63.7 25.2 100.0
Disposals/transfers1 - - 14.8 14.8
Balance on 31.12.2019 137.5 63.3 182.9 383.7
Translation differences - -1.0 -1.6 -2.6
Charge for the period 9.5 63.5 27.5 100.5
Disposals/transfers1 - 1.6 34.9 36.5
Balance on 31.12.2020 147.0 124.3 173.8 445.1
Carrying value
Balance on 31.12.2019 285.8 268.1 58.9 612.9
Balance on 31.12.2020 281.1 247.8 51.7 580.5
1 Includes also derecognition of fully depreciated assets
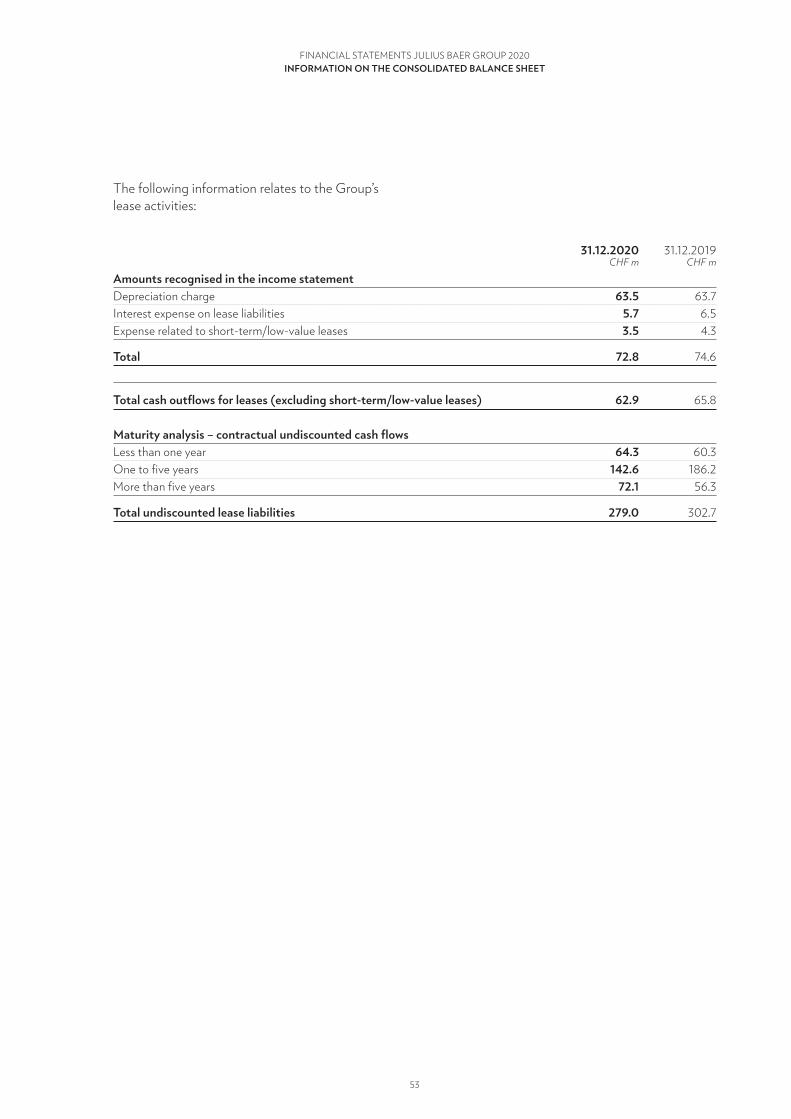
inFormation on the ConSolidated BalanCe SheetFINANCIAL STATEMENTS JULIUS BAER GROUP 2020
53
The following information relates to the Group’s lease activities:
31.12.2020 31.12.2019
CHF m CHF m
amounts recognised in the income statement
Depreciation charge 63.5 63.7
Interest expense on lease liabilities 5.7 6.5
Expense related to short-term/low-value leases 3.5 4.3
total 72.8 74.6
total cash outflows for leases (excluding short-term/low-value leases) 62.9 65.8
maturity analysis – contractual undiscounted cash flows
Less than one year 64.3 60.3
One to five years 142.6 186.2
More than five years 72.1 56.3
total undiscounted lease liabilities 279.0 302.7

inFormation on the ConSolidated BalanCe SheetFINANCIAL STATEMENTS JULIUS BAER GROUP 2020
54
NOTE 12 GOODWILL AND INTANGIBLE ASSETS Customer total
Goodwill relationships Software intangible assets
CHF m CHF m CHF m CHF m
historical cost
Balance on 01.01.2019 2,092.9 1,451.2 935.7 4,479.7
Translation differences -10.2 -6.3 -1.0 -17.4
Additions - - 136.5 136.5
Additions from
business combinations 34.2 26.8 0.2 61.2
Disposals/transfers1 - - 10.7 10.7
Balance on 31.12.2019 2,116.9 1,471.7 1,060.7 4,649.2
Translation differences -45.1 -19.7 -1.4 -66.2
Additions - - 158.5 158.5
Additions from
business combinations 0.2 - - 0.2
Disposals/transfers1 0.3 14.0 56.8 71.2
Balance on 31.12.2020 2,071.7 1,438.0 1,161.0 4,670.6
amortisation and impairment
Balance on 01.01.2019 - 1,147.8 399.7 1,547.5
Translation differences - -2.9 -0.4 -3.3
Charge for the period 99.2 81.2 69.3 2 249.7
Disposals/transfers1 - - 10.7 10.7
Balance on 31.12.2019 99.2 1,226.2 457.8 1,783.1
Translation differences - -8.9 -0.6 -9.5
Charge for the period 179.0 70.1 3 81.3 4 330.5
Disposals/transfers1 - 14.0 56.8 70.8
Balance on 31.12.2020 278.2 1,273.3 481.7 2,033.2
Carrying value
Balance on 31.12.2019 2,017.7 245.5 602.9 2,866.1
Balance on 31.12.2020 1,793.4 164.6 679.3 2,637.4
1 Includes also derecognition of fully amortised assets2 Includes impairment of CHF 4.6 million related to software not used anymore3 Includes impairment of CHF 11.4 million related to Kairos4 Includes impairment of CHF 8.9 million related to software not used anymore

inFormation on the ConSolidated BalanCe SheetFINANCIAL STATEMENTS JULIUS BAER GROUP 2020
55
Balance on Disposals/ Translation Balance on
01.01.2020 Additions Impairment differences 31.12.2020
CHF m CHF m CHF m CHF m CHF m
goodwill
Julius Baer Wealth Management 1,634.0 0.2 0.3 -6.6 1,627.2
Julius Baer Family Office Brasil
(former GPS/Reliance) 131.4 - - -38.5 92.9
Kairos 218.1 - 179.0 -0.0 39.1
NSC Asesores 34.2 - - - 34.2
total 2,017.7 0.2 179.4 -45.1 1,793.4
goodwill – impairment testingTo identify any indications of impairment on good-will, the recoverable amount based on the value in use is determined for the respective cash-generating unit (i.e. for the smallest identifiable group of assets that generates cash inflows independently from other assets) and is subsequently compared to the carrying amount of that unit. Within the Group, cash inflows are not attributable to either any dimension (e.g. geographical areas, booking centres, clients or products) or group of assets. In addition, manage ment makes operating decisions based on information on the Group level (see also Note 21 regarding the determination of the segments). Therefore, the goodwill is allocated to and tested on the level of the Group, except for the subsidiaries Julius Baer Family Office Brasil (former GPS/Reliance), Kairos and NSC Asesores, which are tested on a stand-alone basis. GPS/Reliance, Kairos and NSC Asesores are each regarded a cash-generating unit (CGU) as their cash inflows are generated independently from other assets.
The Group uses a proprietary model based on the discounted cash flow method to calculate the recoverable amount. The Group estimates the free cash flows expected to be generated from the continuing use of the cash-generating units based on its regular financial planning, taking into account the following key parameters and their single components which are relevant for all cash-generating units:
– assets under management;– return on assets (RoA) on the average assets
under management (driven by fees and commissions, trading income and net interest income);
– operating income and expenses; and – tax rate applicable.
To each of these key parameters, reasonably expected growth assumptions are applied in order to calculate the projected cash flows for the next five years, whereof the first three years are based on the detailed budgeting and the remaining two years on the less detailed mid-term planning (particularly net new money). The Group expects in the medium and long term a favourable development of the wealth management activities which is reflected in the respective growth of the key parameters, although the Group cannot exclude short-term market disruptions. The Group also takes into consideration its relative strength as a pure wealth management provider vis-à-vis its peers, which should result in a better-than-average business development in the respective market. Additionally, the estimates of the expected free cash flows take into account the projected investments which are necessary to maintain the level of economic benefits expected to arise from the underlying assets in their current condition. The resulting free cash flows are discounted to present value, using a pre-tax discount rate of 11.0% (2019: 8.8%) for Julius Baer Wealth Management. For Julius Baer Family Office Brasil (former GPS/Reliance), the pre-tax discount rate used is 23.9% (2019: 20.0%), for Kairos, the pre-tax discount rate used is 15.7% (2019: 12.5%), for NSC Asesores, the pre-tax discount rate used is 19.3% (2019: 18.3%). The discount rates used in the calculation represent the Group’s specific risk-weighted rates for the respective cash-gener ating unit and are based, depending on the specific unit, on factors such as the risk-free rate, market risk premium, adjusted Beta, size premium and country risk premium.

inFormation on the ConSolidated BalanCe SheetFINANCIAL STATEMENTS JULIUS BAER GROUP 2020
56
The Group’s approach to determine the key assumptions and related growth expectations is based on management’s knowledge and reasonable expectations of future business, using internal and external market information, planned and/or started business initiatives and other reasonable intentions of manage ment. For that purpose, the Group uses historical information by taking into consideration the current and expected market situations as well as the current and expected future relative market position of the Group vis-à-vis its respective competitors and in its industry. The long-term growth rate beyond management’s planning horizon of five years for assets under management is assumed at 1% for all cash-generating units. This growth rate is considerably below the actual average rate of the last five years.
Changes in key assumptionsDeviations of future actual results achieved vs. forecast/planned key assumptions, as well as future changes of any of the key assumptions based on a future different assessment of the development of relevant markets, and/or businesses, may occur. Such deviations may result from changes in products and client mix, profitability, required types and intensity of personnel resources, general and company- specific personnel cost develop ment and/or changes in the implementation of known or addition of new business initiatives and/or other internal and/or external factors. These changes may cause the value of the business to alter and therefore either increase or reduce the difference between the carrying value in the balance sheet and the unit’s recoverable amount or may even lead to a partial impairment of goodwill.
Management has performed sensitivity analyses on the discount rates and growth rates applied to a forecast period. Under these scenarios, the reasonably possible changes in key assumptions (i.e. discount rate and growth rate) would not result in the carrying amount significantly exceeding the
recoverable amounts for the CGUs Julius Baer Wealth Management, Julius Baer Family Office Brasil (former GPS/Reliance) and NSC Asesores.
Therefore, no impairment resulted from the ordinary analyses for those CGUs. However, there remains a degree of uncertainty involved in the determination of these assumptions due to the general market and business-specific environment.
kairos goodwill impairmentAfter a period of stabilisation at the Italian asset and wealth management company Kairos Investment Management S.p.A. (Kairos), an updated business plan and new entrepreneurial ownership structure have been developed. A select number of key investment managers of Kairos acquired a minority interest in Kairos, with Julius Baer retaining a majority of the legal ownership (refer to Note 31 for further details). The Kairos team will further develop and implement the revised business plan. With these steps, a solid foundation has now been put in place for Kairos’ renewed and sustainable long-term success.
The asset outflows at Kairos have diminished over the past months, resulting in AuM of CHF 5 billion. Nevertheless, in light of Kairos’ overall financial performance and the rebased business plan, which also reflects the economic uncertainties related to the potential impact of the COVID-19 crisis, the value in use further dropped below the carrying value of the CGU; hence, the goodwill on the investment in Kairos has been further impaired to the value in use and the amortisation of the value of client relationships in Kairos has been accelerated. The goodwill charge of EUR 167 million and the charge related to client relationships of EUR 10 million (net of tax) are recognised in the respective line items in the income statement (together approximately CHF 190 million).
In 2019, the Group already recognised a partial goodwill impairment related to Kairos in the amount of EUR 90 million (CHF 99.2 million).
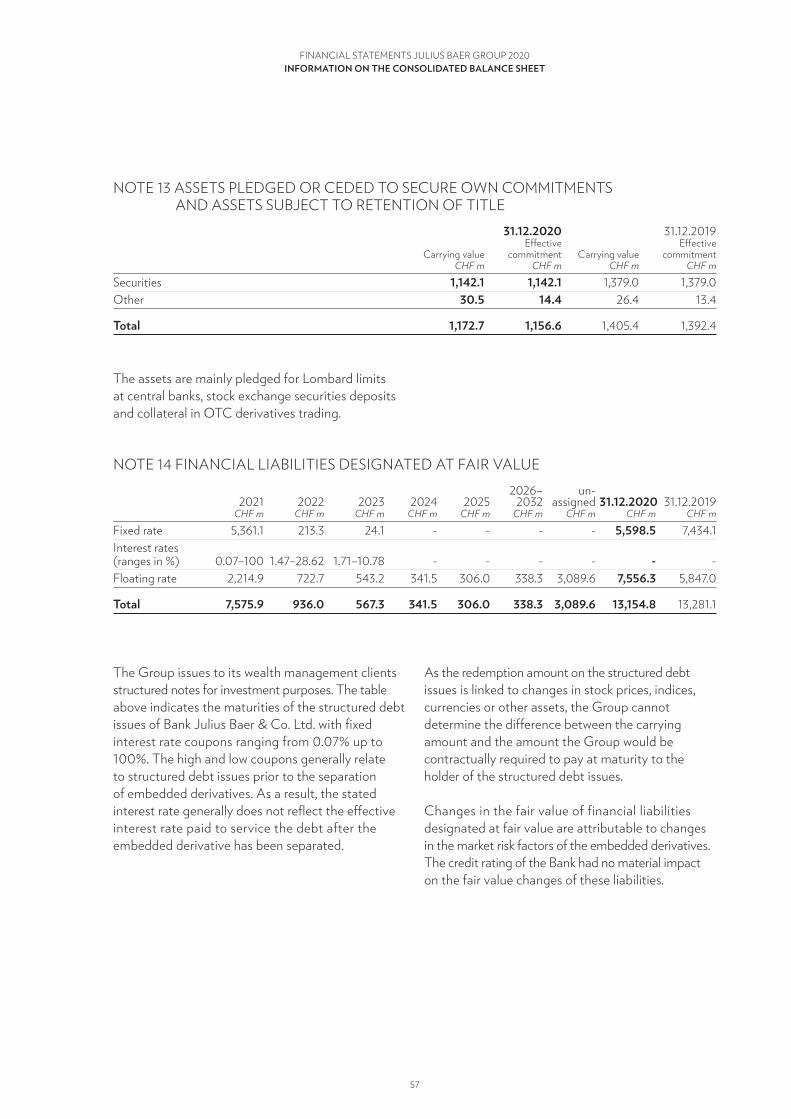
inFormation on the ConSolidated BalanCe SheetFINANCIAL STATEMENTS JULIUS BAER GROUP 2020
57
NOTE 13 ASSETS PLEDGED OR CEDED TO SECURE OWN COMMITMENTS AND ASSETS SUBJECT TO RETENTION OF TITLE
31.12.2020 31.12.2019
Effective Effective
Carrying value commitment Carrying value commitment
CHF m CHF m CHF m CHF m
Securities 1,142.1 1,142.1 1,379.0 1,379.0
Other 30.5 14.4 26.4 13.4
total 1,172.7 1,156.6 1,405.4 1,392.4
The assets are mainly pledged for Lombard limits at central banks, stock exchange securities deposits and collateral in OTC derivatives trading.
NOTE 14 FINANCIAL LIABILITIES DESIGNATED AT FAIR VALUE 2026– un-
2021 2022 2023 2024 2025 2032 assigned 31.12.2020 31.12.2019
CHF m CHF m CHF m CHF m CHF m CHF m CHF m CHF m CHF m
Fixed rate 5,361.1 213.3 24.1 - - - - 5,598.5 7,434.1
Interest rates
(ranges in %) 0.07–100 1.47–28.62 1.71–10.78 - - - - - -
Floating rate 2,214.9 722.7 543.2 341.5 306.0 338.3 3,089.6 7,556.3 5,847.0
total 7,575.9 936.0 567.3 341.5 306.0 338.3 3,089.6 13,154.8 13,281.1
The Group issues to its wealth management clients structured notes for investment purposes. The table above indicates the maturities of the structured debt issues of Bank Julius Baer & Co. Ltd. with fixed interest rate coupons ranging from 0.07% up to 100%. The high and low coupons generally relate to structured debt issues prior to the sep aration of embedded derivatives. As a result, the stated in terest rate generally does not reflect the effective in terest rate paid to service the debt after the embedded derivative has been separated.
As the redemption amount on the structured debt issues is linked to changes in stock prices, indices, currencies or other assets, the Group cannot determine the difference between the carrying amount and the amount the Group would be contractually required to pay at maturity to the holder of the structured debt issues.
Changes in the fair value of financial liabilities designated at fair value are attributable to changes in the market risk factors of the embedded derivatives. The credit rating of the Bank had no material impact on the fair value changes of these liabilities.

inFormation on the ConSolidated BalanCe SheetFINANCIAL STATEMENTS JULIUS BAER GROUP 2020
58
NOTE 15 DEBT ISSUED 31.12.2020 31.12.2019
CHF m CHF m
Money market instruments 135.5 145.8
Bonds 1,342.7 1,747.3
total 1,478.2 1,893.0
Bonds
31.12.2020 31.12.2019
Stated Notional Carrying Carrying
Issuer/Year of issue interest rate Currency amount value 1 value 1
% m CHF m CHF m
Julius Baer group ltd.
Perpetual tier 1
20142 4.25 subordinated bond CHF 350.0 - 344.1
Julius Baer group ltd.
Perpetual tier 1
20153 5.90 subordinated bond SGD 450.0 - 326.6
Julius Baer group ltd.
Perpetual tier 1
20164 5.75 subordinated bond SGD 325.0 221.7 235.6
Julius Baer group ltd.
Perpetual tier 1
20175 4.75 subordinated bond USD 300.0 265.5 294.1
Julius Baer group ltd.
Domestic senior
20176 0.375 unsecured bond CHF 200.0 203.9 203.1
Julius Baer group ltd.
Perpetual tier 1
20197 2.375 subordinated bond CHF 350.0 348.5 343.8
Julius Baer group ltd.
Perpetual tier 1
20208 4.875 subordinated bond USD 350.0 303.2 -
total 1,342.7 1,747.3
1 The Group applies fair value hedge accounting for certain bonds based on specific interest rate swaps. The changes in the fair value that are attributable to the hedged risk are reflected in an adjustment to the carrying value of the bond.
2 Own bonds of CHF 5.5 million were offset with bonds outstanding in 2019. The effective interest rate amounted to 4.41%.3 No own bonds were offset with bonds outstanding in 2019. The effective interest rate amounted to 6.128%.4 No own bonds are offset with bonds outstanding (2019: none). The effective interest rate amounts to 5.951%.5 Own bonds of CHF 9.1 million are offset with bonds outstanding. (2019: none). The effective interest rate amounts to 4.91%.6 No own bonds are offset with bonds outstanding (2019: none). The effective interest rate amounts to 0.32361%.7 No own bonds are offset with bonds outstanding (2019: CHF 4.4 million). The effective interest rate amounts to 2.487%.8 No own bonds are offset with bonds outstanding. The effective interest rate amounts to 5.242%.

inFormation on the ConSolidated BalanCe SheetFINANCIAL STATEMENTS JULIUS BAER GROUP 2020
59
Perpetual tier 1 subordinated bondsThe maturities of the perpetual tier 1 subordinated bonds issued by Julius Baer Group Ltd. are essentially perpetual. These bonds are unsecured, subordinate to all borrowings (with the exception of the remainder of the tier 1 capital), fully paid up, capable of sustaining losses and devoid of any voting rights. The bonds can first be redeemed, at the Issuer’s discretion, five to seven years after their issue date, and at yearly or half-yearly intervals thereafter, provided the regulator approves such redemption. In addition, the bonds may also be redeemed upon a regulatory event or tax event, as described in the prospectus. In the case of a viability event occurring, i.e. at a point in time where there is a threat of insolvency (‘Point of non-viability’ or ‘PONV’), as described in Article 29 of the Capital Adequacy Ordinance of the Swiss Financial Market Supervisory Authority FINMA (CAO), all monies (including par value and any interest) due on the bonds will automatically cease to be payable and the bonds will be completely written off (i.e. their value will be written down to zero). Should a trigger event occur – i.e. should tier 1 common equity (under Basel III) fall below 5.125% (2019 issue) or 7.0% (2016, 2017 and 2020 issues) – the value of the bonds will be written down to ensure that the Write-Down Threshold Ratio which originally triggered the event is restored to a level equal to or exceeding its trigger level. Here, too, in a worst-case scenario all monies due on the bonds will cease to be payable in their entirety. In the event of the monies payable on the bonds ceasing to be payable either in part or in full, no subsequent increase in the value of the bonds is envisaged or permitted. From the issue date to the reset date the bonds will pay interest at a fixed rate. Thereafter, the interest payable on the bonds will be refixed for the next five years at a rate equal to the sum of the benchmark rate and a margin. Interest on the bonds is payable, in arrears on a 30/360-day basis, until the bonds have either been redeemed or fully written off. Interest payments on the bonds are prohibited in the event of this being ordered by the regulator (FINMA) or should there be insufficient retained earnings on the balance sheet of Julius Baer Group Ltd. to finance the payment of interest on tier 1 capital and to make any distributions already planned in respect of the
previous financial year. Once suspended, any interest payments will permanently cease to be payable. Such interest payments are not cumulative, nor will they be paid at any future date. In the event of interest payments on the bonds being suspended, the Board of Directors of Julius Baer Group Ltd. will not be permitted to recommend any dividend payments to the Annual General Meeting until such time as interest payments on the bonds are resumed. Moreover, in the event of interest payments on the bonds being suspended, Julius Baer Group Ltd. will not repurchase any of its own shares, neither directly nor indirectly.
2014 issueThe perpetual tier 1 subordinated bond was issued by Julius Baer Group Ltd. on 5 June 2014. The bonds can first be redeemed, at the Issuer’s discretion, six years after their issue date (i.e. on 5 June 2020). From the issue date to the reset date (5 June 2020) the bonds will pay interest at a fixed rate of 4.25% per annum. Thereafter, the interest payable on the bonds will be refixed for the next five years at a rate equal to the sum of the benchmark rate (i.e. the five-year mid-market CHF swap rate) and a margin of 3.7625%. Interest on the bonds is payable annually in arrears on 5 June in each year. The bond was paid back on the first possible redemption date (5 June 2020) at par value plus accrued interest.
2015 issueThe perpetual tier 1 subordinated bond, which is denominated in SGD, was issued by Julius Baer Group Ltd. on 18 November 2015. The bonds can first be redeemed, at the Issuer’s discretion, five years after their issue date (i.e. on 18 November 2020). From the issue date to the reset date (18 November 2020) the bonds will pay interest at a fixed rate of 5.9% per annum. Thereafter, the interest payable on the bonds will be refixed for the next five years at a rate equal to the sum of the benchmark rate (i.e. the five-year SGD swap offer rate) and a margin of 3.32%. Interest on the bonds is payable semi-annually in arrears on 18 May and 18 November in each year. The bond was paid back on the first possible redemption date (18 November 2020) at par value plus accrued interest.

inFormation on the ConSolidated BalanCe SheetFINANCIAL STATEMENTS JULIUS BAER GROUP 2020
60
2016 issueThe perpetual tier 1 subordinated bond, which is denominated in SGD, was issued by Julius Baer Group Ltd. on 20 October 2016. The bonds can first be redeemed, at the Issuer’s discretion, on 20 April 2022. From the issue date to the reset date (20 April 2022) the bonds will pay interest at a fixed rate of 5.75% per annum. Thereafter, the interest payable on the bonds will be refixed for the next five years at a rate equal to the sum of the benchmark rate (i.e. the five-year SGD swap offer rate) and a margin of 3.915%. Interest on the bonds is payable semi-annually in arrears on 20 April and 20 October in each year.
2017 issueThe perpetual tier 1 subordinated bond, which is denominated in USD, was issued by Julius Baer Group Ltd. on 12 September 2017. The bonds can first be redeemed, at the Issuer’s discretion, on 12 September 2024 and on every semi-annual interest payment date thereafter. From the issue date to the first reset date (12 September 2024) the bonds will pay interest at a fixed rate of 4.75% per annum. Thereafter, the interest payable on the bonds will be refixed for the next five years at a rate equal to the sum of the benchmark rate (i.e. the five-year USD constant maturity treasury rate) and a margin of 2.844%. Interest on the bonds is payable semi-annually in arrears on 12 March and 12 September in each year.
2019 issueThe perpetual tier 1 subordinated bond, which is denominated in CHF, was issued by Julius Baer Group Ltd. on 25 June 2019. The bonds can be redeemed at the Issuer’s discretion anytime in the three months prior to and including the first reset
date (25 September 2025) and on every annual interest payment date thereafter. From the issue date to the first reset date (25 September 2025) the bonds will pay an annual interest at a fixed rate of 2.375% on 25 September of each year (first long coupon on 25 September 2020). Thereafter, the interest payable on the bonds will be refixed for the next five years equal to the sum of the benchmark rate (i.e. the five-year CHF mid-market swap rate) and a margin of 2.861%. Interest on the bonds is payable annually on 25 September of each year.
2020 issueThe perpetual tier 1 subordinated bond, which is denominated in USD, was issued by Julius Baer Group Ltd. on 29 September 2020. The bonds can be redeemed at the Issuer’s discretion anytime in the six months prior to and including the first reset date (8 October 2026) and on every semi-annual interest payment date thereafter. From the issue date to the first reset date (8 October 2026) the bonds will pay interest at a fixed rate of 4.875% per annum. Thereafter, the interest payable on the bonds will be refixed for the next five years at a rate equal to the sum of the benchmark rate (i.e. the yield for U.S. Treasury Securities at ‘constant maturity’ for a designated maturity of five years) and a margin of 4.616%. Interest on the bonds is payable semi-annually in arrears on 8 April and 8 October in each year.
Senior unsecured issueThe senior unsecured bond, which is denominated in CHF, was issued by Julius Baer Group Ltd. on 6 December 2017. The bonds have a final maturity on 6 December 2024 and pay interest at a fixed rate of 0.375% per annum paid annually on 6 December in each year.

inFormation on the ConSolidated BalanCe SheetFINANCIAL STATEMENTS JULIUS BAER GROUP 2020
61
NOTE 16A DEFERRED TAX ASSETS 31.12.2020 31.12.2019
CHF m CHF m
Balance at the beginning of the year 16.4 15.9
Income statement – credit 6.1 5.2
Income statement – charge -2.1 -2.2
Recognised directly in OCI 0.0 0.0
Translation differences and other adjustments -0.4 -2.5
Balance at the end of the year 20.1 16.4
The components of deferred tax assets are as follows:
Pension liabilities 14.9 24.0
Operating loss carryforwards 14.7 9.0
Employee compensation and benefits 10.3 12.3
Property and equipment 2.3 1.5
Other 0.3 0.7
Deferred tax assets before set-off1 42.6 47.4
Offset -22.5 -31.0
total 20.1 16.4
1 For balance sheet purposes, the Group recognises either a deferred tax asset or a deferred tax liability as per consolidated companies if that company is allowed to net its deferred tax assets and deferred tax liabilities in line with the local tax rules. Disaggregation of these net balances (in this case deferred tax assets) into the single components may result in negative amounts (in this case deferred tax liabilities) which are disclosed as offsetting amounts.
Deferred tax assets related to operating loss carryforwards are assessed at each year-end with regard to their sustainability based on the actual three-year business forecast.

inFormation on the ConSolidated BalanCe SheetFINANCIAL STATEMENTS JULIUS BAER GROUP 2020
62
NOTE 16B DEFERRED TAX LIABILITIES 31.12.2020 31.12.2019
CHF m CHF m
Balance at the beginning of the year 68.8 74.9
Income statement – charge 7.1 8.6
Income statement – credit -6.7 -31.7
Acquisition of subsidiaries - 2.1
Recognised directly in OCI 7.5 17.7
Translation differences and other adjustments -2.2 -2.8
Balance at the end of the year 74.5 68.8
The components of deferred tax liabilities1 are as follows:
Provisions 5.0 3.4
Property and equipment 28.8 29.7
Financial assets measured at FVOCI 44.9 38.7
Intangible assets 15.4 24.3
Other 3.0 3.7
Deferred tax liability before set-off2 96.9 99.8
Offset -22.5 -31.0
total 74.5 68.8
1 The temporary differences associated with investments in subsidiaries do not lead to deferred tax liabilities, as the Group is able to control the timing of the reversal of the temporary difference and it is probable that the temporary differences will not reverse in the foreseeable future.
2 For balance sheet purposes, the Group recognises either a deferred tax asset or a deferred tax liability as per consolidated companies if that company is allowed to net its deferred tax assets and deferred tax liabilities in line with the local tax rules. Disaggregation of these net balances (in this case deferred tax liabilities) into the single components may result in negative amounts (in this case deferred tax assets) which are disclosed as offsetting amounts.

inFormation on the ConSolidated BalanCe SheetFINANCIAL STATEMENTS JULIUS BAER GROUP 2020
63
NOTE 17 PROVISIONS 2020 2019
Legal risks Other total Total CHF m CHF m CHF m CHF m
Balance at the beginning of the year 197.6 3.7 201.3 24.6
Utilised during the year -153.3 -1.1 -154.4 -23.3
Recoveries - - - 0.1
Provisions made during the year 89.9 2.1 92.0 204.9
Provisions reversed during the year -14.9 - -14.9 -2.7
Translation differences -7.9 -0.1 -8.0 -2.2
Balance at the end of the year 111.4 4.5 115.9 201.3
maturity of provisions
Up to one year 23.6 2.9 26.6 186.6
Over one year 87.8 1.6 89.4 14.7
introductionThe Group operates in a legal and regulatory environment that exposes it to significant litigation, compliance, reputational and other risks arising from disputes and regulatory proceedings.
Non-compliance with regulatory requirements may result in regulatory authorities taking enforcement action or initiating criminal proceedings against the Group and/or its employees. Possible sanctions could include the revocation of licences to operate certain businesses, the order to suspend or limit certain activities, the suspension or expulsion from a particular jurisdiction or market of any of the Group’s business organisations or their key personnel, the imposition of fines, the disgorgement of profit, and censures on companies and employees with respective impact on the reputation of the Group and its relation with clients, business partners and other stakeholders. In certain markets, authorities, such as regulatory or tax authorities, may determine that industry practices, e.g. regarding the provision of services, are or have become inconsistent with their interpretations of existing local laws and regulations. Also, from time to time, the Group is and may be confronted with information and clarification requests and procedures from authorities and other third parties (e.g. related to conflicting laws, sanctions etc.) as well as with enforcement procedures with respect
to certain topics. As a matter of principle, the Group cooperates with the competent authorities within the confines of applicable laws to clarify the situation while protecting its own interests.
The risks described below may not be the only risks to which the Group is exposed. The additional risks not presently known or risks and proceedings currently deemed immaterial may also impair the Group’s future business, results of operations, financial condition and prospects. The materialisation of one or more of these risks may individually or together with other circumstances have a materially adverse impact on the Group’s business, results of operations, financial condition and prospects.
legal proceedings/contingent liabilitiesThe Group is involved in various legal, regulatory and administrative proceedings concerning matters arising within the course of normal business operations. The current business environment involves substantial legal and regulatory risks, the impact of which on the financial position or profitability of the Group – depending on the status of related proceedings – is difficult to assess.
The Group establishes provisions for pending and threatened legal proceedings if management is of the opinion that such proceedings are more

inFormation on the ConSolidated BalanCe SheetFINANCIAL STATEMENTS JULIUS BAER GROUP 2020
64
likely than not to result in a financial obligation or loss, or if the dispute for economic reasons should be settled without acknowledgement of any liability on the part of the Group and if the amount of such obligation or loss can already be reasonably estimated.
In rare cases in which the amount cannot be reasonably estimated due to the early stage of the proceedings, the complexity of the proceedings and/or other factors, no provision is recognised but the case is disclosed as a contingent liability as of 31 December 2020. The contingent liabilities may result in a materially adverse effect on the Group or for other reasons may be of interest to investors and other stakeholders.
In 2010 and 2011, litigation was commenced against Bank Julius Baer & Co. Ltd. (the ‘Bank’) and numerous other financial institutions by the liquidators of the Fairfield funds (the ‘Fairfield Liquidators’), the latter having served as feeder funds for the Madoff fraudulent investment schemes. In the direct claims against the Bank, the Fairfield Liquidators are seeking to recover a total amount of approximately USD 64 million in the courts of New York (including USD 17 million that relates to redemption payments made to clients of ING Bank (Suisse) SA, which merged with the Bank in 2010, and approximately USD 25 million that relates to redemption payments made to clients of Merrill Lynch Bank (Suisse) SA, which merged with the Bank in 2013, such claims in principle being subject to acquisition-related representation and warranties provisions). The proceedings in the courts of the British Virgin Islands, where an amount of approximately USD 8.5 million had been claimed from the Bank, were finally dismissed in favour of the Bank with a ruling of the Privy Council, the highest court of appeals for the British Virgin Islands. In addition to the direct claims against the Bank, the Fairfield Liquidators have made combined claims in the amount of approximately USD 1.8 billion against more than 80 defendants, with only a fraction of this amount being sought from the Bank (and ultimately its clients concerned). The combined claims aggregate the damages asserted against all defendants, such that a reliable allocation of the claimed amounts between the Bank and the other defendants cannot be made at this time.
Finally, in further proceedings, the trustee of Madoff’s broker-dealer company (the ‘Trustee’) seeks to recover over USD 83 million in the courts of New York (including USD 46 million that relates to redemption payments made to clients of Merrill Lynch Bank (Suisse) SA, which merged with the Bank in 2013, such claims in principle being subject to acquisition-related representation and warranties provisions), largely in relation to the same redemption payments which are the subject matter of the claims asserted by the Fairfield Liquidators. The Bank is challenging these actions on procedural and substantive grounds and has taken further measures to defend and protect its interests. In the proceedings initiated by the Trustee, the Bankruptcy Court in New York dismissed the case against the Bank and other defendants based on extraterritoriality principles in November 2016. The Trustee has appealed this decision, and, in February 2019, the Court of Appeal has reversed the decision by the Bankruptcy Court. The Supreme Court denied reviewing such decision, therefore the proceedings continue with the Bankruptcy Court. In the proceedings initiated by the Liquidators, the Bankruptcy Court in New York decided in December 2018 on certain aspects, which have been appealed by the Liquidators. A decision on the merits of the appeal is expected in 2021. Whilst such appeal is pending, the Bankruptcy Court has additionally decided on certain other aspects in the Bank’s favour in late 2020. Such decision can be appealed.
In a landmark decision on so-called retrocessions, the Swiss Federal Supreme Court ruled in 2012 that the receipt of fund trailer fees by a bank in connection with a Discretionary Portfolio Management mandate may create a potential conflict of interest in the execution of the mandate. The Court considered that by receiving trailer fees in the context of such mandate, a bank may be inclined not to act in the best interest of the client. Therefore, based on applicable Swiss mandate law, a bank shall not only account for fund trailer fees obtained from third parties in connection with a client’s mandate, but also be obliged to forward respective amounts to a client, provided the client has not validly waived the right to reclaim such fees. Bank Julius Baer & Co. Ltd. has assessed this decision by the Swiss Federal Supreme Court,

inFormation on the ConSolidated BalanCe SheetFINANCIAL STATEMENTS JULIUS BAER GROUP 2020
65
other relevant court decisions in this context, the mandate structures to which the Court decisions might be applicable and the documentation as well as the impact of respective waivers and communicated bandwidths that were introduced some years ago, and has implemented appropriate measures to address the matter.
Bank Julius Baer & Co. Ltd. is confronted with a claim by the liquidator of a Lithuanian corporation arguing that the Bank did not prevent two of its clients from embezzling assets of such corporation. In this context, the liquidator as of 2013 presented draft complaints with different claim amounts for a potential Swiss proceeding and initiated payment orders (‘Betreibungsbegehren’) against the Bank in the amount of CHF 422 million (plus accrued interest from 2009). On 8 February 2017, the Bank was served with a claim from said Lithuanian corporation in liquidation in the amount of EUR 306 million. The court proceeding against the Bank was initiated in Lithuania. On 19 October 2018, the Lithuanian court of last instance definitively rejected local jurisdiction, thereby terminating the litigation against the Bank in Lithuania. On 1 July 2019, the Bank was served with a conciliation request from the liquidator representing the assets of the Lithuanian corporation in liquidation filed with the first instance court in Geneva, related to a claim of EUR 335 million plus accrued interest since 2011. On 8 January 2020, the Bank was served with the corresponding claim in the amount of EUR 335 million plus 5% interest since December 2011. The Bank is continuing to contest the claim whilst taking appropriate measures to defend its interests.
In the context of an investigation against a former client regarding alleged participation in an environmental certificate-trading-related tax fraud in France, a formal procedure into suspected lack of due diligence in financial transactions was initiated against Bank Julius Baer & Co. Ltd. in June 2014 and dismissed for formal reasons by a Court Order in March 2017. The deposit in the amount of EUR 3.75 million made in October 2014 by the Bank with the competent French court as a precautionary measure representing the amount of a potential fine accordingly was reimbursed to the Bank. However, in July 2017 the same amount was deposited again as
a new investigatory procedure with respect to the same matter was initiated against the Bank. In May 2020, following an application by the prosecutor, the court admitted a new indictment against the Bank in this matter, scheduled to be trialed in Court in early June 2021. The Bank has cooperated with the French authorities within the confines of applicable laws to clarify the situation and to protect its interests.
Bank Julius Baer & Co. Ltd. is confronted with a claim by a former client arguing that the Bank initiated transactions without appropriate authorisations and that the Bank has not adhered to its duties of care, trust, information and warnings. In April 2015, the former client presented a complaint for an amount of USD 70 million (plus accrued interest) and BRL 24 million, which, in January 2017, he supported with a payment order (‘Betreibungsbegehren’) in various currencies filed against the Bank in the total amount of then approximately CHF 91.3 million (plus accrued interest). Since December 2017, the Bank has received yearly payment orders in various currencies in the total amount of currently approximately CHF 135 million (plus accrued interest). The Bank is contesting the claim whilst taking appropriate measures to defend its interests.
In November 2014, Bank Julius Baer & Co. Ltd. was served in Geneva with a claim by an investment fund, acting on its behalf and on behalf of three other funds, in the total amount of USD 29 million (plus accrued interests). The funds were former clients of Bank of China (Suisse) SA, which was acquired by Bank Julius Baer & Co. Ltd. in 2012. Additionally, in October 2015, the claimant filed an amendment of claim in court, by which a further USD 39 million was claimed. In March 2017, the claimant reduced the total claimed amount to USD 44.6 million. The claimant argues that Bank of China (Suisse) SA acted not only as a custodian bank, but also as secured creditor and manager of the funds, and tolerated excess in leverage. It claims that the funds suffered a severe loss consequent upon the liquidation of almost their entire portfolio of assets in May 2010 and argues that this liquidation was performed by Bank of China (Suisse) SA without the consent of the funds’ directors and was ill-timed, disorderly and occurred in exceptionally unusual market conditions. The Bank is contesting
inFormation on the ConSolidated BalanCe SheetFINANCIAL STATEMENTS JULIUS BAER GROUP 2020
66
the claim whilst taking appropriate measures to defend its interests. In addition, such claims are subject to acquisition-related representations and warranties.
Bank Julius Baer & Co. Ltd. has been cooperating with authorities investigating corruption and bribery allegations surrounding Fédération Internationale de Football Association (FIFA) in Switzerland and the USA. These requests in particular focused on persons named in the so-called ‘FIFA Indictment’ of 20 May 2015 (Indictment ‘United States v. Webb [E.D.N.Y. 15 CR 0252 (RJD)(RML)]’) and in the respective superseding indictment of 25 November 2015. The authorities in Switzerland and abroad have opened investigations and have been inquiring whether financial institutions failed to observe due diligence standards as applied in financial services and in particular in the context of anti-money laundering laws in relation to suspicious and potentially illegal transactions. FINMA’s related enforcement procedure against Bank Julius Baer & Co. Ltd. and Julius Baer Group Ltd. has been closed by an order as published on 20 February 2020. On 9 November 2020, Bank Julius Baer & Co. Ltd. has announced an agreement in principle with the US Department of Justice (DOJ) to settle its FIFA matter. Such agreement entails Julius Baer entering into a three-year deferred prosecution agreement and a financial component, for which Julius Baer has taken a provision of USD 79.7 million in 2020.
Similarly, Bank Julius Baer & Co. Ltd. has received inquiries from, and has been cooperating with, authorities in Switzerland and the USA investigating corruption and bribery allegations surrounding Petróleos de Venezuela S.A. (PDVSA). These requests in particular focus on persons named in the indictment ‘United States of America v. Francisco Convit Guruceaga, et al.’ of 23 July 2018. The authorities in Switzerland and abroad have, in addition to the corruption and bribery allegations against third parties, opened investigations and are
inquiring whether financial institutions failed to observe due diligence standards as applied in financial services and in particular in the context of anti-money laundering laws in relation to suspicious and potentially illegal transactions. FINMA’s related enforcement procedure against Bank Julius Baer & Co. Ltd. and Julius Baer Group Ltd. has been closed by an order as published on 20 February 2020. Julius Baer has been supporting related inquiries and investigations and has been cooperating with the competent authorities, whilst on 21 January 2021, FINMA concluded the investigation regarding individual accountability of former employees of Julius Baer following the FIFA/PDVSA-related conclusion of the enforcement proceeding. Save for in one case of a middle manager, FINMA did not open individual proceedings and closed the investigation with reprimands. Related to the PDVSA matter, in November 2019, a former employee filed a labour law-based claim in the amount of USD 34.1 million in Venezuela against several Julius Baer companies combined with a respective precautionary seizure request in the double amount. Julius Baer is contesting the claim and seizure request whilst taking appropriate measures to defend its interests.
As publicly stated, FINMA has initiated an additional enforcement procedure against Bank Julius Baer & Co. Ltd. and Julius Baer Group Ltd. related to the compliance treatment of a historical Latin American client relationship. Julius Baer has been fully cooperating with FINMA in its investigative work.
The UK Financial Conduct Authority (‘FCA’) is investigating Julius Baer International Limited, UK (‘JBINT’) in respect of its compliance with certain of the FCA’s Principles for Businesses and underlying regulatory rules in the context of a legacy matter. The investigation by the FCA into another legacy matter was completed in December 2020 with the FCA having decided not to take action against JBINT. JBINT has been fully cooperating with the FCA in its investigative work.

inFormation on the ConSolidated BalanCe SheetFINANCIAL STATEMENTS JULIUS BAER GROUP 2020
67
Bank Julius Baer & Co. Ltd. is confronted with a Swiss court procedure in which a client, in the context of a mature loan arrangement, requests the release of certain assets, which have been blocked by the Bank and third-party custodians and their sub-custodians under US Office of Foreign Assets Control (‘OFAC’) sanctions. The procedure relates to questions of applicability and enforceability of international sanctions and orders under local Swiss law. The Bank is defending its position in the context of its regulatory duties to respect international orders and sanctions and abide by its contractual agreements with third-party custody banks. The competent court has decided in favour of the Bank in November 2020; however, the claimant has appealed this decision to the Swiss Federal Supreme Court. In addition, against the background of recent political and regulatory intensification of the topic of international sanctions, the Bank has addressed this issue with the OFAC with which it is also in resumed discussion to resolve certain open issues with regard to historic compliance with OFAC regulations.

inFormation on the ConSolidated BalanCe SheetFINANCIAL STATEMENTS JULIUS BAER GROUP 2020
68
NOTE 18A OTHER ASSETS 31.12.2020 31.12.2019
CHF m CHF m
Precious metals (physical) 4,357.7 1,444.3
Tax receivables 1,718.4 1,982.9
Accounts receivable 28.6 29.1
Deposits 17.3 16.1
Other 232.0 162.1
total 6,354.1 3,634.5
NOTE 18B OTHER LIABILITIES 31.12.2020 31.12.2019
CHF m CHF m
Lease liability 260.9 272.8
Pension liability 95.9 143.3
Other tax payable 67.4 58.3
Accounts payable 35.2 28.7
Deferred payments related to acquisitions 18.8 34.8
Other 179.9 104.7
total 658.1 642.7
NOTE 19 SHARE CAPITAL Registered shares (CHF 0.02 par)
Number CHF m
Balance on 01.01.2019 223,809,448 4.5
of which entitled to dividends 223,809,448 4.5
Balance on 31.12.2019 223,809,448 4.5
of which entitled to dividends 223,809,448 4.5
Balance on 31.12.2020 223,809,448 4.5
of which entitled to dividends 223,809,448 4.5

additional inFormationFINANCIAL STATEMENTS JULIUS BAER GROUP 2020
69
ADDITIONAL INFORMATION
NOTE 20 EARNINGS PER SHARE AND SHARES OUTSTANDING 2020 2019
Basic earnings per share
Net profit attributable to shareholders of Julius Baer Group Ltd. (CHF m) 698.0 464.8
Weighted average number of shares outstanding 215,016,327 216,973,692
Basic earnings per share (CHF) 3.25 2.14
diluted earnings per share
Net profit attributable to shareholders of Julius Baer Group Ltd. (CHF m) 698.0 464.8
Less (profit)/loss on equity derivative contracts (CHF m) -2.8 -3.6
Net profit attributable to shareholders of Julius Baer Group Ltd.
for diluted earnings per share (CHF m) 695.2 461.1
Weighted average number of shares outstanding 215,016,327 216,973,692
Dilution effect -276 43,669
Weighted average number of shares outstanding for diluted earnings per share 215,016,051 217,017,361
Diluted earnings per share (CHF) 3.23 2.12
31.12.2020 31.12.2019
Shares outstanding
Total shares issued at the beginning of the year 223,809,448 223,809,448
Share buy-back programme 2,585,000 755,000
Less treasury shares 6,192,089 6,125,662
total 215,032,359 216,928,786

additional inFormationFINANCIAL STATEMENTS JULIUS BAER GROUP 2020
70
NOTE 21 REPORTING BY SEGMENT
The Group engages exclusively in wealth management activities primarily in Switzerland, Europe, Asia and South America. This focus on pure-play wealth management includes certain internal supporting functions which serve entirely the core business activities. Revenues from wealth management activities primarily encompass commissions charged for servicing and advising wealth management clients as well as net interest income on financial instruments.
The Group’s external segment reporting is based on the internal reporting to the chief operating decision maker, which is responsible for allocating re sources and assesses the financial performance of the business. The Executive Board of the Group has been identified as the chief ope rating decision maker, as this board is responsible for the implemen tation of the overall strategy and the operational management of the whole Group. In 2020, the Executive Board of the Group is composed of the Chief Exe cutive Officer, Chief Financial Officer, Heads of Regions (Switzerland, Europe, Middle East & Africa/Asia Pacific/Americas), Heads of Investments & Wealth Management Solutions, Chief Investment Officer, Chief Operating Officer & Head Intermediaries and Chief Risk Officer. In 2019, the Executive Board of the Group was composed of the Chief Executive
Officer, Chief Financial Officer, Chief Communications Officer, Chief Risk Officer, Chief Operating Officer and General Counsel.
Various management reports with discrete financial information are prepared at regular intervals for various management levels. However, the Executive Board of the Group reviews and uses for its manage-ment decisions the consolidated financial reports on the level of the Group only.
In accordance with the applicable rules and based on the analysis of the relevant factors determining segments, the Group consists of a single report able segment. This is in line with the strategy and business model of the Group and reflects the management structure and the use of information by management in making operating decisions. Although Julius Baer Family Office Brasil (former GPS/Reliance), Kairos and NSC Asesores represent separate cash-generating units for the purpose of the goodwill impairment testing (refer to Note 12 for details), they do not constitute segments on their own.
Therefore, the Group does not disclose separate segment information, as the external reporting provided in these financial statements reflects the internal management accounting.
entity-wide disclosures
31.12.2020 31.12.2019 2020 2019 2020 2019
Operating
Total assets income Investments
CHF m CHF m CHF m CHF m CHF m CHF m
Switzerland 91,530 85,845 2,012 1,832 150 189
Europe (excl. Switzerland) 36,682 40,349 699 700 11 16
Americas 252 938 75 113 2 6
Asia and other countries 28,029 27,941 1,006 893 23 16
Less consolidation items 47,356 53,038 209 154
total 109,137 102,035 3,583 3,383 186 226
The information about geographical areas is based on the domicile of the reporting company. This geo graphical information does not reflect the way the Group is managed.

additional inFormationFINANCIAL STATEMENTS JULIUS BAER GROUP 2020
71
NOTE 23 PENSION PLANS
The Group maintains various defined contribution and defined benefit pension plans in Switzerland and abroad. The pension plans in Switzerland have been set up on the basis of the Swiss method of defined contributions under the Swiss pension law. Employees and pensioners or their survivors receive statutorily determined benefits upon leaving the Group or retiring as well as in the event of death or invalidity. These benefits are the result of the conversion rate applied on the accumulated balance of the individual plan participant’s pension account at the retirement date. The accumulated balance equals the sum of the regular employer’s and employee’s contribution that have been made during the employment period, including the accrued interest on these amounts. However, these plans do not fulfil all the criteria of a defined contribution pension plan according to IAS 19 and are therefore treated as defined benefit pension plans for the purpose of the Group’s financial statements.
The pension obligations are largely covered through pension plan assets of pension funds that are legally separated and independent from the Group. In case the plans become significantly underfunded over an extended time period according to the Swiss pension law basis, the Group and the employees share the risk of additional payments into the pension fund. The pension funds are managed by a board of trustees consisting of representatives of the em ployees and the employer. Management of the pension funds includes the pursuit of a medium- and long-term consistency and sustainability between the pension plans’ assets and liabilities, based on a diversified investment strategy correlating with the maturity of the pension obligations. The organi sation, manage ment, financing and investment strategy of the pension plans comply with the legal requirements, the foundation charters and the ap plicable pension regulations.

additional inFormationFINANCIAL STATEMENTS JULIUS BAER GROUP 2020
72
2020 2019
CHF m CHF m
1. development of pension obligations and assets
Present value of defined benefit obligation at the beginning of the year -3,234.3 -2,907.2
Current service cost -82.6 -76.7
Employees’ contributions -45.6 -45.9
Interest expense on defined benefit obligation -9.5 -27.4
Past service cost, curtailments, settlements, plan amendments -0.6 -4.5
Benefits paid (including benefits paid directly by employer) 118.0 137.3
Transfer payments in/out -0.6 -1.0
Experience gains/(losses) on defined benefit obligation -35.0 -78.7
Actuarial gains/(losses) arising from change in demographic assumptions -0.0 1.0
Actuarial gains/(losses) arising from change in financial assumptions -46.5 -230.6
Translation differences 5.7 -0.7
Present value of defined benefit obligation at the end of the year -3,331.0 -3,234.3
whereof due to active members -2,178.1 -2,145.5
whereof due to deferred members -58.0 -59.7
whereof due to pensioners -1,094.9 -1,029.1
Fair value of plan assets at the beginning of the year 3,091.0 2,825.3
Interest income on plan assets 9.3 27.4
Employees’ contributions 45.6 45.9
Employer’s contributions 107.1 102.9
Curtailments, settlements, plan amendments -1.7 -0.2
Benefits paid by fund -117.4 -136.2
Transfer payments in/out 0.6 1.0
Administration cost (excluding asset management cost) -1.0 -1.1
Return on plan assets (excluding interest income) 107.2 224.7
Translation differences -5.4 1.2
Fair value of plan assets at the end of the year 3,235.1 3,091.0
31.12.2020 31.12.2019
CHF m CHF m
2. Balance sheet
Fair value of plan assets 3,235.1 3,091.0
Present value of defined benefit obligation -3,323.9 -3,227.5
Present value of unfunded benefit obligation -7.1 -6.8
Net defined benefit asset/(liability) -95.9 -143.3

additional inFormationFINANCIAL STATEMENTS JULIUS BAER GROUP 2020
73
2020 2019
CHF m CHF m
3. income statement
Current service cost -82.6 -76.7
Interest expense on defined benefit obligation -9.5 -27.4
Past service cost, curtailments, settlements, plan amendments -2.3 -4.7
Interest income on plan assets 9.3 27.4
Administration cost (excluding asset management cost) -1.0 -1.1
Defined benefit cost recognised in the income statement -86.1 -82.5
whereof service cost -86.0 -82.5
whereof net interest on the net defined benefit (liability)/asset -0.2 -0.0
2020 2019
CHF m CHF m
4. movements in defined benefit liability
Net defined benefit asset/(liability) at the beginning of the year -143.3 -81.9
Translation differences 0.2 0.4
Defined benefit cost recognised in the income statement -86.1 -82.5
Benefits paid by employer 0.6 1.1
Employer’s contributions 107.1 102.9
Remeasurements of the net defined benefit liability/(asset) 25.7 -83.5
amount recognised in the balance sheet -95.9 -143.3
2020 2019 CHF m CHF mremeasurements of the net defined benefit liability/(asset) Actuarial gains/(losses) of defined benefit obligation -81.5 -308.2Return on plan assets (excluding interest income) 107.2 224.7
total recognised in other comprehensive income 25.7 -83.5
2020 2019
CHF m CHF m
5. Composition of plan assets
Cash 95.2 128.7
Debt instruments 895.0 906.1
Equity instruments 1,193.6 1,060.4
Real estate 551.0 494.3
Alternative investments 427.7 358.9
Other 72.6 142.5
total 3,235.1 3,091.0

additional inFormationFINANCIAL STATEMENTS JULIUS BAER GROUP 2020
74
2020 2019 in % in %6. aggregation of plan assets – quoted market prices in active markets Cash 2.9 4.2Debt instruments 26.5 28.1Equity instruments 36.9 34.3Real estate 7.7 7.3Other 6.0 5.9
total 80.0 79.8
2020 2019
CHF m CHF m
7. Sensitivities
Decrease of discount rate -0.25%
Effect on defined benefit obligation -104.8 -108.0
Effect on service cost -3.7 -4.7
Increase of discount rate +0.25%
Effect on defined benefit obligation 93.3 90.5
Effect on service cost 3.1 3.0
Decrease of salary increase -0.25%
Effect on defined benefit obligation 10.8 10.8
Effect on service cost 1.0 1.0
Increase of salary increase +0.25%
Effect on defined benefit obligation -11.0 -11.1
Effect on service cost -1.0 -1.0
Life expectancy
Increase in longevity by one additional year -75.5 -72.6

additional inFormationFINANCIAL STATEMENTS JULIUS BAER GROUP 2020
75
actuarial calculation of pension assets and obligationsThe latest actuarial calculation was carried out as at 31 December 2020. The actuarial assumptions are based on local economic conditions and are as follows for Switzerland, which accounts for about 97% (2019: 96%) of all benefit obligations and plan assets:
2020 2019
Discount rate 0.20% 0.25%
Average future salary increases 0.50% 0.50%
Future pension increases 0.00% 0.00%
Duration (years) 15 15
investment in Julius Baer group ltd. sharesThe pension plan assets are invested in accordance with local laws and do not include shares of Julius Baer Group Ltd.
expected employer contributionsThe expected employer contributions for the 2021 financial year related to defined benefit plans are estimated at CHF 89.0 million.
outstanding liabilities to pension plansThe Group had outstanding liabilities to various pension plans in the amount of CHF 10.0 million (2019: CHF 11.2 million).
defined contribution pension plansThe Group maintains a number of defined contri-bution pension plans, primarily outside Switzerland. In the case of defined contribution pension plans, the pension expenses are charged to the income statement in the corresponding financial year. The expenses for contributions to these pension plans amounted to CHF 36.8 million for the 2020 financial year (2019: CHF 37.7 million).

additional inFormationFINANCIAL STATEMENTS JULIUS BAER GROUP 2020
76
NOTE 24 SECURITIES LENDING AND BORROWING TRANSACTIONS
Securities lending and borrowing transactions / repurchase and reverse repurchase transactions
31.12.2020 31.12.2019
CHF m CHF m
receivables
Receivables from cash provided in securities borrowing transactions 6.2 94.2
of which recognised in due from banks 6.2 94.2
Receivables from cash provided in reverse repurchase transactions 1,258.0 -
of which recognised in due from banks 1,258.0 -
obligations
Obligations to return cash received in securities lending transactions 252.1 309.3
of which recognised in due to banks 252.1 309.3
Obligations to return cash received in repurchase transactions 82.5 20.2
of which recognised in due to banks 82.5 20.2
Securities collateral
Own securities lent as well as securities provided as collateral for
borrowed securities under securities borrowing and repurchase transactions 1,092.2 1,359.7
of which securities the right to pledge or sell has been granted without restriction 1,092.2 1,359.7
of which recognised in financial assets measured at FVTPL 952.8 1,219.9
of which recognised in financial assets measured at FVOCI 139.4 139.8
Securities borrowed as well as securities received as collateral for
loaned securities under securities lending and reverse repurchase transactions 4,267.6 1,815.8
of which repledged or resold securities 3,701.9 1,639.3
The Group enters into fully collateralised securities borrowing and securities lending transactions and repurchase and reverse repurchase agreements that may result in credit exposure in the event that the counterparty may be unable to fulfil the contractual obligations. Generally, the transactions are carried out under standard agreements employed by market participants (e.g. Global Master Securities Lending Agreements or Global Master Repurchase
Agreements). The related credit risk exposures are controlled by daily monitoring and adjusted collateralisation of the positions. The financial assets which continue to be recognised on the balance sheet are typically transferred in exchange for cash or other financial assets. The related liabilities can therefore be assumed to be approximately the same as the carrying amount of the transferred financial assets.

additional inFormationFINANCIAL STATEMENTS JULIUS BAER GROUP 2020
77
NOTE 25 DERIVATIVE FINANCIAL INSTRUMENTS
derivatives held for trading
Positive Negative
Contract/ replacement replacement
Notional amount value value
CHF m CHF m CHF m
Foreign exchange derivatives
Forward contracts 97,484.9 730.4 1,039.7
Futures 249.4 0.1 4.8
Cross-currency swaps 909.6 2.3 20.3
Options (OTC) 27,024.5 291.0 245.0
total foreign exchange derivatives 31.12.2020 125,668.4 1,023.7 1,309.8
Total foreign exchange derivatives 31.12.2019 121,599.0 776.9 827.6
interest rate derivatives
Swaps 22,735.0 131.5 167.9
Futures 210.8 1.2 0.1
Options (OTC) 260.8 10.9 9.4
total interest rate derivatives 31.12.2020 23,206.5 143.6 177.5
Total interest rate derivatives 31.12.2019 20,872.8 101.5 138.4
Precious metals derivatives
Forward contracts 2,751.7 43.6 77.6
Futures 39.8 0.2 1.7
Options (OTC) 5,315.2 126.1 99.0
Options (traded) 1,611.2 - 56.1
total precious metals derivatives 31.12.2020 9,717.9 170.0 234.4
Total precious metals derivatives 31.12.2019 10,385.0 126.4 166.4
equity/indices derivatives
Futures 863.6 28.4 5.7
Options (OTC) 11,419.2 619.9 284.8
Options (traded) 19,414.9 536.4 493.1
total equity/indices derivatives 31.12.2020 31,697.7 1,184.7 783.6
Total equity/indices derivatives 31.12.2019 30,487.5 591.0 944.5
other derivatives
Futures 64.5 0.3 0.8
total other derivatives 31.12.2020 64.5 0.3 0.8
Total other derivatives 31.12.2019 148.9 0.7 4.8

additional inFormationFINANCIAL STATEMENTS JULIUS BAER GROUP 2020
78
derivatives held for trading (continued)
Positive Negative
Contract/ replacement replacement
Notional amount value value
CHF m CHF m CHF m
Credit derivatives
Credit default swaps 110.1 0.2 1.3
Total return swaps 883.9 11.1 35.3
total credit derivatives 31.12.2020 994.0 11.3 36.6
Total credit derivatives 31.12.2019 1,123.9 2.7 23.7
total derivatives held for trading 31.12.2020 191,349.0 2,533.5 2,542.7
Total derivatives held for trading 31.12.2019 184,617.1 1,599.2 2,105.5
derivatives held for hedging
derivatives designated in net investment hedges Foreign exchange forward contracts 353.6 9.2 - derivatives designated as fair value hedges Interest rate swaps 1,184.3 19.7 11.9
total derivatives held for hedging 31.12.2020 1,537.9 28.9 11.9Total derivatives held for hedging 31.12.2019 2,175.9 31.5 15.3
total derivative financial instruments 31.12.2020 192,887.0 2,562.3 2,554.6Total derivative financial instruments 31.12.2019 186,793.0 1,630.7 2,120.8

additional inFormationFINANCIAL STATEMENTS JULIUS BAER GROUP 2020
79
NOTE 26A FINANCIAL INSTRUMENTS – FAIR VALUES
Financial assets
31.12.2020 31.12.2019
Carrying value Fair value Carrying value Fair value
CHF m CHF m CHF m CHF m
Financial assets at amortised cost
Cash 14,544.4 14,544.4 10,097.0 10,097.0
Due from banks 7,349.9 7,351.3 7,082.5 7,085.8
Loans 47,207.6 47,702.9 48,427.3 48,979.7
Accrued income/other assets 360.8 360.8 396.5 396.5
total 69,462.7 69,959.4 66,003.3 66,559.0
Financial assets at FVtPl
Financial assets measured at FVTPL 13,429.8 13,429.8 13,776.2 13,776.2
Derivative financial instruments 2,562.3 2,562.3 1,630.7 1,630.7
Financial assets designated at fair value 269.6 269.6 305.0 305.0
total 16,261.6 16,261.6 15,711.9 15,711.9
Financial assets at FVoCi
Financial assets measured at FVOCI 13,796.4 13,796.4 13,166.2 13,166.2
total 13,796.4 13,796.4 13,166.2 13,166.2
total financial assets 99,520.7 100,017.4 94,881.5 95,437.1
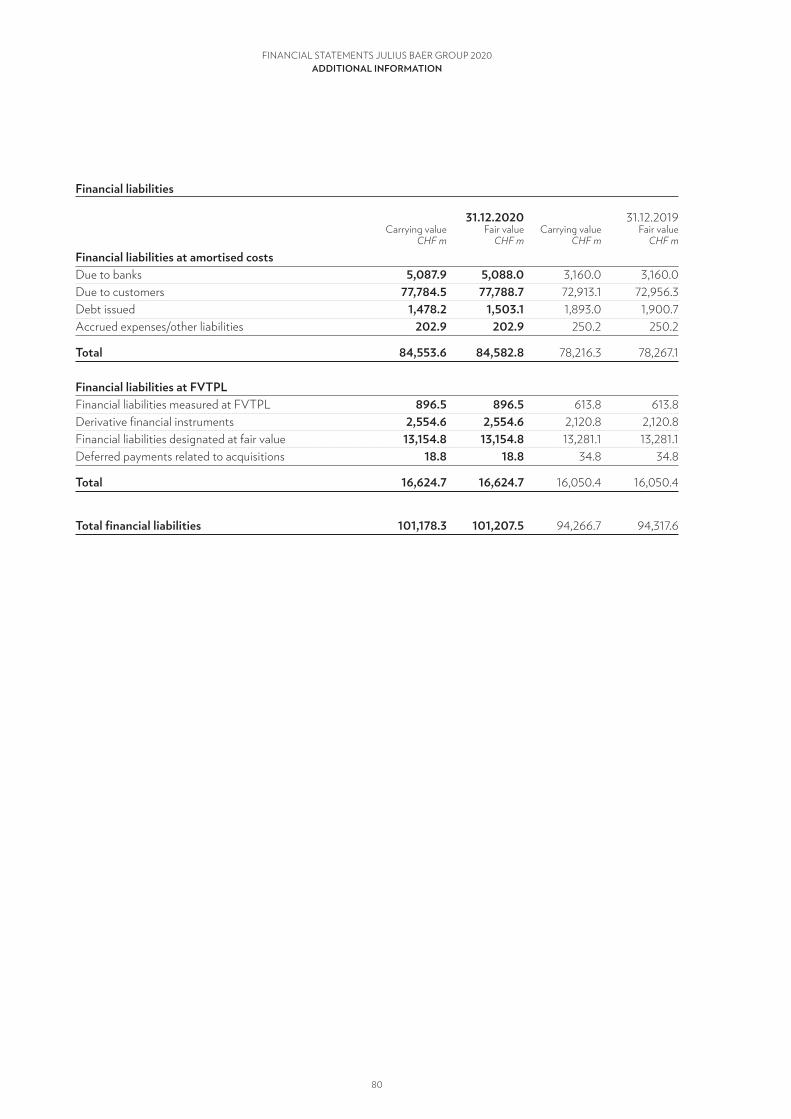
additional inFormationFINANCIAL STATEMENTS JULIUS BAER GROUP 2020
80
Financial liabilities
31.12.2020 31.12.2019
Carrying value Fair value Carrying value Fair value
CHF m CHF m CHF m CHF m
Financial liabilities at amortised costs
Due to banks 5,087.9 5,088.0 3,160.0 3,160.0
Due to customers 77,784.5 77,788.7 72,913.1 72,956.3
Debt issued 1,478.2 1,503.1 1,893.0 1,900.7
Accrued expenses/other liabilities 202.9 202.9 250.2 250.2
total 84,553.6 84,582.8 78,216.3 78,267.1
Financial liabilities at FVtPl
Financial liabilities measured at FVTPL 896.5 896.5 613.8 613.8
Derivative financial instruments 2,554.6 2,554.6 2,120.8 2,120.8
Financial liabilities designated at fair value 13,154.8 13,154.8 13,281.1 13,281.1
Deferred payments related to acquisitions 18.8 18.8 34.8 34.8
total 16,624.7 16,624.7 16,050.4 16,050.4
total financial liabilities 101,178.3 101,207.5 94,266.7 94,317.6

additional inFormationFINANCIAL STATEMENTS JULIUS BAER GROUP 2020
81
The following methods are used in measuring the fair value of financial instruments:
Short-term financial instrumentsFinancial instruments measured at amortised cost with a maturity or a refinanc ing profile of one year or less are generally classified as short-term. This includes the balance sheet items cash and, depending on the maturity, due from banks, loans, due to banks, due to customers and debt issued. For short-term financial instruments which do not have a market price published by a recognised stock exchange or notable market (referred to hereinafter as a market price), the carrying value generally approximates the fair value.
long-term financial instrumentsFinancial instruments measured at amortised cost with a maturity or refinancing profile of over one year are included in the following balance sheet
items: due from banks, loans, due to banks, due to customers and debt issued. The fair value of these long-term financial instruments which do not have a market price is derived by using the net present value method. For loans, generally, the Libor rate is used to calculate the net present value of the loans, as these assets are fully collateralised and therefore the specific counterparty risk has no material impact on the fair value measurement. For amounts due to banks and due to customers, a Libor-based internal rate is used. For debt issued, the quoted prices of the bonds determine the fair value.
Financial assets and liabilities measured at FVtPl, financial assets measured at FVoCi, derivative financial instruments and financial liabilities designated at fair valueRefer to Note 26B for details regarding the valuation of these instruments.
additional inFormationFINANCIAL STATEMENTS JULIUS BAER GROUP 2020
82
NOTE 26B FINANCIAL INSTRUMENTS – FAIR VALUE DETERMINATION
For financial instruments measured at fair value through profit or loss (FVTPL) as well as for financial assets measured at fair value through other comprehensive income (FVOCI), the fair values are determined as follows:
level 1For financial instruments for which prices are quoted in an active market, the fair value is determined directly from the quoted market price.
level 2For financial instruments for which quoted market prices are not directly available or are not derived from active markets, fair values are estimated using valuation techniques or models based wherever possible on assumptions supported by observable market prices or rates existing on the balance sheet date. This is the case for the majority of OTC derivatives, most unquoted financial instru ments, the vast majority of the Group’s issued structured notes and other items that are not traded in active markets. The main pricing models and valuation techniques applied to these financial instruments include forward pricing and swap models using present- value calculations, and option models such as the Black-Scholes model. The values derived from applying these models and techniques are significantly impacted by the choice of the valuation model used and the underlying assumptions made, such as the amounts and timing of future cash flows, discount rates, volatility, or credit risk.
level 3For certain financial instruments, neither quoted market prices nor valuation techniques or models based on observable market prices are available for determining the fair value. In these cases, fair value is estimated indirectly using valuation techniques or models based on reasonable assumptions reflecting market conditions.
Financial assets measured at FVTPL and financial assets measured at FVOCI: The Group holds a limited number of shares in companies in adjacent business areas, which are measured at fair value through profit or loss. Additionally, the Group holds shares in service providers such as SIX Swiss
Exchange, Euroclear and SWIFT, which are required for the operation of the Group and are reported as financial assets measured at FVOCI, with changes in the fair value recognised in other comprehensive income. The determination of the fair value of these financial instruments is based on the reported or published net asset value of the investees. The net asset values are adjusted by management for any necessary impacts from events which may have an influence on the valuation (adjusted net asset method). In 2020, dividends related to these invest ments in the amount of CHF 1.8 million (2019: CHF 17.5 million) have been recognised in the income statement.
Financial instruments designated at fair value: The Group issues to its wealth management clients a limited number of specific structured notes, which are intended to be fully invested in private equity investments. Since the notes may not be fully invested in private equity as from the beginning, the portion currently not yet invested is placed in money market instruments, short-term debt funds, or held in cash. Although the clients contractually bear all the related risks and rewards from the underlying investments, these financial instruments are not derecognised from the Group’s balance sheet due to the strict derecognition criteria required by IFRS. Therefore, the private equity investments as well as the money market instruments are recorded as financial assets designated at fair value. Any changes in the fair value or any other income from the private equity invest ments, as well as any income related to the money market instruments, are recorded in the income statement. However, as the clients are entitled to all rewards related to the investments, these amounts net out in the respective line item in the income statement. Hence, any change in the valuation inputs has no impact on the Group’s income statement or shareholders’ equity.
To measure the fair values of the private equity invest ments, the Group generally relies on the valuations as provided by the respective private equity funds managing the investments. These funds in turn use their own valuation techniques, such as market approaches or income approaches,

additional inFormationFINANCIAL STATEMENTS JULIUS BAER GROUP 2020
83
including their own input factors into the applied models. Therefore, the private equity investments are reported in level 3 of the fair value hierarchy, as the fair values are determined based on models with unobservable market inputs. The related issued notes are reported as financial liabilities designated at fair value and classified as level 3 instruments, due to the related private equity invest ments being part of the valuation of the notes.
Deferred payments related to acquisitions: Payments related to the deferred purchase price portion of acquisitions may be dependent on certain conditions to be achieved and also contingent on future growth rates of the businesses. As these fair value inputs are not observable, the outstanding balances are reported in level 3.

additional inFormationFINANCIAL STATEMENTS JULIUS BAER GROUP 2020
84
The fair value of financial instruments measured at fair value is determined as follows:
31.12.2020
Valuation Valuation
technique technique
market- non-market-
Quoted observable observable
market price inputs inputs total
Level 1 Level 2 Level 3
CHF m CHF m CHF m CHF m
Financial assets and liabilities measured at fair value
Trading – debt instruments at FVTPL 2,856.8 298.8 232.9 3,388.5
Trading – equity instruments at FVTPL 8,167.6 1,746.7 50.4 9,964.7
Other securities mandatorily measured at FVTPL 2.6 51.5 22.5 76.5
total financial assets measured at FVtPl 11,027.0 2,097.1 305.7 13,429.8
Foreign exchange derivatives 0.1 1,032.9 - 1,032.9
Interest rate derivatives 1.2 162.1 - 163.2
Precious metal derivatives 0.2 169.7 - 170.0
Equity/indices derivatives 28.4 1,156.3 - 1,184.7
Credit derivatives - 11.3 - 11.3
Other derivatives 0.3 - - 0.3
total derivative financial instruments 30.1 2,532.2 - 2,562.3
Financial assets designated at fair value 8.5 64.7 196.3 269.6
Debt instruments at FVOCI 10,394.6 3,128.1 - 13,522.6
Equity instruments at FVOCI - 1.4 272.3 273.7
total financial assets measured at FVoCi 10,394.6 3,129.4 272.3 13,796.4
total assets 21,460.2 7,823.5 774.4 30,058.0
Short positions – debt instruments at FVTPL 217.0 22.5 - 239.5
Short positions – equity instruments at FVTPL 626.3 30.7 - 657.0
total financial liabilities measured at FVtPl 843.3 53.2 - 896.5
Foreign exchange derivatives 4.8 1,305.0 - 1,309.8
Interest rate derivatives 0.1 189.2 - 189.3
Precious metal derivatives 1.7 232.7 - 234.4
Equity/indices derivatives 5.7 778.0 - 783.6
Credit derivatives - 36.6 - 36.6
Other derivatives 0.8 - - 0.8
total derivative financial instruments 13.1 2,541.5 - 2,554.6
Financial liabilities designated at fair value - 12,889.8 265.0 13,154.8
deferred payments related to acquisitions - - 18.8 18.8
total liabilities 856.4 15,484.6 283.8 16,624.7
For financial instruments measured at FVTPL, no material shifts between the fair value levels have occurred due to COVID-19.
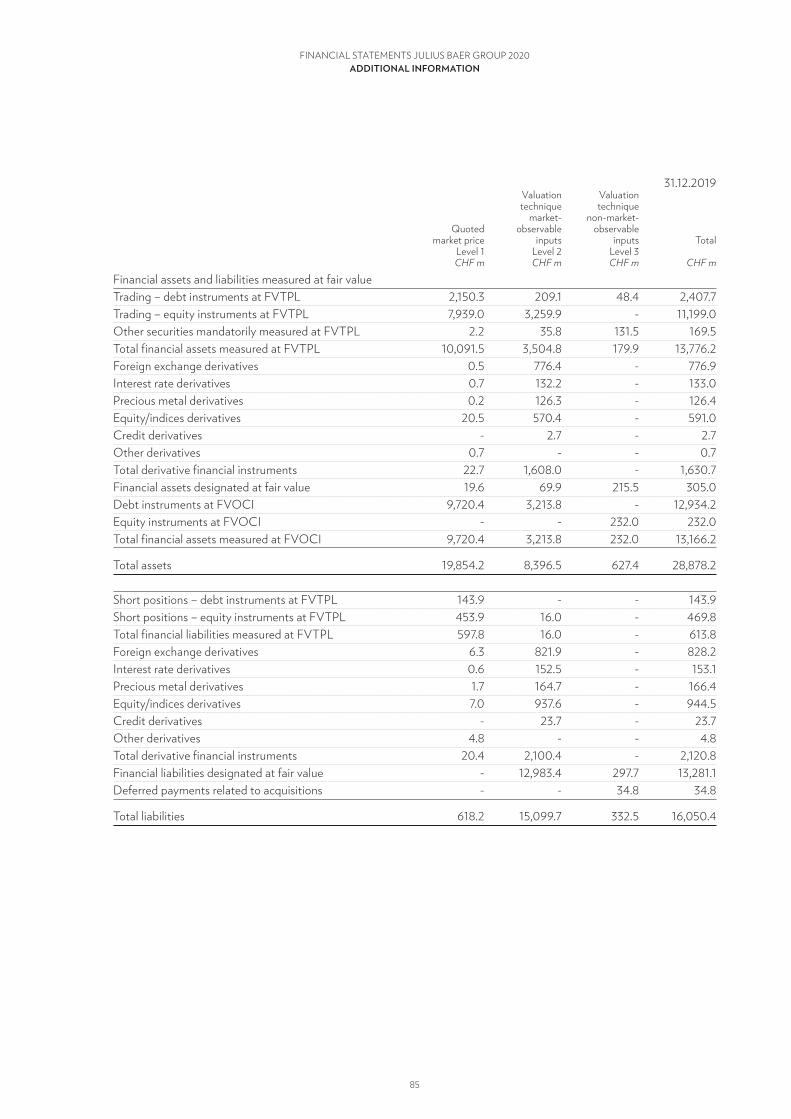
additional inFormationFINANCIAL STATEMENTS JULIUS BAER GROUP 2020
85
31.12.2019
Valuation Valuation
technique technique
market- non-market-
Quoted observable observable
market price inputs inputs Total Level 1 Level 2 Level 3
CHF m CHF m CHF m CHF m
Financial assets and liabilities measured at fair value
Trading – debt instruments at FVTPL 2,150.3 209.1 48.4 2,407.7
Trading – equity instruments at FVTPL 7,939.0 3,259.9 - 11,199.0
Other securities mandatorily measured at FVTPL 2.2 35.8 131.5 169.5
Total financial assets measured at FVTPL 10,091.5 3,504.8 179.9 13,776.2
Foreign exchange derivatives 0.5 776.4 - 776.9
Interest rate derivatives 0.7 132.2 - 133.0
Precious metal derivatives 0.2 126.3 - 126.4
Equity/indices derivatives 20.5 570.4 - 591.0
Credit derivatives - 2.7 - 2.7
Other derivatives 0.7 - - 0.7
Total derivative financial instruments 22.7 1,608.0 - 1,630.7
Financial assets designated at fair value 19.6 69.9 215.5 305.0
Debt instruments at FVOCI 9,720.4 3,213.8 - 12,934.2
Equity instruments at FVOCI - - 232.0 232.0
Total financial assets measured at FVOCI 9,720.4 3,213.8 232.0 13,166.2
Total assets 19,854.2 8,396.5 627.4 28,878.2
Short positions – debt instruments at FVTPL 143.9 - - 143.9
Short positions – equity instruments at FVTPL 453.9 16.0 - 469.8
Total financial liabilities measured at FVTPL 597.8 16.0 - 613.8
Foreign exchange derivatives 6.3 821.9 - 828.2
Interest rate derivatives 0.6 152.5 - 153.1
Precious metal derivatives 1.7 164.7 - 166.4
Equity/indices derivatives 7.0 937.6 - 944.5
Credit derivatives - 23.7 - 23.7
Other derivatives 4.8 - - 4.8
Total derivative financial instruments 20.4 2,100.4 - 2,120.8
Financial liabilities designated at fair value - 12,983.4 297.7 13,281.1
Deferred payments related to acquisitions - - 34.8 34.8
Total liabilities 618.2 15,099.7 332.5 16,050.4

additional inFormationFINANCIAL STATEMENTS JULIUS BAER GROUP 2020
86
The fair value of financial instruments disclosed at fair value is determined as follows:
31.12.2020
Valuation Valuation
technique technique
market- non-market-
Quoted observable observable
market price inputs inputs total
Level 1 Level 2 Level 3
CHF m CHF m CHF m CHF m
Financial assets and liabilities disclosed at fair value
Cash 14,544.4 - - 14,544.4
Due from banks - 7,351.3 - 7,351.3
Loans - 47,702.9 - 47,702.9
Accrued income/other assets - 360.8 - 360.8
total assets 14,544.4 55,415.0 - 69,959.4
Due to banks - 5,088.0 - 5,088.0
Due to customers - 77,788.7 - 77,788.7
Debt issued 1,503.1 - - 1,503.1
Accrued expenses/other liabilities - 202.9 - 202.9
total liabilities 1,503.1 83,079.6 - 84,582.8
31.12.2019
Valuation Valuation
technique technique
market- non-market-
Quoted observable observable
market price inputs inputs Total Level 1 Level 2 Level 3
CHF m CHF m CHF m CHF m
Financial assets and liabilities disclosed at fair value
Cash 10,097.0 - - 10,097.0
Due from banks - 7,085.8 - 7,085.8
Loans - 48,979.7 - 48,979.7
Accrued income/other assets - 396.5 - 396.5
Total assets 10,097.0 56,461.9 - 66,559.0
Due to banks - 3,160.0 - 3,160.0
Due to customers - 72,956.3 - 72,956.3
Debt issued 1,900.7 - - 1,900.7
Accrued expenses/other liabilities - 250.2 - 250.2
Total liabilities 1,900.7 76,366.5 - 78,267.1

additional inFormationFINANCIAL STATEMENTS JULIUS BAER GROUP 2020
87
NOTE 26C FINANCIAL INSTRUMENTS – TRANSFERS BETWEEN FAIR VALUE LEVEL 1 AND LEVEL 2
31.12.2020 31.12.2019
CHF m CHF m
transfers from level 1 to level 2
Financial assets measured at FVTPL 14.1 195.5
Financial assets measured at FVOCI 42.4 39.0
Financial assets designated at fair value 5.6 -
Financial liabilities 0.5 -
transfers from level 2 to level 1
Financial assets measured at FVTPL 45.7 10.6
Financial assets measured at FVOCI 103.5 122.7
The transfers between level 1 and 2, and vice versa, occurred due to changes in the direct availability of quoted market prices. Transfers between the levels are deemed to have occurred at the end of the reporting period.

additional inFormationFINANCIAL STATEMENTS JULIUS BAER GROUP 2020
88
NOTE 27A FINANCIAL INSTRUMENTS – EXPECTED CREDIT LOSSES
An entity is required to recognise expected credit losses at initial recognition of any financial instrument and to update the amount of expected credit losses recognised at each reporting date to reflect changes in the credit risk of the respective instruments. Refer to the comment on risk management/credit risk section and the summary of significant accounting policies for the relevant background information related to the recognition of expected credit losses.
expected credit loss (eCl) stage allocationCredit exposure is classified in one of the three ECL stages. At initial recognition, the Group classifies all financial assets in stage 1, as it does not acquire or originate credit-impaired debt instruments. If a significant risk increase has occurred to the financial instrument, the instrument moves from stage 1 to stage 2. The threshold applied varies depending on the original credit quality of the counterparty. For assets with lower default probabilities at origination due to good credit quality of the counterparty, the threshold for a significant increase in credit risk is set at a higher level than for assets with higher default probabilities at origination.
The Group generally originates loans and balances due from banks in its internal rating classes R1–R4, which reflect balances with low to medium credit risk. The same applies to the investment grade debt instruments held for investment purposes, which are also classified as R1–R4. Therefore, the Group determined that moves within these rating classes do not qualify for an increased credit risk, whereas a move from R4 to R5 generally triggers such a credit risk increase. Hence, under this approach, moves from R4 to a higher risk class (R5–R6) generally trigger a move from stage 1 ECL to stage 2 ECL. For example a counterparty moving from R1 to R2 would not trigger a significant increase in credit risk, whereas a counterparty moving from R1 to R5 would.
In addition, and to supplement this quantitative criterion, qualitative criteria based on other available internal data are applied to identify increased risk situations. These qualitative criteria are specific to the respective financial asset types (Lombard loans, mortgages, due from banks, debt instruments). For
example if payments are 30 days past due, the counterparty is moved to stage 2 and lifetime expected credit losses are applied.
The model is symmetric, meaning that if the transfer condition (significant increase) is no longer met, the counterparty is transferred back into the 12-month expected credit losses category (stage 1).
Financial instruments are credit-impaired and therefore recognised in stage 3 if they are classified in R7–R10 of the internal credit rating. These ratings are applied to positions with high credit risk; they are carried in the Group’s internal list of exposures which are in a loss position. Such positions show objective evidence of impairment and are referred to as defaulted. Generally, Lombard loans and mortgages are moved to these rating classes if the respective position is not fully covered anymore, i.e. the market value of the collateral is lower than the credit exposure, (critical) credit covenants are not complied with, or any payments are 90 days past due, to name some of the criteria.
eCl measurementThe Group has modelled its impairment loss estimation methodology to quantify the impact of the expected credit losses on its financial statements for stage 1 ECL and stage 2 ECL. The four models (for the Lombard loans business, mortgages business, due from banks business and treasury business, respectively) are generally based on the specific financial instrument’s probability of default (PD), its loss given default (LGD) and the exposure at default (EAD). These models have been tailored to the Group’s fully collateralised Lombard loans and mortgages, and the high-quality debt instruments in the treasury portfolio as outlined below.
For the credit-impaired financial assets in stage 3, the loss allowances are not measured based on a model, but determined individually according to the specific facts and circumstances.
Wherever the Group uses scenarios in the ECL calculation process, three different settings are applied to take future market situations into account: a baseline, an upside and a downside

additional inFormationFINANCIAL STATEMENTS JULIUS BAER GROUP 2020
89
scenario. Expected probabilities are allocated to the respective scenario, which are based on the Group Economic Research’s view regarding their probability of occurrence. The weightings used for the current year’s ECL calculation are 70% for the baseline scenario, 15% for the downside scenario and 15% for the upside scenario. However, the calculation of the ECL is mostly driven by the downside scenario, whereas the baseline and upside scenarios have only limited impact on the measurement of the ECL due to the Group’s credit policy (fully collateralised portfolios). Therefore, an increase in the weighting of the downside scenario would consequently increase the ECL in stage 1 and 2.
To apply the expected future economic conditions in the models, the Group determined the forecast world gross domestic product (GDP) as the main economic input factor for the expected credit losses on its financial asset portfolios, as the counterparties have fully collateralised Lombard loans or mortgages with the Group or the portfolios consist of investment grade debt instruments. Other forward-looking main macroeconomic factors proved to be of lesser relevance for the Group’s portfolios as a whole. A decrease in the expected GDP would have a negative impact on the ECL in stage 1 and 2.
In addition, for each portfolio, supplementary product-specific factors are used as outlined in the following paragraphs. These scenario factors are based on the assessment of the credit department
and the risk department for current and expected market developments in the respective product areas. These factors are updated and confirmed on a regular basis by the Group’s ECL committee, which comprises officers from the risk, credit risk and treasury departments.
due from banksFor due-from-banks positions, the input factors are determined as follows:
Probability of Default: For amounts due from banks, publicly available PDs per rating class are applied, using the same PDs for stage 1 and stage 2, as the outstanding balances have a term of maximum 12 months. PDs for an expected life shorter than one year are derived from the available one-year PDs by linear reduction. The ratings and the related PDs are shifted by one notch of the internal rating up and down, using publicly available data sources for the respective PDs. The three scenarios are weighted based on the generally applied probabilities as used in the Group’s economic research view.
Exposure at Default: For amounts due from banks, the EAD equals either the nominal value (money market issues, time accounts) or the carrying value (current and transactional accounts).
Loss Given Default: For amounts due from banks, an average LGD per rating class is applied. This factor is derived from publicly available data sources.
additional inFormationFINANCIAL STATEMENTS JULIUS BAER GROUP 2020
90
lombard loansFor Lombard loans, the input factors are determined as follows:
Probability of Default: For Lombard loans, PD factors are derived from the Group-internal ‘margin call process’ in Lombard lending. This process reflects internal procedures to avoid loan losses and is based on
– the probability that the credit position gets into a significant shortfall within one year;
– the probability that the credit position becomes unsecured within 10 days; and
– the liquidation process to cover the exposure,
taking into consideration their respective probabilities.
This margin call process is simulated for each rating class (R1–R6) and for stage 1 and stage 2 separately. The resulting PDs are then applied uniformly across all counterparties and related Lombard loans in the respective rating class.
Exposure at Default: For Lombard loans, the EAD equals the higher of a) the current exposure (based on data from the internal credit supervision system comprising the following credit exposures: cash exposure, derivative exposure, contingent liabilities and reservations) and b) the lower of the lending value or approved limit. The Group therefore assumes the highest possible risk (i.e. the highest outstanding) in determining the EAD, including any unused credit commitments. Consequently, even if no exposure is drawn under the limit, an ECL is calculated.
Loss Given Default: For Lombard loans the LGDs are formula-based, including the market value of the collateral on a client pledge group level. Scenario calculations on the market value of the collateral are performed, resulting in different LGDs per scenario. Three scenarios (base, up and down), including the probability of the respective scenario, are applied in the process.
mortgagesFor mortgages, the input factors are determined as follows:
Probability of Default: For mortgages, the PD factor is specifically determined for each counterparty and the related property based on the following input criteria:
– economic area of the counterparty domicile;– counterparty domicile and property location
(country) is the same;– sufficient assets/collateral within the Group to
pay interest/amortisation;– counterparty self-used versus rented-out real
estate; and– stage 1 or stage 2.
For each of these criteria, fixed parameters are determined (based on experience) which then add up to the mortgage counterparty-specific PD factors. These criteria have been selected as it is assumed that they influence directly the default behaviour of the counterparty behind the mortgages.
Exposure at Default: For mortgages, the carrying value (exposure) equals the EAD.
Loss Given Default: For mortgages, the LGD is based on scenario calculations on the market value of the real estate collateral and other pledged assets, which is then set in relation to the loan amount (Loan-to-Value ratio; LTV). Three scenarios (base, up and down), including the probability of the respective scenario, are applied in the process. However, instead of applying a fixed percentage for the negative scenario to all real estate uniformly, the negative scenario is based on the combination of a base factor and additional penalties depending on the following real estate-specific criteria:
– property location (country/region);– property size as a function of the property
market value; – property type (e.g. residential, office,
commercial); and– holiday home regions.

additional inFormationFINANCIAL STATEMENTS JULIUS BAER GROUP 2020
91
For each of these criteria, fixed parameters (based on experience) are determined which then add up to the mortgage-specific negative scenario. These criteria are selected as the resulting different characteristics of the real estate market generally respond differently to market fluctuations and hence the achievable collateral liquidation value. The total simulated market value is then compared with the exposure to determine the LGD.
treasury portfolioFor the treasury portfolio (debt instruments measured at FVOCI), the input factors are determined as follows:
Probability of Default: For financial instruments in the treasury portfolio (debt securities, including money market instruments), publicly available PDs
per rating class are applied, separately for stage 1 (one-year PD or shorter) and stage 2 (respective PD according to expected life). These ratings and the related PDs are shifted by two notches up and down, using publicly available data sources for the respective PDs. The three scenarios are then weighted based on the generally applied probabilities as used in the Group’s economic research view. PDs for an expected life shorter than one year are derived from the available one-year PDs by linear reduction.
Exposure at Default: For debt instruments, the EAD equals the amortised cost value plus discounted outstanding interest payments.
Loss given Default: For the debt instruments, an average LGD per rating class is applied. These factors are derived from publicly available data sources.

additional inFormationFINANCIAL STATEMENTS JULIUS BAER GROUP 2020
92
Credit quality analysisThe following tables provide an analysis of the Group’s exposure to credit risk by credit quality and expected credit loss stage; they are based on the Group’s internal credit systems.
exposure to credit risk by credit quality
31.12.2020 Lifetime ECL not Lifetime ECL Moody’s 12-month ECL credit-impaired credit-impaired total rating (Stage 1) (Stage 2) (Stage 3) CHF m CHF m CHF m CHF m due from banks, at amortised cost R1–R4: Low to medium risk 6,876.7 - - 6,876.7 R5–R6: Increased risk 473.2 - - 473.2 R7–R10: Impaired - - - - Total 7,349.9 - - 7,349.9 Loss allowance -0.1 - - -0.1
Carrying amount 7,349.9 - - 7,349.9 lombard loans, at amortised cost R1–R4: Low to medium risk 36,382.9 30.5 - 36,413.4 R5–R6: Increased risk 1,761.5 213.5 - 1,975.0 R7–R10: Impaired - - 97.0 97.0 Total 38,144.4 244.0 97.0 38,485.3 Loss allowance -1.6 -0.3 -75.2 -77.1
Carrying amount 38,142.8 243.7 21.8 38,408.3 mortgages, at amortised cost R1–R4: Low to medium risk 8,361.8 335.7 - 8,697.6 R5–R6: Increased risk 16.2 31.1 - 47.4 R7–R10: Impaired - - 59.2 59.2 Total 8,378.1 366.9 59.2 8,804.1 Loss allowance -1.8 -0.3 -2.7 -4.8
Carrying amount 8,376.3 366.6 56.5 8,799.3 debt instruments, at FVoCi R1–R4: Low to medium risk Aaa – Baa3 13,522.6 - - 13,522.6 R5–R6: Increased risk Ba1 – B3 - - - - R7–R10: Impaired Caa1 – C - - - -
Carrying amount 13,522.6 - - 13,522.6 Loss allowance -1.8 - - -1.8

additional inFormationFINANCIAL STATEMENTS JULIUS BAER GROUP 2020
93
31.12.2019 Lifetime ECL not Lifetime ECL Moody’s 12-month ECL credit-impaired credit-impaired Total rating (Stage 1) (Stage 2) (Stage 3) CHF m CHF m CHF m CHF m Due from banks, at amortised cost R1–R4: Low to medium risk 6,758.5 - - 6,758.5 R5–R6: Increased risk 324.1 - - 324.1 R7–R10: Impaired - - - - Total 7,082.6 - - 7,082.6 Loss allowance -0.1 - - -0.1
Carrying amount 7,082.5 - - 7,082.5 Lombard loans, at amortised cost R1–R4: Low to medium risk 37,568.0 83.1 - 37,651.2 R5–R6: Increased risk 1,444.5 312.3 - 1,756.8 R7–R10: Impaired - - 141.0 141.0 Total 39,012.5 395.5 141.0 39,548.9 Loss allowance -4.4 -0.6 -36.5 -41.4
Carrying amount 39,008.1 394.9 104.5 39,507.5 Mortgages, at amortised cost R1–R4: Low to medium risk 8,264.2 513.0 - 8,777.2 R5–R6: Increased risk 94.2 25.8 - 120.0 R7–R10: Impaired - - 28.1 28.1 Total 8,358.4 538.8 28.1 8,925.3 Loss allowance -2.1 -0.7 -2.7 -5.5
Carrying amount 8,356.3 538.1 25.3 8,919.8 Debt instruments, at FVOCI R1–R4: Low to medium risk Aaa – Baa3 12,917.3 - - 12,917.3 R5–R6: Increased risk Ba1 – B3 - 16.9 - 16.9 R7–R10: Impaired Caa1 – C - - - -
Carrying amount 12,917.3 16.9 - 12,934.2 Loss allowance -1.3 -0.1 - -1.3
The Group’s credit portfolio is prudently managed using a sophisticated credit risk framework. This approach ensured quality also under the COVID-19-related market stress and did not result in material additional credit losses.
For year-end reporting purposes, management has assessed the unprecedented situation and has exercised the appropriate judgement, including considering the guidance issued by the IASB and supervisory authorities.
Considering both quantitative and qualitative indicators, the Group did not experience significant increases in credit risk; hence, no material movements in the stage allocation had to be recognised in the credit portfolio.
The macroeconomic scenarios used in the ECL calculation models have been reviewed in the light of the changed economic environment and the related uncertainty. As a consequence, the growth assumption (based on the gross domestic products) used in the baseline scenario has been increased

additional inFormationFINANCIAL STATEMENTS JULIUS BAER GROUP 2020
94
again for year-end reporting; this after the Group has lowered it for the half-year reporting 2020 from a positive forecast in the year-end calculation 2019 to an assumed negative forecast for the following periods. The other input factors applied in the ECL calculation models did not have to be adjusted, as they proved to be reliable and robust. Likewise, and in line with external guidance, the models used for the ECL calculation have not been modified due to the pandemic.
Despite the COVID-19 pandemic, the ECL calculations did not reveal material additional losses to be recognised for year-end reporting 2020.
However, as the significant uncertainty regarding the development of the macroeconomic situation persists, the input factors used in the ECL models are monitored on an ongoing basis and may have to be adjusted further in the next reporting periods.
expected credit lossesThe following tables present the development of the Group’s expected credit losses by stage; they are based on the Group’s internal credit systems:
Lifetime ECL not Lifetime ECL 12-month ECL credit-impaired credit-impaired total (Stage 1) (Stage 2) (Stage 3) CHF m CHF m CHF m CHF mdue from banks, at amortised cost Balance at 1 January 2020 0.1 - - 0.1Net remeasurement of loss allowance -0.0 - - -0.0New/increase financial assets 0.0 - - 0.0Financial assets that have been derecognised -0.1 - - -0.1
Balance at 31 december 2020 0.1 - - 0.1 lombard loans, at amortised cost Balance at 1 January 2020 4.4 0.6 36.5 41.4Transfer to/(from) 12-month ECL 0.2 -0.2 - -Transfer to/(from) lifetime ECL not credit-impaired -0.0 0.0 - -Transfer to/(from) lifetime ECL credit-impaired -0.0 - 0.0 -Net remeasurement of loss allowance -22.0 0.1 47.2 25.3New/increase financial assets 22.5 0.2 7.4 1 30.0Financial assets that have been derecognised -3.4 -0.3 -8.5 -12.2Write-offs - - -0.9 -0.9Changes in models/risk parameters -0.1 -0.0 -0.0 -0.1Foreign exchange and other movements -0.0 - -6.4 -6.4
Balance at 31 december 2020 1.6 0.3 75.2 77.1
1 Including outstanding accumulated interest

additional inFormationFINANCIAL STATEMENTS JULIUS BAER GROUP 2020
95
Lifetime ECL not Lifetime ECL 12-month ECL credit-impaired credit-impaired total (Stage 1) (Stage 2) (Stage 3) CHF m CHF m CHF m CHF mmortgages, at amortised cost Balance at 1 January 2020 2.1 0.7 2.7 5.5Transfer to/(from) 12-month ECL 0.0 -0.0 - -Transfer to/(from) lifetime ECL not credit-impaired -0.1 0.1 - -Transfer to/(from) lifetime ECL credit-impaired -0.0 -0.1 0.2 -Net remeasurement of loss allowance -0.3 0.1 2.1 1.8New/increase financial assets 0.9 0.1 - 1.0Financial assets that have been derecognised -0.5 -0.5 -2.2 -3.2Changes in models/risk parameters -0.3 -0.0 -0.0 -0.4
Balance at 31 december 2020 1.8 0.3 2.7 4.8
debt instruments, at FVoCi Balance at 1 January 2020 1.3 0.1 - 1.3Net remeasurement of loss allowance -0.2 - - -0.2New financial assets purchased 1.3 - - 1.3Financial assets that have been derecognised -0.5 -0.1 - -0.6Changes in models/risk parameters -0.0 - - -0.0Foreign exchange and other movements -0.0 - - -0.0
Balance at 31 december 2020 1.8 - - 1.8
Lifetime ECL not Lifetime ECL 12-month ECL credit-impaired credit-impaired Total (Stage 1) (Stage 2) (Stage 3) CHF m CHF m CHF m CHF mDue from banks, at amortised cost Balance at 1 January 2019 0.3 - - 0.3Net remeasurement of loss allowance -0.0 - - -0.0New/increase financial assets 0.0 - - 0.0Financial assets that have been derecognised -0.2 - - -0.2Changes in models/risk parameters 0.0 - - 0.0
Balance at 31 December 2019 0.1 - - 0.1

additional inFormationFINANCIAL STATEMENTS JULIUS BAER GROUP 2020
96
2019
Lifetime ECL not Lifetime ECL 12-month ECL credit-impaired credit-impaired Total (Stage 1) (Stage 2) (Stage 3) CHF m CHF m CHF m CHF mLombard loans, at amortised cost Balance at 1 January 2019 5.9 0.2 13.2 19.3Transfer to/(from) 12-month ECL 0.0 -0.0 - -Transfer to/(from) lifetime ECL not credit-impaired -0.1 0.1 - -Transfer to/(from) lifetime ECL credit-impaired -0.0 -0.0 0.0 -Net remeasurement of loss allowance -0.4 0.4 17.3 17.3New/increase financial assets 1.5 0.1 7.5 1 9.2Financial assets that have been derecognised -2.6 -0.2 -0.2 -3.0Write-offs - - -0.5 -0.5Recoveries of amounts previously written off - - -0.2 -0.2Changes in models/risk parameters 0.1 0.0 0.0 0.1Foreign exchange and other movements - - -0.7 -0.7
Balance at 31 December 2019 4.4 0.6 36.5 41.4 Mortgages, at amortised cost Balance at 1 January 2019 3.3 1.6 7.1 12.1Transfer to/(from) lifetime ECL not credit-impaired -0.1 0.1 - -Transfer to/(from) lifetime ECL credit-impaired - -0.0 0.0 -Net remeasurement of loss allowance -0.2 -0.4 0.3 -0.4New/increase financial assets 0.2 - 0.1 0.3Financial assets that have been derecognised -1.4 -0.7 -4.1 -6.1Write-offs - - -0.6 -0.6Changes in models/risk parameters 0.2 0.1 0.0 0.3Foreign exchange and other movements - - -0.0 -0.0
Balance at 31 December 2019 2.1 0.7 2.7 5.5
Debt instruments, at FVOCI Balance at 1 January 2019 2.0 0.2 - 2.1Net remeasurement of loss allowance -0.2 -0.1 - -0.3New financial assets purchased 0.6 - - 0.6Financial assets that have been derecognised -1.0 - - -1.0Changes in models/risk parameters -0.0 -0.0 - -0.0Foreign exchange and other movements -0.0 -0.0 - -0.0
Balance at 31 December 2019 1.3 0.1 - 1.3
1 Including outstanding accumulated interest

additional inFormationFINANCIAL STATEMENTS JULIUS BAER GROUP 2020
97
NOTE 27B FINANCIAL INSTRUMENTS – CREDIT RISK ANALYSIS
maximum exposure to credit riskThe following table shows the Group’s theoretical maximum exposure to credit risk as of the balance sheet date, which represents the exposure in the event
of other parties failing to perform their obligations, without taking account of any collateral held or other credit enhancements. For financial assets, these exposures are typically the carrying amount.
maximum exposure to credit risk
31.12.2020 31.12.2019
Gross maximum Gross maximum
exposure exposure
CHF m CHF m
Due from banks 7,349.9 7,082.5
Loans 47,207.6 48,427.3
Financial assets measured at FVTPL 3,388.5 2,407.7
Derivative financial instruments 2,562.3 1,630.7
Financial assets designated at fair value 269.6 305.0
Financial assets measured at FVOCI 13,522.6 12,934.2
Accrued income/other assets 360.8 396.5
Total1 74,661.4 73,184.0
off-balance sheet
Irrevocable commitments2 446.2 492.8
total maximum exposure to credit risk 75,107.5 73,676.7
1 Cash, including balances held with central banks, is not considered a credit risk and hence excluded from all credit risk analysis.2 These amounts reflect the maximum payments the Group is committed to making.
Refer to the comment on risk management/credit risk section for discussions on concentration of credit risk.

additional inFormationFINANCIAL STATEMENTS JULIUS BAER GROUP 2020
98
NOTE 27C FINANCIAL INSTRUMENTS – COLLATERAL ANALYSIS
Collateral analysisFor Lombard loans, the principal types of collateral are readily marketable debt and equity securities as well as other eligible assets; for mortgages,
residential properties serve as main collateral. The following table provides information regarding the Loan-to-Value (market value) ratio for the respective credit products.
31.12.2020 31.12.2019
CHF m CHF mloan-to-Value ratio (ltV) lombard loans Less than 50% 22,913.8 21,482.651–70% 10,253.2 11,739.971–90% 4,813.5 5,413.191–100% 371.8 679.2More than 100% 34.4 88.2
total 38,386.5 39,403.0 mortgages Less than 50% 4,468.9 4,413.451–70% 3,584.8 3,808.771–90% 675.3 655.891–100% 11.9 16.6More than 100% 1.9 -
total 8,742.9 8,894.4 Credit-impaired lombard loans Less than 50% - -51–70% - -71–100% - 53.1More than 100% 21.8 51.4
total 21.8 104.5 Credit-impaired mortgages Less than 50% - -51–70% 26.4 17.871–100% 30.1 7.5More than 100% - -
total 56.5 25.3

additional inFormationFINANCIAL STATEMENTS JULIUS BAER GROUP 2020
99
NOTE 27D FINANCIAL INSTRUMENTS – OFFSETTING
As a wealth manager, the Group enters into securities transactions and derivative financial instruments. In order to control the credit exposure and reduce the credit risk related to these transactions, the Group applies credit mitigation strategies in the ordinary course of business. The Group enters into master netting agreements with counterparties to mitigate the credit risk of securities lending and borrowing transactions, repurchase and reverse repurchase transactions and over-the-counter deri vative transactions. Such arrangements include Global Master Securities Lending Agreements or Global Master Repurchase Agreements, as well as ISDA Master Agreements for derivatives.
The majority of exposures to securities transactions and over-the-counter derivative financial instruments are collateralised, with the collateral being prime financial instruments or cash.
However, under IFRS, to be able to offset transactions with the same counterparty on the balance sheet, the right of set-off must not only be legally enforce-able in the normal course of business, but must also be enforceable for all counterparties in the event of default, insolvency or bankruptcy. As the Group’s arrangements may not fulfil the strict offsetting criteria as required by IFRS, the Group does not offset the respective amounts related to these transactions on the balance sheet. Consequently,
the remaining credit risk on securities lending and borrowing as well as on repurchase and reverse repurchase transactions is fully mitigated.
Securities transactions: As the Group does not apply netting on its balance sheet, the cash collateral provided in securities borrowing and reverse repurchase transactions in the amount of CHF 1,264.2 million (2019: CHF 94.2 million) and the cash collateral received in securities lending and repurchase transactions in the amount of CHF 334.6 million (2019: CHF 329.5 million) as disclosed in Note 24 are not offset with the respective counterparty positions in the balance sheet.
Derivative financial instruments: The derivative financial instruments consist of over-the-counter as well as exchange-traded derivatives. The majority of over-the-counter derivatives in the total amount of CHF 1,995.8 million (positive replacement values) and CHF 1,992.3 million (negative replacement values) are subject to an enforceable netting agreement. Transactions with other banks are generally collateralised with other financial instruments (derivatives) which are recog nised on the Group’s balance sheet. With non-banking counterparties, the collateral recognised is generally cash balances. None of these balances related to the derivatives transactions are offset on the balance sheet.

additional inFormationFINANCIAL STATEMENTS JULIUS BAER GROUP 2020
100
-8000020.830
-7000020.806
-6000020.782
-5000020.758
-4000020.734
-3000020.710
-2000020.686
-1000020.662
-20.638
VAR 99% schwaz = 60% VAR 95% schwarz = 35% mit Umrandung 0,1 mm schwarz = 100% P+L schwarz = 100% Liniengerüst 0,1 mm schwarz = 100%
FlächendiagrammIm Excel Daten für VAR99% neu berechnen (in einer neuen Spalte): VAR99% minus VAR95% = neuer Wert für VAR99%VAR95% und neuen Wert von VAR99% ins Flächendiagramm kopieren
-8000020.830
-7000020.806
-6000020.782
-5000020.758
-4000020.734
-3000020.710
-2000020.686
-1000020.662
-20.638
-2000000.059
-1000000.035
-0.0111000000.013
2000000.037
3000000.061
4000000.085
45,000,000
37,500,000
30,000,000
22,500,000
15,000,000
7,500,000
0
–7,500,000
–15,000,000
–22,500,000
–30,000,000
Janu
ary
Febr
uary
Mar
ch
April
May
June July
Augu
st
Sept
embe
r
Oct
ober
Nov
embe
r
Dec
embe
r
Var 99% Var 95% P+l
NOTE 28 MARKET RISK MEASURES
Market risk refers to the potential losses through changes in the valuation of its assets and liabilities because of changes in market prices, volatilities, correlations and other valuation-relevant factors. Refer to the comment on risk management/market risk section for the relevant background information related to the Group’s market risk.
market risk measurement, market risk limitation, back testing and stress testingThe following methods are used to measure and limit market risk: value at risk (VaR) limits, sensitivity or concentration limits (delta, vega, basis-point and nominal limits as well as scenario analysis), and country limits for trading positions. VaR, the key risk figure, measures the magnitude of the loss on a portfolio that, under normal circumstances and for a specific probability (confidence interval), will not be exceeded during the observed holding period. The VaR of the Group amounted to CHF 0.94 million on 31 December 2020 and
CHF 0.78 million on 31 December 2019 (one-day holding period, 95% confidence interval). The maximum VaR recorded in 2020 amounted to CHF 5.07 million; the minimum was CHF 0.51 million (CHF 4.01 million and CHF 0.65 million in 2019). The adequacy of the VaR calculation, which is based on historical market move ments, is monitored through regular back testing. This involves the comparison of the VaR values calculated each day with the hypothetical gains or losses which would have occurred if the end-of-day positions had been left unchanged on the next trading day. The following chart shows the daily calculations of VaR in 2020 (at confidence intervals of 95% and 99% and for a one-day holding period) compared with these hypothetical gains or losses. A back-testing excession occurs when the change in overall position value resulting from the back-testing simulation is negative and its absolute value is greater than the VaR (at a confidence interval of 99%) for the relevant day’s closing positions.
Back testing of Julius Baer group trading book positions in 2020 (ChF)

additional inFormationFINANCIAL STATEMENTS JULIUS BAER GROUP 2020
101
0
5
10
15
20
25
30
35
40
45
Number of days
80
70
60
50
40
30
20
10
0
-15,0
00,0
00
-14,
000,
000
-13,0
00,0
00
-12,0
00,0
00
-11,0
00,0
00
-10,
000,
000
-9,0
00,0
00
-8,0
00,0
00
-7,0
00,0
00
-6,0
00,0
00
-5,0
00,0
00
-4,0
00,0
00
-3,0
00,0
00
-2,0
00,0
00
-1,0
00,0
00 0
1,000
,000
2,000
,000
3,000
,000
4,00
0,00
0
5,000
,000
6,00
0,00
0
7,000
,000
8,00
0,00
0
9,000
,000
10,0
00,0
00
11,0
00,0
00
12,0
00,0
00
13,0
00,0
00
14,0
00,0
00
15,0
00,0
00
16,0
00,0
00
17,0
00,0
00
>17,0
00,0
00
actual profits and losses1 hypothetical profits and losses
1 Pure trading revenues excluding commissions and fees
The following chart compares these hypothetical gains and losses with the actual profit and loss generated by the trading operations of the Group.
To ensure comparability, pure commission income has been removed from these income statement results.
distribution of daily revenues from trading activities of Julius Baer group for 2020 (ChF)
Whereas VaR forecasts identify potential losses during normal market conditions, daily stress tests are carried out in order to estimate the conse-quences of extreme market swings. Limits are set for both these risk metrics, and their utilisation is monitored on a daily basis. The daily stress tests are periodically complemented by additional tests based on historical scenarios. Additional stress tests, reflecting specific market and political situations, are also carried out.
At the beginning of 2020, the preceding 12-month period contained one back-testing exception that fell out of the observation period during the course of 2020. During the COVID-19 pandemic additional six back-testing exceptions were registered. The drivers for all six exceptions were exceptional market movements in terms of equity prices and volatilities, which were extreme compared to what the Group has experienced over the last 12 months. In November an additional exceed was recorded due to a technical
issue in data delivery from a front office trading system. As of 31 December 2020, the overall number of back-testing exceptions stands therefore at seven.
According to Circular 2008/20, FINMA may disregard individual exceptions if the institution is able to prove that these exceptions are not attributable to a lack of precision of the risk aggregation model. FINMA has used this discretion according to FINMA Guidance 06/2020 so that the back-testing exceptions caused by the COVID-19 pandemic will not lead to an increase of VaR capital multipliers. As such, the VaR capital multiplier applied by the Group remained constant based on one exception for the 12-month period since 31 December 2019.
All back-testing violations are examined individually and each is reported to the Chief Executive Officer, the Chief Risk Officer, the internal and external auditors and the Swiss Financial Market Super visory Authority (FINMA).

additional inFormationFINANCIAL STATEMENTS JULIUS BAER GROUP 2020
102
Var method and regulatory capitalFor its VaR calculation, the Group uses historical simu lation with complete revaluation of all trading positions in each instance. The historical simulation is based on empirically observed changes in market parameters (prices, yield curves, volatilities) over the last 300-trading-day period. As a result, correlation is taken into account implicitly, without having to draw on calculations and assumptions based on a correlation matrix. The risk management platform and the internal market risk models of the Group fulfil the relevant regulatory requirements and have been approved by FINMA for use in deter mining the capital requirement for market risks in the trading book.
In addition to the normal VaR calculations detailed above, a so-called stress-based VaR calculation is also carried out. Instead of the historical prices observed over the last 300 trading days, this stress- based VaR calculation uses those observed during a highly volatile period in the past (the stress period). The Group’s stress-based VaR amounted to CHF 3.82 million on 31 December 2020 and
CHF 1.10 million on 31 December 2019 (for a one- day holding period and a 95% confidence interval). The max imum stress-based VaR recorded in 2020 amounted to CHF 6.77 million; the minimum was CHF 0.78 million (CHF 4.44 million and CHF 0.85 million in 2019). Under FINMA regulations, the capital requirement for market risk is the sum of the normal VaR and the stress-based VaR.
For additional information regarding the calculation of the Group’s minimum regulatory capital require-ments under Basel III Pillar 3, refer to the separate Basel III Pillar 3 Report published in the Regulatory Disclosures section of the www.juliusbaer.com website (this will be available at the end of April 2021).
Given the limited materiality of the positions concerned, the specific risk of the Group’s fixed-income trading positions is calculated according to the standard method. The incremental risk charge and comprehensive risk-capital charge requirements are not applicable.
The following table is a summary of the VaR positions of the Group’s trading portfolios:
market risk – Var positions by risk type
2020
At 31 December Average Maximum Minimum
CHF m CHF m CHF m CHF m
Equities -0.1 -0.8 -3.5 0.0
Interest rates -1.4 -1.0 -1.6 -0.7
Foreign exchange/precious metals -0.2 -0.4 -1.5 0.0
Effects of correlation 0.7
total -0.9 -1.7 -5.1 -0.5
2019
At 31 December Average Maximum Minimum
CHF m CHF m CHF m CHF m
Equities -0.4 -0.5 -2.0 0.0
Interest rates -0.9 -0.8 -1.2 -0.5
Foreign exchange/precious metals -0.1 -0.5 -1.3 -0.0
Effects of correlation 0.7
Total -0.8 -1.3 -4.0 -0.7

additional inFormationFINANCIAL STATEMENTS JULIUS BAER GROUP 2020
103
NOTE 29 INTEREST RATE RISK MEASURES
One measure of interest rate risk can be provided by showing the impact of a positive change of 1% (+100 basis points) in the entire yield curve in the respective currency. The table below, broken down according to maturity bands and currencies, shows the results of such a scenario as at 31 December 2020. Negative values under this scenario reflect a potential drop in fair value within the respective maturity band; positive values reflect a potential
increase in fair value. This risk measure is also used to carry out scenario analyses on a regular basis. As there are no material option structures in the banking book, a negative change of 1% in the yield curves would result in scenario values of similar magnitude but with the opposite sign, though such outcomes are mitigated by the fact that the yield curves for the markets in which the Group carries out most of its activities are currently close to zero.
interest-rate-sensitive positions
Within 1 to 3 3 to 12 1 to 5 Over
1 month months months years 5 years total
CHF m
interest sensitivity by time bands and 100 bp parallel increase
ChF
2020 8.9 0.6 32.3 32.7 -36.1 38.4
2019 7.3 1.7 28.2 35.7 -11.9 61.0
uSd
2020 13.0 -5.3 4.1 53.1 8.6 73.5
2019 5.2 -4.9 -2.5 55.3 0.1 53.1
eur
2020 8.3 -8.0 -9.2 20.2 -28.1 -16.8
2019 7.1 -7.7 -14.8 58.8 -13.2 30.1
other
2020 3.0 -4.3 1.0 30.4 -0.4 29.8
2019 1.1 -5.0 0.2 30.6 -0.0 26.9
In addition, the effect on interest earnings resulting from a parallel shift of 1% in the yield curve is measured. In this gap analysis, the interest-bearing assets and liabilities are offset within maturity bands. The impact of the yield curve shift on the residual expos ure over the time horizon from the next
repricing date to a point 12 months ahead is measured. Based on the assumptions described above, and further assuming that the Group took no mitigating action, the mod el led effect on interest earnings would have been CHF -127.5 million at the end of 2020 (2019: CHF -100.4 million).

additional inFormationFINANCIAL STATEMENTS JULIUS BAER GROUP 2020
104
Fair value hedges of interest rate riskThe Group hedges part of its interest rate exposure from fixed rate CHF denominated mortgages to changes in fair value by using interest rate swaps on a portfolio basis. Such portfolio hedges are based on mortgages with similar maturities, and the hedge relationships are rebalanced on a monthly basis. The amount of fair value hedge adjustments remaining in the balance sheet for any hedged items that have ceased to be adjusted for hedging gains and losses are amortised over the remaining terms to maturity of the hedged items using the straight-line method.
In addition, different interest rate swaps are used to hedge the interest rate risks of some of the bonds issued by the Group which are denominated in USD, CHF or SGD, as well as a very limited number of mortgages. The fixed legs of these swaps are in correspondence to the respective (fixed rate) bonds and mortgages. As such, the interest rate risk of each financial instrument is substantially reduced to the interest rate risk of the floating rate leg of the respective swap.
The counterparties of the swaps transactions used for portfolio hedges as well as those used for single hedges are investment-grade counterparties. However, the Group does not incur any credit risk with these derivative instruments as all credit risk is eliminated due to clearing or collateral agreements in place. Prior to committing to a hedge relationship, an assessment takes place in order to justify that the fair value of the hedged item and the hedging instrument do offset their interest rate risks and that the economic hedge relationships meet the hedge accounting criteria. Besides this qualitative assessment, regular quantitative assessments are carried out based on prospective (i.e. forward looking, using regression analysis) as well as retrospective effectiveness tests. These tests allow assessing whether the hedging instrument is expected to be or has been highly effective in offsetting changes in the fair value of the hedged item. Hedge ineffectiveness may arise from minor differences in the core data of the bond and swap fixed leg, or the interest rate sensitivities of the floating leg of the swap.

additional inFormationFINANCIAL STATEMENTS JULIUS BAER GROUP 2020
105
31.12.2020
Hedges of Hedges of Hedges of bond issues mortgages mortgages
(single hedges) (single hedges) (portfolio hedges)
CHF m CHF m CHF m
hedged items
Amortised cost value 635.1 20.4 526.0
Accumulated amount of fair value hedge adjustment on the hedged item
included in the carrying amount of the hedged item 18.9 0.8 35.6
Carrying amount hedged items 654.0 21.2 561.6
hedging instruments – interest rate swaps
Notional amount (overall average fixed interest rate: 1.31%) 636.3
– whereof remaining maturity 1–5 years (average fixed interest rate: 1.48%) 548.0
– whereof remaining maturity > 5 years (average fixed interest rate: 0.3%) 88.4
Notional amount (overall average fixed interest rate: -0.31%) 18.0
– whereof remaining maturity > 5 years (average fixed interest rate: -0.31%) 18.0
Notional amount (overall average fixed interest rate: 0.57%) 530.0
– whereof remaining maturity < 1 year (average fixed interest rate: -0.09%) 120.0
– whereof remaining maturity 1–5 years (average fixed interest rate: 0.77%) 410.0
Positive replacement value 19.7 - - 1
– related notional amount 548.0 - -
Negative replacement value -0.3 -0.1 -11.5 1
– related notional amount 88.4 18.0 530.0
hedge effectiveness testing and related ineffectiveness
Change in fair value of hedged item
used for calculation of hedge ineffectiveness -18.9 0.8 -0.7
Change in fair value of interest rate swaps
used for calculation of hedge ineffectiveness 19.4 -0.1 0.6 1
amount of hedge ineffectiveness recognised in the income statement 0.5 0.7 -0.1
termination of hedge relationship
Accumulated amount of fair value hedge adjustments remaining in the balance sheet
for any hedged items that have ceased to be adjusted for hedging gains and losses - - 36.3
1 The change in fair value of the interest rate swaps used for the calculation of the hedge effectiveness for the portfolio hedges reflects the changes in the fair value of the latest hedge period only, whereas the sum of the positive and negative replacement values reflects the differences in fair values of the interest rate swaps between inception and reporting date.
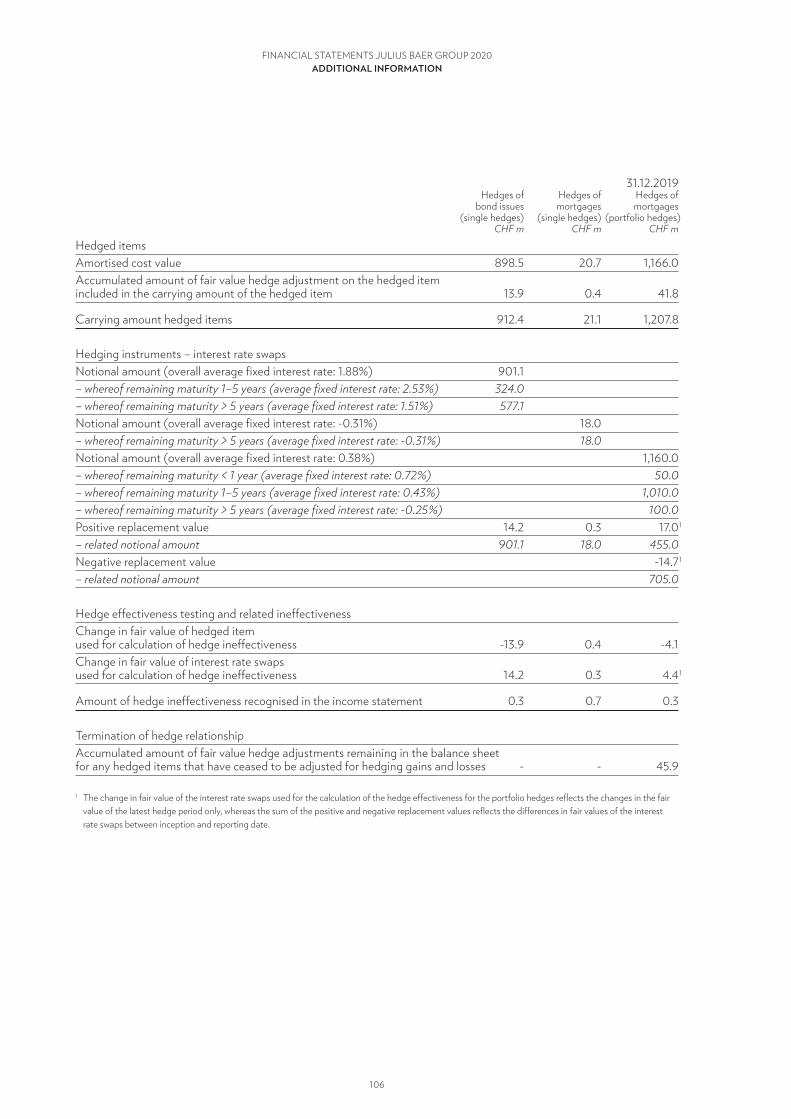
additional inFormationFINANCIAL STATEMENTS JULIUS BAER GROUP 2020
106
31.12.2019
Hedges of Hedges of Hedges of bond issues mortgages mortgages
(single hedges) (single hedges) (portfolio hedges)
CHF m CHF m CHF m
Hedged items
Amortised cost value 898.5 20.7 1,166.0
Accumulated amount of fair value hedge adjustment on the hedged item
included in the carrying amount of the hedged item 13.9 0.4 41.8
Carrying amount hedged items 912.4 21.1 1,207.8
Hedging instruments – interest rate swaps
Notional amount (overall average fixed interest rate: 1.88%) 901.1
– whereof remaining maturity 1–5 years (average fixed interest rate: 2.53%) 324.0
– whereof remaining maturity > 5 years (average fixed interest rate: 1.51%) 577.1
Notional amount (overall average fixed interest rate: -0.31%) 18.0
– whereof remaining maturity > 5 years (average fixed interest rate: -0.31%) 18.0
Notional amount (overall average fixed interest rate: 0.38%) 1,160.0
– whereof remaining maturity < 1 year (average fixed interest rate: 0.72%) 50.0
– whereof remaining maturity 1–5 years (average fixed interest rate: 0.43%) 1,010.0
– whereof remaining maturity > 5 years (average fixed interest rate: -0.25%) 100.0
Positive replacement value 14.2 0.3 17.0 1
– related notional amount 901.1 18.0 455.0
Negative replacement value -14.7 1
– related notional amount 705.0
Hedge effectiveness testing and related ineffectiveness
Change in fair value of hedged item
used for calculation of hedge ineffectiveness -13.9 0.4 -4.1
Change in fair value of interest rate swaps
used for calculation of hedge ineffectiveness 14.2 0.3 4.4 1
Amount of hedge ineffectiveness recognised in the income statement 0.3 0.7 0.3
Termination of hedge relationship
Accumulated amount of fair value hedge adjustments remaining in the balance sheet
for any hedged items that have ceased to be adjusted for hedging gains and losses - - 45.9
1 The change in fair value of the interest rate swaps used for the calculation of the hedge effectiveness for the portfolio hedges reflects the changes in the fair value of the latest hedge period only, whereas the sum of the positive and negative replacement values reflects the differences in fair values of the interest rate swaps between inception and reporting date.

additional inFormationFINANCIAL STATEMENTS JULIUS BAER GROUP 2020
107
net investment hedgesAs of 2019, the Group started to apply net investment hedge accounting on part of the foreign currency risks related to its foreign operations. A net investment hedge is a specific type of a foreign currency cash flow hedge used to eliminate the foreign currency exposures arising from translating the Group’s net investment in a foreign operation (with a different functional currency than the CHF) into the Group currency CHF. Upon consolidation of the net investment in a foreign operation into the Group financial statements the foreign currency gain or loss is recognised in other comprehensive income (OCI) under the respective accounting treatment.
The Group uses rolling FX forwards as hedging instrument in line with IAS 39 applying the forward rate method, which means the full marked to market on the hedge is booked to OCI provided the hedge is effective.
The amount of net investment hedges designated to hedge the foreign currency investment should for each hedging period be less or equal the hedged item at the end date of the hedged period. This critical term matching is proven on a prospective and retrospective period for each month-end. Hedges are allocated to specific foreign currency net investments at inception of the hedge. Ineffectiveness is recognised only to the extent that the periodic change in the fair value of the derivative instrument exceeds the periodic change in the FX translation (‘overhedge’). Given that only a fraction of foreign currency investments are hedged, hedge effectiveness should be obtained at all times.
The following table relates to FX forwards used for net investment hedges in foreign operations and the related amounts recognised in OCI:
31.12.2020 31.12.2019
CHF m CHF m
hedging instruments – FX forwards
Positive replacement values of FX forwards 9.2 -
Negative replacement values of FX forwards - 0.6
Nominal value of FX forwards 353.6 96.8
amounts recognised in oCi
OCI on foreign currency operations -112.0 -23.0
OCI on net investment hedges 9.2 -0.6

additional inFormationFINANCIAL STATEMENTS JULIUS BAER GROUP 2020
108
liquidity analysisThe following table shows an analysis of the Group’s financial liabilities by remaining contractual maturities as of the balance sheet date. Contrary to the balance sheet presentation, these amounts include the total of contractual undiscounted interest payments related to these financial liabilities. Liabilities
without a stated maturity, i.e. that can be called for repayment at any time, are classified as on demand. All derivative financial instruments held for trading are classified as on demand, as there are no single derivatives or classes of derivatives for which the contractual maturities are relevant for the timing of the total cash flows of the Group.
remaining contractual maturities of financial liabilities
Due within Due within
Due within 3 to 12 12 months Due after
On demand 3 months months to 5 years 5 years total
CHF m CHF m CHF m CHF m CHF m CHF m
Financial liabilities recognised on balance sheet
Due to banks 4,995.8 83.6 8.7 0.1 - 5,088.2
Due to customers 75,219.3 2,187.1 383.0 3.3 - 77,792.7
Financial liabilities measured at FVTPL 896.5 - - - - 896.5
Derivative financial instruments 2,542.7 0.1 1 0.2 1 11.1 1 0.4 1 2,554.6
Financial liabilities designated at fair value 3,089.6 4,698.4 3,024.5 2,156.5 338.3 13,307.4
Debt issued - 133.1 2.4 1,039.6 303.1 1,478.2
Accrued expenses/other liabilities - 202.9 - - - 202.9
Deferred payments related to acquisitions - 2.7 16.1 - - 18.8
total 31.12.2020 86,744.0 7,307.9 3,434.9 3,210.8 641.8 101,339.4
Due to banks 3,125.3 34.2 0.2 0.3 - 3,160.0
Due to customers 59,161.2 13,058.3 751.7 - - 72,971.2
Financial liabilities measured at FVTPL 613.8 - - - - 613.8
Derivative financial instruments 2,087.1 0.2 1 0.5 1 29.6 1 3.2 1 2,120.8
Financial liabilities designated at fair value 2,528.4 5,675.2 2,736.8 1,990.8 500.2 13,431.4
Debt issued - 152.6 739.1 839.1 355.9 2,086.8
Accrued expenses/other liabilities - 250.2 - - - 250.2
Deferred payments related to acquisitions - 5.7 1.7 27.5 - 34.8
Total 31.12.2019 67,515.8 19,176.5 4,230.0 2,887.3 859.3 94,668.9
Financial liabilities not recognised on balance sheet
Irrevocable commitments2 350.2 0.3 29.7 59.1 6.8 446.2
total 31.12.2020 350.2 0.3 29.7 59.1 6.8 446.2
Total 31.12.2019 464.3 10.3 11.8 5.9 0.5 492.8
1 These derivatives are not held for trading but for hedging purposes.2 These amounts reflect the maximum payments the Group is committed to making.

additional inFormationFINANCIAL STATEMENTS JULIUS BAER GROUP 2020
109
NOTE 30A COMPANIES CONSOLIDATED
listed company which is consolidated
Place of Head Office Currency Share capital Capitalisation
listing as at 31.12.2020
m m
SIX
Swiss
Julius Baer Group Ltd. Exchange Zurich CHF 4.5 11,414
Swiss securities number: 10 248 496, Ticker symbol: BAER
unlisted operational companies which are consolidated as at 31 december 2020
Head Office Currency Share capital Equity interest
m %
Bank Julius Baer & Co. Ltd. Zurich CHF 575.000 100
Branches in Basle, Berne, Crans-Montana, Geneva, Guernsey,
Hong Kong, Lausanne, Lucerne, Lugano, Singapore, Sion,
St. Gallen, St. Moritz, Verbier, Zurich
Representative Offices in Abu Dhabi, Bogotá, Istanbul, Johannesburg,
Mexico City, Santiago de Chile, Shanghai, Tel Aviv
including
Bank Julius Baer Nominees (Singapore) Pte. Ltd. Singapore SGD 0.000 100
Bank Julius Bär Deutschland AG Frankfurt EUR 15.000 100
Branches in Berlin, Duesseldorf, Hamburg, Hanover, Kiel,
Mannheim, Munich, Stuttgart, Würzburg
including
Julius Bär Capital GmbH Frankfurt EUR 0.026 100
Bank Julius Baer Europe S.A. Luxembourg EUR 93.165 100
Branch in Dublin
Bank Julius Baer (Monaco) S.A.M. Monaco EUR 160.000 100

additional inFormationFINANCIAL STATEMENTS JULIUS BAER GROUP 2020
110
Head Office Currency Share capital Equity interest
m %
Fransad Gestion SA Geneva CHF 1.000 100
JB Funding (Hong Kong) Limited Hong Kong USD 0.000 100
JB Participations Ltd. Zurich CHF 15.000 100
Julius Baer Brasil Consultoria de Valores Mobiliários Ltda. São Paulo BRL 5.242 100
Julius Baer Advisory S.A.E. Cairo EGP 12.847 100
Julius Baer Advisory (Uruguay) S.A. Montevideo UYU 0.087 100
Julius Baer Agencia de Valores, S.A.U. Madrid EUR 0.902 100
Branch in Barcelona
Julius Baer (Chile) SpA Santiago de Chile CLP 498.928 100
Julius Baer CIS Ltd. Moscow RUB 18.000 100
Julius Baer Family Office & Trust Ltd. Zurich CHF 0.100 100
Julius Baer Family Office Brasil Gestão de Patrimônio Ltda. São Paulo BRL 762.016 100
Julius Baer Fiduciaria S.p.A. Milan EUR 0.100 100
Julius Baer Financial Services (Channel Islands) Limited Jersey GBP 0.025 100
Julius Baer Financial Services (Israel) Ltd. Tel Aviv ILS 11.000 100
Julius Baer Gestión, SGIIC, S.A.U. Madrid EUR 2.100 100
Julius Baer International Advisory (Uruguay) S.A. Montevideo USD 3.600 100
Julius Baer International Limited London GBP 135.200 100
Branches in Belfast, Edinburgh, Leeds, Manchester

additional inFormationFINANCIAL STATEMENTS JULIUS BAER GROUP 2020
111
Head Office Currency Share capital Equity interest
m %
Julius Baer Investment Advisory GesmbH Vienna EUR 0.050 100
Julius Baer Investment Ltd. Zurich CHF 0.100 100
including
Julius Baer Trust Company (Singapore) Limited Singapore SGD 2.812 100
Julius Baer Trust Company (Channel Islands) Limited Guernsey CHF 0.065 100
Julius Baer (Singapore) Pte. Ltd. Singapore USD 10.000 100
Julius Baer (Singapore) GBP Pte. Ltd. Singapore GBP 6.300 100
Julius Baer (South Africa) Proprietary Limited Johannesburg ZAR 22.357 100
Julius Baer Wealth Advisors (India) Private Limited Mumbai INR 10,081.410 100
Branches in Bangalore, Chennai, Hyderabad, Kolkata, New Delhi
including
Julius Baer Capital (India) Private Limited Mumbai INR 2,334.350 100
Branch in New Delhi
Julius Baer Nomura Wealth Management Ltd. Zurich CHF 5.700 60
Branch in Tokyo
Julius Baer Wealth Management (Monaco) S.A.M. Monaco EUR 0.465 100
Julius Baer (Bahrain) B.S.C. (c) Manama BHD 1.000 100
Julius Baer (Lebanon) S.A.L. Beirut LBP 2,000.000 100
Julius Baer (Middle East) Ltd. Dubai USD 22.000 100
Kairos Investment Management S.p.A. Milan EUR 2.355 100 1
including
KAIROS ASSET MANAGEMENT SA Lugano CHF 0.600 100
Kairos Investment Management B.V. Amsterdam EUR 1.000 100
– including Kairos Investment Management Limited London GBP 5.884 100
Kairos Partners SGR S.p.A. Milan EUR 5.084 100
– Representative Offices in Rome, Turin
1 From an accounting perspective, Julius Baer Group Ltd. owns 100% of Kairos; see Note 31.

additional inFormationFINANCIAL STATEMENTS JULIUS BAER GROUP 2020
112
Head Office Currency Share capital Equity interest
m %
NSC Asesores, S.C., Asesor en Inversiones Independiente Mexico City MXN 1.903 70
NSC Objetivos, S.A.P.I. de C.V. Mexico City MXN 0.001 70
PINVESTAR AG Zug CHF 0.100 100
Three Rock Capital Management Limited Dublin EUR 5.173 100
Wergen & Partner Vermögensverwaltungs Ltd Zurich CHF 0.100 100
LOTECO Foundation Zurich CHF 0.100 100
major changes in the companies consolidated (2020):– GPS and Reliance merged into Julius Baer
Family Office Brasil Gestão de Patrimônio Ltda., São Paulo
– Three Rock Capital Management Limited, Dublin, new
– Julius Baer Bank (Bahamas) Limited, Bahamas, sold
– JBAO Brazil – Julius Baer Brasil Consultoria de Valores Mobiliários Ltda., São Paulo, new

additional inFormationFINANCIAL STATEMENTS JULIUS BAER GROUP 2020
113
NOTE 30B INVESTMENTS IN ASSOCIATES Head Office Currency Share capital Equity interest
m %
associates
SCB-Julius Baer Securities Co., Ltd. Bangkok THB 1.800 40
31.12.2020 31.12.2019
CHF m CHF m
Balance at the beginning of the year 23.3 48.1
Additions - 2.4
Disposals - -29.1
Income - 1.3
Dividend paid - -0.7
Translation differences -2.0 1.3
Balance at the end of the year 21.2 23.3
SCB-Julius Baer Securities Co., ltd. (2018)The Group holds 40% in the entity and therefore treats it as an associate; its initial equity share of CHF 19.7 million has been contributed in 2018 in cash, an additional CHF 2.4 million in 2019. The Group has the opportunity to increase its share to
49% step-by-step over time, with the purchase price being the equity value of the entity at the time of exercise.
The entity has taken up its full operations after the necessary approvals and licences to operate in Thailand have been received end of April 2019.
NOTE 30C UNCONSOLIDATED STRUCTURED ENTITIES
The Group is involved in the set-up and operation of a limited number of structured entities such as segregated portfolio companies, private equity feeder funds, umbrella funds and similar vehicles in the legal form of limited partnerships (L.P.), which are invested in segregated portfolios or feeder funds. All the L.P. serve as investment vehicles for the Group’s clients. The Group generally acts as invest-ment manager and custodian bank and also holds the management shares of the L.P. These shares are
equipped with voting rights, but do not provide any participating rights in the underlying investments. The Group receives a market-based fixed fee for its services and has no interests in the underlying segregated portfolios or feeder funds. Therefore, due to the missing exposure, or rights, to variable returns from its involvement with the segregated portfolios or feeder funds, the Group does not have control over the underlying investments, but only consolidates the limited partnerships.

additional inFormationFINANCIAL STATEMENTS JULIUS BAER GROUP 2020
114
NOTE 31 ACQUISITIONS AND DISPOSALS
The following transactions were executed:
nSC asesores (2019/2015)On 6 November 2015, the Group acquired 40% of the Mexico City-based NSC Asesores, S.C., Asesor en Inversiones Independiente, which is specialised in discretionary portfolio management and advisory services for high net worth individuals. The Group paid half of the consideration in the amount of CHF 14.5 million in cash for this interest, which was fully funded by existing excess capital of the Group. The Group agreed on two additional payments of CHF 7.1 million each on 6 November 2016 and 2017, respectively, for the outstanding purchase price, which were both performed as agreed. The Group also received two options to acquire additional interests of 30% per option in NSC Asesores at a predetermined relative price. The first option was executed in March 2019, the second option will be exercisable in 2021.
With the exercise of the first option, the Group has increased its overall participation to 70% and therefore consolidates NSC Asesores as of 1 March 2019. 80% of the first half of the purchase price of CHF 11.1 million has been paid in cash and the remaining 20% in listed shares of the Group at their fair value as of the date of the transaction. The second half of the purchase price will be paid in cash in two equal tranches at the first and the second anniversary of the transaction date. As part of the transaction, the Group realised a net gain in the amount of CHF 0.6 million (net of negative foreign exchange impact of CHF -0.6 million) on the revaluation to fair value (derived from the purchase price of the additional 30% interest) of the 40% interest previously held as an investment in associates, which was recognised in other ordinary results in 2019.

additional inFormationFINANCIAL STATEMENTS JULIUS BAER GROUP 2020
115
The assets and liabilities of NSC Asesores have been recorded as follows (unchanged since 2019):
Fair value CHF mPurchase price Cash and Julius Baer Group Ltd. shares 11.1Contribution of the previously held 30% interest (at fair value) 29.6Deferred purchase price (liabilities) 11.1
total 51.9 Due from banks 1.5All other assets 2.4
assets acquired 3.9 Deferred tax liabilities 2.1All other liabilities 3.5
liabilities assumed 5.6 goodwill and other intangible assets Goodwill 34.2Customer relationships 26.8Non-controlling interests 7.5
total 53.5
Julius Baer Bank (Bahamas) ltd. (2020)At the beginning of February 2020, the Group announced its decision to close its Nassau booking centre as part of the Group’s efficiency and productivity programme. Following this announcement, the Group received purchase offers for its Bahamas operations and reached an agreement with Ansbacher (Bahamas) Limited on 30 April 2020.
In the second half of 2020, the transaction with Ansbacher to acquire Julius Baer Bank (Bahamas) Ltd. was closed. The transaction price was based on the assets under management; no material gain or loss resulted from the transaction.
kairos (2020)In October 2020, the Group announced that a select number of key managers of Kairos acquired a minority interest in Kairos, with Julius Baer retaining a majority of the legal ownership in Kairos. The transaction has been executed on 1 December 2020. At the same time, the managers entered into put contracts to redeem their shares under certain conditions. According to the relevant IFRS accounting rules, and contrary to the legal view, the managers’ shares do not qualify for treatment of non-controlling interests due to the put option structure. Therefore, the Group continues to fully consolidate Kairos without attributing equity or net profit to non-controlling interests. The anticipated cost for the exercise of the put option are recognised as personnel expense up to the assumed exercise date of the put option.

additional inFormationFINANCIAL STATEMENTS JULIUS BAER GROUP 2020
116
NOTE 32 SHARE-BASED PAYMENTS AND OTHER COMPENSATION PLANS
The programmes described below reflect the plan landscape as at 31 December 2020. All plans are reviewed annually to reflect any regulatory changes and/or market conditions. The Group’s overall compensation landscape is described in the chapter Remuneration Report of this Annual Report.
The Group hedges some of its liabilities from share-based payments by purchasing the shares on the market on grant date through the LOTECO Foundation.
deferred variable compensation plansCash-based variable compensation – Deferred Cash PlanThe Deferred Cash Plan (DCP) promotes sound business activities by remaining subject to forfeiture while providing an inherently less volatile payout than shares. The DCP grant is generally made once a year as part of the annual variable compensation awarded to the individual concerned, and participation is determined on an annual basis.
These annually granted deferred cash awards vest in equal one-third tranches, subject to continued employment, and accrued over a three- year plan period. The DCP may be granted outside the annual variable compensation cycle in cases where share-based plans are not permissible under local legislation or as an alternative to a Long-Term Incentive Plan award (as described below).
Deferred Bonus PlanSimilar to the DCP, the Deferred Bonus Plan (DBP) promotes sound business activities by remaining subject to forfeiture (as from performance year 2019) while providing an inherently less volatile payout than shares. The DBP grant is made once per year and is determined in reference to the annual variable compensation awarded to the individual concerned.
Eligibility for the DBP is based on various factors, which include nomination by the CEO, overall role within Julius Baer, total variable compensation and individual contribution in the reporting period. All members of the Executive Board, key employees and
the employees defined as risk takers of the Group by virtue of their function within the organisation are considered for the DBP based on their specific role.
These annually granted deferred cash awards vest in equal one-fifth tranches, subject to continued employment.
Equity-based variable compensation – Premium Share PlanThe Premium Share Plan (PSP) is designed to link a portion of the employee’s variable compensation to the long-term success of the Group through its share price. A PSP grant is made once a year as part of the annual variable compensation awarded to the individual concerned, and participation is determined on an annual basis. The employee is granted a number of shares equal in value to the deferred element. These shares vest in equal one-third tranches over a three-year plan period. At the end of the plan period, subject to continued employment, the employee then receives an additional share award representing a further one third of the number of shares granted to him or her at the beginning of the plan period.
Equity-based variable compensation – Equity Performance PlanThe Equity Performance Plan (EPP) is a robust long-term incentive mechanism for key employees. The EPP is an equity plan which seeks to create a retention element for key employees and to link a significant portion of the executive compensation to the future perform ance of the Group.
Eligibility for the EPP, similar to that of the DBP (as described above), is based on various factors, which include nomination by the CEO, overall role within Julius Baer, total variable compensation and individual contribution in the reporting period. All members of the Executive Board, key employees and employees defined as risk takers of the Group by virtue of their function within the organisation are considered for the EPP based on their specific role. An EPP grant is made once a year and is determined in reference to the annual variable compensation awarded to the individual concerned, and participation is determined on an annual basis.
additional inFormationFINANCIAL STATEMENTS JULIUS BAER GROUP 2020
117
The EPP is an annual rolling equity grant (made in February each year) that awards Performance Units to eligible participants subject to individual performance in the reporting period and future performance-based requirements.
The goal of the EPP is to incentivise participants in two ways:
– Firstly, by the nature of its construction, the ultimate value of the award to the participants fluctuates with the market value of Julius Baer Group Ltd. shares.
– Secondly, the Performance Units are contingent on continued service and two key performance indicators (KPIs), cumulative Economic Profit (cEP) and relative Total Shareholder Return (rTSR). The service condition requires that the participant remains with the Group for three years after the grant (through a cliff-vesting mechanism). The performance of the two KPIs determines the number of shares the participant ultimately receives.
The number of shares delivered under the EPP is between 0% and 150% of the number of Per form ance Units granted in any given year (with each individual KPI being capped at a maximum multi plying factor of 200%). The cap serves to limit EPP awards so as to avoid any unforeseen outcome of the final EPP multiplier resulting in unintentionally high or excessive levels of compensation. A high level of performance is required to attain a maximum share delivery (creating a maximum uplift of 50% of the Performance Units granted), with low-level performance leading to potential nil compensation.
The KPI targets are set based on the strategic three-year budget/plan that is approved by the Board of Directors on an annual basis. Extremely high (and, thus, unrealistic) performance targets are avoided, so as not to incentivise excessive risk taking by executives and other managerial staff.
Long-Term Incentive Plan (LTI)In certain specific situations, the Group may also offer incentives outside the annual compensation cycle. Compensatory payments to new hires for deferred awards they have forfeited by resigning from their previous employer or retention payments to key employees during extraordinary or critical circumstances may be made by granting individuals an equity-based LTI.
An LTI granted in these circumstances generally runs over a three-year plan period. The Group generally operates two different vesting schedules for this plan: (1) three equal one-third tranches vesting over a three-year period, (2) cliff-vesting of all granted shares in one single tranche at the end of a three-year period.
Staff Participation Plan (SPP)The SPP is offered to most of the Group’s global employee population. Some individuals or employees in specific locations are excluded from participating because, for example, the employees concerned are participants in another Group equity-based plan or because the SPP cannot be offered in a particular jurisdiction for legal, regulatory or administrative reasons. Under this plan, eligible participants may voluntarily purchase Julius Baer Group Ltd. shares at the prevailing market price, and for every three shares so purchased they will receive one additional share free of charge. These free shares vest after three years, subject to continued employ ment. Purchases under the SPP only occur once a year.
The objective of this plan is to strengthen the employee’s identification with the Group, to encourage entrepreneurial spirit, to generate greater interest in the business through ownership and to provide employees with financial recognition for their long-term dedication to the Group.

additional inFormationFINANCIAL STATEMENTS JULIUS BAER GROUP 2020
118
Movements in shares/performance units granted under various participation plans are as follows:
31.12.2020 31.12.2019
Number of units Number of units Number of units Number of units
Total Total Economic Shareholder Economic Shareholder
Profit Return Profit Return
equity Performance Plan
Unvested units outstanding, at the beginning of the year 1,009,810 1,009,810 786,386 786,386
Granted during the year 343,938 343,938 519,340 519,340
Exercised during the year -252,482 -252,482 -235,815 -235,815
Forfeited during the year -11,458 -11,458 -60,101 -60,101
Unvested units outstanding, at the end of the year 1,089,808 1,089,808 1,009,810 1,009,810
31.12.2020 31.12.2019
Premium Share Plan
Unvested shares outstanding, at the beginning of the year 1,307,722 1,237,096
Granted during the year 637,193 742,863
Vested during the year -555,302 -590,688
Forfeited during the year -45,416 -81,549
Unvested shares outstanding, at the end of the year 1,344,197 1,307,722
Weighted average fair value per share granted (CHF) 49.19 40.58
Fair value of outstanding shares at the end of the year (CHF 1,000) 68,554 65,295

additional inFormationFINANCIAL STATEMENTS JULIUS BAER GROUP 2020
119
31.12.2020 31.12.2019
long-term incentive Plan
Unvested shares outstanding, at the beginning of the year 764,194 564,521
Granted during the year 384,064 553,557
Vested during the year -228,612 -304,190
Forfeited during the year -44,742 -49,694
Unvested shares outstanding, at the end of the year 874,904 764,194
Weighted average fair value per share granted (CHF) 45.74 43.36
Fair value of outstanding shares at the end of the year (CHF 1,000) 44,620 38,156
31.12.2020 31.12.2019
Staff Participation Plan
Unvested shares outstanding, at the beginning of the year 119,381 114,602
Granted during the year 74,583 52,572
Vested during the year -41,843 -43,061
Forfeited during the year -2,040 -4,732
Unvested shares outstanding, at the end of the year 150,081 119,381
Weighted average fair value per share granted (CHF) 34.32 42.65
Fair value of outstanding shares at the end of the year (CHF 1,000) 7,654 5,961
Compensation expense recognised for the various participation plans are:
31.12.2020 31.12.2019
CHF m CHF m
Compensation expense
Equity Performance Plan 25.0 32.4
Premium Share Plan 29.1 28.5
Long-Term Incentive Plan 15.3 16.2
Staff Participation Plan 2.2 2.0
total 71.6 79.1

additional inFormationFINANCIAL STATEMENTS JULIUS BAER GROUP 2020
120
NOTE 33 ASSETS UNDER MANAGEMENT
Assets under management include all bankable assets managed by or deposited with the Group for investment purposes. Assets included are portfolios of wealth management clients for which the Group provides discretionary or advisory asset manage ment services. Assets deposited with the Group held for transactional or safekeeping/custody purposes, and for which the Group does not offer advice on how the assets should be invested, are excluded from assets under management. In general, transactional or safekeeping/custody assets belong to banks, brokers, securities traders, custodians, or certain institutional investors. Non-bankable assets (e.g. art collections, real estate), asset flows driven more by liquidity requirements than investment purposes or assets primarily used for cash management, funding or trading purposes are also not considered assets under management.
Assets with discretionary mandate are defined as assets for which the investment decisions are made by the Group, and cover assets deposited with Group companies as well as assets deposited at third-party institutions. Other assets under manage-ment are defined as assets for which the investment decision is made by the client himself. Both assets with discretionary mandate and other assets under management take into account client deposits as well as market values of securities, precious metals, and fiduciary investments placed at third-party institutions.
When assets under management are subject to more than one level of asset management services, double counting arises within the total assets under management. Each such separate discretionary or advisory service provides additional benefits to the respective client and generates additional revenue to the Group.
Net new money consists of new client acquisitions, client departures and in- or outflows attributable to existing clients. It is calculated through the direct method, which is based on individual client trans-actions. New or repaid loans and related interest expenses result in net new money flows. Interest and dividend income from assets under management, market or currency movements as well as fees and commissions are not included in the net new money result. Effects resulting from any acquisition or divest ment of a Group subsidiary or business are stated separately. Generally reclassifications between assets under management and assets held for transactional or safekeeping/custody purposes result in corres ponding net new money in- or outflows.
Assets under management which are managed by or deposited with associates of the Group are not considered assets managed by or deposited with the Group and are therefore not included in the respective numbers.
Assets under management are disclosed according to the Guidelines of the Swiss Financial Market Supervisory Authority (FINMA) governing financial statement reporting.

additional inFormationFINANCIAL STATEMENTS JULIUS BAER GROUP 2020
121
assets under management
2020 2019 Change
CHF m CHF m %
Assets with discretionary mandate 68,493 66,128 3.6
Other assets under management 363,611 356,260 2.1
Assets in collective investment schemes managed by the Group1 1,568 3,672 -57.3
total assets under management (including double counting) 433,672 426,060 1.8
of which double counting 15,596 10,963 42.3
Change through net new money 15,060 10,598
Change through market and currency impacts -5,312 38,784
Change through acquisition - 3,015 2
Change through divestment -2,126 3 -4,713 3
Change through other effects -10 4 -3,698 4
Client assets 505,496 499,047 1.3
1 Collective investment schemes are related to Julius Baer Family Office Brasil Gestão de Patrimônio Ltda. (former GPS Investimentos Financeiros e Participações S.A.), São Paulo, and to Kairos Investment Management S.p.A., Milan.
2 In March 2019, the Group acquired NSC Asesores, Mexico.3 Assets under management were affected by the Group’s decision to discontinue its offering to clients from a number of selected countries and completion of
sale of Julius Baer (Netherlands) B.V. (2019) and Julius Baer Bank (Bahamas) Limited (2020).4 Includes assets which have been reclassified following the completed roll-out of the new client advisory models in Switzerland and continental Europe.
Client assets are defined as all bankable assets managed by or deposited with the Group companies for investment purposes and only those deposited assets held for transactional, safekeeping/custody or administrative purposes for which additional ser vices, for example analysis and reporting or secur ities lending and borrowing, are provided.
Non-bankable assets (e.g. art collections, real estate), asset flows driven more by liquidity requirements than investment purposes, assets primarily used for cash management, funding or trading purposes or deposited assets held purely for transactional or safekeeping/custody purposes are excluded from client assets.

additional inFormationFINANCIAL STATEMENTS JULIUS BAER GROUP 2020
122
Breakdown of assets under management
2020 2019
% %
By types of investment
Equities 30 28
Bonds (including convertible bonds) 17 19
Investment funds 27 26
Money market instruments 2 4
Client deposits 18 17
Structured products 5 5
Other 1 1
total 100 100
By currencies
CHF 9 10
EUR 19 20
USD 48 47
GBP 4 4
SGD 1 2
HKD 4 3
INR 4 3
BRL 2 2
Other 9 9
total 100 100

additional inFormationFINANCIAL STATEMENTS JULIUS BAER GROUP 2020
123
NOTE 34 REQUIREMENTS OF SWISS BANKING LAW
The Group is subject to supervision by the Swiss Financial Market Supervisory Authority (FINMA), which requires Switzerland-domiciled banks using Inter national Financial Reporting Standards (IFRS) as their primary accounting standard to provide a narrative explanation of the major differences between IFRS and Swiss GAAP. Swiss GAAP is based on the regulations of the Swiss Code of Obligations, on Swiss Banking Law and the Ordinance thereto, on the FINMA Accounting Ordinance (RelV-FINMA) and the Guidelines of the FINMA Circular 2020/1 ‘Accounting Banks’.
The following main differences exist between IFRS and Swiss GAAP (true and fair view) which are relevant to the Group:
Under IFRS, all income and expenses are attributed to ordinary business operations. Under Swiss GAAP, income and expenses are classified as extraordinary, if they are from non-operating transactions and are non-recurring.
Under IFRS, goodwill is not amortised but tested for impairment annually, and a write-off is made if the recoverable amount is less than the carrying amount. Under Swiss GAAP, goodwill is amortised over its useful life, generally not exceeding five years (in justified cases up to twenty years), and tested for impairment.
Swiss GAAP allows the application of IAS 19 for the accounting for defined benefit plans. However, the remeasurement of the net defined benefit liability is recognised in the income statement and comprises movements in actuarial gains and losses and return on plan assets (excluding net interest cost). Under IFRS, these components are recognised directly in equity.
NOTE 35 EVENTS AFTER THE BALANCE SHEET DATE
There are no events to report that had an influence on the balance sheet or the income statement for the 2020 financial year.