consolidated financial statements …s2.q4cdn.com/231101920/files/doc_financials/q4...
TRANSCRIPT

CONSOLIDATED FINANCIAL STATEMENTS
DECEMBER 31, 2011 and 2010
(Expressed in US Dollars)

2
Independent Auditors’ Report To the Shareholders of
Capstone Mining Corp.
We have audited the accompanying consolidated financial statements of Capstone Mining Corp, which comprise the
consolidated balance sheets as at December 31, 2011, December 31, 2010 and January 1, 2010, and the consolidated
statements of earnings, comprehensive income, changes in equity and cash flows for the years ended December 31,
2011 and December 31, 2010, and a summary of significant accounting policies and other explanatory information.
Management’s Responsibility for the Consolidated Financial Statements
Management is responsible for the preparation and fair presentation of these consolidated financial statements in
accordance with International Financial Reporting Standards, and for such internal control as management determines
is necessary to enable the preparation of consolidated financial statements that are free from material misstatement,
whether due to fraud or error.
Auditor’s Responsibility
Our responsibility is to express an opinion on these consolidated financial statements based on our audits. We
conducted our audits in accordance with Canadian generally accepted auditing standards. Those standards require that
we comply with ethical requirements and plan and perform the audit to obtain reasonable assurance about whether the
consolidated financial statements are free from material misstatement.
An audit involves performing procedures to obtain audit evidence about the amounts and disclosures in the
consolidated financial statements. The procedures selected depend on the auditor’s judgment, including the
assessment of the risks of material misstatement of the consolidated financial statements, whether due to fraud or
error. In making those risk assessments, the auditor considers internal control relevant to the entity’s preparation and
fair presentation of the consolidated financial statements in order to design audit procedures that are appropriate in
the circumstances, but not for the purpose of expressing an opinion on the effectiveness of the entity’s internal
control. An audit also includes evaluating the appropriateness of accounting policies used and the reasonableness of
accounting estimates made by management, as well as evaluating the overall presentation of the consolidated
financial statements.
We believe that the audit evidence we have obtained in our audits is sufficient and appropriate to provide a basis for
our audit opinion.
Opinion
In our opinion, the consolidated financial statements present fairly, in all material respects, the financial position of
Capstone Mining Corp. as at December 31, 2011, December 31, 2010 and January 1, 2010 and its financial
performance and its cash flows for the years ended December 31, 2011 and December 31, 2010 in accordance with
International Financial Reporting Standards.
(Signed) Deloitte & Touche LLP
Chartered Accountants
March 13, 2012
Vancouver, Canada

Capstone Mining Corp. Consolidated Balance Sheets
(expressed in thousands of US dollars)
3
ASSETS December 31, 2011 December 31, 2010 January 1, 2010
Current
Cash and cash equivalents (Note 23) 486,287$ 165,945$ 115,931$
Restricted cash - 6,377 2,496
Short-term deposits (Note 6) - 20,039 -
Receivables (Note 7) 29,099 16,392 6,946
Inventories (Note 8) 48,332 67,210 44,438
Prepaids and other 1,360 1,581 1,404
Derivative instrument asset (Note 13) 1,530 11,602 -
566,608 289,146 171,215
Investments (Note 9) 237 2,718 39,105
Mineral properties, plant and equipment (Note 10) 782,924 324,876 316,870
Promissory note receivable (Note 4) 62,520 - -
Notes receivable (Note 11) 8 502 872
Taxes receivable 3,622 - -
Deferred income tax asset (Note 18) 1,022 5,526 15,340
Other assets (Note 12) 704 670 505
Derivative instrument asset (Note 13) 1,890 3,635 -
Total assets 1,419,535$ 627,073$ 543,907$
LIABILITIES
Current
Accounts payable and accrued liabilities 18,699$ 22,277$ 19,782$
Income taxes payable 2,452 8,524 8,041
Advances on concentrate inventories - 33,260 16,702
Current portion of other liabilities (Note 14) 12,324 48,116 47,999
33,475 112,177 92,524
Long-term debt (Note 15) - 11,573 10,821
Finance lease obligations (Note 16) - 10,280 18,425
Derivative instrument liability (Note 13) 1,543 8,812 21,757
Deferred revenue (Note 17) 46,567 60,677 73,465
Deferred income tax liability (Note 18) 41,472 31,285 32,087
Reclamation and closure cost obligations and other (Note 19) 21,593 14,531 10,472
Total liabilities 144,650 249,335 259,551
EQUITY
Share capital (Note 20) 809,892 205,790 196,115
Reserve for equity settled share based transactions 42,441 18,496 16,737
Equity component of convertible debentures 1,146 1,146 1,174
Investment revaluation reserve (315) 821 8,955
Foreign currency translation reserve (7,131) 15,558 -
Retained earnings 196,353 135,927 61,375
Total equity attributable to equity holders of the Company 1,042,386 377,738 284,356
Non-controlling interest 232,499 - -
Total equity 1,274,885 377,738 284,356
Total liabilities and equity 1,419,535$ 627,073$ 543,907$
Commitments (Note 26)
Contingencies (Note 28)
ON BEHALF OF THE BOARD:
(Signed) Darren M. Pylot , Director (Signed) Dale C. Peniuk , Director
See accompanying notes to these consolidated financial statements.

Capstone Mining Corp. Consolidated Statements of Earnings
Years Ended December 31, 2011 and 2010 (expressed in thousands of US dollars, except share and per share amounts)
4
2011 2010
Gross sales revenue 352,546$ 301,322$
Treatment and selling costs (24,781) (27,369)
Net revenue 327,765 273,953
Operating costs
Cost of sales (119,530) (105,623)
Royalties (8,526) (6,715)
Depletion and amortization (86,537) (43,314)
Earnings from mining operations 113,172 118,301
General and administrative expenses (11,656) (10,069)
Stock-based compensation (Note 20) (8,606) (4,682)
Earnings from operations 92,910 103,550
Other income (expense)
Foreign exchange loss (5,899) (1,496)
Gain (loss) on derivative instruments (Note 13) 8,483 (15,459)
Gain on disposal of investments (Note 9) 1,468 26,117
Loss on disposal of equipment (286) (63)
Earnings before finance costs and income taxes 96,676 112,649
Interest and other income 4,408 867
Interest from discounting reclamation and closure cost obligations (349) (315)
Interest on long term debt (611) (1,683)
Interest on finance lease obligations (146) (1,418)
Earnings before income taxes 99,978 110,100
Current income and mining tax expense (23,864) (25,707)
Deferred income tax expense (15,688) (9,841)
Net earnings 60,426$ 74,552$
Net earnings attributable to:
Shareholders of Capstone Mining Corp. 60,692$ 74,552$
Non-controlling interest (266) -
60,426$ 74,552$
Earnings per share - basic (Note 21) 0.20$ 0.37$
Weighted average number of shares - basic 295,997,095 198,996,825
Earnings per share - diluted (Note 21) 0.20$ 0.37$
Weighted average number of shares - diluted 303,075,854 202,453,289
See accompanying notes to these consolidated financial statements.

Capstone Mining Corp. Consolidated Statements of Comprehensive Income
Years Ended December 31, 2011 and 2010 (expressed in thousands of US dollars)
5
2011 2010
Net earnings 60,426$ 74,552$
Other comprehensive (loss) income
Change in fair value of available-for-sale securities, net of tax
of $64 (2010 - $914) (369) 6,859
Gain on the disposal of available-for-sale securities reclassified
to net earnings on realization, net of tax of $132 (2010 - $2,443) (767) (14,993)
Foreign currency translation adjustment (22,689) 15,558
(23,825) 7,424
Total comprehensive income 36,601$ 81,976$
Total comprehensive income attributable to:
Shareholders of Capstone Mining Corp. 36,867$ 81,976$
Non-controlling interest (266) -
36,601$ 81,976$
See accompanying notes to these consolidated financial statements.

Capstone Mining Corp. Consolidated Statements of Cash Flows
Years Ended December 31, 2011 and 2010 (expressed in thousands of US dollars)
6
2011 2010
Cash provided by (used in):
Operating activities
Net earnings 60,426$ 74,552$
Adjustments for:
Net finance costs (3,302) 2,549
Current income tax expense 23,864 25,707
Depletion, amortization and accretion 86,940 43,630
Amortization of deferred revenue (13,711) (14,410)
Stock-based compensation 8,606 4,682
Shares issued for compensation 267 309
Deferred income tax expense 15,688 9,841
Gain on disposal of investments (1,468) (26,117)
Loss on disposal of equipment 286 63
Unrealized gain on derivative instruments (36,645) (18,503)
Unrealized loss on foreign exchange 5,318 613
Other - 175
Interest received (paid) 2,719 (25,772) Income taxes paid (28,606) (2,885)
Payments on reclamation and closure cost obligations (114) (125)
Changes in non-cash working capital (Note 24) (33,837) 11,984
86,431 86,293
Investing activities
(Increase) decrease in restricted cash 6,436 (3,544)
Proceeds on sale of investments 2,979 60,912
Purchase of investments (199) (8,228)
Mineral properties, plant and equipment additions (88,244) (55,526)
Purchase of Far West net assets (Note 4) (56,690) -
Sale of non-controlling interest in Far West net assets (Note 4) 277,378 -
Proceeds on maturity of short-term deposits 40,000 -
Purchase of short-term deposits (20,000) (20,000)
Other deposits (64) (856)
161,596 (27,242)
Financing activities
Repayment of long-term debt (7,305) (9,800)
Payment to fund KORES promissory note (Note 4) (83,213) -
Repayment of KORES promissory note (Note 4) 5,454 -
Repayment of finance lease obligations (10,603) (11,026)
Proceeds from issuance of share capital 188,363 6,322
Share issue costs (1,431) -
91,265 (14,504)
Effect of exchange rate changes on cash and cash equivalents (18,950) 5,467
Increase in cash and cash equivalents 320,342 50,014
Cash and cash equivalents - beginning of year 165,945 115,931
Cash and cash equivalents - end of year 486,287$ 165,945$
Supplemental cash flow information (Note 23)
See accompanying notes to these consolidated financial statements.

Capstone Mining Corp. Consolidated Statements of Changes in Equity (expressed in thousands of US dollars, except share amounts)
7
Number of
shares Share capital
Reserve for
equity settled
share based
transactions
Equity
component of
convertible
debentures
Investment
revaluation
reserve
Foreign currency
translation
reserve
Retained
earnings Total
Non-controlling
interest Total equity
December 31, 2010 201,454,802 205,790$ 18,496$ 1,146$ 821$ 15,558$ 135,927$ 377,738$ -$ 377,738$
Private placement (Note 20) 40,198,632 177,958 - - - - - 177,958 - 177,958
Exercise of options 5,647,392 18,125 (7,720) - - - - 10,405 - 10,405
Stock-based compensation - - 8,606 - - - - 8,606 - 8,606
Issued for compensation 80,000 267 - - - - - 267 - 267
Share issue costs - (1,447) - - - - - (1,447) - (1,447)
Deferred income tax on
share issue costs - 365 - - - - - 365 - 365
Purchase of Far West net assets (Note 4) 128,753,385 408,575 23,318 - - - - 431,893 - 431,893
Sale of non-controlling interest in
Far West net assets (Note 4) - - - - - - - - 277,378 277,378
Reduction to carrying value of
mineral property on sale of
Far West net assets (Note 4)- - - - - - - - (44,879) (44,879)
Issued for mineral properties 100,000 259 (259) - - - - - - -
Change in fair value of
available-for-sale securities - - - - (369) - - (369) - (369)
Gains reclassified to earnings - - - - (767) - - (767) - (767)
Net earnings - - - - - - 60,426 60,426 - 60,426
Foreign currency translation - - - - - (22,689) - (22,689) - (22,689)
December 31, 2011 376,234,211 809,892$ 42,441$ 1,146$ (315)$ (7,131)$ 196,353$ 1,042,386$ 232,499$ 1,274,885$
January 1, 2010 197,645,802 196,115$ 16,737$ 1,174$ 8,955$ -$ 61,375$ 284,356$ -$ 284,356$
Exercise of options 3,560,753 8,986 (2,664) - - - - 6,322 - 6,322
Stock-based compensation - - 4,682 - - - - 4,682 - 4,682
Issued for compensation 123,390 309 - - - - - 309 - 309
Issued for mineral properties 100,000 259 (259) - - - - - - -
Issued on conversion of
convertible debentures 24,857 121 - (28) - - - 93 - 93
Change in fair value of available-
for-sale securities - - - - 6,859 - - 6,859 - 6,859
Gains reclassified to earnings - - - - (14,993) - - (14,993) - (14,993)
Net earnings - - - - - - 74,552 74,552 - 74,552
Foreign currency translation - - - - - 15,558 - 15,558 - 15,558
December 31, 2010 201,454,802 205,790$ 18,496$ 1,146$ 821$ 15,558$ 135,927$ 377,738$ -$ 377,738$
Attributable to equity holders of the Company
See accompanying notes to these consolidated financial statements.

Capstone Mining Corp. Notes to Consolidated Financial Statements
Years Ended December 31, 2011 and 2010 (expressed in thousands of US dollars, except share amounts)
8
1. Nature of operations
Capstone Mining Corp. (the “Company” or “Capstone”), a publicly listed Canadian mining company on the Toronto
Stock Exchange, is engaged in the exploration for and production of base and precious metals in Canada, Mexico,
Chile, and Australia. Minto Explorations Ltd. (“Minto”), a wholly owned Canadian subsidiary, owns and operates the
copper-gold-silver Minto Mine located in Yukon Territory, Canada. Capstone Gold, S.A. de C.V. (“Capstone Gold”),
a wholly owned Mexican subsidiary, owns and operates the copper-silver-zinc-lead Cozamin Mine located in
Zacatecas, Mexico. Minera Santo Domingo SCM (“Santo Domingo”), a 70% owned Chilean subsidiary, is advancing
the Santo Domingo copper-iron-gold project in Chile towards a production decision. Kutcho Copper Corp. (“Kutcho
Copper”), a wholly owned Canadian subsidiary, is advancing the Kutcho copper-zinc-silver-gold project in British
Columbia, Canada towards a production decision. Far West Mining Pty Ltd. (“Far West Australia”), a 70% owned
Australian subsidiary, holds active exploration properties in Australia.
The head office, registered and records office and principal address of the Company are located at 999 West Hastings
Street, Vancouver, British Columbia and the Company is incorporated in British Columbia.
The financial statements were approved by the Board of Directors and authorized for issuance on March 13, 2012.
2. Significant accounting policies
Basis of preparation and consolidation
These consolidated financial statements represent the first annual financial statements of the Company and its
subsidiaries prepared in accordance with International Financial Reporting Standards (“IFRS”), as issued by the
International Accounting Standard Board (“IASB”). IFRS 1, First-time Adoption of IFRS, has therefore been applied
in preparing these consolidated financial statements.
These consolidated financial statements have been prepared in accordance with the accounting policies presented
below and are based on the IFRS and International Financial Reporting Interpretations Committee (“IFRIC”)
interpretations issued and effective as of December 31, 2011. The policies set out below were consistently applied to
all the periods presented unless otherwise noted.
The Company's consolidated financial statements were previously prepared in accordance with Canadian generally
accepted accounting principles (“GAAP”), which differs in some areas from IFRS. In preparing these consolidated
financial statements, management has amended certain accounting methods previously applied in the Canadian GAAP
consolidated financial statements to comply with IFRS. The comparative figures for 2010 were restated to reflect
these amendments. Reconciliations and descriptions of the effect of the transition from Canadian GAAP to IFRS on
equity, earnings, and comprehensive income are provided in Note 29.
Use of estimates and judgments
The preparation of consolidated financial statements requires management to select accounting policies and make
estimates and judgments that may have a significant impact on the consolidated financial statements. The Company
regularly reviews its estimates; however, actual amounts could differ from the estimates used and, accordingly,
materially affect the results of operations.
Examples of significant estimates include:
purchase price allocation on business combinations and acquisitions of assets;
mineral resources and mineral reserves;
the carrying values of inventories;
estimated tonnes of waste material mined for calculation of deferred stripping costs;
the carrying values of mineral properties, plant and equipment;
rates of amortization of mineral properties, plant and equipment;
the assumptions used for the determination of reclamation and closure cost obligations;
the valuation of deferred income taxes and allowances;

Capstone Mining Corp. Notes to Consolidated Financial Statements
Years Ended December 31, 2011 and 2010 (expressed in thousands of US dollars, except share amounts)
9
estimates used in the assessment of impairment of mineral properties, plant and equipment;
the valuation of financial instruments, including estimates used in provisional pricing calculations;
the carrying values of receivables; and
the valuation of share-based compensation.
Examples of significant judgments, apart from those involving estimation, include:
the accounting policies for mineral properties, plant and equipment;
determination that the transaction with Far West Mining Ltd. constitutes an acquisition of assets;
classification of financial instruments;
classification of leases; and
determination of functional currency.
Translation of foreign currencies
The Company considers the functional currency of its Canadian and Australian operations to be the Canadian dollar
and the functional currency of its Mexican and Chilean operations to be the US dollar. The presentation currency of
the Company is the US dollar. Financial statements of subsidiaries are maintained in their functional currencies and
converted to US dollars for consolidation of the Company’s results. The functional currency of each entity is
determined after consideration of the primary economic environment of the entity.
Transactions denominated in foreign currencies (currencies other than the functional currency of an operation) are
translated at the exchange rates on the date of transaction. Monetary assets and liabilities denominated in foreign
currencies are translated at reporting date exchange rates and any gain or loss on translation is recorded in the
statement of earnings as a foreign exchange gain (loss).
On translation of entities with functional currencies other than the US dollar, statement of earnings items are translated
at average rates of exchange where this is a reasonable approximation of the exchange rate at the dates of the
transactions. Balance sheet items are translated at closing exchange rates as at the reporting date. Exchange
differences on the re-translation of the foreign currency entities at closing rates, together with differences between
statement of earnings translated at average and closing rates, are recorded in the foreign currency translation reserve in
equity.
The following USD/CAD exchange rates have been applied:
2011 2010
January 1 opening rate 0.9946 1.0510
Quarterly average rate
Q1 0.9856 1.0401
Q2 0.9680 1.0283
Q3 0.9808 1.0395
Q4 1.0230 1.0131
December closing rate 1.0170 0.9946
Business combinations
Business combinations are accounted for using the acquisition method whereby identifiable assets acquired and
liabilities assumed, including contingent liabilities, are recorded at 100% of their fair values at the date of acquisition.
The acquisition date is the date at which the Company obtains control over the acquire, which is generally the date that
consideration is transferred and the Company acquired the assets and assumes the liabilities of the acquiree.
Acquisition related costs of business combinations are recorded as expenses.
Non-controlling interests are recorded at their proportionate share of the fair value of identifiable net asets acquired on
initial recognition and are classified as a separate component of equity. The excess of (i) total consideration
transferred by the Company, measured at fair value, including contingent consideration, and (ii) the non-controlling
interests in the acquiree, over the fair value of net assets acquired, is recorded as goodwill.
Capstone Mining Corp. Notes to Consolidated Financial Statements
Years Ended December 31, 2011 and 2010 (expressed in thousands of US dollars, except share amounts)
10
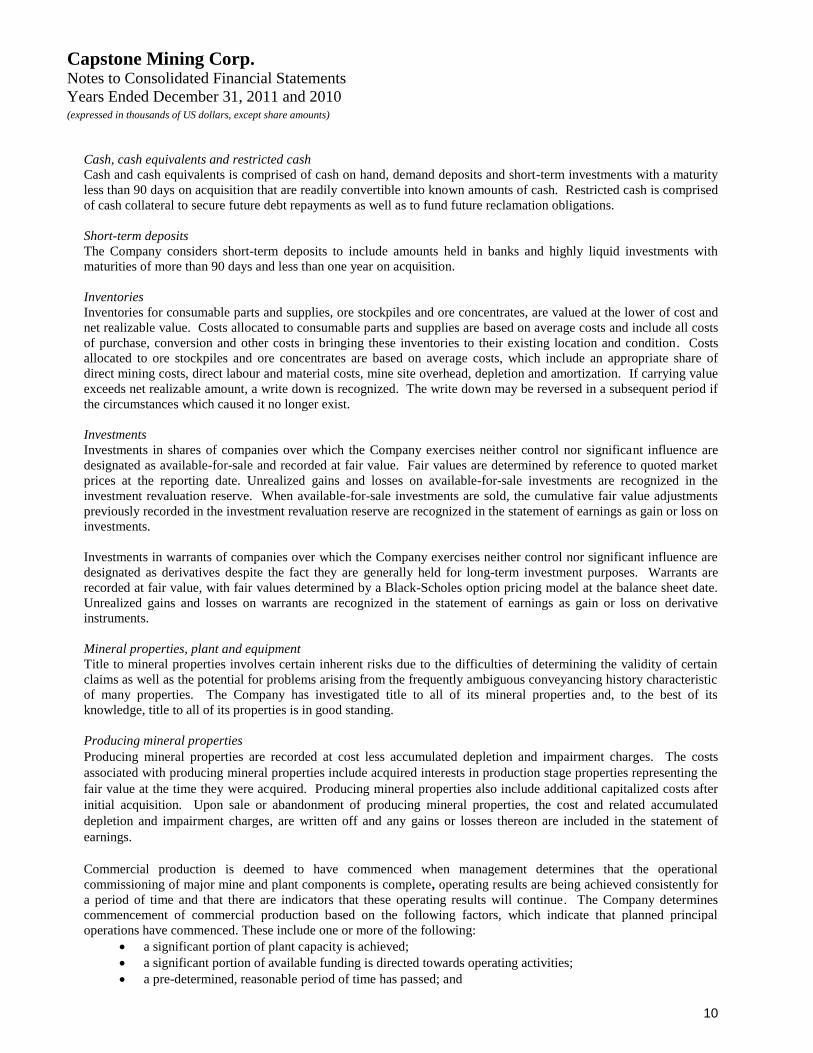
Cash, cash equivalents and restricted cash
Cash and cash equivalents is comprised of cash on hand, demand deposits and short-term investments with a maturity
less than 90 days on acquisition that are readily convertible into known amounts of cash. Restricted cash is comprised
of cash collateral to secure future debt repayments as well as to fund future reclamation obligations.
Short-term deposits
The Company considers short-term deposits to include amounts held in banks and highly liquid investments with
maturities of more than 90 days and less than one year on acquisition.
Inventories
Inventories for consumable parts and supplies, ore stockpiles and ore concentrates, are valued at the lower of cost and
net realizable value. Costs allocated to consumable parts and supplies are based on average costs and include all costs
of purchase, conversion and other costs in bringing these inventories to their existing location and condition. Costs
allocated to ore stockpiles and ore concentrates are based on average costs, which include an appropriate share of
direct mining costs, direct labour and material costs, mine site overhead, depletion and amortization. If carrying value
exceeds net realizable amount, a write down is recognized. The write down may be reversed in a subsequent period if
the circumstances which caused it no longer exist.
Investments
Investments in shares of companies over which the Company exercises neither control nor significant influence are
designated as available-for-sale and recorded at fair value. Fair values are determined by reference to quoted market
prices at the reporting date. Unrealized gains and losses on available-for-sale investments are recognized in the
investment revaluation reserve. When available-for-sale investments are sold, the cumulative fair value adjustments
previously recorded in the investment revaluation reserve are recognized in the statement of earnings as gain or loss on
investments.
Investments in warrants of companies over which the Company exercises neither control nor significant influence are
designated as derivatives despite the fact they are generally held for long-term investment purposes. Warrants are
recorded at fair value, with fair values determined by a Black-Scholes option pricing model at the balance sheet date.
Unrealized gains and losses on warrants are recognized in the statement of earnings as gain or loss on derivative
instruments.
Mineral properties, plant and equipment
Title to mineral properties involves certain inherent risks due to the difficulties of determining the validity of certain
claims as well as the potential for problems arising from the frequently ambiguous conveyancing history characteristic
of many properties. The Company has investigated title to all of its mineral properties and, to the best of its
knowledge, title to all of its properties is in good standing.
Producing mineral properties
Producing mineral properties are recorded at cost less accumulated depletion and impairment charges. The costs
associated with producing mineral properties include acquired interests in production stage properties representing the
fair value at the time they were acquired. Producing mineral properties also include additional capitalized costs after
initial acquisition. Upon sale or abandonment of producing mineral properties, the cost and related accumulated
depletion and impairment charges, are written off and any gains or losses thereon are included in the statement of
earnings.
Commercial production is deemed to have commenced when management determines that the operational
commissioning of major mine and plant components is complete, operating results are being achieved consistently for
a period of time and that there are indicators that these operating results will continue. The Company determines
commencement of commercial production based on the following factors, which indicate that planned principal
operations have commenced. These include one or more of the following: a significant portion of plant capacity is achieved;
a significant portion of available funding is directed towards operating activities;
a pre-determined, reasonable period of time has passed; and

Capstone Mining Corp. Notes to Consolidated Financial Statements
Years Ended December 31, 2011 and 2010 (expressed in thousands of US dollars, except share amounts)
11
a development project significant to the primary business objectives of the enterprise has been completed as
to significant milestones being achieved.
Deferred stripping
Stripping costs are accounted for as variable production costs and included in the costs of inventory produced during
the period that the stripping costs are incurred. However, stripping costs will be capitalized and recorded on the
balance sheet as a component of mineral properties, plant and equipment when the stripping activity provides access to
sources of reserves that will be produced in future periods that would not have otherwise been accessible in the
absence of this activity. The deferred stripping will be amortized on a unit of production basis over the reserves that
directly benefited from the stripping activity as those reserves are actually mined.
Mineral exploration and development properties
Mineral exploration and development properties comprise costs that are directly attributable to:
researching and analysing existing exploration data;
conducting geological studies, exploratory drilling and sampling;
examining and testing extraction and treatment methods; and
activities in relation to evaluating the technical feasibility and commercial viability of extracting a mineral
resource.
The costs associated with mineral exploration and development properties includes acquired interests in development
and exploration stage properties representing the fair value at the time they were acquired. Mineral exploration and
development properties also includes additional capitalized costs after initial acquisition.
Mineral exploration and development properties expenditures for each area of interest are carried forward as an asset
provided that one of the following conditions is met:
such costs are expected to be recouped in full through successful development and exploration of the area
of interest or alternatively, by its sale; or
exploration and evaluation activities in the area of interest have not yet reached a stage which permits a
reasonable assessment of the existence of economically recoverable reserves, however active and
significant operations in relation to the area are continuing, or planned for the future.
The carrying values of capitalized amounts of mineral exploration and development properties are reviewed annually,
or when there are indicators of impairment at each reporting date. In the case of undeveloped projects, there may be
only inferred resources to allow management to form a basis for the impairment review. The review is based on the
Company’s intentions for development of such a project. If a project does not prove viable, all unrecoverable costs
associated with the project are charged to the statement of earnings at the time the determination is made.
Once management has determined that the development potential of the property is economically viable and the
necessary permits are in place for its development, the costs of the exploration asset are reclassified to Producing
mineral properties.
Mill development costs
Mill development costs are recorded at cost less accumulated amortization and impairment losses. Mill development
costs includes in its purchase price, any costs directly attributable to the development of the mill. Upon abandonment
of any mill development costs, the cost and related accumulated amortization and impairment losses, are written off
and any gains or losses thereon are included in the statement of earnings.
Plant and equipment
Plant and equipment are recorded at cost less accumulated amortization and impairment losses. Plant and equipment
includes in its purchase price, any costs directly attributable to bringing plant and equipment to the location and
condition necessary for it to be capable of operating in the manner intended by management and the estimated close
down and restoration costs associated with dismantling and removing the asset. Upon sale or abandonment of any
plant and/or equipment, the cost and related accumulated amortization and impairment losses, are written off and any
gains or losses thereon are included in the statement of earnings.

Capstone Mining Corp. Notes to Consolidated Financial Statements
Years Ended December 31, 2011 and 2010 (expressed in thousands of US dollars, except share amounts)
12
Construction in progress
Mineral property development and plant and equipment construction commences when approved by management
and/or the Board and the Company has obtained all regulatory permissions to proceed. Development and construction
expenditures are capitalized and classified as Construction in progress. Once completed, the costs associated with all
applicable assets related to the development and construction are reclassified to the appropriate category within
mineral properties or plant and equipment.
Depletion and amortization of mineral properties, plant and equipment
The carrying amounts of mineral properties, plant and equipment are depleted or amortized to their estimated residual
value over the estimated economic life of the specific assets to which they relate, using the depletion or amortization
methods and rates as indicated below. Estimates of residual values and useful lives are reassessed annually and any
change in estimate is taken into account in the determination of the remaining amortization rate. Amortization
commences on the date the asset is available for its use as intended by management.
Depletion and amortization is computed using the following rates:
Item Methods Rates
Producing mineral
properties
Units of production Estimated proven and probable reserves
Deferred stripping costs Units of production Estimated proven and probable reserves
accessible due to stripping activity
Mill development costs Units of production Estimated proven and probable reserves
Plant & equipment Straight line,
Units of production
4 – 10 years,
Estimated proven and probable reserves
Equipment and facilities
under finance leases
Straight line Lesser of lease term and estimated useful
life (7 years)
Mineral exploration and
development properties
Not amortized
Construction in progress Not amortized
Borrowing costs
Interest and other financing costs directly related to the acquisition, development and construction, and production of
qualifying assets are capitalized as construction in progress or in mineral properties until they are complete and
available for use, at which time they are transferred to the appropriate category within mineral properties, plant and
equipment. Borrowing costs incurred after the asset has been placed into service as well as all other borrowing costs
are charged to earnings when incurred.
Impairment of long-lived assets
At each reporting date, the Company reviews the carrying amounts of its assets to determine whether there are any
indicators of impairment. If any such indicator exists, the recoverable amount of the asset is estimated in order to
determine the extent of the impairment, if any.
Where the asset does not generate cash inflows that are independent from other assets, the Company estimates the
recoverable amount of the cash generating unit (CGU) to which the asset belongs. The recoverable amount is
determined as the higher of fair value less direct costs to sell and the asset or CGU’s value in use. In assessing value
in use, the estimated future cash flows are discounted to their present value. Estimated future cash flows are calculated
using estimated recoverable reserves, estimated future commodity prices and the expected future operating and capital
costs. The pre-tax discount rate applied to the estimated future cash flows reflects current market assessments of the
time value of money and the risks specific to the asset for which the future cash flow estimates have not been adjusted.
Determining the discount rate includes appropriate adjustments for the risk profile of the country in which the
individual asset or CGU operates.
Capstone Mining Corp. Notes to Consolidated Financial Statements
Years Ended December 31, 2011 and 2010 (expressed in thousands of US dollars, except share amounts)
13
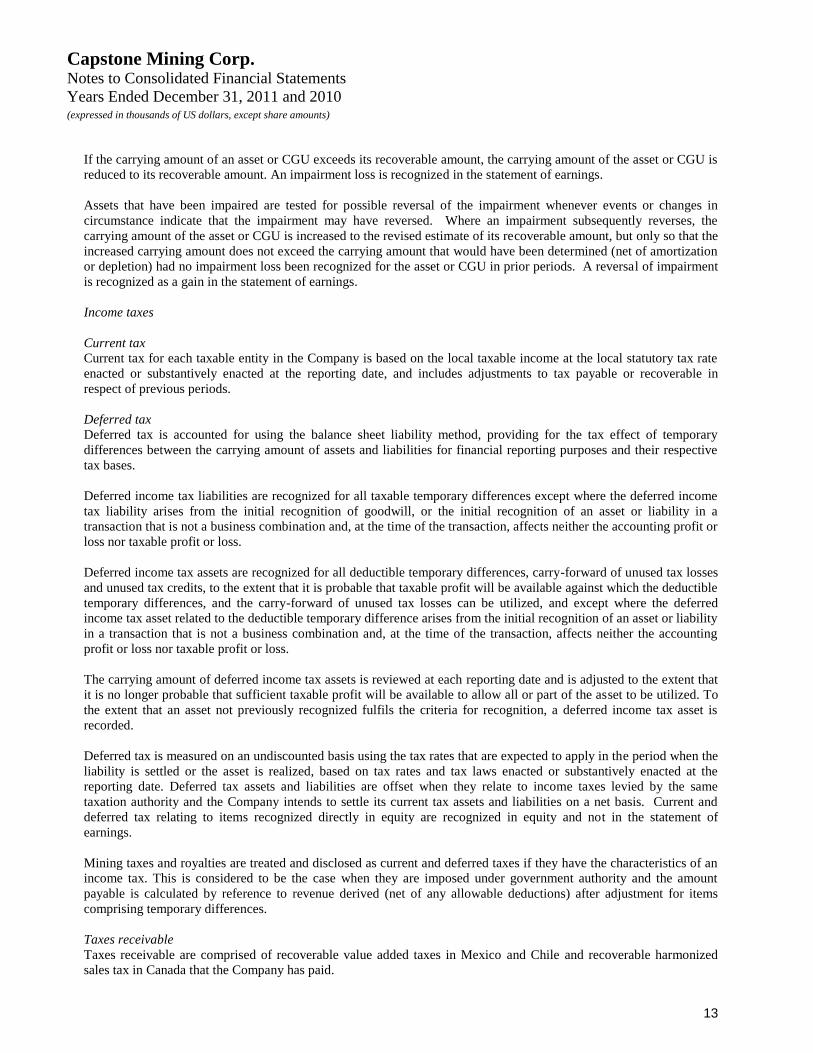
If the carrying amount of an asset or CGU exceeds its recoverable amount, the carrying amount of the asset or CGU is
reduced to its recoverable amount. An impairment loss is recognized in the statement of earnings.
Assets that have been impaired are tested for possible reversal of the impairment whenever events or changes in
circumstance indicate that the impairment may have reversed. Where an impairment subsequently reverses, the
carrying amount of the asset or CGU is increased to the revised estimate of its recoverable amount, but only so that the
increased carrying amount does not exceed the carrying amount that would have been determined (net of amortization
or depletion) had no impairment loss been recognized for the asset or CGU in prior periods. A reversal of impairment
is recognized as a gain in the statement of earnings.
Income taxes
Current tax
Current tax for each taxable entity in the Company is based on the local taxable income at the local statutory tax rate
enacted or substantively enacted at the reporting date, and includes adjustments to tax payable or recoverable in
respect of previous periods.
Deferred tax
Deferred tax is accounted for using the balance sheet liability method, providing for the tax effect of temporary
differences between the carrying amount of assets and liabilities for financial reporting purposes and their respective
tax bases.
Deferred income tax liabilities are recognized for all taxable temporary differences except where the deferred income
tax liability arises from the initial recognition of goodwill, or the initial recognition of an asset or liability in a
transaction that is not a business combination and, at the time of the transaction, affects neither the accounting profit or
loss nor taxable profit or loss.
Deferred income tax assets are recognized for all deductible temporary differences, carry-forward of unused tax losses
and unused tax credits, to the extent that it is probable that taxable profit will be available against which the deductible
temporary differences, and the carry-forward of unused tax losses can be utilized, and except where the deferred
income tax asset related to the deductible temporary difference arises from the initial recognition of an asset or liability
in a transaction that is not a business combination and, at the time of the transaction, affects neither the accounting
profit or loss nor taxable profit or loss.
The carrying amount of deferred income tax assets is reviewed at each reporting date and is adjusted to the extent that
it is no longer probable that sufficient taxable profit will be available to allow all or part of the asset to be utilized. To
the extent that an asset not previously recognized fulfils the criteria for recognition, a deferred income tax asset is
recorded.
Deferred tax is measured on an undiscounted basis using the tax rates that are expected to apply in the period when the
liability is settled or the asset is realized, based on tax rates and tax laws enacted or substantively enacted at the
reporting date. Deferred tax assets and liabilities are offset when they relate to income taxes levied by the same
taxation authority and the Company intends to settle its current tax assets and liabilities on a net basis. Current and
deferred tax relating to items recognized directly in equity are recognized in equity and not in the statement of
earnings.
Mining taxes and royalties are treated and disclosed as current and deferred taxes if they have the characteristics of an
income tax. This is considered to be the case when they are imposed under government authority and the amount
payable is calculated by reference to revenue derived (net of any allowable deductions) after adjustment for items
comprising temporary differences.
Taxes receivable
Taxes receivable are comprised of recoverable value added taxes in Mexico and Chile and recoverable harmonized
sales tax in Canada that the Company has paid.

Capstone Mining Corp. Notes to Consolidated Financial Statements
Years Ended December 31, 2011 and 2010 (expressed in thousands of US dollars, except share amounts)
14
Derivative instruments
The Company uses derivative instruments to reduce the potential impact of changing metal prices and foreign
exchange rates on its earnings. Derivative instruments are marked-to-market at the end of each reporting period and
the mark-to-market adjustment is recorded as a gain or loss on derivative instruments in the statement of earnings.
The Company does not apply hedge accounting to its derivative transactions.
Embedded derivatives
Derivatives may be embedded in other financial instruments (the “host instrument”). Embedded derivatives are
treated as separate derivatives when their economic characteristics and risks are not clearly and closely related to those
of the host instrument, the terms of the embedded derivative are the same as those of a stand-alone derivative, and the
combined contract is not held for trading or designated at fair value. These embedded derivatives are measured at fair
value with subsequent changes recognized in gains or losses on derivative instruments in the statement of earnings.
Compound instruments
The component parts of compound instruments are classified separately as financial liabilities and equity in
accordance with the substance of the contractual agreement. At the date of issue, the fair value of the liability
component is estimated using the prevailing market interest rate for similar non-convertible instruments. This amount
is recorded as a liability on an amortized cost basis until extinguished upon conversion or at the instrument’s maturity
date. The equity component is determined by deducting the amount of the liability component from the face value of
the compound instrument as a whole. This is recognized and included in equity, net of income tax effects, and is not
subsequently remeasured.
Financial instruments
On initial recognition, all financial instruments are recorded at fair value. Financial assets are designated upon
inception as either: (i) “held-to-maturity”; (ii) “fair value through profit or loss”; (iii) “available-for-sale”; or (iv)
“loans and receivables”. The designation determines the method by which the financial assets are carried on the
balance sheet subsequent to inception and how changes in value are recorded. Derivative instruments are classified as
“fair value through profit or loss” with subsequent changes in fair value recognized in the statement of earnings. Cash
and cash equivalents, restricted cash and short-term deposits are also classified as “fair value through profit or loss”.
Receivables, the promissory note, and notes receivable are designated as “loans and receivables” and are carried on the
balance sheet at amortized cost. Investments are designated as “available-for-sale” with changes in fair value
recognized in other comprehensive income.
Financial liabilities are designated as either: (i) “fair value through profit or loss”; or (ii) “other liabilities”. The
designation determines the method by which the financial liabilities are carried on the balance sheet subsequent to
inception and how changes in value are recorded. Derivative instruments are classified as “fair value through profit or
loss” with changes in fair value recognized in the statement of earnings. Accounts payable and accrued liabilities,
advances on concentrate inventories and long-term debt are classified as “other financial liabilities” and carried on the
balance sheet at amortized cost.
Transaction costs associated with “fair value through profit or loss” financial instruments are expensed as incurred,
whereas transaction costs associated with all other financial instruments are added to the initial carrying value of the
asset or liability.
Impairment and uncollectibility of financial assets
An assessment is made at each reporting date to determine whether there is objective evidence that a financial asset or
group of financial assets, other than those classified as “fair value through profit and loss” may be impaired. If such
evidence exists, the estimated recoverable amount of the asset is determined and an impairment loss is recognized for
the difference between the recoverable amount and the carrying amount as follows: the carrying amount of the asset is
reduced to its recoverable amount discounted at the financial asset’s original effective interest rate, either directly or
through the use of an allowance account and the resulting loss is recognized in the statement of earnings for the period.
When an “available-for-sale” financial asset is considered to be impaired, cumulative losses previously recognized in
the investment revaluation reserve in equity are reclassified to the statement of earnings.
With the exception of “available-for-sale” equity instruments, if, in a subsequent period, the amount of the impairment
loss decreases, the previously recognized impairment loss is reversed through the statement of earnings to the extent

Capstone Mining Corp. Notes to Consolidated Financial Statements
Years Ended December 31, 2011 and 2010 (expressed in thousands of US dollars, except share amounts)
15
that the carrying amount of the investment at the date the impairment is reversed does not exceed what the amortised
cost would have been had the impairment not been recognized. In respect of “available-for-sale” equity securities,
impairment losses previously recognized in the statement of earnings are not reversed through the statement of
earnings. Any increase in fair value subsequent to an impairment loss is recognized in other comprehensive income.
Deferred revenue
Deferred revenue consists of payments received by the Company in consideration for future commitments to deliver
payable gold and silver contained in concentrate at contracted prices. In addition, it includes the fair value of such
commitments acquired by way of business combination. As deliveries are made, the Company records a portion of the
deferred revenue as sales, based on a proportionate share of deliveries made compared with the total estimated
contractual commitment.
Leases
Assets held under leases which result in the Company receiving substantially all the risks and rewards of ownership of
the asset (finance leases) are capitalized at the lower of the fair value of the plant and equipment or the estimated
present value of the minimum lease payments. The corresponding liability is recognized as a finance lease obligation.
The interest element is allocated to accounting periods during the lease term to reflect the rate of interest on the
remaining balance of the obligation. Operating lease assets are not capitalized and rental payments are included in the
statement of earnings on a straight-line basis over the lease term.
Reclamation and closure cost obligations
A reclamation and closure cost obligation is recognized for close down, restoration and for environmental
rehabilitation costs (which include the dismantling and demolition of infrastructure, removal of residual materials and
remediation of disturbed areas) in the financial period when the related environmental disturbance occurs, based on the
estimated future costs using information available at the balance sheet date. At the time of establishing the provision, a
corresponding asset is capitalized, where it gives rise to a future benefit, and amortized over future production from
the operations to which it relates. The provision is discounted using a current market-based pre-tax discount rate and
the unwinding of the discount is included in the statement of earnings as interest expense from discounting reclamation
and closure cost obligations.
The obligation is reviewed each reporting period for changes to obligations, legislation or discount rates that impact
estimated costs or lives of operations. The cost of the related asset is adjusted for changes in the provision resulting
from changes in the estimated cash flows or discount rate and the adjusted cost of the asset is amortized prospectively.
Provisions
Provisions are recognized when the Company has a present obligation (legal or constructive), as a result of past events,
and it is probable that an outflow of resources that can be reliably estimated will be required to settle the obligation.
The amount recognized as a provision is the best estimate of the consideration required to settle the present obligation
at the reporting date, taking into account the risks and uncertainties surrounding the obligation. Where the effect is
material, the provision is discounted to net present value using an appropriate current market-based pre-tax discount
rate and the unwinding of the discount is included in the statement of earnings as interest expense from discounting
obligations.
Share capital
The proceeds from the exercise of stock options or warrants together with amounts previously recorded over the
vesting periods are recorded as share capital. Share capital issued for non-monetary consideration is recorded at an amount based on fair market value on the date of
issue.
The proceeds from the issue of units is allocated between common shares and common share purchase warrants on a
pro-rata basis based on relative fair values as follows: the fair value of the common shares is based on the market close
on the date the units are issued and the fair value of the common share purchase warrants is determined using the
Black-Scholes option pricing model.

Capstone Mining Corp. Notes to Consolidated Financial Statements
Years Ended December 31, 2011 and 2010 (expressed in thousands of US dollars, except share amounts)
16
Flow-through shares
Under the terms of Canadian flow-through share legislation, the tax attributes of qualifying expenditures are
renounced to subscribers. To recognize the foregone tax benefits, a deferred income tax expense and offsetting
deferred income tax liability are recognized as the related expenditures are renounced. In addition, any premiums paid
for flow-through shares in excess of the market value of shares without the flow-through features at the time of issue is
credited to other liabilities and recognized in the statement of earnings at the time the qualifying expenditures are
made.
Share-based payments
The Company makes periodic grants of share-based awards to selected directors, officers, employees and others
providing similar service. Contributions to the Company’s employee share purchase plan (“ESPP”) are recorded on a
payroll cycle basis as the Company’s obligation to contribute is incurred.
The fair value of the equity-settled awards is determined at the date of the grant by using the Black-Scholes option
pricing model. At each reporting date prior to vesting, the cumulative expense representing the extent to which the
vesting period has expired and management’s best estimate of the awards that are ultimately expected to vest is
computed. The movement in cumulative expense is recognized in the statement of earnings with a corresponding
entry within equity, against the reserve for equity settled share based transactions. No expense is recognized for
awards that do not ultimately vest.
Revenue recognition
Sales are recognized and revenue is recorded at market prices following the transfer of title and risk of ownership,
provided that collection is reasonably assured, the price is reasonably determinable, the Company has no significant
continuing involvement, and the costs incurred or to be incurred in respect of the transaction can be measured readily.
The Company’s metal concentrates are sold under a pricing arrangement where final prices are determined by quoted
market prices in a period subsequent to the date of sale. Until prices are final, revenues are recorded upon delivery
based on forward market prices for the expected period of final settlement. Subsequent variations in the final
determination of the metal concentrate weight, assay and price are recognized as revenue adjustments as they occur
until finalized. Under the terms of the Company’s off-take agreements, it may request advances from its customers
which are recorded as advances on concentrate inventories until the related revenue is recognized.
Earnings per share
Basic earnings per share is computed by dividing net earnings available (attributable) to common shareholders by the
weighted average number of common shares outstanding during the period. The computation of diluted earnings per
share assumes the conversion, exercise or contingent issuance of securities only when such conversion, exercise or
issuance would have a dilutive effect on earnings per share. The dilutive effect of convertible securities is reflected in
diluted earnings per share by application of the "if converted" method. The dilutive effect of outstanding options and
warrants and their equivalents is reflected in diluted earnings per share by application of the treasury stock method.

Capstone Mining Corp. Notes to Consolidated Financial Statements
Years Ended December 31, 2011 and 2010 (expressed in thousands of US dollars, except share amounts)
17
3. Adoption of new and revised IFRS and IFRS not yet effective
The accounting policies adopted in the preparation of the consolidated financial statements have been prepared on the
basis of all IFRS and interpretations effective as at December 31, 2011. Comparative figures in the financial
statements and notes as at January 1, 2010 and for the year ended December 31, 2010 have been restated to
consistently apply the same IFRS used for the year ended December 31, 2011.
The Company has not applied the following revised or new IFRS that have been issued but are not yet effective at
December 31, 2011:
Amendments to IAS 1, Presentation of Financial Statements (effective for annual periods beginning on or
after July 1, 2012) require that elements of other comprehensive income that may subsequently be recycled
through profit and loss be differentiated from those items that will not be recycled.
IFRS 9, Financial Instruments (effective January 1, 2015) introduces new requirements for the
classification and measurement of financial assets and liabilities.
IFRS 10, Consolidated Financial Statements, IFRS 11, Joint Arrangements, IFRS 12, Disclosure of
Interests in Associates and Joint Ventures (all effective January 1, 2013) provide guidance on the
accounting treatment and associated disclosure requirements for joint arrangements and associates, and a
revised definition of “control” for identifying entities which are to be consolidated. IAS 27, Separate
Financial Statements and IAS 28, Investments in Associates and Joint Ventures were revised and reissued
to align with the new consolidation guidance.
IFRS 13, Fair Value Measurement (effective January 1, 2013) provides new guidance on fair value
measurement and disclosure requirements.
IAS 19, Employee Benefits (effective January 1, 2013) introduces changes to the accounting for defined
benefit plans and other employee benefits that include modification of the accounting for termination
benefits and classification of other employee benefits.
IFRIC 20, Stripping Costs in the Production Phase of a Mine (effective January 1, 2013 with earlier
application permitted) clarifies the requirements of accounting for the costs of stripping activity in the
production phase when stripping improves the access to further quantities of material that will be mined in
future periods.
Amendments to IAS 32, Financial Instruments (effective for annual periods beginning on or after January
1, 2013) clarifies the application of the offsetting rules and requires additional disclosure on financial
instruments subject to netting arrangements.
The Company is currently assessing the impact that these new accounting standards will have on the consolidated
financial statements.
Detailed disclosures of the effects of transition to IFRS from Canadian GAAP can be found in Note 29.
4. Purchase of mineral properties
Far West Mining Ltd.
On April 15, 2011, Capstone and Far West Mining Ltd. (“Far West”) entered into an agreement to combine by way of
a plan of arrangement, whereby Capstone agreed to purchase all of the outstanding common shares, warrants and
options of Far West (the “Transaction”). The Far West shareholders were entitled to elect to receive, in exchange for
each Far West share held either (i) 1.825 shares of Capstone and C$1.00 in cash, (ii) 2.047 shares of Capstone and
C$0.001 in cash, or (iii) C$9.19 cash, subject to proration on the basis of an aggregate maximum cash amount of
approximately C$79.0 million and provided that no Far West shareholder that elected option (iii) above, would receive
less than C$1.00 in cash per Far West share. On June 17, 2011, Capstone completed its purchase of Far West. Far
West holds the Santo Domingo copper-iron-gold project in Chile as well as active exploration properties in Australia.
The Company is continuing advancement of the Santo Domingo project in Chile towards a production decision.

Capstone Mining Corp. Notes to Consolidated Financial Statements
Years Ended December 31, 2011 and 2010 (expressed in thousands of US dollars, except share amounts)
18
The transaction has been recorded as an asset purchase of mineral properties with the costs of the acquisition allocated
as follows (expressed in thousands, except share amounts):
Purchase price:
Common shares of Capstone issued (128,753,385 shares) 408,575$
Cash consideration 71,770
Options exchanged 19,270
Warrants exchanged 4,048
Transaction costs 5,451
509,114$
Net assets acquired:
Cash 15,512$
Plant and equipment 331
Mineral properties 491,984
Non-current taxes receivable 3,436
Non-cash operating working capital (net) (2,149)
509,114$
As part of the purchase, Capstone issued 12,091,629 options in exchange for 5,907,000 options of Far West, which
equates to an exchange ratio of 2.047 Capstone options for every Far West option exchanged. Those issued by
Capstone were on the same terms and conditions as those exchanged by the Far West holders. As a result of these
exchanges, Capstone recorded the fair value of the vested options of $19.3 million as a cost of the purchase (Note 20).
As part of the purchase, Capstone issued 4,451,221 warrants in exchange for 2,439,025 warrants of Far West which
equates to an exchange ratio of 1.825 Capstone warrants for every Far West warrant exchanged. Those issued by
Capstone were on the same terms and conditions as those exchanged by the Far West holders, except for the exercise
price, which was reduced by C$1.00. As a result of these exchanges, Capstone recorded the fair value of the vested
warrants of $4.0 million as a cost of the purchase (Note 20).
Concurrent with the Company’s purchase of Far West, the Company announced that it had entered into a strategic
partnership with Korea Resources Corporation (“KORES”). Under the terms of the partnership, Capstone sold to
KORES a 30% indirect interest in the Far West net assets for net cash consideration of $194.2 million. As a result of
this partial disposition of its ownership interest in the Far West net assets, Capstone recorded a $44.9 million reduction
to the carrying value of the Far West mineral properties on the date of purchase. This reduction in mineral properties
represented the amount paid by KORES for its 30% interest in excess of a 30% share of the fair value of the Far West
net assets acquired on closing.
KORES (or its affiliate) agreed to arrange for a debt financier to offer to provide financing for 65% of the financing
required to fund capital costs for the purposes of advancing Santo Domingo to commencement of commercial
production as well as fund 30% of the balance of capital requirements based on its equity ownership share. Further,
KORES (or its affiliate) is obligated to purchase, on then prevailing market terms (at the appropriate time), 50% of all
copper concentrate and iron concentrate produced from Santo Domingo over the life of the mine. Lastly, the
Company issued 40,198,632 shares by way of a private placement at C$4.35 per share to a KORES subsidiary for
gross cash proceeds of $178.0 million. As per the agreement, the subscription price of the shares was equal to a 1%
discount to the 5-day volume weighted average price of Capstone for the period ended April 15, 2011.
The partial disposition of Capstone’s ownership interest in the Far West assets to KORES for net cash consideration of
$194.2 million was effected by way of KORES purchasing a 30% equity interest in 0908113 BC Ltd., a subsidiary of
the Company used in connection with the purchase of the Far West net assets. For its 30% interest, KORES paid cash
consideration of $277.4 million, and then Capstone and KORES received loans of cash back (representing their
respective pro rata equity share of the cash balance in 0908113 BC Ltd.) in the form of Canadian denominated non-
interest bearing promissory notes in the amounts of $194.2 million (C$190.9 million) and $82.3 million (C$81.8

Capstone Mining Corp. Notes to Consolidated Financial Statements
Years Ended December 31, 2011 and 2010 (expressed in thousands of US dollars, except share amounts)
19
million) respectively, that are due upon demand. The Capstone note is eliminated on consolidation in these
consolidated financial statements given that it is payable to a subsidiary of the Company.
Under the terms of the shareholders’ agreement between Capstone and KORES, it is acknowledged that cash calls will
be funded to the extent possible, first by way of repayment of the promissory note. In September 2011, KORES
funded a cash call for C$5.3 million, reducing its outstanding balance on the promissory note to C$76.5 million.
Details of changes in the balance of the promissory note are as follows (expressed in thousands):
Payment to fund KORES promissory note 83,213$
Repayment of KORES promissory note (5,454)
Currency translation adjustments (2,572)
Balance, December 31, 2011 75,187$
December 31, 2011 December 31, 2010 January 1, 2010
KORES promissory note 75,187$ -$ -$
Less: current portion (12,667) - -
Long-term portion 62,520$ -$ -$
The current portion of the promissory note represents management’s best estimate of the portion of the note that will
be repaid in 2012.
5. Financial instruments
Overview
The Company’s activities expose it to financial risks of varying degrees of significance which could affect its ability to
achieve its strategic objectives for growth and shareholder returns. The principal financial risks to which the Company
is exposed are commodity price risk, credit risk, foreign exchange risk, liquidity risk, and interest rate risk. The Board
of Directors has overall responsibility for the establishment and oversight of the Company’s risk management
framework and reviews the Company’s policies on an ongoing basis.
Commodity price risk
The Company is exposed to commodity price risk given that its revenues are derived from the sale of metals, the prices
for which have been historically volatile. It manages this risk by entering into forward sale agreements with various
counterparties, both as a condition of certain debt facilities as well as to mitigate price risk when management believes
it a prudent decision. Currently the Company has in place derivative contracts for the sale of copper from its Minto
Mine and for the sale of copper, lead and zinc from its Cozamin Mine. Additionally, it has sold forward to Silver
Wheaton Corp. (“Silver Wheaton”) the gold and silver production from the Minto Mine and silver production from the
Cozamin Mine (Note 17).
Credit risk
The Company is exposed to credit risk through its trade receivables on concentrate sales, which are principally with
three counterparties under the terms of off-take agreements described in Note 26. The Company manages this risk by
requiring provisional payments of 90 percent of the value of the concentrate shipped.
The Company enters into derivative instruments with a small number of counterparties, some of which have resulted
in a derivative asset balance at December 31, 2011. These counterparties are large, well diversified multinational
corporations, and credit risk is considered to be minimal.
To mitigate exposure to credit risk on cash and cash equivalents, the Company has established policies to limit the
concentration of credit risk with any given banking institution where the funds are held, to ensure counterparties
demonstrate minimum acceptable credit worthiness and ensure liquity of available funds.
To mitigate exposure to credit risk on the promissory note, the note has been secured against the counterparty’s 30%

Capstone Mining Corp. Notes to Consolidated Financial Statements
Years Ended December 31, 2011 and 2010 (expressed in thousands of US dollars, except share amounts)
20
interest in a subsidiary of the Company (Note 4).
As at December 31, 2011, the Company’s maximum exposure to credit risk is the carrying value of its cash and cash
equivalents, restricted cash, receivables, promissory note, notes receivable, and derivative assets.
Foreign exchange risk
The Company is exposed to foreign exchange risk as the Company’s operating costs will be primarily in Canadian
dollars and Mexican Pesos, while revenues will be received in US dollars, hence any fluctuation of the US dollar in
relation to these currencies may impact the profitability of the Company and may also affect the value of the
Company’s assets and liabilities. The Company currently does not enter into financial instruments to manage this risk.
As at December 31, 2011, the Company is exposed to foreign exchange risk through the following assets and liabilities
denominated in currencies other than the functional currency of the applicable subsidiary (expressed in thousands):
US dollar Mexican peso
Cash 79,160$ 12,404$
Receivables and other current assets 4,025 1,797
Deposits and other long-term assets 350 1,201
Derivative instrument asset 3,420 -
Total assets 86,955 15,402
Accounts payable and accrued liabilities 822 3,133
Taxes payable - 572
Deferred income tax liabilities - 14,838
Asset retirement obligations - 7,979
Total liabilities 822 26,522
Net assets (liabilities) 86,133$ (11,120)$
Based on the above net exposures at December 31, 2011, a 10% appreciation of the Canadian dollar vis-à-vis the US
dollar would result in a $8.6 million decrease in the Company’s earnings before income taxes. A 10% appreciation of
the Mexican peso vis-à-vis the US dollar would result in a $1.1 million decrease in the Company’s earnings before
income taxes.
Liquidity risk
The Company has in place a planning and budgeting process to help determine the funds required to ensure the
Company has the appropriate liquidity to meet its operating and growth objectives. The Company maintains adequate
cash balances and credit facilities in order to meet short and long term business requirements, after taking into account
cash flows from operations and believes that these sources will be sufficient to cover the likely short and long term
cash requirements. The Company’s cash is invested in business accounts with Canadian Tier 1 Banks with an AA
Rating or better and which is available on demand for the Company’s programs.
As of December 31, 2011, the Company’s liabilities that have contractual maturities are as follows (expressed in
thousands):
Total 2012 2013-2014 2015-2016 After 2016
Accounts payable and
accrued liabilities 18,699$ 18,699$ -$ -$ -$
Long-term debt 4,487 4,487 - - -
Total* 23,186$ 23,186$ -$ -$ -$
* Amounts above do not include payments related to the Company's reclamation and closure cost obligations and other long term provisions
(Note 19 ).

Capstone Mining Corp. Notes to Consolidated Financial Statements
Years Ended December 31, 2011 and 2010 (expressed in thousands of US dollars, except share amounts)
21
Interest rate risk
Currently the Company’s long term liabilities are based on both fixed and variable interest rates. The Company is
exposed to interest rate risk on its variable rate debt facilities, which at December 31, 2011 are undrawn. Variable
interest rates are based on both US dollar and Canadian dollar London Inter-bank Offered Rates (“LIBOR”) plus a
fixed margin. The Company does not enter into derivative contracts to manage this risk.
The Company is also exposed to interest rate risk with respect to the interest it earns on its cash balances.
Financial instruments carrying value and fair value
The Company’s financial instruments consist of cash and cash equivalents, restricted cash, short-term deposits,
receivables, promissory note receivable, investments, notes receivable, accounts payable and accrued liabilities,
advances on concentrate inventories, debt facilities, convertible debentures, and derivative instruments.
The carrying value of receivables, accounts payable and accrued liabilities, and advances on concentrate inventories
approximate their fair values due to their immediate or short-term maturity. Investments that are classified as
available-for-sale are recorded at fair value based on quoted market prices at the reporting date. The fair value of the
Company’s loan facilities are approximated by their carrying values given that the facilities bear interest at variable
rates or, in the case of finance lease obligations, the interest rates have not changed materially.
IFRS 7 establishes a fair value hierarchy that prioritizes the input to valuation techniques used to measure fair value as
follows:
Level 1 – Fair values measured using unadjusted quoted prices in active markets for identical instruments
Level 2 – Fair values measured using directly or indirectly observable inputs, other than those included in Level 1
Level 3 – Fair values measured using inputs that are not based on observable market data
As of December 31, 2011 the Company’s classification of financial instruments within the fair value hierarchy are
summarized below:
Level 1 Level 2 Level 3 Total
Cash and cash equivalents 486,287$ -$ -$ 486,287$
Provisionally priced receivables - 10,978 - 10,978
Investments 237 - - 237
Derivative instrument asset - 3,420 - 3,420
Total Assets 486,524 14,398 - 500,922
Derivative instrument liability - 2,666 - 2,666
Total Liabilities - 2,666 - 2,666
The Company uses valuation models to determine the fair value of its derivative instruments. The inputs to these
models are primarily external observable inputs such as forward prices for metal contracts and the market price of
underlying securities for share purchase warrants.

Capstone Mining Corp. Notes to Consolidated Financial Statements
Years Ended December 31, 2011 and 2010 (expressed in thousands of US dollars, except share amounts)
22
Set out below are the Company’s financial assets by category:
Fair value through
profit or loss Available-for-sale
Loans and
receivables Total
Cash and cash equivalents 486,287$ -$ -$ 486,287$
Receivables 10,978 - 5,462 16,440
Promissory note - - 75,187 75,187
Derivative instrument asset 3,420 - - 3,420
Investments - 237 - 237
500,685$ 237$ 80,649$ 581,571$
Fair value through
profit or loss Available-for-sale
Loans and
receivables Total
Cash and cash equivalents 165,945$ -$ -$ 165,945$
Restricted cash 6,377 - - 6,377
Short-term deposits 20,039 - - 20,039
Receivables 8,957 - 7,937 16,894
Derivative instrument asset 15,237 - - 15,237
Investments - 2,718 - 2,718
216,555$ 2,718$ 7,937$ 227,210$
Fair value through
profit or loss Available-for-sale
Loans and
receivables Total
Cash and cash equivalents 115,931$ -$ -$ 115,931$
Restricted cash 2,496 - - 2,496
Receivables 3,000 - 4,818 7,818
Investments 1,909 37,196 - 39,105
123,336$ 37,196$ 4,818$ 165,350$
December 31, 2011
December 31, 2010
January 1, 2010

Capstone Mining Corp. Notes to Consolidated Financial Statements
Years Ended December 31, 2011 and 2010 (expressed in thousands of US dollars, except share amounts)
23
Set out below are the Company’s financial liabilities by category:
Fair value through
profit or loss
Other financial
liabilities Total
Accounts payable and
accrued liabilities -$ 18,699$ 18,699$
Long-term debt - 4,487 4,487
Derivative instrument liability 2,666 - 2,666
2,666$ 23,186$ 25,852$
Fair value through
profit or loss
Other financial
liabilities Total
Accounts payable and
accrued liabilities -$ 22,277$ 22,277$
Advances on concentrate
inventories - 33,260 33,260
Long-term debt - 11,573 11,573
Derivative instrument liability 51,128 - 51,128
51,128$ 67,110$ 118,238$
Fair value through
profit or loss
Other financial
liabilities Total
Accounts payable and
accrued liabilities -$ 19,782$ 19,782$
Advances on concentrate
inventories - 16,702 16,702
Long-term debt - 20,336 20,336
Derivative instrument liability 55,405 - 55,405
55,405$ 56,820$ 112,225$
December 31, 2011
December 31, 2010
January 1, 2010
6. Short-term deposits
During 2010, the Company invested $20.0 million in a 6-month 5.85% Dual Currency Note (“DCN”) by way of a
private placement with the Bank of Montreal (“BMO”). At maturity on March 1, 2011, the DCN was repaid in US
dollars given that the Bank of Canada USD/CAD foreign exchange rate at the valuation date of February 22, 2011 of
1.0000 USD/CAD had weakened from the strike level of 1.0642 USD/CAD strike level on the date of acquisition.
The principal and interest repaid in US dollars was US$20.6 million.
At December 31, 2010, the DCN was valued in US dollars based on the forward rate of 0.9946 USD/CAD at maturity.

Capstone Mining Corp. Notes to Consolidated Financial Statements
Years Ended December 31, 2011 and 2010 (expressed in thousands of US dollars, except share amounts)
24
7. Receivables
Details are as follows:
December 31, 2011 December 31, 2010 January 1, 2010
Concentrate 10,978$ 8,957$ 2,999$
Taxes 3,446 2,926 3,060
Other 1,812 3,433 62
Current portion of KORES
promissory note (Note 4) 12,667 - -
Current portion of notes
receivable (Note 11) 196 1,076 825
Total receivables 29,099$ 16,392$ 6,946$
8. Inventories
Details are as follows:
December 31, 2011 December 31, 2010 January 1, 2010
Consumable parts and supplies 10,153$ 8,681$ 7,378$
Ore stockpiles 13,784 24,559 14,259
Concentrates 24,395 33,970 22,801
Total inventories 48,332$ 67,210$ 44,438$
During the year ended December 31, 2011, concentrate inventories recognized as cost of sales amounted to $119.5
million (2010 – $105.6 million).
9. Investments
Details are as follows:
December 31, 2011 December 31, 2010 January 1, 2010
Available-for-sale investments 237$ 2,718$ 37,196$
Derivative investments - - 1,909
Total investments 237$ 2,718$ 39,105$
Available-for-sale investments
During the year ended December 31, 2011, the Company disposed of 6,187,796 shares (2010 – 1,654,500) of Northern
Tiger Resources Inc. for total cash proceeds of $3.0 million (2010 – $1.2 million). The cost base of the shares
disposed was $1.5 million (2010 – $0.4 million), resulting in a gain of $1.5 million (2010 – $0.8 million).
During 2010, the Company disposed of its remaining 1,456,106 shares of Silver Wheaton for total cash proceeds of
$29.2 million. The cost base of the shares disposed was $15.2 million, resulting in a gain of $14.0 million.
Capstone Mining Corp. Notes to Consolidated Financial Statements
Years Ended December 31, 2011 and 2010 (expressed in thousands of US dollars, except share amounts)
25
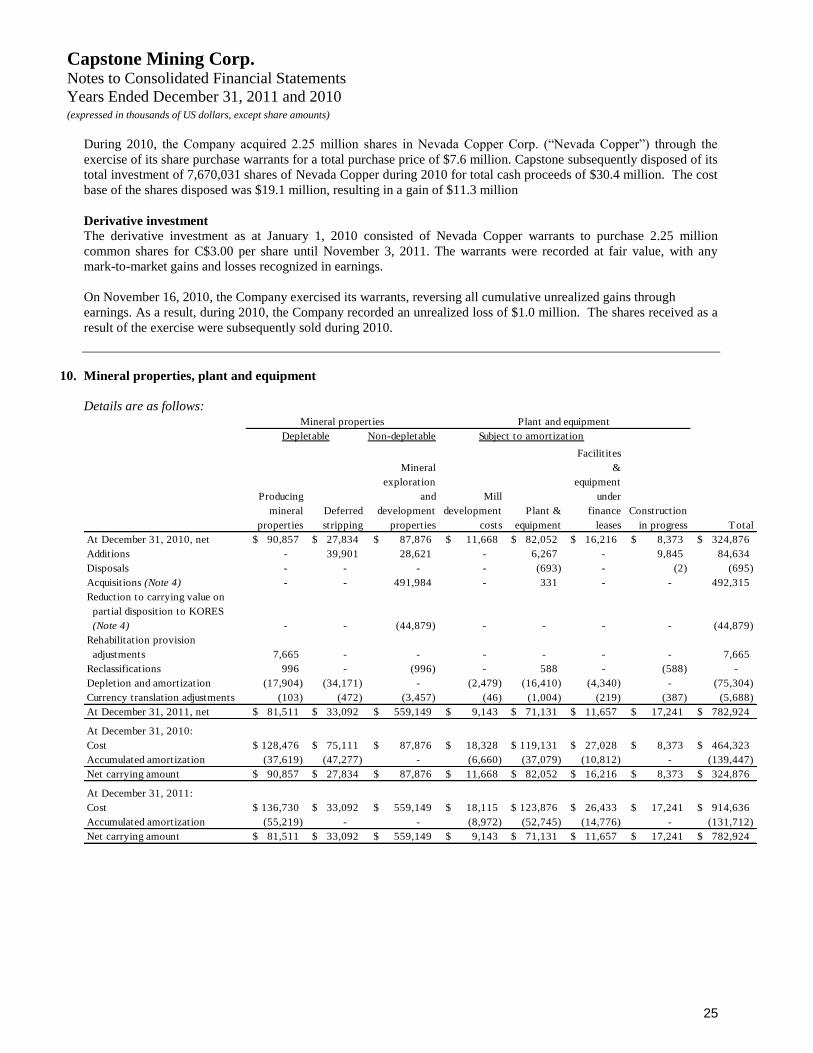
During 2010, the Company acquired 2.25 million shares in Nevada Copper Corp. (“Nevada Copper”) through the
exercise of its share purchase warrants for a total purchase price of $7.6 million. Capstone subsequently disposed of its
total investment of 7,670,031 shares of Nevada Copper during 2010 for total cash proceeds of $30.4 million. The cost
base of the shares disposed was $19.1 million, resulting in a gain of $11.3 million
Derivative investment
The derivative investment as at January 1, 2010 consisted of Nevada Copper warrants to purchase 2.25 million
common shares for C$3.00 per share until November 3, 2011. The warrants were recorded at fair value, with any
mark-to-market gains and losses recognized in earnings.
On November 16, 2010, the Company exercised its warrants, reversing all cumulative unrealized gains through
earnings. As a result, during 2010, the Company recorded an unrealized loss of $1.0 million. The shares received as a
result of the exercise were subsequently sold during 2010.
10. Mineral properties, plant and equipment
Details are as follows:
Non-depletable
Producing
mineral
properties
Deferred
stripping
Mineral
exploration
and
development
properties
Mill
development
costs
Plant &
equipment
Facilitites
&
equipment
under
finance
leases
Construction
in progress Total
At December 31, 2010, net 90,857$ 27,834$ 87,876$ 11,668$ 82,052$ 16,216$ 8,373$ 324,876$
Additions - 39,901 28,621 - 6,267 - 9,845 84,634
Disposals - - - - (693) - (2) (695)
Acquisitions (Note 4) - - 491,984 - 331 - - 492,315
Reduction to carrying value on
partial disposition to KORES
(Note 4) - - (44,879) - - - - (44,879)
Rehabilitation provision
adjustments 7,665 - - - - - - 7,665
Reclassifications 996 - (996) - 588 - (588) -
Depletion and amortization (17,904) (34,171) - (2,479) (16,410) (4,340) - (75,304)
Currency translation adjustments (103) (472) (3,457) (46) (1,004) (219) (387) (5,688)
At December 31, 2011, net 81,511$ 33,092$ 559,149$ 9,143$ 71,131$ 11,657$ 17,241$ 782,924$
At December 31, 2010:
Cost 128,476$ 75,111$ 87,876$ 18,328$ 119,131$ 27,028$ 8,373$ 464,323$
Accumulated amortization (37,619) (47,277) - (6,660) (37,079) (10,812) - (139,447)
Net carrying amount 90,857$ 27,834$ 87,876$ 11,668$ 82,052$ 16,216$ 8,373$ 324,876$
At December 31, 2011:
Cost 136,730$ 33,092$ 559,149$ 18,115$ 123,876$ 26,433$ 17,241$ 914,636$
Accumulated amortization (55,219) - - (8,972) (52,745) (14,776) - (131,712)
Net carrying amount 81,511$ 33,092$ 559,149$ 9,143$ 71,131$ 11,657$ 17,241$ 782,924$
Mineral properties
Depletable
Plant and equipment
Subject to amortization

Capstone Mining Corp. Notes to Consolidated Financial Statements
Years Ended December 31, 2011 and 2010 (expressed in thousands of US dollars, except share amounts)
26
Non-depletable
Producing
mineral
properties
Deferred
stripping
Mineral
exploration
and
development
properties
Mill
development
costs
Plant &
equipment
Facilitites
&
equipment
under
finance
leases
Construction
in progress Total
At January 1, 2010, net 101,470$ 25,000$ 70,875$ 14,353$ 75,717$ 19,464$ 9,991$ 316,870$
Additions (879) 25,796 16,078 - 4,244 2 9,373 54,614
Disposals - - - - (542) - (109) (651)
Rehabilitation provision
adjustments 2,371 - - - - - - 2,371
Reclassifications 3,236 - (3,236) (586) 12,033 - (11,447) -
Depletion and amortization (15,996) (24,389) - (2,380) (12,761) (4,206) - (59,732)
Currency translation adjustments 655 1,427 4,159 281 3,361 956 565 11,404
At December 31, 2010, net 90,857$ 27,834$ 87,876$ 11,668$ 82,052$ 16,216$ 8,373$ 324,876$
At January 1, 2010:
Cost 122,806$ 45,820$ 70,875$ 18,395$ 98,604$ 25,575$ 9,991$ 392,066$
Accumulated amortization (21,336) (20,820) - (4,042) (22,887) (6,111) - (75,196)
Net carrying amount 101,470$ 25,000$ 70,875$ 14,353$ 75,717$ 19,464$ 9,991$ 316,870$
At December 31, 2010:
Cost 128,476$ 75,111$ 87,876$ 18,328$ 119,131$ 27,028$ 8,373$ 464,323$
Accumulated amortization (37,619) (47,277) - (6,660) (37,079) (10,812) - (139,447)
Net carrying amount 90,857$ 27,834$ 87,876$ 11,668$ 82,052$ 16,216$ 8,373$ 324,876$
Mineral properties Plant and equipment
Subject to amortizationDepletable
Fully amortized deferred stripping costs of $81.5 million related to the Minto main pit was removed from the mineral
property continuity during 2011.
At December 31, 2011, construction in progress relates to capital costs incurred in connection with sustaining capital
at the Minto Mine and Cozamin Mine sites.
As at December 31, 2011, bank borrowings are secured on mineral properties, plant and equipment with a net book
value of $330.0 million (December 31, 2010 – $324.9 million).
11. Notes receivable
Capstone Gold is the owner of notes receivable in respect of agreements with various contractors at the mine. Under
the terms of the agreements, the contractors have agreed to purchase certain mining equipment through monthly
payments over a three year period, such payments inclusive of interest at 8% per annum.
Details are as follows:
December 31, 2011 December 31, 2010 January 1, 2010
Total notes receivable 204$ 1,578$ 1,697$
Less: current portion (196) (1,076) (825)
Long-term portion 8$ 502$ 872$
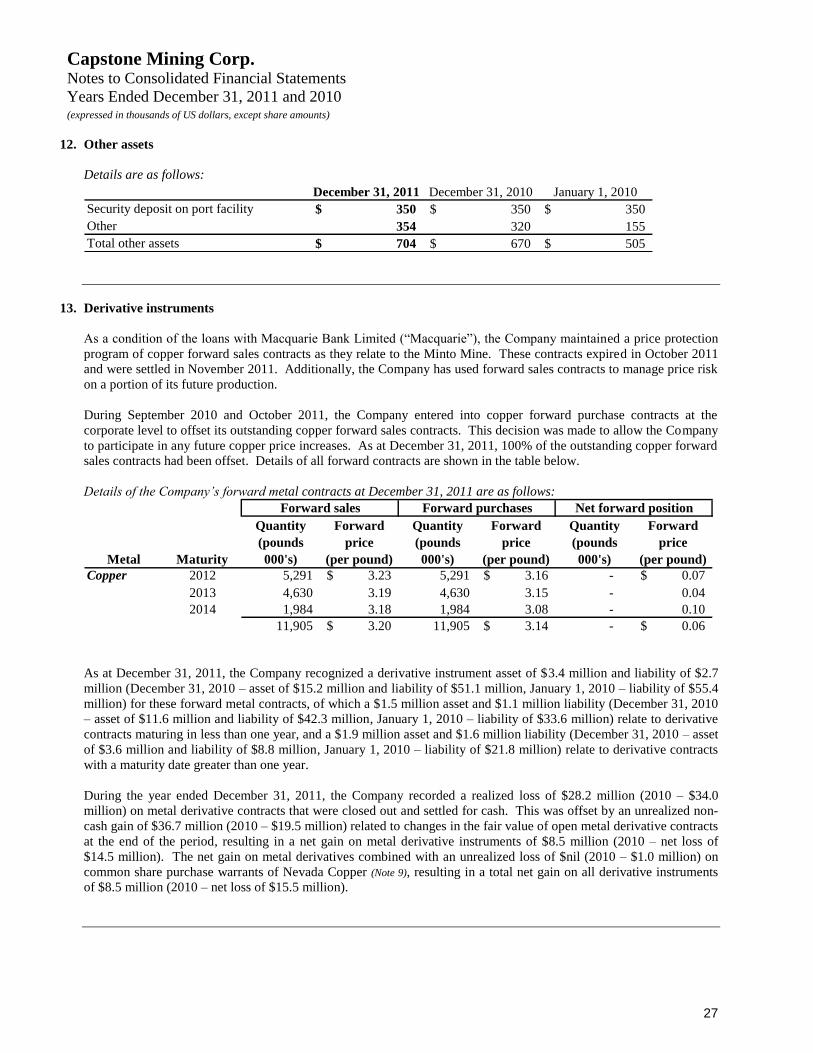
Capstone Mining Corp. Notes to Consolidated Financial Statements
Years Ended December 31, 2011 and 2010 (expressed in thousands of US dollars, except share amounts)
27
12. Other assets
Details are as follows:
December 31, 2011 December 31, 2010 January 1, 2010
Security deposit on port facility 350$ 350$ 350$
Other 354 320 155
Total other assets 704$ 670$ 505$
13. Derivative instruments
As a condition of the loans with Macquarie Bank Limited (“Macquarie”), the Company maintained a price protection
program of copper forward sales contracts as they relate to the Minto Mine. These contracts expired in October 2011
and were settled in November 2011. Additionally, the Company has used forward sales contracts to manage price risk
on a portion of its future production.
During September 2010 and October 2011, the Company entered into copper forward purchase contracts at the
corporate level to offset its outstanding copper forward sales contracts. This decision was made to allow the Company
to participate in any future copper price increases. As at December 31, 2011, 100% of the outstanding copper forward
sales contracts had been offset. Details of all forward contracts are shown in the table below.
Details of the Company’s forward metal contracts at December 31, 2011 are as follows:
Metal Maturity
Quantity
(pounds
000's)
Forward
price
(per pound)
Quantity
(pounds
000's)
Forward
price
(per pound)
Quantity
(pounds
000's)
Forward
price
(per pound)
Copper 2012 5,291 3.23$ 5,291 3.16$ - 0.07$
2013 4,630 3.19 4,630 3.15 - 0.04
2014 1,984 3.18 1,984 3.08 - 0.10
11,905 3.20$ 11,905 3.14$ - 0.06$
Forward sales Forward purchases Net forward position
As at December 31, 2011, the Company recognized a derivative instrument asset of $3.4 million and liability of $2.7
million (December 31, 2010 – asset of $15.2 million and liability of $51.1 million, January 1, 2010 – liability of $55.4
million) for these forward metal contracts, of which a $1.5 million asset and $1.1 million liability (December 31, 2010
– asset of $11.6 million and liability of $42.3 million, January 1, 2010 – liability of $33.6 million) relate to derivative
contracts maturing in less than one year, and a $1.9 million asset and $1.6 million liability (December 31, 2010 – asset
of $3.6 million and liability of $8.8 million, January 1, 2010 – liability of $21.8 million) relate to derivative contracts
with a maturity date greater than one year.
During the year ended December 31, 2011, the Company recorded a realized loss of $28.2 million (2010 – $34.0
million) on metal derivative contracts that were closed out and settled for cash. This was offset by an unrealized non-
cash gain of $36.7 million (2010 – $19.5 million) related to changes in the fair value of open metal derivative contracts
at the end of the period, resulting in a net gain on metal derivative instruments of $8.5 million (2010 – net loss of
$14.5 million). The net gain on metal derivatives combined with an unrealized loss of $nil (2010 – $1.0 million) on
common share purchase warrants of Nevada Copper (Note 9), resulting in a total net gain on all derivative instruments
of $8.5 million (2010 – net loss of $15.5 million).

Capstone Mining Corp. Notes to Consolidated Financial Statements
Years Ended December 31, 2011 and 2010 (expressed in thousands of US dollars, except share amounts)
28
14. Current portion of financial liabilities
Details are as follows:
December 31, 2011 December 31, 2010 January 1, 2010
Current portion of:
Long term debt (Note 15) 4,487$ -$ 9,515$
Finanace lease obligations (Note 16) - 229 2,201
Derivative instrument liability (Note 13) 1,123 42,316 33,648
Other provisions 6,714 5,571 2,635
Total current portion of other liabilities 12,324$ 48,116$ 47,999$
15. Long term debt
Details are as follows:
December 31, 2011 December 31, 2010 January 1, 2010
Yukon Energy Corporation -$ 7,239$ 6,851$
Convertible debentures 4,487 4,334 3,970
Macquarie Bank Limited - - 9,515
Total long-term debt 4,487 11,573 20,336
Less: current portion (4,487) - (9,515)
Long-term portion -$ 11,573$ 10,821$
Macquarie Bank Limited loan facilities
In October 2006, Minto received credit approval from Macquarie for a debt package comprised of a $57.8 million
Project Loan Facility (“PLF”) and a C$20.0 million subordinated loan facility (“SLF”). The final repayment of the
PLF occurred on December 31, 2009 and the final repayment of the SLF occurred on December 31, 2010.
The PLF and SLF were secured against the Minto Mine and Kutcho project, with the Company pledging its shares in
Minto and Kutcho Copper as security for the loans. As at December 31, 2011, the PLF and SLF security was in the
process of being removed following the extinguishment of the associated price protection program of copper forward
metal sales (Note 13).
Bank of Nova Scotia loan facility
On January 16, 2009, Capstone completed a $40.0 million corporate revolving term credit facility with The Bank of
Nova Scotia (the "RTF"). Under the terms of the RTF, the funds are re-drawable over a three year term, subject to a
reduction of $8.0 million every six months commencing on the first anniversary, and it attracts an interest rate of US
LIBOR plus 3.5% (adjustable in certain circumstances). At December 31, 2011, the available credit under the RTF
was $16.0 million, of which C$15.0 million was used to support a Letter of Credit in favour of the Yukon Territory
Government for the Company’s reclamation obligations at the Minto Mine.
During 2011, the RTF was amended to cancel the July 2011 planned $8.0 million reduction, fixing the amount
drawable at $16.0 million until the end of the term. Also during 2011, the RTF was further amended to extend the
term to March 31, 2012.
The RTF is secured against the present and future real and personal property, assets and undertakings of Capstone
other than the security already pledged against the PLF, SLF and the Power Purchase Agreement (“PPA”) with Yukon

Capstone Mining Corp. Notes to Consolidated Financial Statements
Years Ended December 31, 2011 and 2010 (expressed in thousands of US dollars, except share amounts)
29
Energy Corporation (“YEC”). The lender requires certain ratios related to debt and interest coverage. Failure to meet
these covenants could result in repayment and termination of the RTF.
Yukon Energy Corporation capital cost contribution
In February 2007, Minto executed the PPA with YEC. Under the terms of the agreement, Minto agreed to make
payments representing its capital cost contribution on the Carmacks-Minto Landing portion of the main power line.
These payments carried an interest rate of 6.5% on a stated principal of C$7.2 million. As per the repayment schedule,
the monthly payments during the first 48 months represented interest only on the principal, followed by equal blended
payments of interest and principal during the ensuing 60 months such that the principal was to be fully repaid at the
end of nine years. Minto’s connection to the YEC’s electrical grid in November 2008 triggered the first of the
monthly payments commencing December 2008.
In addition, the Company classified its obligation for the C$10.8 million cost of the spur power line to the Minto Mine
site as a finance lease (Note 16). This amount will be repaid over the same terms as the main power line.
The PPA is secured against a charge over all assets of Minto, subject only to the security already pledged against the
PLF and SLF.
On January 17, 2011, Minto repaid in full its spur line finance lease and main line capital cost contribution to YEC for
a total payment of $17.5 million.
Convertible debentures
In February 2007, Sherwood Copper Corporation (“Sherwood”), a predecessor company to Capstone, issued
convertible senior unsecured debentures (the “Debentures”) for gross proceeds of C$43.6 million. The Debentures,
due March 31, 2012, bear interest at a rate of 5.0% per annum payable semi-annually in arrears on March 31 and
September 30 of each year commencing on September 30, 2007. Each Debenture is convertible at the option of the
holder at any time into common shares of the Company at a conversion rate of 248.5715 common shares per C$1,000
principal amount of Debentures, which is equal to a Conversion Price of C$4.02 per common share. The Company
may redeem the Debentures on or after April 1, 2010 at a redemption price equal to their principal amount, provided
that the weighted average trading price of the common shares of the Company for 20 consecutive days is at least 125%
of the Conversion Price. The Company may repay the principal amount in common shares at the then market price or
cash.
IFRS for compound financial instruments require the Company to allocate the proceeds received from the Debentures
between; (i) the estimated fair value of the holder’s option to convert the Debentures into common shares and (ii) the
estimated fair value of the future cash outflows related to the Debentures. At the date of issuance, the Company
estimated the fair value of the conversion option by deducting the present value of the future cash outflows of the
Debentures, calculated using a risk-adjusted discount rate of 11.5%, from the face value of the principal of the
Debentures. An amount equivalent to the residual value allocated to the conversion option is added to the face value
of the Debentures over the life of the debentures by a charge to earnings, using the effective interest rate method.
The Debentures include a provision whereby within 30 days of the occurrence of a change of control, an offer to
purchase all Debentures then outstanding must be made. Following the change of control on November 24, 2008 as a
result of the reverse takeover transaction with Sherwood, the Company made an offer on December 24, 2008 to
purchase all outstanding Debentures at a price equal to the 101% of the principal amount of the Debentures, plus
accrued and unpaid interest. On January 22, 2009, the Company paid $31.3 million (C$39.3 million) for Debentures
tendered under the offer with an aggregate book value at the date of redemption of $33.4 million (C$41.3 million),
consisting of the debt component of $26.1 million (C$32.7 million) and the equity component of $7.3 million (C$8.6
million). As a result, the Company recognized a gain during 2009 on settlement of the debt component of $0.6 million
and a gain on the settlement of the equity component of $1.1 million.
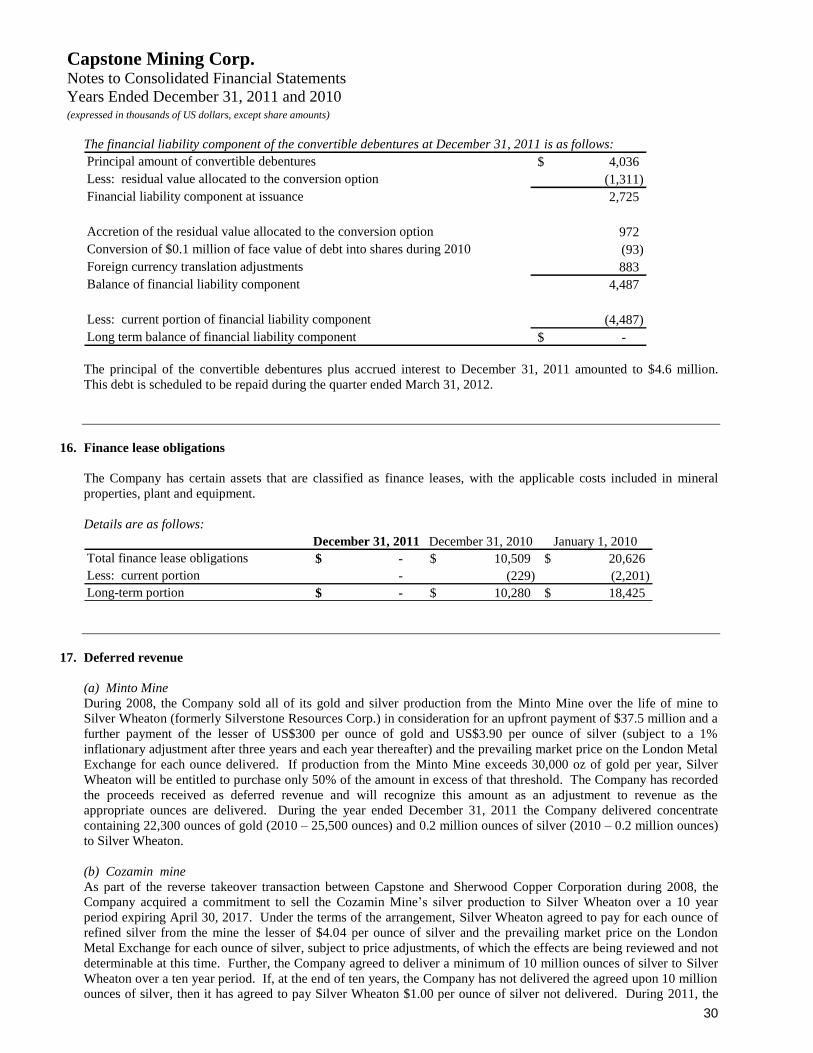
Capstone Mining Corp. Notes to Consolidated Financial Statements
Years Ended December 31, 2011 and 2010 (expressed in thousands of US dollars, except share amounts)
30
The financial liability component of the convertible debentures at December 31, 2011 is as follows:
Principal amount of convertible debentures 4,036$
Less: residual value allocated to the conversion option (1,311)
Financial liability component at issuance 2,725
Accretion of the residual value allocated to the conversion option 972
Conversion of $0.1 million of face value of debt into shares during 2010 (93)
Foreign currency translation adjustments 883
Balance of financial liability component 4,487
Less: current portion of financial liability component (4,487)
Long term balance of financial liability component -$
The principal of the convertible debentures plus accrued interest to December 31, 2011 amounted to $4.6 million.
This debt is scheduled to be repaid during the quarter ended March 31, 2012.
16. Finance lease obligations
The Company has certain assets that are classified as finance leases, with the applicable costs included in mineral
properties, plant and equipment.
Details are as follows:
December 31, 2011 December 31, 2010 January 1, 2010
Total finance lease obligations -$ 10,509$ 20,626$
Less: current portion - (229) (2,201)
Long-term portion -$ 10,280$ 18,425$
17. Deferred revenue
(a) Minto Mine
During 2008, the Company sold all of its gold and silver production from the Minto Mine over the life of mine to
Silver Wheaton (formerly Silverstone Resources Corp.) in consideration for an upfront payment of $37.5 million and a
further payment of the lesser of US$300 per ounce of gold and US$3.90 per ounce of silver (subject to a 1%
inflationary adjustment after three years and each year thereafter) and the prevailing market price on the London Metal
Exchange for each ounce delivered. If production from the Minto Mine exceeds 30,000 oz of gold per year, Silver
Wheaton will be entitled to purchase only 50% of the amount in excess of that threshold. The Company has recorded
the proceeds received as deferred revenue and will recognize this amount as an adjustment to revenue as the
appropriate ounces are delivered. During the year ended December 31, 2011 the Company delivered concentrate
containing 22,300 ounces of gold (2010 – 25,500 ounces) and 0.2 million ounces of silver (2010 – 0.2 million ounces)
to Silver Wheaton.
(b) Cozamin mine
As part of the reverse takeover transaction between Capstone and Sherwood Copper Corporation during 2008, the
Company acquired a commitment to sell the Cozamin Mine’s silver production to Silver Wheaton over a 10 year
period expiring April 30, 2017. Under the terms of the arrangement, Silver Wheaton agreed to pay for each ounce of
refined silver from the mine the lesser of $4.04 per ounce of silver and the prevailing market price on the London
Metal Exchange for each ounce of silver, subject to price adjustments, of which the effects are being reviewed and not
determinable at this time. Further, the Company agreed to deliver a minimum of 10 million ounces of silver to Silver
Wheaton over a ten year period. If, at the end of ten years, the Company has not delivered the agreed upon 10 million
ounces of silver, then it has agreed to pay Silver Wheaton $1.00 per ounce of silver not delivered. During 2011, the

Capstone Mining Corp. Notes to Consolidated Financial Statements
Years Ended December 31, 2011 and 2010 (expressed in thousands of US dollars, except share amounts)
31
Company delivered concentrate containing 1.4 million ounces of silver (2010 – 1.4 million ounces) to Silver Wheaton.
To December 31, 2011, a total of 5.9 million ounces have been delivered against the contract since its inception. The
Company has recorded this commitment (which represents an obligation to deliver silver at other than market rates) at
its estimated fair value on the date of acquisition of the Cozamin Mine. The value assigned to the commitment will be
recorded as an adjustment to revenue as the related ounces are delivered.
Details of changes in the balance of deferred revenue are as follows (expressed in thousands):
Balance, December 31, 2010 60,677$
Recognized as revenue on delivery of gold and silver (13,711)
Currency translation adjustments (399)
Balance, December 31, 2011 46,567$
Balance, January 1, 2010 73,465$
Recognized as revenue on delivery of gold and silver (14,410)
Currency translation adjustments 1,622
Balance, December 31, 2010 60,677$
18. Income taxes
Details of the income tax expense are as follows (expressed in thousands):
Canada Mexico Chile Total
Current income and mining tax expense (1,894)$ (21,970)$ -$ (23,864)$
Deferred income tax expense (14,033) (1,016) (639) (15,688)
Income tax expense (15,927)$ (22,986)$ (639)$ (39,552)$
Canada Mexico Chile Total
Current income and mining tax expense (7,648)$ (18,059)$ -$ (25,707)$
Deferred income tax (expense) recovery (14,530) 4,689 - (9,841)
Income tax expense (22,178)$ (13,370)$ -$ (35,548)$
December 31, 2011
December 31, 2010
Income tax expense differs from the amount that would result from applying the Canadian federal and provincial
income tax rates to earnings before income taxes. These differences result from the following items (expressed in
thousands):
December 31, 2011 December 31, 2010
Earnings (loss) before income items 99,978$ 110,100$
Canadian federal and provincial income tax rates 31.50% 33.00%
Income tax expense based on the above rates 31,493 36,333
Increase (decrease) due to:
Non-deductible stock based compensation & other 2,655 62
Difference between Canadian and foreign tax rates (662) (1,708)
Yukon mining taxes 4,434 5,198
Non-taxable portion of capital gains (385) (3,674)
Foreign exchange and other translation adjustments 2,147 48
Amounts over provided in prior years (130) (711)
Income tax expense 39,552$ 35,548$

Capstone Mining Corp. Notes to Consolidated Financial Statements
Years Ended December 31, 2011 and 2010 (expressed in thousands of US dollars, except share amounts)
32
The Canadian income tax rate declined during the year due to changes in the law that reduced corporate income tax
rates in Canada.
Continuity of the changes in the Company’s net deferred tax position is as follows (expressed in thousands):
2011 2010
Net deferred tax liability, January 1 25,759$ 16,747$
Deferred income tax expense during the year 15,688 9,841
Deferred income tax charged against share capital (365) -
Deferred income tax charged against comprehensive income (197) (1,529)
Changes to foreign currency translation (435) 700
Net deferred tax liability, December 31 40,450$ 25,759$
The composition of the deferred tax assets and liabilities are as follows (expressed in thousands):
December 31, 2011 December 31, 2010 January 1, 2010
Deferred income tax assets
Non-capital losses 4,549$ 2,059$ 1,830$
Share issue costs and other 3,527 5,905 6,630
Receivable and current items 1,040 898 389
Derivative instruments 1,741 17,325 19,247
Investments 38 - 15
Mineral properties, plant and equipment 16 501 1,940
Finance leases and long term-debt - 5,591 -
Asset retirement obligations 5,938 3,842 2,901
Deferred income tax assets 16,849 36,121 32,952
Deferred income tax liabilities
Inventory 8,484 15,864 7,486
Derivative instruments 854 3,983 -
Investments - 287 3,431
Mineral properties, plant and equipment 47,961 41,706 38,621
Long-term debt - 40 161
Deferred income tax liabilities 57,299 61,880 49,699
Net deferred income tax liability 40,450$ 25,759$ 16,747$
Breakdown of net deferred income tax liability
Asset (1,022)$ (5,526)$ (15,340)$
Liability 41,472 31,285 32,087
40,450$ 25,759$ 16,747$

Capstone Mining Corp. Notes to Consolidated Financial Statements
Years Ended December 31, 2011 and 2010 (expressed in thousands of US dollars, except share amounts)
33
The composition of the deferred tax expense (recovery) is as follows (expressed in thousands):
December 31, 2011 December 31, 2010
Deferred income tax assets
Non-capital losses (1,781)$ (344)$
Share issue costs and other 2,743 465
Accounts receivable and current items (142) (509)
Derivative instruments 16,016 896
Investments (38) 15
Mineral property, plant and equipment 484 1,317
Finance leases and long term-debt 5,591 (5,591)
Asset retirement obligations (2,096) (1,070)
Deferred income tax liabilities
Inventory (7,378) 8,756
Derivative instruments (3,128) 3,983
Investments (90) (1,401)
Mineral property, plant and equipment 5,547 3,435
Long-term debt (40) (111)
Deferred tax expense 15,688$ 9,841$
As at December 31, 2011, the Company had tax losses with a tax benefit of $0.2 million (2010 – $0.9 million) that are
not recognized as deferred tax assets. The Company recognizes the benefit of tax losses only to the extent that it
anticipates future taxable income that can be reduced by the tax losses. The gross amount of the tax losses for which a
tax benefit has not been recorded expire in 2012 and 2031.
As at December 31, 2011, the Company has deductible temporary differences with a tax benefit of $0.1 million (2010
– $nil) that are not recognized as deferred tax assets. It is not probable that future taxable income will be available
against which the Company can utilize these benefits. These benefits expire between 2032 and 2034.
As at December 31, 2011, the Company had tax credits of $10.5 million (2010 – $9.2 million) that have not been
recognized and expire between 2023 and 2030.
As at December 31, 2011, the Company has not recognized deferred taxes on retained earnings of approximately $35.0
million of foreign subsidiaries, as it is the Company’s intention to invest these earnings to maintain and expand the
business of these subsidiaries.

Capstone Mining Corp. Notes to Consolidated Financial Statements
Years Ended December 31, 2011 and 2010 (expressed in thousands of US dollars, except share amounts)
34
19. Reclamation and closure cost obligations and other provisions
The reclamation and closure cost obligations relate to the operations of the Minto and Cozamin Mines, as well as the
Kutcho development project.
Details of changes in the balances are as follows (expressed in thousands):
Reclamation and
closure cost
obligations
Other
long term
provisions Total
Balance, December 31, 2010 13,054$ 1,477$ 14,531$
Change in estimates 7,576 74 7,650
Interest expense from discounting obligations 350 - 350
Payments during the period (114) - (114)
Currency translation adjustments (622) (202) (824)
Balance, December 31, 2011 20,244$ 1,349$ 21,593$
Balance, January 1, 2010 9,873$ 599$ 10,472$
Change in estimates 2,382 840 3,222
Interest expense from discounting obligations 315 - 315
Payments during the period (125) - (125)
Currency translation adjustments 609 38 647
Balance, December 31, 2010 13,054$ 1,477$ 14,531$
A reclamation and closure cost obligation has been recognized in respect of the mining operations of the Minto Mine,
including associated infrastructure and buildings. The estimated undiscounted cash flows required to satisfy the Minto
reclamation and closure cost obligation as at December 31, 2011 were C$13.8 million, which were adjusted for
inflation and uncertainty of the cash flows and then discounted using current market-based pre-tax discount rate of
2.5%. The resulting reclamation and closure cost obligation for the Minto Mine at December 31, 2011 totalled $13.6
million, of which $15.0 million is secured by a letter of credit from the Bank of Nova Scotia in favour of the
Government of Yukon.
A reclamation and closure cost obligation has been recognized in respect of the mining operations of the Cozamin
Mine, including associated infrastructure and buildings. The estimated undiscounted cash flows required to satisfy the
Cozamin reclamation and closure cost obligation as at December 31, 2011 were $77.3 Mexican pesos, which were
adjusted for inflation and uncertainty of the cash flows and then discounted using current market-based pre-tax
discount rate of 1.5%. The resulting reclamation and closure cost obligation for Cozamin at December 31, 2011
totalled $6.6 million, with an additional $1.3 million of other mine closure costs related to severance.
A reclamation and closure cost has been recognized in respect of the exploration and development activities of the
Kutcho project in Canada. The Company has recognized C$50,000 for future site restoration costs. The reclamation
costs were determined based on the known disturbance to date.
In view of uncertainties concerning reclamation and closure cost obligations, the ultimate costs could be materially
different from the amounts estimated. The estimate of future reclamation and closure cost obligations is subject to
change based on amendments to applicable laws and legislation. Futures changes in reclamation and closure cost
obligations, if any, could have a significant impact.

Capstone Mining Corp. Notes to Consolidated Financial Statements
Years Ended December 31, 2011 and 2010 (expressed in thousands of US dollars, except share amounts)
35
20. Share capital
Authorized
An unlimited number of common voting shares without par value.
Share issuances
In June 2011, the Company issued a total of 128,753,385 common shares for the purchase of Far West net assets (Note
4). The shares were issued at a fair value of C$3.12 per share on closing for total consideration of $408.6 million.
In June 2011, the Company completed a private placement equity financing with KORES (Note 4) for the purchase of
40,198,632 common shares of the Company at a price of C$4.35 for gross proceeds of $178.0 million. As per the
agreement with KORES, the subscription price of the shares was equal to a 1% discount to the 5-day volume weighted
average price of Capstone for the period ended April 15, 2011.
During 2011, a total of 5,647,392 (2010 – 3,560,753) common shares of the Company were issued upon the exercise
of options at prices between C$0.67 and C$4.35 per option for total cash proceeds of $10.4 million (2010 – $6.3
million). As a result of these exercises, $7.7 million (2010 – $2.7 million) was transferred from reserve for equity
settled share based transactions to share capital.
During 2011, a total of 80,000 (2010 – 123,390) common shares of the Company were issued for compensation at
C$3.25 per share for total deemed consideration of $0.3 million (2010 – $0.3 million).
During 2011, a total of 100,000 (2010 – 100,000) common shares of the Company previously reserved for issuance
were issued for mineral property interests. As a result of this issuance, $0.3 million (2010 – $0.3 million) of fair value
was transferred from reserve for equity settled share based transactions to share capital.
Stock options
Pursuant to the Company’s stock option plan, directors may, from time to time, authorize the granting of options to
directors, officers, employees and consultants of the Company to a maximum of 10% of the issued and outstanding
common shares at the time of grant, with a maximum of 5% of the Company’s issued and outstanding shares reserved
for any one person on a yearly basis. Options granted under the plan have a term not to exceed 5 years and vesting
periods that range from zero to 2 years.
The continuity of stock options issued and outstanding is as follows:
Options outstanding
Weighted average
exercise price
(C$)
Outstanding, January 1, 2010 11,797,008 2.25$
Granted 4,600,000 2.91
Exercised (3,560,753) 1.81
Expired (796,400) 3.20
Forfeited (610,122) 2.80
Outstanding, December 31, 2010 11,429,733 2.56
Granted 5,170,000 4.16
Exchanged for options of Far West (Note 4) 12,091,629 1.92
Exercised (5,647,392) 1.83
Expired (469,870) 3.39
Forfeited (498,345) 3.72
Outstanding, December 31, 2011 22,075,755 2.72$
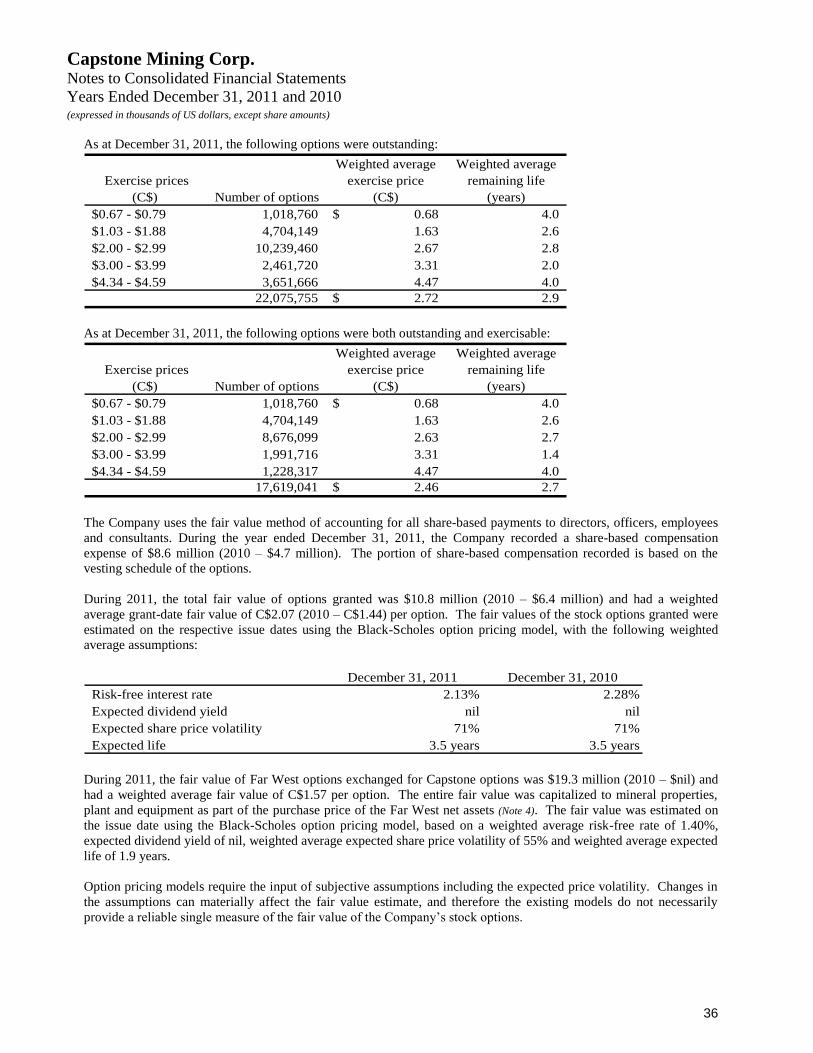
Capstone Mining Corp. Notes to Consolidated Financial Statements
Years Ended December 31, 2011 and 2010 (expressed in thousands of US dollars, except share amounts)
36
As at December 31, 2011, the following options were outstanding:
Exercise prices
(C$) Number of options
Weighted average
exercise price
(C$)
Weighted average
remaining life
(years)
$0.67 - $0.79 1,018,760 0.68$ 4.0
$1.03 - $1.88 4,704,149 1.63 2.6
$2.00 - $2.99 10,239,460 2.67 2.8
$3.00 - $3.99 2,461,720 3.31 2.0
$4.34 - $4.59 3,651,666 4.47 4.0
22,075,755 2.72$ 2.9
As at December 31, 2011, the following options were both outstanding and exercisable:
Exercise prices
(C$) Number of options
Weighted average
exercise price
(C$)
Weighted average
remaining life
(years)
$0.67 - $0.79 1,018,760 0.68$ 4.0
$1.03 - $1.88 4,704,149 1.63 2.6
$2.00 - $2.99 8,676,099 2.63 2.7
$3.00 - $3.99 1,991,716 3.31 1.4
$4.34 - $4.59 1,228,317 4.47 4.0
17,619,041 2.46$ 2.7
The Company uses the fair value method of accounting for all share-based payments to directors, officers, employees
and consultants. During the year ended December 31, 2011, the Company recorded a share-based compensation
expense of $8.6 million (2010 – $4.7 million). The portion of share-based compensation recorded is based on the
vesting schedule of the options.
During 2011, the total fair value of options granted was $10.8 million (2010 – $6.4 million) and had a weighted
average grant-date fair value of C$2.07 (2010 – C$1.44) per option. The fair values of the stock options granted were
estimated on the respective issue dates using the Black-Scholes option pricing model, with the following weighted
average assumptions:
December 31, 2011 December 31, 2010
Risk-free interest rate 2.13% 2.28%
Expected dividend yield nil nil
Expected share price volatility 71% 71%
Expected life 3.5 years 3.5 years
During 2011, the fair value of Far West options exchanged for Capstone options was $19.3 million (2010 – $nil) and
had a weighted average fair value of C$1.57 per option. The entire fair value was capitalized to mineral properties,
plant and equipment as part of the purchase price of the Far West net assets (Note 4). The fair value was estimated on
the issue date using the Black-Scholes option pricing model, based on a weighted average risk-free rate of 1.40%,
expected dividend yield of nil, weighted average expected share price volatility of 55% and weighted average expected
life of 1.9 years.
Option pricing models require the input of subjective assumptions including the expected price volatility. Changes in
the assumptions can materially affect the fair value estimate, and therefore the existing models do not necessarily
provide a reliable single measure of the fair value of the Company’s stock options.

Capstone Mining Corp. Notes to Consolidated Financial Statements
Years Ended December 31, 2011 and 2010 (expressed in thousands of US dollars, except share amounts)
37
Share purchase warrants
The continuity of share purchase warrants issued and outstanding is as follows:
Warrants
outstanding
Weighted average
exercise price
(C$)
Outstanding, January 1, 2010 1,182,964 3.35$
Expired (1,182,964) 3.35
Outstanding, December 31, 2010 - -
Exchanged for warrants of Far West (Note 4) 4,451,221 2.66
Outstanding, December 31, 2011 4,451,221 2.66$
During 2011, the fair value of Far West warrants exchanged for Capstone warrants was $4.0 million (2010 – $nil).
The warrants had a fair value of C$0.89 per warrant and they expire on October 15, 2012. The entire fair value was
capitalized to mineral properties, plant and equipment as part of the purchase price of the Far West net assets (Note 4).
The fair value was estimated on the issue date using the Black-Scholes option pricing model, based on an risk-free rate
of 1.25%, expected dividend yield of nil, expected share price volatility of 47% and expected life of 1.3 years.
Option pricing models require the input of subjective assumptions including the expected price volatility. Changes in
the assumptions can materially affect the fair value estimate, and therefore the existing models do not necessarily
provide a reliable single measure of the fair value of the Company’s share purchase warrants.
Employee share purchase plan (“ESPP”)
The Company has an ESPP which allows certain employees of Minto to purchase the Company’s shares in the market
through payroll deductions. Employees may contribute up to a maximum of 7% of their annual base salary and the
Company will match 50% of the employee’s contribution.
21. Earnings per share
Earnings per share, calculated on a basic and diluted basis, is as follows:
December 31, 2011 December 31, 2010
Earnings per share
Basic 0.20$ 0.37$
Diluted 0.20$ 0.37$
Net income
Net earnings available to common shareholders - basic 60,426$ 74,552$
Interest obtainable upon conversion of debentures, net of tax - 322
Net earnings available to common shareholders - diluted 60,426$ 74,874$
Weighted average shares outstanding
Weighted average shares outstanding - basic 295,997,095 198,996,825
Dilutive securities
Stock options 5,989,273 2,305,827
Share purchase warrants 1,089,486 -
Convertible debentures - 1,150,637
Weighted average shares outstanding - diluted 303,075,854 202,453,289
Weighted average shares excluded
Stock options 4,215,336 2,671,854
Convertible debentures 1,175,495 -

Capstone Mining Corp. Notes to Consolidated Financial Statements
Years Ended December 31, 2011 and 2010 (expressed in thousands of US dollars, except share amounts)
38
22. Related party balances and transactions
The immediate parent and ultimate controlling party of the group is Capstone Mining Corp. (incorporated in British
Columbia, Canada).
The details of the Company’s material entities and ownership interests are as follows:
Name Location Ownership Status
Minto Canada 100% Consolidated
Capstone Gold Mexico 100% Consolidated
Capstone Services S.A. de C.V. Mexico 100% Consolidated
Capstone Mining S.A. de C.V. Mexico 100% Consolidated
Kutcho Copper Canada 100% Consolidated
0908113 BC Ltd. Canada 70% Consolidated
Far West Canada 70% Consolidated
Santo Domingo Chile 70% Consolidated
Far West Exploration S.A. Chile 70% Consolidated
Far West Australia Australia 70% Consolidated
Balances and transactions between the Company and its subsidiaries, which are related parties of the Company, have
been eliminated on consolidation and are not disclosed in this note.
Transactions between the Company and other related parties include only consulting fees paid of $nil (2010 – $0.02
million) to two former directors of the Company.
These transactions are in the normal course of operations and are measured at the fair value amount of consideration
established and agreed to by the related parties. Any amounts due to/receivable from related parties are unsecured,
non-interest bearing and have no specific repayment terms.
Compensation of Key Management Personnel
During the period, compensation of key management personnel was as follows:
December 31, 2011 December 31, 2010
Salaries and short-term benefits 2,386$ 1,643$
Share-based payments 3,021 1,248
5,407$ 2,891$
Capstone’s key management personnel have authority and responsibility for planning, directing and controlling the
activities of the Company and consists of its Directors, Chief Executive Officer, Chief Financial Officer and Chief
Operating Officer.

Capstone Mining Corp. Notes to Consolidated Financial Statements
Years Ended December 31, 2011 and 2010 (expressed in thousands of US dollars, except share amounts)
39
23. Supplemental cash flow information
The components of cash and cash equivalents are as follows:
December 31, 2011 December 31, 2010 January 1, 2010
Cash 195,235$ 165,945$ 115,931$
Short-term investments 291,052 - -
Total cash and cash equivalents 486,287$ 165,945$ 115,931$
The significant non-cash financing and investing transactions during the period are as follows:
December 31, 2011 December 31, 2010
Common shares issued to acquire Far West net assets (Note 4) 408,575$ -$
Options and warrants issued in exchange for Far West options
and warrants (Note 4) 23,318$ -$
Mineral property addition for change in estimate to Minto
reclamation and closure cost obligation (Note 19) 4,101$ 1,829$
Mineral property adjustment related to to the sale of
non-controlling interest in Far West assets (Note 4) (44,879)$ -$
Mineral property addition for change in estimate to Cozamin
reclamation and closure cost obligation (Note 19) 3,475$ -$
Capitalized exploration expenditures included in accounts payable 280$ 768$
Construction in progress expenditures included in
accounts payable 158$ 472$
Fair value of shares issued for compensaton (Note 20) 267$ 309$
Fair value of shares reserved for issuance allocated to share
capital upon issuance (Note 20) 259$ 259$
Common shares issued upon the conversion of convertible
debentures (Note 15) -$ 93$
Fair value of equity portion of convertible debenture allocated to
share capital upon conversion (Note 15) -$ 28$
Fair value of stock options allocated to share capital
upon exercise (Note 20) 7,720$ 2,664$
24. Changes in non-cash working capital
The changes in non-cash working capital items are comprised as follows:
December 31, 2011 December 31, 2010
Receivables (4,275)$ (7,492)$
Inventories 5,014 (3,551)
Prepaids 209 (219)
Accounts payable and accrued liabilities (9) 3,486
Taxes payable (1,342) 2,832
Advances on concentrate inventories (33,434) 16,928
Net change in non-cash working capital (33,837)$ 11,984$

Capstone Mining Corp. Notes to Consolidated Financial Statements
Years Ended December 31, 2011 and 2010 (expressed in thousands of US dollars, except share amounts)
40
25. Capital management
The Company considers that its capital consists of the items included in shareholders’ equity, short term credit
facilities, long term debt, finance lease obligations, net of cash and cash equivalents, short-term deposits, and long-
term investments. The Company manages the capital structure and makes adjustments in light of changes in economic
conditions and the risk characteristics of the Company’s assets.
The Company’s capital management objectives are intended to safeguard the entity’s ability to support the Company’s
normal operating requirements on an ongoing basis as well as continue the development and exploration of its mineral
properties and support any expansionary plans.
To effectively manage its capital requirements, the Company has in place a planning and budgeting process to help
determine the funds required to ensure the Company has the appropriate liquidity to meet its operating and growth
objectives. The Company ensures that there are sufficient committed loan facilities to meet its short term business
requirements, taking into account its anticipated operational cash flows and its cash and cash equivalents, short-term
deposits and long-term investments.
The RTF contains various financial covenants, including: a) an interest coverage ratio; b) a leverage ratio; and c) a
tangible net worth requirement. As at December 31, 2011, the Company is in compliance.
26. Commitments
Agreements with the Selkirk First Nation
Under the terms of a revised co-operation agreement between Minto and the Selkirk First Nation (“Selkirk”) dated
October 15, 2009, the Company has made various commitments to Selkirk to enhance Selkirk participation in the
Minto Mine, including a variable net sales royalty on production from the Minto Mine that fluctuates with the price of
copper, as well as various commitments in respect of employment, contracting, training, and scholarship opportunities.
In June 2006, the Company entered into five leases with Selkirk for the use of the surface areas in and around the
planned development of the Minto project. The leases have a term of ten years and three months, expiring June 30,
2016. The total annual rent payable under the terms of these leases is $0.1 million.
Off-take agreements
The Company has a concentrate off-take agreement with a third party whereby it will purchase 100% of the
concentrate produced by the Minto Mine up to the end of December 2013. As part of the agreement, this third party
has provided Minto with an inventory financing facility.
The Company has a concentrate off-take agreement with a third party whereby it will purchase 100% of the copper
concentrate produced by the Cozamin Mine up to the end of December 2013.
The Company has a concentrate off-take agreement with a third party whereby it will purchase 100% of the lead
concentrate produced by the Cozamin Mine up to the end of December 2013.
The Company has a concentrate off-take agreement with a third party whereby it will purchase 100% of the zinc
concentrate produced by the Cozamin Mine up to the end of December 2013.
Power purchase agreement
In February 2007, Minto signed a PPA with the YEC, which was subsequently amended and approved by the Yukon
Utilities Board in May 2007, whereby the YEC will deliver grid power to the Minto Mine by constructing the
Carmacks/Minto main line and the spur line to the mine site. Minto is obligated to repay C$7.2 million of the costs of
the main line (Note 15) and C$10.8 million for the cost of the spur line (Note 16). Minto is obligated to purchase a

Capstone Mining Corp. Notes to Consolidated Financial Statements
Years Ended December 31, 2011 and 2010 (expressed in thousands of US dollars, except share amounts)
41
minimum of C$3.0 million of power for each of the first four years of the agreement expiring November 2012, to a
maximum of C$12.0 million. Power pricing was fixed at C$15.00/KVA and C$0.076/KWH as per YEC Rate
Schedule 39 (Industrial Primary) until December 31, 2009, then subject to escalation once each calendar year, starting
January 1, 2010, based on the latest percentage increase in the twelve month implicit chain price index for gross
domestic product at market for Canada as reported by Stats Canada. After four years (post take-or-pay period, ending
in November 2012), YEC will perform its normal cost of service analysis to set go forward rates. The Company is
obligated to fund the mine spur line reclamation costs on the closure of the mine.
On January 17, 2011, Minto repaid in full its spur line finance lease and main line capital cost contribution to YEC for
a total payment of $17.5 million.
Office space lease agreements
The Company has entered into various lease agreements for office space with terms that expire between 2013 and
2017. The total remaining lease commitments as at December 31, 2011 are $4.7 million.
27. Segmented information
The Company is engaged in mining, exploration and development of mineral properties, and has operating mines in
Canada and Mexico. The Company has five reportable segments as identified by the individual mining operations at
each of the Minto and Cozamin mines, the Santo Domingo development project, the Kutcho development project, and
Corporate. Segments are operations reviewed by the executive management. Each segment is identified based on
quantitative factors whereby its revenues or assets comprise 10% or more of the total revenues or assets of the
Company. Kutcho is a project that management reviews on an individual basis despite the fact that it does not meet
the quantitative thresholds as set out above.
Sales from the Company’s Minto Mine are to a single customer as per the off-take agreement, whereas sales from its
Cozamin Mine are to different customers depending on the nature of the concentrate (copper, lead or zinc).
Operating segment details are as follows:
Minto Cozamin Santo Domingo Kutcho Corporate Total
Net revenue 177,132$ 150,633$ -$ -$ -$ 327,765$
Cost of sales (63,044) (56,486) - - - (119,530)
Royalties (3,020) (5,506) - - - (8,526)
Depletion and amortization (70,480) (16,057) - - - (86,537)
Earnings from mining
operations 40,588 72,584 - - - 113,172
Net finance (costs) income (380) 379 34 - 3,269 3,302
Other income (expense) 3,269 2,624 (283) (17) (22,089) (16,496)
Earnings (loss) before
income taxes 43,477 75,587 (249) (17) (18,820) 99,978
Current income and mining
tax expense (538) (21,970) - (14) (1,342) (23,864)
Deferred income tax
(expense) recovery (16,702) (1,016) (639) 4 2,665 (15,688)
Net earnings (loss) 26,237$ 52,601$ (888)$ (27)$ (17,497)$ 60,426$
Mineral properties, plant &
equipment additions 55,509$ 16,889$ 499,157$ 4,333$ 1,061$ 576,949$
Year ended December 31, 2011

Capstone Mining Corp. Notes to Consolidated Financial Statements
Years Ended December 31, 2011 and 2010 (expressed in thousands of US dollars, except share amounts)
42
Minto Cozamin Santo Domingo Kutcho Corporate Total
Net revenue 134,212$ 139,741$ -$ -$ -$ 273,953$
Cost of sales (48,099) (57,524) - - - (105,623)
Royalties (2,246) (4,469) - - - (6,715)
Depletion and amortization (27,820) (15,494) - - - (43,314)
Earnings from mining
operations 56,047 62,254 - - - 118,301
Net finance (costs) income (2,472) 40 - (1) (116) (2,549)
Other (expense) income (17,656) (11,429) - (116) 23,549 (5,652)
Earnings (loss) before
income taxes 35,919 50,865 - (117) 23,433 110,100
Current income and mining
tax expense (4,941) (18,059) - - (2,707) (25,707)
Deferred income tax
(expense) recovery (12,185) 4,689 - 30 (2,375) (9,841)
Net earnings (loss) 18,793$ 37,495$ -$ (87)$ 18,351$ 74,552$
Mineral properties, plant &
equipment additions 40,898$ 8,233$ -$ 5,105$ 378$ 54,614$
Year ended December 31, 2010
Minto Cozamin Santo Domingo Kutcho Corporate Total
Mineral properties, plant
and equipment 158,601$ 113,415$ 452,912$ 56,667$ 1,329$ 782,924$
Total assets 209,114$ 199,055$ 545,702$ 57,552$ 408,112$ 1,419,535$
Total liabilities 54,943$ 71,932$ 3,451$ 899$ 13,425$ 144,650$
Minto Cozamin Santo Domingo Kutcho Corporate Total
Mineral properties, plant
and equipment 159,324$ 111,512$ -$ 53,630$ 410$ 324,876$
Total assets 252,181$ 193,365$ -$ 51,585$ 129,942$ 627,073$
Total liabilities 145,126$ 85,997$ -$ 1,042$ 17,170$ 249,335$
Minto Cozamin Santo Domingo Kutcho Corporate Total
Mineral properties, plant
and equipment 153,052$ 117,958$ -$ 45,745$ 115$ 316,870$
Total assets 236,005$ 185,967$ -$ 44,529$ 77,406$ 543,907$
Total liabilities 165,958$ 84,159$ -$ 7,023$ 2,411$ 259,551$
As at December 31, 2011
As at December 31, 2010
As at January 1, 2010

Capstone Mining Corp. Notes to Consolidated Financial Statements
Years Ended December 31, 2011 and 2010 (expressed in thousands of US dollars, except share amounts)
43
Geographic segment details are as follows:
Canada Mexico Total
Net revenue 177,131$ 150,634$ 327,765$
Canada Mexico Total
Net revenue 134,212$ 139,741$ 273,953$
Year ended December 31, 2011
Year ended December 31, 2010
Customer details are as follows:
December 31, 2011 December 31, 2010
Customer #1 186,426$ 145,991$
Customer #2 135,519 117,846
Other 30,601 37,485
Gross sales revenue 352,546$ 301,322$
During the year ended December 31, 2011, revenue of $321.9 million (2010 – $263.8 million) was attributable to the
Company’s two largest customers.
28. Contingencies
In the normal course of business, the Company is aware of certain claims and potential claims. The outcome of these
claims and potential claims is not determinable at this time, although the Company does not believe these claims and
potential claims will have a material adverse effect on the Company’s results of operations or financial position.
29. First time adoption of International Financial Reporting Standards (‘IFRS’)
The Company adopted IFRS on January 1, 2011, with the transition date of January 1, 2010 (“Transition Date”)
representing the Company’s opening IFRS balance sheet. As required by IFRS 1, First-time Adoption of IFRS, the
Company has applied IFRS in effect as at December 31, 2011 on a full retrospective basis, except where permitted
under an IFRS 1 exemption.
On adoption of IFRS 1, the Company elected to apply the following exemptions:
1. Business combinations – IFRS 1 provides the option to apply IFRS 3, Business Combinations, prospectively
from the Transition Date. The retrospective application of IFRS 3 would require the restatement of prior
acquisitions that meet the definition of a business combination under IFRS 3. The Company elected to adopt
IFRS 3 with effect from the Transition Date forward.
2. Deemed cost of mineral properties, plant and equipment – IFRS 1 provides the option to measure
individual items of mineral properties, plant and equipment at the Transition Date at fair value and use that
fair value as its deemed cost. The Company elected to use the fair value of its Minto mineral property at
December 31, 2008 (the date of a revaluation under GAAP) as its deemed cost and use this fair value as the
carrying value of the mineral properties, plant and equipment with effect from that date forward.
3. Decommissioning liabilities included in the cost of mineral properties, plant and equipment – IFRS 1
provides the option to measure the Company’s reclamation and closure cost obligations at the Transition Date
in accordance with the requirements of IAS 37, Provisions, Contingent Liabilities and Contingent Assets.
Accordingly, the Company elected to re-measure its reclamation and closure cost obligations at the Transition

Capstone Mining Corp. Notes to Consolidated Financial Statements
Years Ended December 31, 2011 and 2010 (expressed in thousands of US dollars, except share amounts)
44
Date under IAS 37 and estimated the amount to be included in the cost of the related assets by discounting the
liability to the dates at which the liability first arose.
4. Borrowing costs – IAS 23, Borrowing Costs, requires an entity to capitalize the borrowing costs related to all
qualifying assets for which the commencement date for capitalization is on or after the Transition Date. The
Company elected to apply the requirement to capitalize borrowing costs in accordance with IFRS with effect
from the Transition Date forward.
5. Currency translation adjustment – IFRS 1 provides the option to reclassify the cumulative foreign
currency translation differences previously recorded under GAAP to retained earnings and reset the balance
in the cumulative foreign currency translation reserve to zero. The Company elected to apply this exemption
and reclassified $14.5 million of cumulative foreign currency translation adjustment to retained earnings at
the Transition Date.
6. Share-based payments – IFRS 1 provides the option to apply IFRS 2, Share Based Payment, prospectively
from the Transition Date. The retrospective application of IFRS 2 would have an effect on equity instruments
granted subsequent to November 7, 2002 that vested prior to the Transition Date. The Company elected to
adopt IFRS 2 with effect from the Transition Date forward.
7. Compound financial instruments – IAS 32, Financial Instruments, requires an entity to split a compound
financial instrument into separate equity and liability components. Under IFRS 1, the Company elected to
not separate the equity component from the cumulative interest portion in retained earnings for any prior
compound financial instruments where the liability component was not outstanding at the Transition Date.
IFRS 1 also outlines specific requirements to which a first-time adopter must adhere. The Company has applied the
following to its opening balance sheet dated January 1, 2010:
Estimates – In accordance with IFRS 1, an entity’s estimates under IFRS at the date of transition to IFRS
must be consistent with estimates made for the same date under previous GAAP, unless there is objective
evidence that those estimates were in error. The Company’s IFRS estimates as at January 1, 2010 are
consistent with its previous estimates under GAAP for the same date.
GAAP to IFRS Reconciliations
Reconciliation of assets previously reported under GAAP to IFRS
Notes December 31, 2010 January 1, 2010
Total assets under GAAP 631,725$ 551,081$
Deferred tax adjustments:
Mineral property acquisition a (5,480) (5,185)
Plant and equipment a (453) -
Asset retirement obligations d 146 133
Balance sheet reclassifications (81) (2,985)
Other measurement adjustments:
Asset retirement obligations d 1,216 863
Total assets under IFRS 627,073$ 543,907$

Capstone Mining Corp. Notes to Consolidated Financial Statements
Years Ended December 31, 2011 and 2010 (expressed in thousands of US dollars, except share amounts)
45
Reconciliation of liabilities previously reported under GAAP to IFRS
Notes December 31, 2010 January 1, 2010
Total liabilities under GAAP 254,229$ 265,490$
Deferred tax adjustments:
Mineral property acquisition a (5,630) (4,732)
Plant and equipment a (453) -
Foreign exchange b (497) 331
Convertible debentures c 40 73
Asset retirement obligations d (9) (26)
Balance sheet reclassifications (81) (2,985)
Other measurement adjustments:
Asset retirement obligations d 1,736 1,400
Total liabilities under IFRS 249,335$ 259,551$
Reconciliation of equity previously reported under GAAP to IFRS
Notes December 31, 2010 January 1, 2010
Total equity under GAAP 377,496$ 285,591$
Deferred tax adjustments:
Mineral property acquisition a 150 (453)
Foreign exchange b 497 (331)
Convertible debentures c (40) (73)
Asset retirement obligations d 155 159
Other measurement adjustments:
Asset retirement obligations d (520) (537)
Total equity under IFRS 377,738$ 284,356$
Reconciliation of comprehensive income previously reported under GAAP to IFRS
Year ended
Notes December 31, 2010
Total comprehensive income under
GAAP 80,037$
Deferred tax adjustments:
Mineral property acquisition a 603
Foreign exchange b 828
Convertible debentures c 33
Asset retirement obligations d (4)
Other measurement adjustments:
Asset retirement obligations d 17
Share based compensation e 462
81,976$ Total comprehensive income under IFRS

Capstone Mining Corp. Notes to Consolidated Financial Statements
Years Ended December 31, 2011 and 2010 (expressed in thousands of US dollars, except share amounts)
46
Reconciliation Notes
a) Under GAAP, the Company recognized deferred income tax liabilities on the temporary differences arising
from the initial recognition of mineral properties, plant and equipment acquisitions, given that the fair value
of such acquisitions exceeded their tax basis. IAS 12, Income Taxes, does not permit the recognition of
deferred taxes on such transactions.
b) Under IFRS, the calculation of deferred income tax balances of foreign subsidiaries with a functional
currency different from the tax paying currency requires recognition of changes in deferred tax balances due
to differences between the current and historical exchange rates for non-monetary assets and liabilities.
c) Under GAAP, if a compound instrument can be settled without the incidence of tax, deferred taxes would not
be recorded related to the temporary difference (i.e., the tax base of the liability component is considered
equal to its carrying amount and no temporary difference arises). Under IFRS, the deferred tax consequences
of a financial instrument containing both a liability and equity component should be recognized both in net
earnings and in equity in accordance with the classification of the component parts under IFRS.
d) Under an IFRS 1 optional exemption, the Company has re-measured its reclamation and closure cost
obligations at the Transition Date, estimated the amount to be included in the related assets by discounting the
liability to the date at which the liability arose, and recalculated the accumulated amortization under IFRS.
e) Under GAAP, the Company amortized the share-based compensation expense on a straight-line basis over the
total vesting period. Under IFRS 2, Share-based Payment, an entity is required to apply graded-vesting
amortization to grants that have multiple vesting dates.
Cash Flows
The adoption of IFRS has had no impact on the net cash flows of the Company. The changes made to the balance
sheets and statements of earnings and comprehensive income have resulted in the reclassification of amounts on the
statements of cash flows, however there have been no changes to the net cash flows. IAS 7, Statement of Cash Flows
requires that cash flows relating to finance costs/interest and income tax be separately disclosed within the statement
classifications. Under GAAP, these amounts were previously disclosed as a note to the statement of cash flows. These
amounts have been separately disclosed under ‘operating activities’ within the statement of cash flows under IFRS.
Presentation Reclassifications
IAS 12, Income Taxes, requires that all deferred income taxes be classified as non-current on the balance sheet. As
such, the current portions of the future income tax asset and liability under GAAP at each balance sheet date presented
have been reclassified to the respective non-current deferred tax asset and liability balances under IFRS.

1 These are alternative performance measures: please see “Alternative Performance Measures” below. Page 1
Annual Management’s Discussion and Analysis
Of
Capstone Mining Corp.
(“Capstone” or the “Company”)
For the year ended December 31, 2011
The Company has prepared the following management’s discussion and analysis (the “MD&A”) as of
March 13, 2012 and it should be read in conjunction with the Company’s audited consolidated financial
statements and notes thereto for the year ended December 31, 2011. All financial information has been
prepared in accordance with International Financial Reporting Standards (“IFRS”) and all dollar amounts
disclosed are United States dollars unless otherwise stated. The disclosure related to the transition from
previous Canadian generally accepted accounting principles (“GAAP”) to IFRS is provided below in
Changes in Accounting Policies and in Note 29 to the audited consolidated financial statements for the
year ended December 31, 2011.
Nature of Business
Capstone is a Canadian mining company engaged in the production and development of and the
exploration for base and precious metals in Canada, Mexico, Chile and Australia. Minto Explorations Ltd.
(“MintoEx”), a wholly-owned Canadian subsidiary, owns and operates a copper-gold-silver mine located
in Yukon Territory, Canada (the “Minto Mine”). Capstone Gold S.A. de C.V. (“Capstone Gold”), a
wholly-owned Mexican subsidiary, owns and operates a copper-silver-zinc-lead mine located in
Zacatecas, Mexico (the “Cozamin Mine”). Far West Mining Ltd (“FWM”), a 70% owned Canadian
subsidiary, owns 100% of Minera Santo Domingo SCM (“Santo Domingo”), which is advancing the
Santo Domingo project, a large scale copper-iron-gold project in Chile to a production decision. In
addition, FWM owns active exploration properties in Australia and Chile. Kutcho Copper Corp. (“Kutcho
Copper”), a wholly-owned Canadian subsidiary, is advancing the Kutcho copper-zinc-silver-gold project
(the “Kutcho Project”) in British Columbia towards a production decision.
2011 Overview 2011 2010
Gross sales revenue ($ millions) 352.5 301.3
Copper in concentrates produced (millions pounds) 78.3 76.0
Payable copper produced (millions pounds) 75.5 73.0
Total cash cost per payable pound of copper produced (1)
($) 1.45 1.40
Copper sold - (millions pounds) 79.1 72.8
Net earnings ($ millions) 60.4 74.6
Net earnings per common share ($) 0.20 0.37
Adjusted net earnings (1)
($ millions) 52.2 45.2
Adjusted net earnings (1)
per common share ($) 0.18 0.23
Cash flow from operating activities ($ millions) 86.4 86.3
Cash flow from operating activities per common share ($) 0.29 0.43
Cash, restricted cash & short-term deposits ($ millions) 486.3 192.4
2011 Highlights
Financial and Production Highlights for the Years Ended December 31, 2011 & 2010
Recorded net earnings of $60.4 million or $0.20 per common share (2010 – net earnings of $74.6
million or $0.37 per common share) which included:
o Earnings from mining operations of $113.2 million (2010 - $118.3 million),
Realized copper price of $3.84 per pound (2010 - $3.42 per pound)

1 These are alternative performance measures: please see “Alternative Performance Measures” below. Page 2
o Gains on disposal of investments of $1.5 million (2010 - $26.1 million),
o Net gain of $8.5 million on derivative instruments (2010 - net loss of $15.5 million), and
o $39.6 million in current and future tax expenses (2010 - $35.5 million).
Adjusted net earnings1 were $52.2 million or $0.18 per common share after making adjustments
for certain non-cash and non-recurring items (2010 - $45.2 million or $0.23 per common share).
Generated cash flow from operating activities of $86.4 million or $0.29 per common share (2010
- $86.3 million or $0.43 per common share).
Working capital increased to $533.1 million at December 31, 2011 (which included $486.3
million of cash and cash equivalents) from $177.0 million at December 31, 2010.
Produced a total of 75.5 million pounds of payable copper at an estimated total cash cost1 of
$1.45 per pound of payable copper (2010 – 73.0 million pounds of payable copper at $1.40 per
pound).
Recorded gross sales revenue of $352.5 million on the sale of 79.1 million pounds of copper, 13.6
million pounds of zinc, 3.7 million pounds of lead, 22,258 ounces of gold and 1,529,823 ounces
of silver (2010 - $301.3 million on the sale of 72.8 million pounds of copper, 15.0 million pounds
of zinc, 9.4 million pounds of lead, 25,460 ounces of gold and 1,582,033 ounces of silver.
Additional Highlights
Completed the acquisition of FWM by way of a plan of arrangement in June 2011. FWM is the
100% owner of the large scale copper-iron-gold development project Santo Domingo located in
Region III, Chile.
Entered into a long-term strategic partnership with Korea Resources Corporation (“KORES”)
whereby KORES acquired a 30% interest in FWM for net cash consideration of $194.2 million.
KORES will arrange for debt financing of 65% of the bankable feasibility study capital costs of
Santo Domingo and will have the obligation to purchase 50% of the copper and iron concentrate
production from Santo Domingo at prevailing market terms.
Completed a private placement with KORES by issuing 40,198,632 common shares for gross
proceeds of $178.0 million.
Completed the Santo Domingo prefeasibility study (the “PFS”) in August 2011 which indicates
an after tax net present value (“NPV”) of $1.1 billion at an 8% discount with a 3 year payback of
capital.
Bruce McLeod resigned from the Company’s board of directors in April 2011.
Colin Benner and Stephen Quin resigned from the Company’s board of directors and Rick
Zimmer, the former CEO of FWM, Hak-Kyun Shin, a representative of KORES and Jan Castro, a
representative of Pala Investments joined the board of directors in June 2011. Jan Castro
subsequently resigned as a director of the Company in February 2012.
Fully repaid in January 2011 the C$17.4 million owning to Yukon Energy Corporation (“YEC”)
related to the spur and the main power lines servicing the Minto Mine, seven years ahead of
schedule.
Cozamin Mine:
Exceeded 3,000 tonnes per day of throughput for 2011, the highest annual mining rate achieved
to date with the final three quarters of the year achieving both record throughput and mining
rates. The fourth quarter mining rate averaged 3,339 tonnes per day.
Completed a record fourth quarter of contained copper in concentrates production at 11.9 million
pounds.
Attained Clean Industry Certification under Federal Environmental authorities.
Completed 22,891 metres of underground drilling in 50 diamond drill holes.
Completed 20,023 metres of surface drilling in 22 diamond drill holes.
Added 103 million pounds of measured and indicated copper mineral resources and 147 million
pounds of inferred copper mineral resources on a mineral resources estimate completed on the
MNFWZ based on the 2011 drilling.
Initiated engineering studies and mine planning work based on the new mineral resource estimate
aimed at incorporating the MNFWZ mineral resource into the Cozamin reserves in the first
quarter of 2012.

1 These are alternative performance measures: please see “Alternative Performance Measures” below. Page 3
Completed 930 metres of development drifting on the MNFWZ, mining 61,698 tonnes of
development ore an average grade 2% copper for the year.
Minto Mine:
Achieved record mill throughput in 2011, achieving an average annual throughput of 3,447
tonnes per day.
Received the Quartz Mining License (QML) authorizing mining in Area 2. Stripping in the Area
2 deposit started in the second quarter of 2011 and continued through the remainder of 2011. Ore
release from Area 2 is scheduled to begin in the second quarter of 2012.
Completed the Phase V prefeasibility study (Phase V-PFS) in March 2011, extending the Minto
Mine life to 2020, at an average annual production of 43.0 million pounds of copper in
concentrates, at a total cost per pound of payable copper of $1.34, net of by-product credits.
Completed 44,079 exploration metres in 129 diamond drill holes.
Identified a new discovery called Fireweed.
Increased the measured and indicated mineral resources to over 1.1 billion pounds copper with
completion of an updated mineral resource estimate incorporating drilling results from the Copper
Keel/Wildfire area and linking it with Area 2/118.
This updated mineral resource will serve as the basis for the Phase VI prefeasibility study
expected to be completed in the first quarter of 2012.
Kutcho Copper:
In 2011, the Company drill tested geophysical anomalies generated by a Versatile Time Domain
Electromagnetic (“VTEM”) survey flown early in the year. No potentially economic
mineralization was discovered.
The B.C. Environmental Assessment Office completed its determination of affected First Nations
and published the project description on its website. The pre-application process is ongoing.
The focus at Kutcho is on permitting activities.
Santo Domingo Project:
The Santo Domingo PFS was posted on SEDAR in September 2011.
Recruited the core management team for the project.
Awarded the contract for the preparation of the Santo Domingo project environmental impact
study (the “EIS) to Knight Piésold.
Awarded the feasibility study (the “FS”) and basic engineering to AMEC, with NCL Ingeniería y
Construcción Ltd. providing the mining section of the FS.
Initiated two separate drill programs October 2011; a 3,480 metre geotechnical drilling program
in support of a FS and a 12,000 metre in-fill mineral resource drilling program targeting the
proposed open pit during the payback period identified in the PFS. As of March 12, 2012 2,223
metres of the geotechnical program and 11,750 metres of the resource drill program are complete.
Work will continue through the second quarter.
Provided the following production guidance for 2012:
Cozamin Minto Total
Tonnes milled (millions) 1.1 1.4 2.5
Copper grade (%) 1.9% 1.5% 1.7%
Copper recovery (%) 92.7% 89.4% 90.9%
Copper contained concentrates (millions pounds) 42 38 801
Total cash cost per pound of payable copper $0.95 to $1.05 $2.10 to $2.30 $1.55 to $1.65

1 These are alternative performance measures: please see “Alternative Performance Measures” below. Page 4
Selected Annual Information ($ millions except for shares, per share amounts, production,
production costs & realized copper price) Years Ended December 31
2011 2010 2009*
Payable pounds of copper produced (million) 75.5 73.0 86.6
Cash cost per payable pound of copper produced1 1.44 1.40 1.03
Realized price per pound of copper sold 3.84 3.42 2.31
Net revenues 327.8 274.0 219.3
Operating costs (214.6) (155.7) (137.9)
Earnings from mining operations 113.2 118.3 81.4
General and administrative expenses (11.7) (10.1) ( 8.0)
Stock-based compensation (8.6) (4.7) (2.8)
Gain (loss) on derivative instruments 8.5 (15.5) (142.1)
Gain on disposal of investments 1.5 26.1 46.4
Current & future taxes recovery (expense) (39.6) (35.5) 11.2
Other expenses (2.9) (4.0) (4.4)
Net earnings (loss) for the period
- Basic earnings (loss) per share
Weighted average number of shares - basic
60.4
0.20
295,997,095
74.6
0.37
198,996,825
(18.3)
(0.10)
185,691,755
Net cash provided by operating activities 86.4 86.3 112.1
Cash, restricted cash & short-term deposits 486.3 192.4 118.4
Working capital 533.1 177.0 86.0
Total assets 1,420.0 627.1 551.1
Total long term debt - 11.6 20.3
Total liabilities 144.7 249.3 265.5
Shareholders’ equity 1,274.9 377.7 285.6 *as previously reported under GAAP
Acquisition of Far West Mining Ltd. and Strategic Partnership and Joint Venture with KORES
On April 15, 2011, Capstone and FWM entered into an agreement to combine by way of a plan of
arrangement, whereby Capstone agreed to purchase all of the outstanding common shares, warrants and
options of FWM (the “Transaction”). The FWM shareholders were entitled to elect to receive, in
exchange for each Far West share held either (i) 1.825 shares of Capstone and C$1.00 in cash, (ii) 2.047
shares of Capstone and C$0.001 in cash, or (iii) C$9.19 cash, subject to proration on the basis of an
aggregate maximum cash amount of approximately C$79.0 million and provided that no FWM
shareholder that elected option (iii) above, would receive less than C$1.00 in cash per FWM share. On
June 17, 2011, Capstone completed its purchase of FWM. FWM holds the Santa Domingo copper-iron-
gold project in Chile as well as active exploration properties in Australia and Chile. The Company is
continuing advancement of the Santa Domingo project in Chile towards a production decision.

1 These are alternative performance measures: please see “Alternative Performance Measures” below. Page 5
The transaction has been recorded as an asset purchase of mineral properties with the costs of the
acquisition allocated (expressed in thousands, except share amounts):
Purchase price:
Common shares of Capstone issued (128,753,385 shares) 408,575$
Cash consideration 71,770
Options exchanged 19,270
Warrants exchanged 4,048
Transaction costs 5,451
509,114$
Net assets acquired:
Cash 15,512$
Plant and equipment 331
Mineral property interest 491,984
Non-current taxes receivable 3,436
Non-cash operating working capital (net) (2,149)
509,114$
As part of the purchase, Capstone issued 12,091,629 options in exchange for 5,907,000 options of FWM,
which equates to an exchange ratio of 2.047 Capstone options for every FWM option exchanged. Those
issued by Capstone were on the same terms and conditions as those exchanged by the FWM holders. As
a result of these exchanges, Capstone recorded the fair value of the vested options of $19.3 million as a
cost of the purchase.
As part of the purchase, Capstone issued 4,451,221 warrants in exchange for 2,439,025 warrants of FWM
which equates to an exchange ratio of 1.825 Capstone warrants for every FWM warrant exchanged.
Those issued by Capstone were on the same terms and conditions as those exchanged by the FWM
holders, except for the exercise price, which was reduced by C$1.00. As a result of these exchanges,
Capstone recorded the fair value of the vested warrants of $4.0 million as a cost of the purchase.
Concurrent with the Company’s purchase of Far West, the Company announced that it has entered into a
strategic partnership with Korea Resources Corporation (“KORES”), conditional upon security holder
approval of the Transaction. Under the terms of the partnership, Capstone sold to KORES a 30% indirect
interest in the Far West assets for net cash consideration of $194.2 million. As a result of this partial
disposition of its ownership interest in the Far West assets, Capstone recorded a $44.9 million reduction
to the carrying value of the Far West mineral property interests on the date of purchase. This reduction in
mineral property interests represented the amount paid by KORES for its 30% interest in excess of a 30%
share of the estimated fair value of the Far West assets acquired on closing.
KORES (or its affiliate) agreed to arrange for a debt financier to offer to provide financing for 65% of the
financing required to fund capital costs for the purposes of advancing Santo Domingo to commencement
of commercial production as well as fund 30% of the balance of capital requirements based on its equity
ownership share. Further, KORES (or its affiliate) is obligated to purchase, on then prevailing market
terms (at the appropriate time), 50% of all copper concentrate and iron concentrate produced from Santo
Domingo over the life of the mine. Lastly, the Company issued 40,198,632 shares by way of a private
placement at C$4.35 per share to a KORES subsidiary for gross cash proceeds of $178.0 million. As per
the agreement, the subscription price of the shares was equal to a 1% discount to the 5-day volume
weighted average price of Capstone for the period ended April 15, 2011.
The partial disposition of Capstone’s ownership interest in the Far West assets to KORES for net cash
consideration of $194.2 million was effected by way of KORES purchasing a 30% equity interest in
0908113 BC Ltd., a subsidiary of the Company used in connection with the purchase of the Far West net
assets. For its 30% interest, KORES paid cash consideration of $277.4 million, and then Capstone and
KORES received loans of cash back (representing their respective pro rata equity share of the cash
balance in 0908113 BC Ltd.) in the form of Canadian denominated non-interest bearing promissory notes

1 These are alternative performance measures: please see “Alternative Performance Measures” below. Page 6
in the amounts of $194.2 million (C$190.9 million) and $82.3 million (C$81.8 million) respectively, that
are due upon demand. The Capstone note is eliminated on consolidation in these consolidated financial
statements given that it is payable to a subsidiary of the Company.
Under the terms of the shareholders’ agreement between Capstone and KORES, it is acknowledged that
cash calls will be funded to the extent possible, first by way of repayment of the promissory note. In
September 2011, KORES funded a cash call for C$5.3 million, reducing its outstanding balance on the
promissory note to C$76.5 million.
Details of changes in the balance of the promissory note are as follows (expressed in thousands):
Payment to fund KORES promissory note 83,213$
Repayment of KORES promissory note (5,454)
Currency translation adjustments (2,572)
Balance, December 31, 2011 75,187$
December 31, 2011
KORES promissory note 75,187$
Less: current portion (12,667)
Long-term portion 62,520$
The current portion of the promissory note represents management’s best estimate of the portion of the
note that will be repaid in 2012.
Under the terms of the Shareholders’ Agreement between Capstone and KORES, it is acknowledged that
cash calls will be funded to the extent possible, first by way of repayment of the promissory note. In
September 2011, KORES funded a cash call for C$5.3 million, reducing its outstanding balance on the
promissory note to C$76.5 million.
Results of Operations
The Company recorded net earnings of $60.4 million for the year ended December 31, 2011 (the “Current
Period”) compared with a net earnings of $74.6 million for the year ended December 31, 2010 (the
Comparative Period”). The main reasons for the reduction in net earnings are:
Lower earnings from mining operations despite a higher net revenue on higher realized copper
prices and higher volumes of copper sold as they were more than offset by higher cost of sales,
royalties and depletion and amortization costs.
Also the Company incurred higher share-based compensation, foreign exchange loss and deferred
income tax expense and a lower gain on the sale of investments, partially offset by higher interest
income and a gain on derivative instruments compared to a loss
Gross sales revenue of $352.5 million was generated in the Current Period on the sale of copper, zinc,
lead, gold and silver as detailed below. These net sales generated earnings from mining operations of
$113.2 million. Gross revenue in the Comparative Period of $301.3 million generated earnings from
mining operations of $118.3 million. The realized copper price was higher in the Current Period at $3.84
per pound versus $3.42 per pound, and a higher volume of copper was sold but higher cost of sales and
significantly higher depletion and amortization (with the amortization of deferred stripping at Minto)
resulting in slightly lower earnings from mining operations.

1 These are alternative performance measures: please see “Alternative Performance Measures” below. Page 7
Sales Quantities by Metal
Current
Period
Comparative
Period
Copper – pounds
Cozamin 35,540,602 33,747,545
Minto 43,562,836 39,039,953
79,103,438 72,787,498
Realized copper price $3.84 $3.42
Average copper price $4.00 $3.42 (LME settlement price)
Zinc – pounds
Cozamin 13,601,746 15,041,613
Lead - pounds
Cozamin 3,665,153 9,381,526
Gold – ounces
Minto 22,258 25,460
Silver – ounces
Cozamin 1,358,418 1,421,777
Minto 171,406 160,256
1,529,823 1,582,033 The current and subsequent periods may include final settlement quantity adjustments from prior shipments
Gross Sales Revenue by Metal
Current3
Period
($ 000’s)
Current
Period
%
Comparative
Period
($ 000’s)
Comparative
Period
%
Copper 308,300 87.4 248,845 82.6
Zinc 13,645 3.9 14,992 5.0
Lead 3,894 1.1 9,174 3.0
Gold2 13,745 3.9 15,116 5.0
Silver2 12,962 3.7 13,195 4.4
Total 352,546 100.0 301,322 100.0 2Gold and silver revenue include non-cash amounts for deferred revenue amortization related to the precious metal
stream sales.
3The current and subsequent periods may include final settlement adjustments from prior shipments

1 These are alternative performance measures: please see “Alternative Performance Measures” below. Page 8
At December 31, 2011 the following metal quantities were provisionally priced and included in gross
sales revenue. The provisional prices are subject to change on final price settlement (QP):
Copper – 14,596,184 pounds provisionally priced at $3.45 per pound with April to June 2012
QP’s.
All of the Company’s concentrate sales are covered by off take agreements with remaining terms of 24
months.
Concentrate production, sales and inventory is provided in the table below: Copper Zinc Lead
(dmt) (dmt) (dmt)
Cozamin Mine
Inventory – December 31, 2009 6,449 1,818 1,182
Production 64,356 16,448 6,282
Sales (67,816) (17,256) (7,030)
Inventory – December 31, 2010 2,989 1,010 434
Production 70,650 16,720 2,797
Sales (64,865) (15,463) (2,850)
Inventory – December 31, 2011 8,774 2,267 381
Minto Mine
Inventory – December 31, 2009 13,655 - -
Production 46,633 - -
Sales (45,762) - -
Inventory – December 31, 2010 14,526 - -
Production 45,953 - -
Sales (54,450) - -
Inventory – December 31, 2011 6,030 - -
The Company’s revenue recognition policy requires the transfer of title and risk of ownership to the
customer, collection is reasonably assured, the price is reasonably determinable, the Company has no
significant continuing involvement, and the costs incurred or to be incurred in respect of the transaction
can be measured readily.. As final metal price settlement may occur a number of months after the initial
revenue recognition, changes in metal prices during that time may have a material impact on the final
revenue recognition.
Truck transport is not available for two periods of eight to ten weeks beginning in April and in October of
each year as the Yukon River freeze-up and breakup prevents ground access to the Minto Mine. Up to
20,000 dmt of copper concentrate produced during these periods can be stored at the mine site. As a
result, the Company’s reported revenue from the Minto Mine may vary significantly from period to
period.
Production from the Cozamin Mine is trucked to the Port of Manzanillo on a regular, almost daily basis,
resulting in only minor concentrate inventory build ups at the mine.
Cost of sales in the Current Period were $119.5 million or 36.5% of net revenue compared with $105.6
million or 38.6% of net revenue in the Comparative Period. The cost of sales was higher in the Current
Period on higher volumes of metal sold and an increase in unit operating costs on higher total production
costs. The lower percent of net revenue is due to higher unit costs of the metals sold being more than
offset by higher realized metal prices in the Current Period.
Royalties were higher in the Current Period at $8.5 million compared with $6.7 million in the
Comparative Period due to the higher revenues on sale of higher volume and higher metal prices.
Depletion and amortization was higher in the Current Period at $86.5 million compared with $43.3
million in the Comparative Period. More tonnes of concentrate were sold and the unit costs were higher

1 These are alternative performance measures: please see “Alternative Performance Measures” below. Page 9
due to a higher depreciable cost base on mineral properties, plant and equipment additions at both mines
and amortization of deferred stripping at the Minto Mine.
Administrative costs in the Current Period were $11.7 million compared with $10.1 million in
Comparative Period. The addition to the corporate employee complement, general salary increases and
higher professional fees contributed to higher administrative costs in the Current Period
Stock-based compensation, a non-cash cost, was $8.6 million in Current Period compared with $4.7
million in Comparative Period, due mainly to a higher fair value of options granted during the Current
Period.
The Company recorded a foreign exchange loss of $5.9 million in the Current Period mainly related to US
dollar denominated concentrate advances and the weakening of the Canadian dollar as well as Mexican
peso denominated cash and accounts receivable and the weakening of that currency. In the Comparative
Period, a loss of $1.5 million was recorded mainly related to US dollar denominated deposits and short
term investments partially offset by gains on US dollar denominated liabilities, due to the strengthening
of the Canadian dollar.
During the Current Period, the Company recorded a realized loss of $28.2 million (Comparative Period –
$34.0 million) on metal derivative contracts that were closed out and settled for cash. This was offset by
an unrealized non-cash gain of $36.7 million (Comparative Period – $19.5 million) related to changes in
the fair value of open metal derivative contracts at the end of the period, resulting in a net gain on metal
derivative instruments of $8.5 million (Comparative Period – net loss of $14.5 million). The net gain on
metal derivatives combined with an unrealized loss of $nil (2010 – $1.0 million) on common share
purchase warrants of Nevada Copper Corp., resulting in a total net gain on all derivative instruments of
$8.5 million (Comparative Period – net loss of $15.5 million).
A gain of $1.5 million on the disposal of investments was recorded in the Current Period on the sale of
Northern Tiger Resources Inc. shares. This compared with a $26.1 million on the sale of all the shares of
Silver Wheaton Corp., all the shares and warrants of Nevada Copper Corp. and a portion of the shares of
Northern Tiger Resources Inc. during the Comparative Period.
Interest and other income was $4.4 million in the Current Period compared to $0.9 million in the
Comparative Period on higher cash balances.
Interest on long term debt and finance lease obligations in the Current Period was $0.8 million compared
with $3.1 million in the Comparative Period as the majority of the obligations were repaid in 2010 and
early 2011.
Income and mining tax expense of $23.9 million was recorded in the Current Period related to an estimate
of the Yukon Quartz Mining Act Royalty (the “QMAR”) payable of $0.6 million, income taxes payable
related to the Cozamin Mine of $22.0 million and $1.3 million related to derivative income in Canada.
This compares with $25.7 million recorded in the Comparative Period related to an estimate of the
QMAR payable of $4.9 million, income taxes payable related to the Cozamin Mine of $18.1 million and
$2.7 million related to investment sales in Canada.
The deferred income tax expense of $15.7 million recorded in the Current Period is primarily a result of
income from the Minto Mine which is not yet subject to current income tax. In addition, there was a
much smaller deferred income tax expense related to the Cozamin mine and the Chilean operations which
was more than offset by a deferred tax recovery in other Canadian operations due to temporary
differences between taxable income and accounting income.
Fourth Quarter 2011
The Company had net earnings for the three months ended December 31, 2011 (the “Current Quarter”) of
$4.9 million. The main contributors to the net earnings were:

1 These are alternative performance measures: please see “Alternative Performance Measures” below. Page 10
Earnings from mining operations were $19.3 million, which was partially offset by general and
administrative expenses of $3.9 million, share-based compensation of $1.3 million, a loss on
foreign exchange of $4.7 million and current and deferred income taxes of $6.4 million.
Earnings from mining operations were driven by gross sales revenue of $65.6 million on the sale
of 16.5 million pounds of copper, 2.6 million pounds of zinc, 1.2 million pounds of lead, 4,000
ounces of gold and 427,000 ounces of silver.
Adjusted net earnings1 were $4.2 million or $0.01 per common share after making adjustments
for certain non-cash and non-recurring items.
Cash flow from operating activities of $11.1 million or $0.03 per share.
Produced a total of 19.0 million pounds of payable copper at an estimated total cash cost1 of
$1.50 per pound of payable copper.
The Company had net earnings for the three months ended December 31, 2010 (the “Comparative
Quarter”) of $8.5 million, the contributors to the net earnings were:
Earnings from mining operations were $21.0 million and a gain on the sale of investments of
$12.2 million which were partially offset by general and administrative expenses of $4.1 million,
share-based compensation of $0.7 million, a loss on foreign exchange of $2.2 million, a loss on
derivative instruments of $15.4 million and current and deferred income taxes of $1.4 million.
Earnings from mining operations were driven by gross sales revenue of $52.7 million on the sale
of 10.8 million pounds of copper, 4.9 million pounds of zinc, 1.5 million pounds of lead and
422,000 ounces of silver.
Adjusted net loss1 was $3.5 million or $0.02 per common share after making adjustments for
certain non-cash and non-recurring items.
Cash flow from operating activities of $22.6 million or $0.11 per common share.
Produced a total of 18.6 million pounds of payable copper at an estimated total cash cost1 of
$1.66 per pound of payable copper
Production Results
Minto Mine
The Minto Mine is a copper-gold-silver mine located in Yukon Territory of Canada.
Operational Highlights
Mining in the Minto Main pit was completed during the second quarter of 2011. Stripping of the Area 2
pit continued throughout the remainder of the year and is currently ongoing. Area 2 will begin to release
sufficient ore to feed the plant during the second quarter of 2012. Mining activities have been approved
under the Quartz Mining License, and it is expected that the Water Use License Amendment required to
deposit Area 2 tailings in the completed Minto Main pit will be received prior to Area 2 releasing
sufficient ore to feed the mill. In the event that this amendment is delayed, tailings will continue to be
filtered and placed on the current dry stack facility. Should the latter occur, the corresponding operating
costs would be above the 2012 plan, which currently anticipates the tailing filtration plant shut down
starting in the second quarter and commencing use of the in-pit tailings facility.
The underground access ramp development by a contractor is expected to commence in the third quarter
of 2012. Underground ore production is planned to be owner operated with initial release in the second
quarter of 2013.
Despite record mill throughput in the Current Period, copper production at Minto was lower relative to
2010 due to the processing of low grade stockpiles following the completion of the Minto Main pit during
the second quarter of 2011. Lower than anticipated grade from the Minto Main pit stockpiles, recovery
issues associated with mining of stockpiled partially oxidized ore (“POX”), and concentrate moisture
content challenges further impacted Current Quarter production, resulting in lower production for the
year. Mill tonnage throughput continued at planned levels during the Current Quarter.

1 These are alternative performance measures: please see “Alternative Performance Measures” below. Page 11
The copper production for the Current Period and Current Quarter were negatively impacted by the
copper grade processed and diminished recovery. Copper recovery during the Current Quarter was lower
than plan due to issues in the flotation circuit which were aggravated by less amenable ore types.
Investigation of various reagents that have potential to improve recovery associated with POX ore
continue to be tested. During this period, lower grade sulphide ore was processed with the higher grade
POX ore being deferred until the operational issues can be resolved. Subsequent testing has improved the
recovery of the POX ores, but due to downstream problems in the concentration filtration circuit, the
maximum amount of this material that can be blended into the mill feed is capped at 10%, which will
delay the processing of all of this stockpiled material over a longer period.
Total production costs at Minto for the Current Period and Current Quarter were higher than the
Comparative Period and Comparative Quarter on the increased volume of ore milled. Unit costs per
tonne milled were lower due to efficiencies of higher throughputs.
Key operating statistics for the Minto Mine for the Current and Comparative Quarters and the Current and
Comparative Periods are presented below:
Current
Quarter
Comparative
Quarter
Current
Period
Comparative
Period
Production (contained in concentrates)
3
- Copper (000s pounds) 7,843 10,672 37,060 40,454
- Silver (ounces) 39,949 36,426 195,298 206,838
- Gold (ounces) (2)
3,800 2,234 18,348 22,284
Mining
- Waste (tonnes) 2,367,576 1,764,509 10,439,357 7,873,049
- Ore (tonnes) 52,545 484,907 728,253 1,494,752
- Total material mined (tonnes) 2,420,121 2,249,416 11,167,610 9,367,801
Milling
- Tonnes processed 336,949 258,121 1,258,308 915,051
- Tonnes processed per day 3,662 2,806 3,447 2,507
- Copper grade (%) 1.28 2.03 1.52 2.22
- Silver grade (g/t) 4.7 6.6 6.1 8.7
- Gold grade (g/t) (2), (3)
0.50 0.46 0.60 0.93
Recoveries
- Copper (%) 84.5 92.5 87.9 90.3
- Silver (%) 78.5 66.1 78.6 80.6
- Gold (%) (2)
72.8 58.1 75.5 81.1
Concentrate
- Dry tonnes produced 9,741 12,082 45,952 46,633
- Copper grade (%) 36.5 40.1 36.6 39.3
- Silver grade (g/t) 128 94 132 138
- Gold grade (g/t) 2 12.2 5.8 12.4 14.9
On site operating costs ($/t milled) 4
$43.48 $50.17 $43.70 $58.24
Payable pounds of copper produced (000s lbs) 7,588 10,672 35,856 38,866
Total cash cost per pound (1)
of payable copper 4 $2.04 $1.47 $1.64 $1.54
(2) Gold is not assayed on site, resulting in a significant lag in receiving this data.
(3) Adjustments based on final settlements will be made in future periods.
(4) Minto’s operating costs are adjusted to exclude mining of ore and waste not related to concentrate produced in the period, these costs are
capitalized or inventoried in the financial statements, then expensed when the associated ore is processed.
Investing Activities
Current Period capital expenditures for Minto totaled $8.2 million. $1.3 million corresponded to surface
infrastructure related to initial underground development, $2.8 million was related to mining equipment
and initial supply purchases related to underground, $1.8 million was related to development of the Water
Use License amendment and development of the Phase V environmental and socio-economic assessment,

1 These are alternative performance measures: please see “Alternative Performance Measures” below. Page 12
and $1.4 million was spent on miscellaneous laboratory, plant, and safety improvements. In addition,
$0.8 million was carried over in uncompleted 2010 projects.
Exploration - Minto
Two mineral resource estimates were completed in 2011; one was announced on May 30, 2011 and the
second one completed in the fourth quarter and announced in February 2012. Effective December 31,
2011, the total mineral resources in the Measured and Indicated (M&I) class at Minto after additions
through exploration activity and reductions due to mining activity rose to 1.16 billion pounds of copper.
Before reductions due to mining, exploration activities added 287 million pounds of copper in the M&I
class to the overall Minto Mine mineral resource in 2011. These additions resulted from a new geological
interpretation that incorporated drill data from 2010 through 2011. The new model demonstrated
geological continuity between two deposits formerly considered to be separate; Copper Keel/Wildfire and
the Area 2/118 deposit. The combination of these deposits is now known as the Minto South Deposit
(“MSD”). The link was made with the second quarter block model and substantiated with the fourth
quarter updated block model.
A new discovery, Fireweed was made in the Minto Creek region of the property, just east of the tailings
processing facility and north of the tailings disposal area. A preliminary interpretation suggests it is a
possible extension to the underground deposit Minto East.
Exploration activities totaled $6.9 million, all of which was expended on drilling and related activities.
Outlook
Minto is projected to produce 38 million pounds of copper contained in concentrate at a cash cost of
$2.10 to $2.30 per pound of payable copper in 2012. Mill feed in the first quarter of 2012 will consist
primarily of low-grade sulfide stockpiles. Stripping of the Area 2 pit progresses with ore release
scheduled for the second quarter of 2012. Sulfide ore will feed the mill (combined with some POX) for
the remainder of the year. Stripping commences in Area 2 Stage 2 in October 2012.
The milling of POX ore will increase milling unit costs relative to 2011. Also, any delay in placement of
tailings into the Minto Main pit would delay the anticipated cost savings in the tailings area until the new
WUL amendment is received.
A total of $32.2 million of capital expenditures are anticipated in 2012 with major expenditures as
follows: $2.7 million on underground mine equipment, $1.2 million on permitting, $6.9 million on
upgrades to camp facilities, $8.7 million on underground development and related infrastructure, $4.5
million on a tailings deposition line to the pit and crusher expansion in the mill and $4.0 million on water
treatment plant upgrades.
The Phase V PFS will trigger an application to Yukon Environmental Socio-Economic Assessment Board
(“YESAB”) for the environmental and socio-economic assessment of the Phase V project. This has been
delayed until the second quarter of 2012 due to uncertainty related to the current water management plan,
geotechnical stability of the current waste dumps and permitting human resources.
With the previous exploration success in 2010 and 2011, Capstone announced initiation of a Phase VI
PFS aimed at incorporating Wildfire/Copper Keel resources (Minto South or “MSD”) into the reserve
base. Engineering studies reviewing underground and open pit mining continued throughout the fourth
quarter of 2011 as well as metallurgical testing. The block model and resource estimate for inclusion
into the Phase VI PFS is now complete. Drilling for geotechnical purposes related to the Phase VI PFS
was completed in the fourth quarter and is currently being reviewed.
Due to the addition of 219 million pounds of copper in M&I mineral resources announced on May 30th,
2011 and a further 67 million pounds in the same class announced on February 2, 2012 a larger open
pit/milling scenario is being evaluated. The May 30, 2011 block model tied together several deposits into

1 These are alternative performance measures: please see “Alternative Performance Measures” below. Page 13
a single larger deposit called MSD and it highlighted further potential for expansion to the east which was
addressed with additional drilling and a February 2012 block model update. Evaluation of the larger
throughput scenario is expected in the second quarter of 2012.
An exploration budget of $4.8 million to execute approximately 23,500 metres of drilling in 2012 was
approved in the fourth quarter and drilling started on January 29, 2012. The 2012 program will be
conducted in two phases, winter and summer, separated by a pause for spring freshet.
The latest block model ties together several deposits into a single larger deposit called MSD and
highlights some potential for expansion of MSD down dip to the north and locally along strike to the east.
Drilling in the First Quarter of 2012 will also investigate if there is continuity in mineralization between
MSD and Ridgetop toward the south as well. The gap between these deposits was very sparsely drilled by
the previous operators and at shallow depths only. This is expected to be addressed during the second
quarter of 2012.
Once this relatively shallow drilling is completed at the south end of the property, the drills will be moved
back to the Fireweed area to test that structure down dip to the north and up dip to the south where it is
still open. It still appears open to the east as well plus several gaps to the west toward Minto East also
need to be in-filled.
Cozamin Mine
The Cozamin Mine is a copper-silver-zinc-lead mine located in Zacatecas, Mexico.
Operational Results
Cozamin attained record mine production rates and record copper production in 2011 as a result of a
resolution of 2010 ground stability issues in the Avoca zone during the second quarter of the year.
Higher copper production and lower production costs resulted from higher mine, and higher mill
production for the period compared with the previous period.
Mine production and mill throughput in the Current Quarter continued to be at planned levels with a
production record being established in October due to optimization of drilling and blasting techniques,
improved coordination among departments, and hoisting plant upgrades.
Mine management has been working with external consultants to improve mine operations and
developing sustainable management systems, which are expected to improve both operations and cost
control efforts going forward. Cash costs are expected to decrease in 2012 with the completion of the
outsourced training programs.

1 These are alternative performance measures: please see “Alternative Performance Measures” below. Page 14
Key operating statistics for the Cozamin Mine for the Current and Comparative Quarters and the Current
and Comparative Periods are presented below: Current
Quarter
Comparative
Quarter
Current
Period
Comparative
Period
Production (contained in concentrates) 2
Copper (000s) pounds 11,898 8,209 41,212 35,552
- Lead (000s pounds) 1,228 1,496 3,960 9,142
- Zinc (000s pounds) 3,818 3,694 18,035 17,348
- Silver (ounces) 432,591 334,751 1,566,367 1,403,170
Mine
- Tonnes of ore mined 307,163 214,689 1,110,104 978,954
Mill
- Tonnes processed 304,556 215,503 1,097,759 981,682
- Tonnes processed per day 3,310 2,342 3,008 2,690
- Copper grade (%) 1.9 1.88 1.84 1.80
- Lead grade (%) 0.29 0.42 0.25 0.63
- Zinc grade (%) 0.86 1.15 1.09 1.27
- Silver grade (g/t) 59.5 67.1 61.2 62
Recoveries
- Copper (%) 93.1 92.0 92.8 91.2
- Lead (%) 63.9 74.1 64.2 67.6
- Zinc (%) 66.1 67.8 68.2 63.0
- Silver (%) 74.3 72.0 72.5 71.7
Concentrate
- Copper concentrate produced (dmt) 20,250 14,187 70,650 64,356
- Copper (%) 26.7 26.2 26.5 25.1
- Silver (g/t) 583 582 602 536
- Lead concentrate produced (dmt) 845 1,015 2,796 6,282
- Lead (%) 65.9 66.9 64.2 66.0
- Silver (g/t) 1,955 2,119 2,216 1,391
- Zinc concentrate produced (dmt) 3,578 3,534 16,720 16,448
- Zinc (%) 48.4 47.4 48.9 47.8
On site operating costs ($/t milled) $47.28 $78.42 $51.77 $53.84
Payable pounds of copper produced (000s lbs) 11,452 7,896 39,654 34,133
Total cash cost per pound(1)
of payable copper 2 $1.14 $1.91 $1.27 $1.25
2 Adjustments based on final settlements will be made in future periods.

1 These are alternative performance measures: please see “Alternative Performance Measures” below. Page 15
Exploration
On June 20, 2011, the Company announced the initial mineral resource estimate for the MNFWZ adding
74 million pounds of copper in the measured and indicated category and 163 million pounds in the
inferred category. Work on a block model update to incorporate as much new drilling as possible since
the initial estimate, continued into the fourth quarter. The final results were released in February 2012 and
are being incorporated into ongoing engineering studies designed to incorporate MNFWZ resources into
Cozamin’s mineral reserves and mine plan. These studies are expected to be completed in the second
quarter of 2012.
Cozamin Mine - Mineral Resources by Class for the MNFWZ as at December 31, 2011 at a US$35 Net
Smelter Return Cut Off Grade (COG)*
Classification Tonnes
(000’s)
Copper
(%)
Silver
(g/t)
Zinc
(%) Contained Cu (million pounds)
Contained Ag
(million ounces) Contained Zn (million pounds)
Measured (M) 340 1.98 37.1 0.30 14.9 0.4 2.2
Indicated (I) 1,877 2.12 35.4 0.36 87.9 2.1 14.8
Total (M&I) 2,217 2.10 35.6 0.35 102.8 2.5 17.0
Additional Inferred 3,574 1.86 38.6 0.24 146.9 4.4 18.8
* Metal Price assumptions (in USD) used to calculate the NSR COG for all deposits are: Cu=$2.50; Zn=$0.80; Ag=$20.00.
Processing recoveries used to calculate the NSR COG for the MNFWZ Resource are: Cu=92%; Zn=69%; Ag=72%
Investing Activities
Capital spending at Cozamin totaled $8.7 million for 2011. Major expenditures included $3.1 million in
mine equipment, $1.2 million in underground capital developments, $1.6 million in plant sustaining
capital and improvements, and $1.0 million in tailing dam capacity expansion which provided two years
additional capacity.
Exploration expenditures totaled $8.0 million in 2011, all related to drilling, primarily in the MNFWZ,
completing 72 holes for a total of 42, 913 meters.
Outlook
Cozamin projects 42 million pounds of contained copper production, 20 million pounds of zinc, 4.5
million pounds of lead, and 1.7 million ounces of silver for 2012. Copper production cost, net of by-
products, is projected at $0.95-$1.05 per pound of payable copper. The majority of 2012 ore will be
produced from the Mala Noche Vein system with approximately 10% coming from the MNFWZ. A
tailing raise planned for completion during the fourth quarter of 2011 was delayed by contractor
equipment issues and was completed in February of 2012.
Underground capital development planned for 2012 consists of 4,200 meters of mine development and
500 meters of exploration drifts to provide drilling access. Operational development activities planned
for 2012 total 4,800 meters combined vertical and horizontal development. Approximately 25% of the
planned development is aimed at bringing the MNFWZ into production.
A total of $15.1 million of capital expenditures are anticipated in 2012 (excluding exploration activities).
Significant highlights are as follows: $4.7 million on mining fleet upgrades and compressed air systems,
$2.1 million for an underground paste fill facility, $2.3 million in ventilation improvements and related
development, and $3.0 million in development costs.
An exploration budget of $6.7 million to execute approximately 32,000 metres of additional drilling at
Cozamin started in January 2012. The MNFWZ structure is still open, toward the east and down dip and
remains a significant exploration target and a continued focus for 2012 at the Cozamin Mine. Drilling on
the MNFWZ from underground still continues with two rigs, the results of which will be captured in
subsequent mineral resource updates. Surface exploration drilling on other exploration targets along the
Mala Noche Vein structure is scheduled to start in the second quarter of 2012.
Exploration drilling from surface recommenced in the first quarter of 2012 and concentrate on the main
MNV structure with two rigs; one on either end of the current ore reserve.

1 These are alternative performance measures: please see “Alternative Performance Measures” below. Page 16
Santo Domingo
The Company owns a 70% interest in the Santo Domingo copper-iron-gold project which is located
50 kilometres west of Codelco’s El Salvador copper mine, and 130 kilometres north north-east of
Copiapó in Region III, Chile, near the town of Diego de Almagro. Elevation at the site ranges from
1,000 to 1,280 metres above sea level, with relatively gentle topographic relief. Access to the project is
via paved highway and a network of generally well-maintained gravel roads. Regional infrastructure is
good and highways connect main towns and cities.
Technical Report
The Company announced the results of the PFS for Santo Domingo in August 2011. The PFS, prepared as
a NI 43-101 compliant Technical Report, was filed under Capstone's profile on SEDAR at
www.sedar.com in September 2011.
Highlights
Average annual production of 144 million pounds of copper, 4.1 million tonnes of iron
concentrate and 15 thousand ounces of gold. Copper production will average 255 million pounds
in the first five years of the Project.
After-tax Base Case2 NPV, discounted at 8%, of $1.1 billion. After-tax Spot Case3 NPV
discounted at 8%, of $4 billion.
After-tax Base Case2 IRR of 22% with a payback period of 3.0 years.
Expected life of mine Base Case2 total cash production costs are estimated to be $0.11 per pound
of payable copper (net of magnetite iron and gold by-product credits and selling costs); $0.32 in
the first five years.
Total capital costs estimated to be $1.24 billion4, which includes a 14% contingency on total
costs.
18 year mine life with operations expected to commence in late-2015.
Nominal plant throughput rate of 63,500 tonnes per day; 70,000 tonnes per day in the first five
years.
Favourably located close to existing infrastructure, with direct shipping access to Asian markets.
Off-take agreements (at market pricing) committed for 50% of the copper and 50% of the iron
concentrate, life of mine, as part of the strategic partnership with KORES for development of the
Project. 2 Base Case at constant $2.50/lb. copper price, $1.00/dmtu iron price ($65/t conc. at 65% Fe), $1,000/oz. gold price. All calculations are Base Case except where otherwise
specified.
3 Spot Case at constant $4.00/lb. copper price, $2.00/dmtu iron price ($130/t conc. at 65% Fe), $1,400/oz. gold price.
4 Plus/minus 25% as of July 2011
Management Team
After finishing the PFS for the project, primary efforts have been directed to put the Santo Domingo
management team in place in order to continue advancing the project through the development phase. A
General Manager was appointed in mid-August as the starting point for building the team.
By the end of the year, three additional managers were hired: a HSEC (Health, Safety, Environmental
and Communities) Manager, a Project Manager, and a Legal & Permitting Manager. This core
managerial team has both operational and project experience in mines and projects in Chile belonging to
Codelco, Barrick, Kinross, BHP and Anglo American..
Drilling Campaigns
Two drilling campaigns are underway to provide support for the bankable feasibility study (“BFS”) stage.
An infill drilling campaign of about 12,000 meters was designed to improve the confidence of the
production of the first three years and expected payback period. This is planned to be completed by
March 2012. A geotechnical and hydrogeology drilling campaign consisting of 15 additional drill holes
will provide support for the BFS studies should also be completed in the first part of 2012.
Environmental Impact Study

1 These are alternative performance measures: please see “Alternative Performance Measures” below. Page 17
Capstone has awarded the contract for preparation of the Santo Domingo EIS to Knight Piésold, an
international consulting company providing engineering and environmental services for the mining,
power, water, transportation, and construction sectors.
Knight Piésold will have responsibility throughout the environmental permitting process; covering
activities from the on-going collection of all relevant baseline information to the completion of the EIS
document, including its presentation to authorities, process follow up, and community consultation
activities terminating with obtaining the Environmental Qualification Resolution from the Chilean
authorities.
Power Supply
Studies were initiated to advance development of necessary power supply infrastructure for the project.
These include port facilities and power supplies. Due to the critical nature of power generation and
distribution system in the northern section of the Chilean Central Grid, conversations with potential
power suppliers have begun with the intent to formalize electricity supply arrangements in 2013 to ensure
time to complete associated construction projects prior to project start-up anticipated for late-2015.
Communications & Governmental Relations
The consulting services of an External Affairs Manager were retained to assist Santo Domingo on
external communications and governmental relations. A draft communications strategy has been prepared
and key message tracks have been developed for this stage of the project.
Key regional governmental authorities were visited , including a visit to the Intendenta of the Third
Region, the most important governmental authority at the regional level and the Environmental
Evaluation Service Director, to present Santo Domingo and the recently appointed management team.
The receptions were positive.
Exploration
Two separate drill programs were initiated in early October, 2011; a 3,480 metre geotechnical drilling
program in support of a Feasibility Study (FS) and a 12,000 metre in-fill mineral resource drilling
program targeting the proposed open pit during the payback period identified in the PFS.
Outlook
Projected spending on the Santo Domingo project during 2012 is estimated at $39.5 million. The EIS is
scheduled for submission to Chilean environmental authorities in 2012. Basic engineering is expected to
have advanced by year-end to the point that bid specification packages for all long lead time equipment
will be available. The FS is scheduled for completion in the first quarter of 2013.
As of March 12, 2012, 2,223 metres of the geotechnical program and 11,750 metres of the resource drill
program are complete. Work will continue through the second quarter.
Kutcho Copper
Kutcho Copper owns a 100% interest, subject to certain third party rights, in the Kutcho Project, a high-
grade copper-zinc-silver-gold property in British Columbia.
During the Current Period the Company completed an airborne VTEM survey totaling 1,649 kilometres
of flight lines spaced 100 metres apart, covering 14,700 hectares. Capstone drill tested the EM anomalies
generated by the VTEM survey. No significant intercepts were reported.
During the Current Quarter engineering continued to support the compilation of the environmental
application. Optimization of the access road design was completed. The government has established a
working group of governmental agencies and affected First Nations to begin the formal project
assessment.

1 These are alternative performance measures: please see “Alternative Performance Measures” below. Page 18
Various consulting firms were requested to submit proposals for basic engineering of the site surface
infrastructure, underground design including ventilation and electrical infrastructure and detailed
engineering associated with the access road bridge system. This will enable procurement of long delivery
items and confirmation of initial capital cost estimates.
Consultation with First Nations continued throughout the year.
Capital spending during 2011 totaled $1.8 million. This amount was expended primarily on permitting
activities and technical studies supporting these activities. $2.5 million was expended on exploration
activities for the full year.
In 2011 the Company Drill tested geophysical anomalies generated by a Versatile Time Domain
Electromagnetic (“VTEM”) survey flown earlier this year. Assay results have been received and while
they are geochemically anomalous no potentially economic mineralization was discovered.
Outlook
Development activities are continuing related to the environmental and socio-economic assessment
process and consultations with the goal of obtaining all necessary permits for mine development by mid-
2013. Capital spending for 2012 is projected at $4.3 million on environmental assessment and permitting
activities and $2.0 million in basic engineering to support further project development and permitting
Minimal exploration work is planned for Kutcho in 2012 while the Company focuses on permitting and
detailed engineering activities.
Summary of Quarterly Results
The following table sets out selected quarterly unaudited interim consolidated financial information of the
Company and is derived from unaudited interim consolidated financial statements prepared by the
Company’s management. The Company’s interim financial statements are prepared in accordance with
IFRS.
Period Net
revenues ($ millions)
Gain (loss) on
derivative
instruments ($ millions)
Gain on
disposal of
investments
Net earnings
for the period ($ millions)
Basic
earnings per
share ($)
4th Quarter 2011 61.5 0.7 - 4.9 0.01
3rd
Quarter 2011 90.1 8.9 - 21.1 0.06
2nd
Quarter 2011 73.4 0.1 0.1 19.0 0.08
1st Quarter 2011 102.9 (1.3) 1.3 18.9 0.09
4th Quarter 2010 47.9 (15.4) 12.2 8.5 0.04
3rd
Quarter 2010 84.4 (21.2) 3.0 6.6 0.03
2nd
Quarter 2010 63.4 29.1 11.0 44.7 0.23
1st Quarter 2010 78.3 (8.0) - 14.8 0.07
Over the last eight quarters, an increase in metal prices has provided higher net revenues, but this metal
price increase has resulted in the recording of a loss on the mark-to-market of derivative instruments
which has had a negative impact on the Company’s net earnings. As well, in recent quarters, higher
depletion and amortization related to the Minto Mine deferred stripping has impacted net earnings.
Revenue in the 4th Quarter 2010 was negatively impacted as a lower volume of metal was sold by Minto
as barge transportation across the Yukon River closed earlier than normal due to low water levels. The
Company has also recorded gains on the disposal of investments in certain quarters.
Liquidity and Financial Position Review
Working Capital
Working capital was $533.1 million at December 31, 2011 compared with $177.0 million at December
31, 2010. The major components of the working capital at December 31, 2011 included $486.3 million of

1 These are alternative performance measures: please see “Alternative Performance Measures” below. Page 19
cash and cash equivalents, $29.1 of receivables and $48.3 million of inventories offset by $33.5 million in
current liabilities.
Current Assets
Current assets were $277.5 million higher at $566.6 million at December 31, 2011 compared with $289.1
million at December 31, 2010. The largest component of the increase was in cash and cash equivalents,
which increased to $486.3 million from $166.0 million. During the Current Period, the Company paid
$71.8 million related to the Far West acquisition, received net proceeds of $194.2 million on the
subsequent sale of 30% of Far West to KORES and received gross proceeds of $178.0 million from a
private placement with KORES. Short-term investments of $20.0 million matured and $6.4 million of
restricted cash was released. Inventories decreased by $18.9 million due mainly to the reduction in
concentrate inventory at the Minto Mine.
Investments
The investment balance at December 31, 2011 was $0.2 million compared with $2.7 million at December
31, 2010. The investments December 31, 2011 consisted of shares of Northern Tiger Resources.
Mineral Properties, Plant and Equipment
Mineral properties, plant and equipment increased to $782.9 million in the Current Period from $324.9
million at December 31, 2010. This increase of $458.0 is comprised of the following:
Additions - $577.8 million;
o Acquisition of Far West - $492.3 million;
Mineral properties - $492.0 million,
Plant and equipment - $0.3 million
o Deferred stripping at the Minto Mine - $39.9 million,
o Exploration and evaluation - $28.6 million;
Minto Mine - $7.2 million,
Cozamin Mine - $10.1 million,
Kutcho Copper - $4.3 million,
Santo Domingo - $6.4 million
Capstone - $0.6 million
o Plant, equipment and construction in progress - $16.1 million;
Minto Mine - $8.4 million,
Cozamin Mine - $6.8 million,
Capstone Corporate - $0.5 million
Santo Domingo - $0.4 million
Reduction to the Santo Domingo carrying value on partial disposition to KORES - $44.9 million,
Disposals - $0.7 million,
Depletion and amortization - $75.3 million;
o Mineral properties - $17.9 million,
o Deferred stripping at the Minto Mine - $34.2 million,
o Development costs - $2.5 million,
o Plant property and equipment - $16.4 million.
o Facilities and equipment under finance leases - $4.3 million.
Translation adjustments decrease - $5.7 million;
o On the weakening of the Canadian dollar against the US dollar.
Deferred Income Tax Asset
The deferred income tax asset of $1.0 million at December 31, 2011 is related mainly to the excess of
accounting values over the tax basis of the accounting accruals in the Mexican subsidiaries.
Current Liabilities
Current liabilities decreased by $78.7 million to $33.5 million at December 31, 2011 from $112.2 million
at December 31, 2010. The decrease was mainly due to the repayments of the Minto inventory

1 These are alternative performance measures: please see “Alternative Performance Measures” below. Page 20
concentrate advance facility ($33.3 million) and the reduction of the derivative instruments liability
($41.2 million) with the reduction of derivative positions and entering into forward purchase contracts to
offset the outstanding forward sales contracts.
Derivative Instruments
As at December 31, 2011, the Company recognized a derivative instrument asset of $3.4 million and
liability of $2.7 million (December 31, 2010 – asset of $15.2 million and liability of $51.1 million) for the
Company’s forward metal contracts, of which a $1.6 million asset and $1.1 million liability (December
31, 2010 – asset of $11.6 million and liability of $42.3 million) relate to derivative contracts maturing in
less than one year, and a $1.9 million asset and $1.6 million liability (December 31, 2010 – asset of $3.6
million and liability of $8.8 million) relate to derivative contracts with a maturity date greater than one
year.
Deferred Revenue
The Company’s deferred revenue at the end of the Current Period of $46.6 million ($60.7 million at
December 31, 2010) relates to the two precious metal sales agreements that were entered into with Silver
Wheaton Corp.. This amount will be amortized to revenue as the related delivery obligations under these
agreements are met. During the Current Period, $13.7 million was amortized to gross sales revenue,
combined with a negative foreign currency translation adjustment of $0.4 million.
Macquarie Bank Limited loan facilities
In October 2006, Minto received credit approval from Macquarie Bank Limited (“Macquarie”) for a debt
package comprised of a $57.8 million Project Loan Facility (“PLF”) and a C$20.0 million subordinated
loan facility (“SLF”). The final repayment of the PLF occurred on December 31, 2009 and the final
repayment of the SLF occurred on December 31, 2010.
The PLF and SLF were secured against the Minto Mine and Kutcho project, with the Company pledging
its shares in Minto and Kutcho Copper as security for the loans. As at December 31, 2011, the PLF and
SLF security was in the process of being removed following the extinguishment of the associated price
protection program of copper forward metal sales.
Bank of Nova Scotia Loan Facility
On January 16, 2009, Capstone completed a $40.0 million corporate revolving term credit facility with
The Bank of Nova Scotia (the "RTF"). Under the terms of the RTF, the funds are re-drawable over a
three year term, subject to a reduction of $8.0 million every six months commencing on the first
anniversary, and it attracts an interest rate of US LIBOR plus 3.5% (adjustable in certain circumstances).
At December 31, 2011, the available credit under the RTF was $16.0 million, of which C$15.0 million
was used to support a Letter of Credit in favour of the Yukon Territory Government for the Company’s
reclamation obligations at the Minto Mine.
During 2011, the RTF was amended to cancel the July 2011 planned $8.0 million reduction, fixing the
amount drawable at $16.0 million until the end of the term. Also during 2011, the RTF was further
amended to extend the term to March 31, 2012.
The RTF is secured against the present and future real and personal property, assets and undertakings of
Capstone other than the security already pledged against the PLF, SLF and the Power Purchase
Agreement (“PPA”) with Yukon Energy Corporation (“YEC”). The lender requires certain ratios related
to debt and interest coverage. Failure to meet these covenants could result in repayment and termination
of the RTF. At December 31, 2011, the Company was in compliance with all covenants.
Yukon Energy Corporation capital cost contribution
In February 2007, Minto executed the PPA with YEC. Under the terms of the agreement, Minto agreed
to make payments representing its capital cost contribution on the Carmacks-Minto Landing portion of
the main power line. These payments carry an interest rate of 6.5% on a stated principal of C$7.2 million.
As per the repayment schedule, the monthly payments during the first 48 months will represent interest
only on the principal, followed by equal blended payments of interest and principal during the ensuing 60
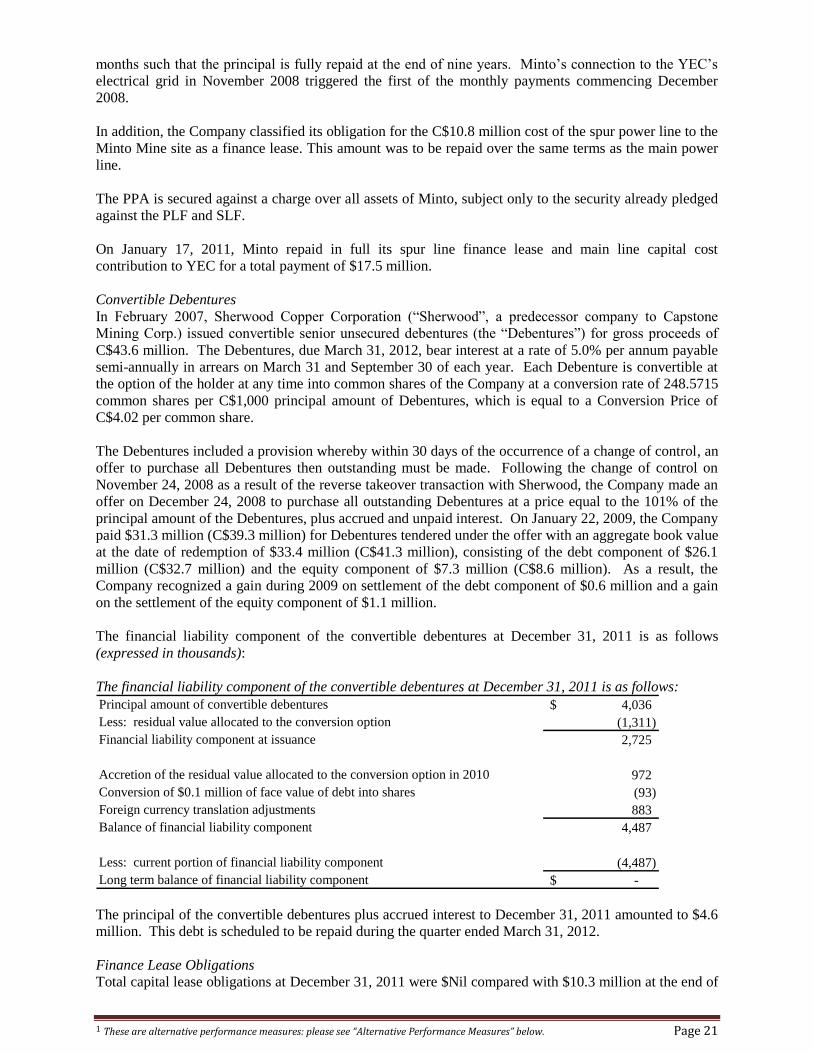
1 These are alternative performance measures: please see “Alternative Performance Measures” below. Page 21
months such that the principal is fully repaid at the end of nine years. Minto’s connection to the YEC’s
electrical grid in November 2008 triggered the first of the monthly payments commencing December
2008.
In addition, the Company classified its obligation for the C$10.8 million cost of the spur power line to the
Minto Mine site as a finance lease. This amount was to be repaid over the same terms as the main power
line.
The PPA is secured against a charge over all assets of Minto, subject only to the security already pledged
against the PLF and SLF.
On January 17, 2011, Minto repaid in full its spur line finance lease and main line capital cost
contribution to YEC for a total payment of $17.5 million.
Convertible Debentures
In February 2007, Sherwood Copper Corporation (“Sherwood”, a predecessor company to Capstone
Mining Corp.) issued convertible senior unsecured debentures (the “Debentures”) for gross proceeds of
C$43.6 million. The Debentures, due March 31, 2012, bear interest at a rate of 5.0% per annum payable
semi-annually in arrears on March 31 and September 30 of each year. Each Debenture is convertible at
the option of the holder at any time into common shares of the Company at a conversion rate of 248.5715
common shares per C$1,000 principal amount of Debentures, which is equal to a Conversion Price of
C$4.02 per common share.
The Debentures included a provision whereby within 30 days of the occurrence of a change of control, an
offer to purchase all Debentures then outstanding must be made. Following the change of control on
November 24, 2008 as a result of the reverse takeover transaction with Sherwood, the Company made an
offer on December 24, 2008 to purchase all outstanding Debentures at a price equal to the 101% of the
principal amount of the Debentures, plus accrued and unpaid interest. On January 22, 2009, the Company
paid $31.3 million (C$39.3 million) for Debentures tendered under the offer with an aggregate book value
at the date of redemption of $33.4 million (C$41.3 million), consisting of the debt component of $26.1
million (C$32.7 million) and the equity component of $7.3 million (C$8.6 million). As a result, the
Company recognized a gain during 2009 on settlement of the debt component of $0.6 million and a gain
on the settlement of the equity component of $1.1 million.
The financial liability component of the convertible debentures at December 31, 2011 is as follows
(expressed in thousands):
The financial liability component of the convertible debentures at December 31, 2011 is as follows:
Principal amount of convertible debentures 4,036$
Less: residual value allocated to the conversion option (1,311)
Financial liability component at issuance 2,725
Accretion of the residual value allocated to the conversion option in 2010 972
Conversion of $0.1 million of face value of debt into shares (93)
Foreign currency translation adjustments 883
Balance of financial liability component 4,487
Less: current portion of financial liability component (4,487)
Long term balance of financial liability component -$
The principal of the convertible debentures plus accrued interest to December 31, 2011 amounted to $4.6
million. This debt is scheduled to be repaid during the quarter ended March 31, 2012.
Finance Lease Obligations
Total capital lease obligations at December 31, 2011 were $Nil compared with $10.3 million at the end of

1 These are alternative performance measures: please see “Alternative Performance Measures” below. Page 22
December 31, 2010. The 2010 obligation was related to the Minto Spur Line which was repaid in January
2011.
Deferred Income Tax Liability
The deferred income tax liability of $41.5 million at December 31, 2011 is related mainly to the excess of
accounting values over tax basis resulting from the merger between Capstone and Sherwood. In addition,
the excess of accounting values over the tax basis of the inventory and property, mineral properties, plant
and equipment contributed to the amount of the future income tax liability.
Reclamation and Closure Cost Obligations and Other
Reclamation and closure cost and other obligations of $21.6 million represents the present value of the
future reclamation and severance costs of the Cozamin Mine of $7.9 million, the future reclamation costs
at the Minto Mine of C$13.8 million and the Kutcho Project of C$0.1 million.
The Cozamin Mine closure plan does not have formal approval of the regulatory authorities. There is
currently no regulatory mechanism in Mexico which contemplates formal approval of closure plans or for
a formal sign-off on completion of planned closure activities. The closure plan for the Cozamin Mine has
been provided to the Mexican government, and both closure cost updates and a report on reclamation
completed are submitted annually or each six months, respectively, to the regulators. The estimated
undiscounted value of the reclamation obligation at December 31, 2011 was $5.5 million. At present,
funding of the obligation is not required.
The Minto Mine submitted a revised closure plan to the regulatory authorities in September 2009 which
received approval in the third quarter of 2010. The revised plan includes a water treatment plant that was
not considered in the previous plan, longer post closure water treatment and monitoring and an increase in
surface disturbance. At December 31, 2011, the estimated undiscounted value of the obligation was
C$13.8 million. C$15.0 million in funding by way of a letter of credit has been provided to the Yukon
Territory Government for security related to this obligation.
Equity
Total equity at December 31, 2011 increased to $1,274.9 million from $377.7 million at December 31,
2010. The $897.2 million increase was due to:
Share capital increased by $604.1 million on the following:
o Issuance of 128.8 million shares on the acquisition of Far West Mining at a value of
$408.6 million,
o Private placement of with KORES of 40.2 million shares for $178.0 million,
o $18.1 million on the exercise of options,
o $0.3 million for shares issued for compensation,
o $0.3 million on the purchase of mineral properties, and
o Net share issuance related costs of $1.1 million.
Reserve for equity settled share based transactions increased by $23.9 million due mainly to the
conversion of Far West options and warrants to Capstone option and warrants,
Investment revaluation reserve decreased by $1.1 million,
Foreign currency translation reserve decreased by $22.7 million, and
Retained earnings increased by $60.4 million on the net earnings in the Current Period.
Non-controlling interest $232.5 million related to KORES’s 30% interest in the assets of Far
West.
Financial Capability
The Company’s long term success and ability to service its ongoing obligations and cover anticipated
corporate, exploration and development costs is dependent on the Cozamin and Minto mines continuing
to generate positive cash flow, the current cash balances and the KORES obligation to arrange financing
for 65% of the Santo Domingo project based on the feasibility study. At this time, based on the current
metal prices, production forecasts and current working capital, the Company believes it has the financial
capability to meet its obligations for planned development, exploration, capital, operational and corporate

1 These are alternative performance measures: please see “Alternative Performance Measures” below. Page 23
activities for the next twelve months.
Capital management
The Company considers that its capital consists of the items included in shareholders’ equity, short term
credit facilities, long term debt, finance lease obligations, net of cash and cash equivalents, short-term
deposits, and long-term investments. The Company manages the capital structure and makes adjustments
in light of changes in economic conditions and the risk characteristics of the Company’s assets.
The Company’s capital management objectives are intended to safeguard the entity’s ability to support
the Company’s normal operating requirements on an ongoing basis as well as continue the development
and exploration of its mineral properties and support any expansionary plans.
To effectively manage its capital requirements, the Company has in place a planning and budgeting
process to help determine the funds required to ensure the Company has the appropriate liquidity to meet
its operating and growth objectives. The Company ensures that there are sufficient committed loan
facilities to meet its short term business requirements, taking into account its anticipated operational cash
flows and its cash and cash equivalents, short-term deposits and long-term investments.
The RTF contains various financial covenants, including: a) an interest coverage ratio; b) a leverage
ratio; and c) a tangible net worth requirement. As at December 31, 2011, the Company is in compliance.
Contractual Obligations and Commitments
The following table summarizes at December 31, 2011 certain contractual obligations for the periods
specified: 2012 2013 2014 2015 2016 2017+ Total ($ millions)
Debt 4.6 - - - - - 4.6
Operating leases 0.7 0.8 0.8 0.8 0.8 0.2 4.1
Purchase obligations 2.9 - - - - - 2.9
Reclamation 0.6 0.5 0.6 0.8 1.8 18.4 22.7
Total 8.8 1.3 1.4 1.6 2.6 18.6 34.3
Commitments
Agreements with the Selkirk First Nation
Under the terms of a revised co-operation agreement between Minto and the Selkirk First Nation
(“Selkirk”) dated October 15, 2009, the Company has made various commitments to Selkirk to enhance
Selkirk participation in the Minto Mine, including a variable net sales royalty on production from the
Minto Mine that fluctuates with the price of copper, as well as various commitments in respect of
employment, contracting, training, and scholarship opportunities.
In June 2006, the Company entered into five leases with Selkirk for the use of the surface areas in and
around the planned development of the Minto Project. The leases have a term of ten years and three
months, expiring June 30, 2016. The total annual rent payable under the terms of these leases is $0.1
million.
Off-take agreements
The Company has a concentrate off-take agreement with a third party whereby the third party will
purchase 100% of the concentrate produced by the Minto Mine up to the end of December 2013. As part
of the agreement, the third party has provided Minto with an inventory financing facility.
The Company has a concentrate off-take agreement with a third party whereby the third party will
purchase 100% of the copper concentrate produced by the Cozamin Mine up to the end of December
2013.
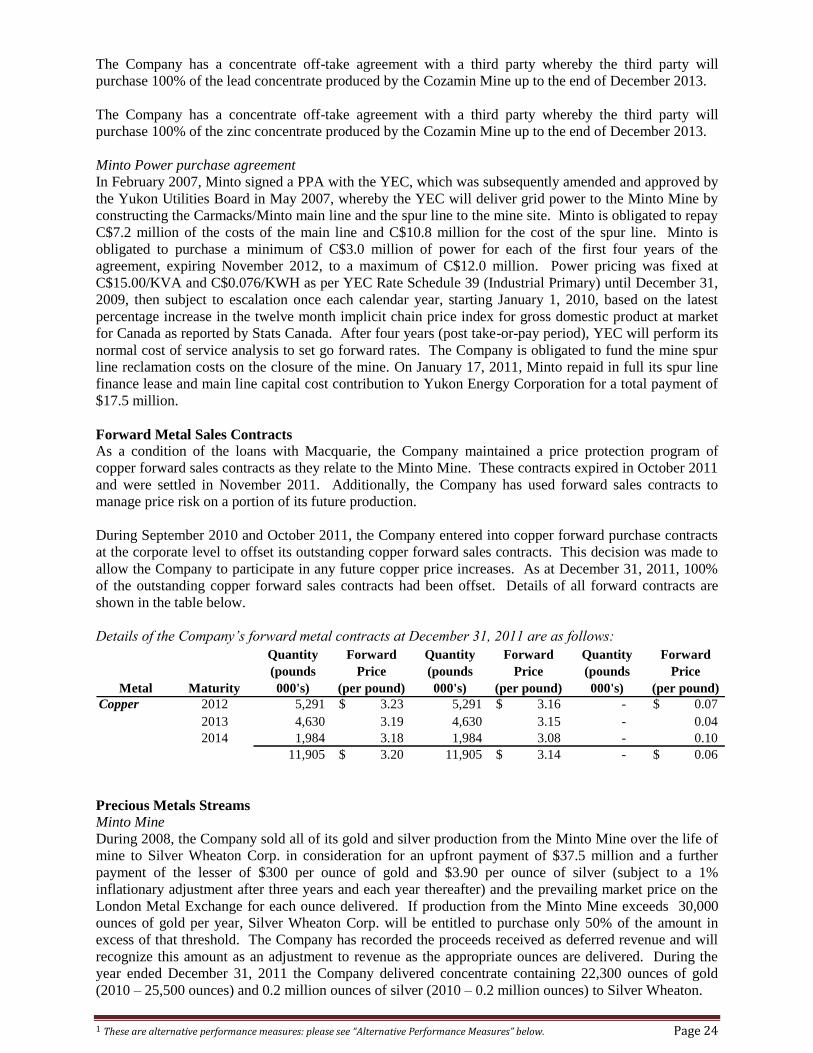
1 These are alternative performance measures: please see “Alternative Performance Measures” below. Page 24
The Company has a concentrate off-take agreement with a third party whereby the third party will
purchase 100% of the lead concentrate produced by the Cozamin Mine up to the end of December 2013.
The Company has a concentrate off-take agreement with a third party whereby the third party will
purchase 100% of the zinc concentrate produced by the Cozamin Mine up to the end of December 2013.
Minto Power purchase agreement
In February 2007, Minto signed a PPA with the YEC, which was subsequently amended and approved by
the Yukon Utilities Board in May 2007, whereby the YEC will deliver grid power to the Minto Mine by
constructing the Carmacks/Minto main line and the spur line to the mine site. Minto is obligated to repay
C$7.2 million of the costs of the main line and C$10.8 million for the cost of the spur line. Minto is
obligated to purchase a minimum of C$3.0 million of power for each of the first four years of the
agreement, expiring November 2012, to a maximum of C$12.0 million. Power pricing was fixed at
C$15.00/KVA and C$0.076/KWH as per YEC Rate Schedule 39 (Industrial Primary) until December 31,
2009, then subject to escalation once each calendar year, starting January 1, 2010, based on the latest
percentage increase in the twelve month implicit chain price index for gross domestic product at market
for Canada as reported by Stats Canada. After four years (post take-or-pay period), YEC will perform its
normal cost of service analysis to set go forward rates. The Company is obligated to fund the mine spur
line reclamation costs on the closure of the mine. On January 17, 2011, Minto repaid in full its spur line
finance lease and main line capital cost contribution to Yukon Energy Corporation for a total payment of
$17.5 million.
Forward Metal Sales Contracts
As a condition of the loans with Macquarie, the Company maintained a price protection program of
copper forward sales contracts as they relate to the Minto Mine. These contracts expired in October 2011
and were settled in November 2011. Additionally, the Company has used forward sales contracts to
manage price risk on a portion of its future production.
During September 2010 and October 2011, the Company entered into copper forward purchase contracts
at the corporate level to offset its outstanding copper forward sales contracts. This decision was made to
allow the Company to participate in any future copper price increases. As at December 31, 2011, 100%
of the outstanding copper forward sales contracts had been offset. Details of all forward contracts are
shown in the table below.
Details of the Company’s forward metal contracts at December 31, 2011 are as follows:
Metal Maturity
Quantity
(pounds
000's)
Forward
Price
(per pound)
Quantity
(pounds
000's)
Forward
Price
(per pound)
Quantity
(pounds
000's)
Forward
Price
(per pound)
Copper 2012 5,291 3.23$ 5,291 3.16$ - 0.07$
2013 4,630 3.19 4,630 3.15 - 0.04
2014 1,984 3.18 1,984 3.08 - 0.10
11,905 3.20$ 11,905 3.14$ - 0.06$
Precious Metals Streams
Minto Mine
During 2008, the Company sold all of its gold and silver production from the Minto Mine over the life of
mine to Silver Wheaton Corp. in consideration for an upfront payment of $37.5 million and a further
payment of the lesser of $300 per ounce of gold and $3.90 per ounce of silver (subject to a 1%
inflationary adjustment after three years and each year thereafter) and the prevailing market price on the
London Metal Exchange for each ounce delivered. If production from the Minto Mine exceeds 30,000
ounces of gold per year, Silver Wheaton Corp. will be entitled to purchase only 50% of the amount in
excess of that threshold. The Company has recorded the proceeds received as deferred revenue and will
recognize this amount as an adjustment to revenue as the appropriate ounces are delivered. During the
year ended December 31, 2011 the Company delivered concentrate containing 22,300 ounces of gold
(2010 – 25,500 ounces) and 0.2 million ounces of silver (2010 – 0.2 million ounces) to Silver Wheaton.

1 These are alternative performance measures: please see “Alternative Performance Measures” below. Page 25
Cozamin Mine
Under its April 2007 agreement with Silver Wheaton Corp. the Company has a commitment to sell the
Cozamin Mine’s silver production over a 10 year period to Silver Wheaton. Under the terms of the
arrangement, Silver Wheaton agreed to pay for each ounce of refined silver from the mine the lesser of
$4.04 per ounce of silver and the prevailing market price on the London Metal Exchange for each ounce
of silver, subject to price adjustments, of which the effects are being reviewed and not determinable at
this time. Further, the Company agreed to deliver a minimum of 10.0 million ounces of silver to
Silverstone over a ten year period. If, at the end of ten years, the Company has not delivered the agreed
upon 10 million ounces of silver, then it has agreed to pay Silver Wheaton $1.00 per ounce of silver not
delivered. During 2011 the Company delivered 1.4 million ounces of silver (2010 – 1.4 million ounces).
To December 31, 2011 a total of 5.9 million ounces had been delivered against the contract since its
inception. The Company has recorded this commitment (which represents an obligation to deliver silver
at other than market rates) at its estimated fair value on the date of acquisition of the Cozamin Mine. The
value assigned to the commitment is recorded as an adjustment to revenue as the related ounces are
delivered.
Details of changes in the balance of deferred revenue are as follows ($ millions):
Balance, December 31, 2010 60.7$
Amortization on delivery of gold and silver (13.7)$
Currency translation adjustments (0.4)$
Balance, December 31, 2011 46.6$
Balance, January 1, 2010 73.5$
Amortization on delivery of gold and silver (14.4)$
Currency translation adjustments 1.6$
Balance, December 30, 2010 60.7$ Risks and Uncertainties
The Company is subject to a number of significant risks due to the nature of its business and the present
stage of its business development. Readers should carefully consider the risks and uncertainties described
below before deciding whether to invest in the Company Capstone common shares. The Company’s
failure to successfully address the risks and uncertainties described below could have a material adverse
effect on its business, financial condition and/or results of operations, and the trading price of its common
shares may decline and investors may lose all or part of their investment. The Company cannot give
assurance that it will successfully address these risks or other unknown risks that may affect its business.
Mining is inherently dangerous and subject to conditions or events beyond the Company’s control, the
occurrence of which could have a material adverse effect on the Company’s business, financial condition,
results of operations and prospects.
The Company’s operations are subject to all the hazards and risks normally encountered in the
exploration, development and production of copper and other metals, including, without limitation, fires,
power outages, labour disruptions, flooding, explosions, cave-ins, landslides and other geotechnical
instabilities, metallurgical and other processing problems and other conditions involved in the mining of
minerals, any of which could result in damage to, or destruction of, the Company’s mines, plants and
equipment, personal injury or loss of life, environmental damage, delays in mining, increased production
costs, asset write-downs, monetary losses and legal liability. The occurrence of any of these events could
result in a prolonged interruption in the Company’s operations that would have a material adverse effect
on the Company’s business, financial condition, results of operations and prospects.
Changes in the market price of copper and other metals, which in the past have fluctuated widely, could
negatively affect the profitability of the Company’s operations and financial condition.
The commercial viability of the Company’s properties and the Company’s ability to sustain operations is
dependent on, among other things, the market price of copper, lead, zinc, gold and silver. Depending on
the price to be received for any minerals produced, the Company may determine that it is impractical to

1 These are alternative performance measures: please see “Alternative Performance Measures” below. Page 26
continue commercial production at the Cozamin Mine or the Minto Mine or to develop the Santo
Domingo Project or the Kutcho Project. A reduction in the market price of copper, lead, zinc, gold or
silver may prevent the Company’s properties from being economically mined or result in the write-off of
assets whose value is impaired as a result of low metals prices. The market price of copper, lead, zinc,
gold and silver is volatile and is impacted by numerous factors beyond the Company’s control, including,
among others:
international economic and political conditions;
expectations of inflation or deflation;
international currency exchange rates;
interest rates;
global or regional consumptive patterns;
speculative activities;
levels of supply and demand;
increased production due to new mine developments;
decreased production due to mine closures;
improved mining and production methods;
availability and costs of metal substitutes;
metal stock levels maintained by producers and others; and
inventory carrying costs.
The effect of these factors on the price of base and precious metals cannot be accurately predicted and
there can be no assurance that the market price of these metals will remain at current levels or that such
prices will improve. A decrease in the market price of copper, lead, zinc, gold and/or silver would affect
the profitability of the Cozamin Mine and the Minto Mine and could affect the Company’s ability to
finance the exploration and development of the Company’s other properties, which would have a material
adverse effect on the Company’s business, financial condition, results of operations and prospects.
The sale of the Company’s metals is subject to counterparty and market risks.
The Company has entered into concentrate off-take agreements whereby 100% of the concentrate
produced from the Minto Mine and 100% of the copper, lead and zinc concentrate produced from the
Cozamin Mine are purchased, and 50% of the copper and iron concentrate to be produced from the Santo
Domingo Project will be purchased, by various counterparties. The Company has also sold forward all of
the Company’s gold and silver production from the Minto Mine and all of the Company’s silver
production from the Cozamin Mine to Silver Wheaton. If any counterparty to any off-take or forward
sales agreement does not honour such arrangement, or should any such counterparty become insolvent,
the Company may incur losses for concentrate or gold and silver already shipped and be forced to sell all
of the Company’s concentrate, gold and/or silver, or a greater volume than the Company intended, in the
spot market, which is subject to market price fluctuations. In addition, there can be no assurance that the
Company will be able to renew any of the Company’s off-take or forward sales agreements on acceptable
terms, or at all, or that the Company’s production will meet the qualitative requirements under such
agreements.
The Company may require substantial additional capital to accomplish the Company’s exploration and
development plans, and there can be no assurance that financing will be available on terms acceptable to
the Company, or at all.
The Company may require substantial additional financing to accomplish the Company’s exploration and
development plans for the Santo Domingo Project and the Kutcho Project and to advance the Cozamin
Mine and the Minto Mine to achieve designed production rates. These financing requirements could
adversely affect the Company’s credit ratings and the Company’s ability to access the capital markets in
the future. Failure to obtain sufficient financing, or financing on terms acceptable to the Company, may
result in a delay or indefinite postponement of exploration, development or production at one or more of
the Company’s properties. Additional financing may not be available when needed and the terms of any
agreement could impose restrictions on the operation of the Company’s business. Failure to raise
financing when needed could have a material adverse effect on the Company’s business, financial
condition, results of operations and prospects.

1 These are alternative performance measures: please see “Alternative Performance Measures” below. Page 27
Fluctuations in foreign currency exchange rates could have an adverse effect on the Company’s business,
financial condition, results of operations and prospects.
Fluctuations in the Canadian dollar or Mexican peso relative to the U.S. dollar could significantly affect
the Company’s business, financial condition, results of operations and prospects. Exchange rate
movements can have a significant impact on the Company as all of the Company’s revenue is received in
U.S. dollars but most of the Company’s operating and capital costs are incurred in Canadian dollars and
Mexican pesos. Also, as a result of the Company’s acquisition of Far West, the Company is exposed to
currency fluctuations in the Chilean peso relating to expenditures for the Santo Domingo Project. As a
result, a strengthening of these currencies relative to the U.S. dollar will reduce the profitability of the
Company’s projects and affect the Company’s ability to continue to finance the Company’s operations.
The Company does not currently, and does not expect to, enter into foreign currency contracts to hedge
against currency risk.
The Company’s calculations of mineral resources and mineral reserves are estimates and are subject to
uncertainty.
The Company’s calculations of mineral resources and mineral reserves are estimates and depend upon
geological interpretation and statistical inferences drawn from drilling and sampling analysis, which may
prove to be inaccurate. Actual recoveries of copper, lead, zinc, gold and silver from mineralized material
may be lower than those indicated by test work. Any material change in the quantity of mineralization,
grade or stripping ratio, may affect the economic viability of the Company’s properties. In addition, there
can be no assurance that metal recoveries in small-scale laboratory tests will be duplicated in larger scale
tests under on-site conditions or during production. Notwithstanding pilot plant tests for metallurgy and
other factors, there remains the possibility that the ore may not react in commercial production in the
same manner as it did in testing. Mining and metallurgy are inexact sciences and, accordingly, there
always remains an element of risk that a mine may not prove to be commercially viable.
Until a deposit is actually mined and processed, the quantity of mineral resources and mineral reserves
and grades must be considered as estimates only. In addition, the quantity of mineral resources and
mineral reserves may vary depending on, among other things, metal prices, cut-off grades and operating
costs. Any material change in quantity of mineral reserves, mineral resources, grade, percent extraction
of those mineral reserves recoverable by underground mining techniques or the stripping ratio for those
mineral reserves recoverable by open pit mining techniques may affect the economic viability of the
Company’s mining projects.
The Company is dependent on key management personnel.
The Company is very dependent upon the personal efforts and commitment of the Company’s existing
management and the Company’s current operations and future prospects depend on the experience and
knowledge of these individuals. To the extent that one or more of the Company’s members of
management are unavailable for any reason, or should the Company lose the services of any of them, a
disruption to the Company’s operations could result, and there can be no assurance that the Company will
be able to attract and retain a suitable replacement.
General economic conditions or changes in consumption patterns may adversely affect the Company’s
growth and profitability.
Many industries, including the base and precious metals mining industry, are impacted by global market
conditions. Some of the key impacts of the recent financial market turmoil include contraction in credit
markets resulting in a widening of credit risk, devaluations and high volatility in global equity,
commodity, foreign exchange and metals markets, and a lack of market liquidity. A continued or
worsened slowdown in the financial markets or other economic conditions, including, but not limited to,
reduced consumer spending, increased unemployment rates, deteriorating business conditions, inflation,
deflation, volatile fuel and energy costs, increased consumer debt levels, lack of available credit, changes
in interest rates and changes in tax rates may adversely affect the Company’s growth and profitability
potential. Specifically:
a global credit/liquidity issue could impact the cost and availability of financing and the
Company’s overall liquidity;
volatility of copper, lead, zinc, gold and/or silver prices may impact the Company’s future

1 These are alternative performance measures: please see “Alternative Performance Measures” below. Page 28
revenues, profits and cash flows;
recessionary pressures could adversely impact demand for the Company’s production;
volatile energy prices, commodity and consumables prices and currency exchange rates could
negatively impact potential production costs; and
devaluation and volatility of global stock markets could impact the valuation of the Company’s
securities, which may impact the Company’s ability to raise funds through future issuances of
equity.
These factors could have a material adverse effect on the Company’s business, financial condition, results
of operations and prospects.
There are uncertainties and risks related to the start-up of operations at the Santo Domingo Project and
the Kutcho Project, and if the construction and development of these projects are not completed, it could
adversely affect the Company’s business, financial condition, results of operations and prospects.
As part of the Company’s strategy, the Company will continue the Company’s efforts to develop new
mineral projects, including the Santo Domingo Project and the Kutcho Project. Development of these
projects will require obtaining permits and financing, and the construction and operation of mines,
processing plants and related infrastructure. As a result, the Company will be subject to all of the risks
associated with establishing new mining operations, including:
the timing and cost, which can be considerable, of the construction of mining and processing
facilities and related infrastructure;
the availability and cost of skilled labour, mining equipment and principal supplies needed for
operations, including explosives, fuels, chemical reagents, water, power, equipment parts and
lubricants;
the availability and cost of appropriate smelting and refining arrangements;
the need to obtain necessary environmental and other governmental approvals and permits and
the timing of the receipt of those approvals and permits;
the availability of funds to finance construction and development activities;
industrial accidents;
mine failures, shaft failures or equipment failures;
natural phenomena such as inclement weather conditions, floods, droughts, rock slides and
seismic activity;
unusual or unexpected geological and metallurgic conditions;
exchange rate and commodity price fluctuations;
potential opposition from non-governmental organizations, environmental groups or local groups,
which may delay or prevent development activities; and
restrictions or regulations imposed by governmental or regulatory authorities.
The costs, timing and complexities of developing the Company’s projects may be greater than anticipated.
Cost estimates may increase significantly as more detailed engineering work is completed on a project. It
is common in mining operations to experience unexpected costs, problems and delays during
construction, development and mine start-up. Accordingly, the Company cannot provide assurance that
the Company’s activities will result in profitable mining operations at the Company’s mineral properties.
If there are significant delays in when these projects are completed and are producing on a commercial
and consistent scale, and/or their capital costs were to be significantly higher than estimates, these events
could have a significant adverse effect on the Company’s results of operation, cash flow from operations
and financial condition.
High metal prices in recent years have encouraged increased mineral exploration, development and
production activity, which has increased demand for, and cost of, exploration, development and
construction services and equipment.
High metal prices in recent years have encouraged increases in mineral exploration, development and
production activities, which has resulted in increased demand for, and cost of, exploration, development
and construction services and equipment. There has also been a shortage of skilled workers in the mining
industry in recent years, particularly with respect to experienced mine construction and mine management
personnel. In addition, employee turnover rates in the mining industry have increased as participants in
the minerals industry compete for skilled personnel. Increased demand for services and equipment could

1 These are alternative performance measures: please see “Alternative Performance Measures” below. Page 29
result in delays if services or equipment cannot be obtained in a timely manner due to inadequate
availability, and may cause scheduling difficulties due to the need to coordinate the availability of
services or equipment, any of which could materially increase the Company’s project exploration and any
development and/or construction costs. Increases in both operating and capital costs must be factored into
economic assessments of existing and proposed mining projects. These increases may increase the
financing requirements for such projects or render such projects uneconomic.
Mineral rights or surface rights to the Company’s properties could be challenged, and, if successful, such
challenges could have a material adverse effect on the Company’s production and the Company’s
business, financial condition, results of operations and prospects.
Title to the Company’s properties may be challenged or impugned. The Company’s property interests
may be subject to prior unregistered agreements or transfers and title may be affected by undetected
defects. Surveys have not been carried out on the majority of the Company’s properties and, therefore, in
accordance with the laws of the jurisdiction in which such properties are situated, their existence and area
could be in doubt.
A claim by a third party asserting prior unregistered agreements or transfer on any of the Company’s
properties, especially where mineral reserves have been located, could result in the Company losing a
commercially viable property. Even if a claim is unsuccessful, it may potentially affect the Company’s
current operations due to the high costs of defending against the claim and its impact on the Company’s
senior management’s time. Title insurance is generally not available for mineral properties and the
Company’s ability to ensure that the Company has obtained a secure claim to individual mineral
properties or mining concessions may be severely constrained. The Company relies on title information
and/or representations and warranties provided by the Company’s grantors. If the Company loses a
commercially viable property, such a loss could lower the Company’s future revenues or cause the
Company to cease operations if the property represented all or a significant portion of the Company’s
mineral reserves at the time of the loss.
The Company faces added risks and uncertainties as a result of operating in foreign jurisdictions.
The Company’s business operates in a number of foreign countries where there are added risks and
uncertainties due to the different economic, cultural and political environments. The Company’s mineral
exploration and mining activities may be adversely affected by political instability and changes to
government regulation relating to the mining industry. Other risks of foreign operations include political
unrest, labour disputes and unrest, invalidation of governmental orders and permits, corruption, war, civil
disturbances and terrorist actions, arbitrary changes in law or policies of particular countries (including
nationalization of mines), foreign taxation, price controls, delays in obtaining or renewing or the inability
to obtain or renew necessary environmental permits, opposition to mining from environmental or other
non-governmental organizations, limitations on foreign ownership, limitations on the repatriation of
earnings, limitations on mineral exports and increased financing costs. Local economic conditions,
including higher incidences of criminal activity and violence in areas of Mexico and Chile, can also
adversely affect the security of the Company’s operations and the availability of supplies. In addition,
risks of operations in Mexico and Chile include extreme fluctuations in currency exchange rates, high
rates of inflation, hostage taking and expropriation. These risks may limit or disrupt the Company’s
projects, restrict the movement of funds or result in the deprivation of contract rights or the taking of
property by nationalization or expropriation without fair compensation. While the Company believes that
each of the jurisdictions in which the Company’s properties are located represents a favourable
environment for mining companies to operate, there can be no assurance that changes in the government
or laws or changes in the regulatory environment for mining companies or for non-domiciled companies
will not be made that would adversely affect the Company’s business, financial condition, results of
operation and prospects.
It may be difficult for the Company to find and hire qualified people in the mining industry who are
situated in Mexico, Chile and the Yukon or to obtain all of the necessary services or expertise in Mexico,
Chile and the Yukon or to conduct operations on the Company’s projects at reasonable rates. If qualified
people and services or expertise cannot be obtained in Mexico, Chile and the Yukon, the Company may
need to seek and obtain those services from people located outside of these areas, which will require work

1 These are alternative performance measures: please see “Alternative Performance Measures” below. Page 30
permits and compliance with applicable laws and could result in delays and higher costs to conduct
operations in Mexico, Chile and the Yukon.
The Company’s operations are subject to significant governmental regulation, which could significantly
limit the Company’s exploration and production activities.
The Company’s mineral exploration and development activities are subject to governmental approvals
and various laws and regulations governing development, operations, taxes, labour standards and
occupational health, mine safety, toxic substances, land use, water use and land claims affecting local,
First Nations and Aboriginal populations. The liabilities and requirements associated with the laws and
regulations related to these and other matters may be costly and time-consuming and may restrict, delay
or prevent commencement or continuation of exploration or production operations. The Company cannot
assure you that the Company has been or will be at all times in compliance with all applicable laws and
regulations. Failure to comply with applicable laws and regulations may result in the assessment of
administrative, civil and criminal penalties, the imposition of cleanup and site restoration costs and liens,
the issuance of injunctions to limit or cease operations, the suspension or revocation of permits or
authorizations and other enforcement measures that could have the effect of limiting or preventing
production from the Company’s operations. The Company may incur material costs and liabilities
resulting from claims for damages to property or injury to persons arising from the Company’s
operations. If the Company is pursued for sanctions, costs and liabilities in respect of these matters, the
Company’s mining operations and, as a result, the Company’s financial performance, financial position
and results of operations, could be materially and adversely affected.
In addition, no assurance can be given that new rules and regulations will not be enacted or that existing
rules and regulations will not be applied in a manner that could limit or curtail the Company’s
exploration, development or production. Amendments to current laws, regulations and permits governing
operations and activities of mining and exploration companies, or the more stringent implementation
thereof, could have a material adverse impact on the Company and cause increases in the Company’s
exploration expenses, capital expenditures or production costs or a reduction in the levels of production at
the Company’s producing properties or require abandonment or delays in exploring or developing the
Company’s properties.
The Company’s operations are subject to stringent environmental laws and regulations that could
significantly limit the Company’s ability to conduct the Company’s business.
The Company’s operations are subject to various laws and regulations governing the protection of the
environment, exploration, development, production, taxes, labour standards, occupational health, waste
disposal, safety and other matters. Environmental legislation provides for restrictions and prohibitions on
spills, releases or emissions of various substances produced in association with certain mining operations,
such as seepage from tailings disposal areas, which would result in environmental pollution. A breach of
such legislation may result in the imposition of fines and penalties. In addition, certain of the Company’s
operations require the submission and approval of environmental impact assessments. Environmental
legislation is evolving in the direction of stricter standards and enforcement, higher fines and penalties for
non-compliance, more stringent environmental assessments of proposed projects and a heightened degree
of responsibility for companies and their directors, officers and employees. Compliance with changing
environmental laws and regulations may require significant capital outlays, including obtaining additional
permits, and may cause material changes or delays in, or the cancellation of, the Company’s exploration
programs or current operations.
The Company is required to obtain, maintain and renew environmental, construction and mining permits,
which is often a costly and time-consuming process.
Mining companies, including the Company, need many environmental, construction and mining permits,
each of which can be time-consuming and costly to obtain, maintain and renew. In connection with the
Company’s current and future operations, the Company must obtain and maintain a number of permits
that impose strict conditions, requirements and obligations on the Company, including those relating to
various environmental and health and safety matters. To obtain, maintain and renew certain permits, the
Company is required to conduct environmental assessments pertaining to the potential impact of the
Company’s current and future operations upon the environment and to take steps to avoid or mitigate
1 These are alternative performance measures: please see “Alternative Performance Measures” below. Page 31
those impacts. For example, the Kutcho Project must undergo an environmental assessment in order to
obtain an environmental assessment certificate from the British Columbia Environmental Assessment
Office and Canadian Environmental Assessment Agency before making an application for authorization
to conduct development activities and operations. There is a risk that the Kutcho Project will not
successfully complete the environmental assessment process and will be unable to progress to the
development or operational stage.
Permit terms and conditions can also impose restrictions on how the Company conducts the Company’s
operations and limit the Company’s flexibility in developing the Company’s mineral properties. Many of
the Company’s permits are subject to renewal from time to time, and renewed permits may contain more
restrictive conditions than the Company’s existing permits. In addition, the Company may be required to
obtain new permits to expand the Company’s operations, and the grant of such permits may be subject to
an expansive governmental review of the Company’s operations. Alternatively, the Company may not be
successful in obtaining such permits, which could prevent the Company from commencing or expanding
operations or otherwise adversely affect the Company’s business, financial condition, results of operation
and prospects. For instance, although the Minto Mine is currently permitted to conduct operations under
its Quartz Mining Licence and two Water Use Licences, amendments to these licences are required in
order to implement the Company’s planned mine expansion. These amendments may not be granted by
the Yukon regulatory authorities. Further, renewal of the Company’s existing permits or obtaining new
permits may be more difficult if the Company is not able to comply with the Company’s existing permits.
Applications for permits, permit area expansions and permit renewals may be subject to challenge by
interested parties, which can delay or prevent receipt of needed permits. The permitting process can also
vary by jurisdiction in terms of its complexity and likely outcomes.
Accordingly, permits required for the Company’s operations may not be issued, maintained or renewed in
a timely fashion or at all, may be issued or renewed upon conditions that restrict the Company’s ability to
conduct the Company’s operations economically, or may be subsequently revoked. Any such failure to
obtain, maintain or renew permits, or other permitting delays or conditions, including in connection with
any environmental impact analyses, could have a material adverse effect on the Company’s business,
results of operations, financial condition and prospects.
Climatic conditions can affect the Company’s operations at the Minto Mine.
Operations at the Minto Mine may be subject to extreme weather conditions. Unseasonable weather
conditions may preclude normal work patterns and can severely limit the Company’s mining operations,
resulting in additional costs and delays. From 2008 to 2010, the Yukon experienced extreme weather
conditions that resulted in abnormally high run-off at the Minto Mine, exceeding the normal containment
capacity of the mine site. As a result, the Company decided to fill the Minto Mine main pit with water,
which caused the Company to cease mining operations until the Company obtained regulatory permission
to discharge the excess waters. Another year of extreme weather in the Yukon could again result in excess
run-off at the mine site, which could have an adverse effect on the results of operations at the Minto Mine
and on the Company’s business, financial condition, results of operation and prospects.
The Company’s directors and officers may have interests that conflict with the Company’s interests.
Certain of the Company’s directors and officers also serve as directors or officers, or have significant
shareholdings in, other companies that are similarly engaged in the business of acquiring, developing and
exploiting natural resource properties. To the extent that such other companies may participate in
ventures which the Company may participate in, or in ventures which the Company may seek to
participate in, the Company’s directors and officers may have a conflict of interest in negotiating and
concluding terms respecting the extent of such participation. In all cases where the Company’s directors
and officers have an interest in other companies, such other companies may also compete with the
Company for the acquisition of mineral property investments. As a result of these conflicts of interest,
the Company may not have an opportunity to participate in certain transactions, which may have a
material adverse effect on the Company’s business, financial condition, results of operation and prospects.
Aboriginal title claims and rights to consultation and accommodation may affect the Company’s existing
operations as well as development projects and future acquisitions.

1 These are alternative performance measures: please see “Alternative Performance Measures” below. Page 32
The nature and extent of First Nations rights and title remains the subject of active debate, claims and
litigation in Canada, including in British Columbia and the Yukon. The Minto Mine lies on Category A
land in the Yukon where the Selkirk First Nation own both surface and subsurface rights. The Kutcho
Project in British Columbia lies within an area claimed as traditional territory by both the Tahltan First
Nation and the Kaska First Nation. There is a risk that any land claim settlement with the Tahltan or the
Kaska may adversely affect the Company’s rights to the Kutcho Project. There can be no guarantee that
the unsettled nature of the land claims in British Columbia and the Yukon will not create delays in project
approval or unexpected interruptions in project progress, or result in additional costs to advance the
Company’s projects. In many cases, environmental assessment, subsequent permitting, development and
operation of proposed projects is only possible with the support of the local First Nations group. In order
to secure such support, the Company may have to take measures to limit the adverse impact to, and ensure
that some of the economic benefits of the construction and mining activity will be enjoyed by, the local
First Nations group. There is a risk that the First Nations may publicly oppose the proposed project at
any stage and this potential opposition may adversely affect the project or the Company’s public image.
Further, Canadian law related to aboriginal rights, including aboriginal title rights, is in a period of
change. There is a risk that future changes to the law may adversely affect the Company’s rights to the
Minto Mine and the Kutcho Project.
The Company’s insurance does not cover all potential losses, liabilities and damage related to the
Company’s business and certain risks are uninsured or uninsurable.
In the course of exploration, development and production of mineral properties, certain risks, including
rock bursts, cave-ins, fires, flooding and earthquakes may occur. It is not always possible to fully insure
against such risks. The Company currently does not have insurance against all such risks and may decide
not to take out insurance against all such risks as a result of high premiums or other reasons. Further,
insurance against certain risks, including those related to environmental matters, is generally not available
to the Company or to other companies within the mining industry. Losses from these events may cause
the Company to incur significant costs that could have a material adverse effect on the Company’s
business, financial condition, results of operation and prospects.
Land reclamation and mine closure requirements may be burdensome and costly.
Land reclamation and mine closure requirements are generally imposed on mining companies, such as the
Company’s, which require the Company, among other things, to minimize the effects of land disturbance.
Such requirements may include controlling the discharge of potentially dangerous effluents from a site
and restoring a site’s landscape to its pre-exploration form. The actual costs of reclamation and mine
closure are uncertain and planned expenditures may differ from the actual expenditures required.
Therefore, the amount that the Company is required to spend could be materially higher than current
estimates. Any additional amounts required to be spent on reclamation and mine closure may have a
material adverse effect on the Company’s financial performance, financial position and results of
operations and may cause the Company to alter the Company’s operations. Although the Company
includes liabilities for estimated reclamation and mine closure costs in the Company’s financial
statements, it may be necessary to spend more than what is projected to fund required reclamation and
mine closure activities.
The Company’s operations will be adversely affected if the Company fails to maintain satisfactory labour
relations.
The Company cannot predict at this time whether the Company will be able to reach new agreements with
the Company’s unionized workforce without a work stoppage or other labour unrest, and any such new
agreements may not be on terms favourable to the Company. Additional groups of non-union employees
may seek union representation in the future. Further, relations with employees may be affected by
changes in the scheme of labour relations that may be introduced by the relevant governmental authorities
in jurisdictions where the Company conducts business. Changes in such legislation or otherwise in the
Company’s relationship with the Company’s employees may result in higher ongoing labour costs,
employee turnover, strikes, lockouts or other work stoppages, any of which could have a material adverse
effect on the Company’s business, results of operations and financial condition.
Increased energy prices could adversely affect the Company’s results of operations and financial

1 These are alternative performance measures: please see “Alternative Performance Measures” below. Page 33
condition.
Mining operations and facilities are intensive users of electricity and carbon-based fuels. Energy prices
can be affected by numerous factors beyond the Company’s control, including global and regional supply
and demand, political and economic conditions, and applicable regulatory regimes. The prices of various
sources of energy may increase significantly from current levels. An increase in energy prices for which
the Company is not hedged could materially adversely affect the Company’s results of operations and
financial condition
The Company may be unable to compete successfully with other mining companies.
The mining industry is competitive in all of its phases. The Company faces strong competition from other
mining companies in connection with the acquisition of properties producing, or capable of producing,
metals. Many of these companies have greater liquidity, greater access to credit and other financial
resources, newer or more efficient equipment, lower cost structures, more effective risk management
policies and procedures and/or a greater ability than the Company to withstand losses. The Company’s
competitors may be able to respond more quickly to new laws or regulations or emerging technologies, or
devote greater resources to the expansion or efficiency of their operations than the Company can. In
addition, current and potential competitors may make strategic acquisitions or establish cooperative
relationships among themselves or with third parties. Accordingly, it is possible that new competitors or
alliances among current and new competitors may emerge and gain significant market share to the
Company’s detriment. The Company may also encounter increasing competition from other mining
companies in the Company’s efforts to hire experienced mining professionals. Increased competition
could adversely affect the Company’s ability to attract necessary capital funding, to acquire it on
acceptable terms, or to acquire suitable producing properties or prospects for mineral exploration in the
future. As a result of this competition, the Company may not be able to compete successfully against
current and future competitors, and any failure to do so could have a material adverse effect on the
Company’s business, financial condition, results of operations and prospects.
The Company may experience difficulties with the Company’s joint venture partners.
The Company currently operate the Santo Domingo Project through a joint venture with KORES and the
Company may in the future enter into additional joint ventures with other partners. The Company is
subject to the risks normally associated with the conduct of joint ventures, which include disagreements
with the Company’s joint venture partners on how to develop, operate and finance the Company’s joint
venture activities, including the Santo Domingo Project, and possible disputes with the Company’s joint
venture partners regarding joint venture matters. These disagreements and disputes may have an adverse
effect on the Company’s ability to successfully pursue joint ventures, including the development of the
Santo Domingo Project, which could affect the Company’s business, financial condition, results of
operation and prospects.
The Company may experience problems integrating new acquisitions into the Company’s existing
operations.
The Company’s success at completing acquisitions will depend on a number of factors, including, but not
limited to, identifying acquisitions that fit the Company’s strategy, negotiating acceptable terms with the
seller of the business or property to be acquired and obtaining approval from regulatory authorities in the
jurisdictions of the business or property to be acquired. Any positive effect on the Company’s results
from the Company’s acquisitions, including the recent Far West acquisition, will depend on a variety of
factors, including, but not limited to, assimilating the operations of an acquired business or property in a
timely and efficient manner, maintaining the Company’s financial and strategic focus while integrating
the acquired business or property, implementing uniform standards, controls, procedures and policies at
the acquired business, as appropriate, and to the extent that the Company makes an acquisition outside of
markets in which the Company has previously operated, conducting and managing operations in a new
operating environment.
Acquiring additional businesses or properties could place increased pressure on the Company’s cash flow
if such acquisitions involve cash consideration or the assumption of obligations requiring cash payments.
The integration of the Company’s existing operations with any acquired business, including the recent Far
West acquisition, will require significant expenditures of time, attention and funds. Achievement of the

1 These are alternative performance measures: please see “Alternative Performance Measures” below. Page 34
benefits expected from consolidation will require the Company to incur significant costs in connection
with, among other things, implementing financial and planning systems. The Company may not be able to
integrate the operations of a recently acquired business or restructure its previously existing business
operations without encountering difficulties and delays. In addition, this integration may require
significant attention from the Company’s management team, which may detract attention from the
Company’s day-to-day operations. Over the short-term, difficulties associated with integration could have
a material adverse effect on the Company’s business, operating results, financial condition and the price
of the Company’s securities. In addition, the acquisition of mineral properties, such as the Santo Domingo
Project, may subject the Company to unforeseen liabilities, including environmental liabilities.
The Company may fail to realize the anticipated benefits of the Far West acquisition, which could have a
material adverse effect on the Company’s business, financial condition and results of operations.
The Far West acquisition was completed with the expectation that it will result in increased copper and
other metal production, increased earnings and enhanced growth opportunities. These anticipated benefits
will depend in part on whether Capstone’s and Far West’s operations can be integrated in an efficient and
effective manner. Many operational and strategic decisions and certain staffing decisions have not yet
been made. These decisions and the integration of the two companies will present challenges to
management, including the integration of systems and personnel of the two companies, and special risks,
including possible unanticipated liabilities and unanticipated costs. As a result of these factors, it is
possible that the cost reductions and synergies expected from the acquisition of Far West will not be
realized. In addition, such synergies assume certain realized long-term metal prices and foreign exchange
rates. If actual prices were below such assumed prices, the realization of potential synergies could be
adversely affected, which could have a material adverse effect on the Company’s business, financial
condition, results of operation and prospects.
Transactions with Related Parties
The immediate parent and ultimate controlling party of the group is Capstone Mining Corp. (incorporated
in British Columbia, Canada).
The details of the Company’s entities and ownership interests are as follows:
Name Location Ownership Status
Minto Canada 100% Consolidated
Capstone Gold Mexico 100% Consolidated
Capstone Services S.A. de C.V. Mexico 100% Consolidated
Capstone Mining S.A. de C.V. Mexico 100% Consolidated
Kutcho Copper Canada 100% Consolidated
0908113 BC Ltd. Canada 70% Consolidated
FWM Canada 70% Consolidated
Far West Chile Chile 70% Consolidated
Far West Exploration S.A. Chile 70% Consolidated
Far West Australia Australia 70% Consolidated
Balances and transactions between the Company and its subsidiaries, which are related parties of the
Company, have been eliminated on consolidation and are not disclosed in this note.
Transactions between the company and other related parties include only consulting fees paid of $nil
(2010 – $0.02 million) to two former directors of the Company.
These transactions are in the normal course of operations and are measured at the fair value amount of
consideration established and agreed to by the related parties. Any amounts due to/receivable from
related parties are unsecured, non-interest bearing and have no specific repayment terms.
During the period, compensation of key management personnel was as follows:

1 These are alternative performance measures: please see “Alternative Performance Measures” below. Page 35
December 31, 2011 December 31, 2010
Salaries and short-term benefits 2,386$ 1,643$
Share-based payments 3,021 1,248
5,407$ 2,891$
Capstone’s key management personnel have authority and responsibility for planning, directing and
controlling the activities of the Company and consists of its Directors, Chief Executive Officer, Chief
Financial Officer and Chief Operating Officer.
Off Balance Sheet Arrangements
The Company has no off-balance-sheet arrangements other than those disclosed under Contractual
Obligations.
Critical Accounting Estimates
The Company’s significant accounting policies are presented in Note 2 of the audited consolidated
statements for the year ended December 31, 2011. The preparation of consolidated financial statements in
accordance with IFRS requires management to select accounting policies and make estimates and
judgments that may have a significant impact on the consolidated financial statements. The Company
regularly reviews its estimates; however, actual amounts could differ from the estimates used and,
accordingly, materially affect the results of operations.
Examples of significant estimates include:
purchase price allocation on business combinations and acquisition of assets;
mineral resources and mineral reserves;
the carrying values of inventories;
estimated tonnes of waste material mined for calculation of differed stripping costs;
the carrying values of mineral properties, and plant and equipment;
rates of amortization of mineral properties, plant and equipment;
the assumptions used for the determination of reclamation and closure cost obligations;
the valuation of deferred income taxes and allowances;
estimates used in the assessment of impairment of mineral properties, plant and equipment;
the valuation of financial instruments, including estimates used in provisional pricing
calculations;
the carrying values of receivables; and
the valuation of share-based compensation.
Examples of significant judgements, apart from those involving estimation, include:
the accounting policies for mineral properties, plant and equipment;
determination that the transaction with Far West constitutes an acquisition of assets;
classification of financial instruments;
classification of leases; and
determination of functional currency.
Changes in Accounting Policies
The Company has not applied the following revised IFRS that have been issued but are not yet effective
at December 31, 2011:
Amendments to IAS 1, Presentation of Financial Statements (effective for annual periods
beginning on or after July 1, 2012) require that elements of other comprehensive income that may
subsequently be recycled through profit and loss be differentiated from those items that will not
be recycled.
IFRS 9, Financial Instruments (effective January 1, 2015) introduces new requirements for the
classification and measurement of financial assets and liabilities.
IFRS 10, Consolidated Financial Statements, IFRS 11, Joint Arrangements, IFRS 12, Disclosure
of Interests in Associates and Joint Ventures (all effective January 1, 2013) provide guidance on

1 These are alternative performance measures: please see “Alternative Performance Measures” below. Page 36
the accounting treatment and associated disclosure requirements for joint arrangements and
associates, and a revised definition of “control” for identifying entities which are to be
consolidated. IAS 27, Separate Financial Statements and IAS 28, Investments in Associates and
Joint Ventures were revised and reissued to align with the new consolidation guidance.
IFRS 13, Fair Value Measurement (effective January 1, 2013) provides new guidance on fair
value measurement and disclosure requirements.
IAS 19, Employee Benefits (effective January 1, 2013) introduces changes to the accounting for
defined benefit plans and other employee benefits that include modification of the accounting for
termination benefits and classification of other employee benefits.
IFRIC 20, Stripping Costs in the Production Phase of a Mine (effective January 1, 2013 with
earlier application permitted) clarifies the requirements of accounting for the costs of stripping
activity in the production phase when stripping improves the access to further quantities of
material that will be mined in future periods.
Amendments to IAS 32, Financial Instruments (effective for annual periods beginning on or after
January 1, 2013) clarifies the application of the offsetting rules and requires additional disclosure
on financial instruments subject to netting arrangements.
International Financial Reporting Standards
The Company adopted IFRS on January 1, 2011, with the transition date of January 1, 2010 representing
the Company’s opening IFRS balance sheet. As required by IFRS 1, First-time Adoption of IFRS, the
Company applied the IFRS in effect as at December 31, 2011 on a full retrospective basis, except where
permitted or required under an IFRS 1 exemption.
On adoption of IFRS 1, the Company elected to apply the following exemptions:
Business combinations – IFRS 1 provides the option to apply IFRS 3, Business Combinations,
prospectively from the Transition Date. The retrospective application of IFRS 3 would require the
restatement of prior acquisitions that meet the definition of a business combination under IFRS 3.
The Company elected to adopt IFRS 3 with effect from the Transition Date forward.
Deemed cost of mineral properties, plant and equipment – IFRS 1 provides the option to measure
individual items of mineral properties, plant and equipment at the Transition Date at fair value and
use that fair value as its deemed cost. The Company elected to use the fair value of its Minto
mineral property at December 31, 2008 (the date of a revaluation under GAAP) as its deemed cost
and use this fair value as the carrying value of the mineral properties, plant and equipment with
effect from that date forward.
Decommissioning liabilities included in the cost of mineral properties, plant and equipment – IFRS
1 provides the option to measure the Company’s reclamation and closure cost obligations at the
Transition Date in accordance with the requirements of IAS 37, Provisions, Contingent Liabilities
and Contingent Assets. Accordingly, the Company elected to re-measure its reclamation and
closure cost obligations at the Transition Date under IAS 37 and estimated the amount to be
included in the cost of the related assets by discounting the liability to the dates at which the
liability first arose.
Borrowing costs – IAS 23, Borrowing Costs, requires an entity to capitalize the borrowing costs
related to all qualifying assets for which the commencement date for capitalization is on or after the
Transition Date. The Company elected to apply the requirement to capitalize borrowing costs in
accordance with IFRS with effect from the Transition Date forward.
Currency translation adjustment – IFRS 1 provides the option to reclassify the cumulative
translation differences previously recorded under GAAP to retained earnings and reset the balance
in the cumulative translation reserve to zero. The Company elected to apply this exemption and
reclassified $14.5 million of cumulative translation adjustment to retained earnings at the Transition
Date.
Share based payments – IFRS 1 provides the option to apply IFRS 2, Share Based Payment,
prospectively from the Transition Date. The retrospective application of IFRS 2 would have an
effect on equity instruments granted subsequent to November 7, 2002 that vested prior to the
Transition Date. The Company elected to adopt IFRS 2 with effect from the Transition Date

1 These are alternative performance measures: please see “Alternative Performance Measures” below. Page 37
forward.
Compound financial instruments – IAS 32, Financial Instruments, requires an entity to split a
compound financial instrument into separate equity and liability components. Under IFRS 1, the
Company elected to not separate the equity component from the cumulative interest portion in
retained earnings for any prior compound financial instruments where the liability component was
not outstanding at the Transition Date.
IFRS 1 also outlines specific guidelines that a first-time adopter must adhere to under certain
circumstances. The Company has applied the following guidelines to its opening balance sheet dated
January 1, 2010:
Estimates – In accordance with IFRS 1, an entity’s estimates under IFRS at the date of transition to
IFRS must be consistent with estimates made for the same date under previous GAAP, unless there
is objective evidence that those estimates were in error. The Company’s IFRS estimates as at
January 1, 2010 are consistent with its previous estimates under GAAP for the same date.
GAAP to IFRS Reconciliations
Reconciliation of assets previously reported under GAAP to IFRS
Notes December 31, 2010 January 1, 2010
Total assets under GAAP 631,725$ 551,081$
Deferred tax adjustments:
Mineral property acquisition a (5,480) (5,185)
Plant and equipment a (453) -
Asset retirement obligations d 146 133
Balance sheet reclassifications (81) (2,985)
Other measurement adjustments:
Asset retirement obligations d 1,216 863
Total assets under IFRS 627,073$ 543,907$
Reconciliation of liabilities previously reported under GAAP to IFRS
Notes December 31, 2010 January 1, 2010
Total liabilities under GAAP 254,229$ 265,490$
Deferred tax adjustments:
Mineral property acquisition a (5,630) (4,732)
Plant and equipment a (453) -
Foreign exchange b (497) 331
Convertible debentures c 40 73
Asset retirement obligations d (9) (26)
Balance sheet reclassifications (81) (2,985)
Other measurement adjustments:
Asset retirement obligations d 1,736 1,400
Total liabilities under IFRS 249,335$ 259,551$

1 These are alternative performance measures: please see “Alternative Performance Measures” below. Page 38
Reconciliation of equity previously reported under GAAP to IFRS
Notes December 31, 2010 January 1, 2010
Total equity under GAAP 377,496$ 285,591$
Deferred tax adjustments:
Mineral property acquisition a 150 (453)
Foreign exchange b 497 (331)
Convertible debentures c (40) (73)
Asset retirement obligations d 155 159
Other measurement adjustments:
Asset retirement obligations d (520) (537)
Total equity under IFRS 377,738$ 284,356$
Reconciliation of comprehensive income previously reported under GAAP to IFRS
Year ended
Notes December 31, 2010
Total comprehensive income under
GAAP
80,037$
Deferred tax adjustments:
Mineral property acquisition a 603
Foreign exchange b 828
Convertible debentures c 33
Asset retirement obligations d (4)
Other measurement adjustments:
Asset retirement obligations d 17
Share based compensation e 462
81,976$ Total comprehensive income under IFRS
Reconciliation Notes
a. Under GAAP, the Company recognized deferred income tax liabilities on the temporary differences
arising from the initial recognition of mineral properties, plant and equipment acquisitions, given
that the fair value of such acquisitions exceeded their tax basis. IAS 12, Income Taxes, does not
permit the recognition of deferred taxes on such transactions.
b. Under IFRS, the calculation of deferred income tax balances of foreign subsidiaries with a
functional currency different from the tax paying currency requires recognition of changes in
deferred tax balances due to differences between the current and historical exchange rates for non-
monetary assets and liabilities.
c. Under GAAP, if a compound instrument can be settled without the incidence of tax, deferred taxes
would not be recorded related to the temporary difference (i.e., the tax base of the liability
component is considered equal to its carrying amount and no temporary difference arises). Under
IFRS, the deferred tax consequences of a financial instrument containing both a liability and equity
component should be recognized both in profit or loss and in equity in accordance with the
classification of the component parts under IFRS.
d. Under an IFRS 1 optional exemption, the Company has re-measured its reclamation and closure
cost obligations at the Transition Date, estimated the amount to be included in the related assets by
discounting the liability to the date at which the liability arose, and recalculated the accumulated
amortization under IFRS.
e. Under GAAP, the Company amortized the expense on a straight-line basis. Under IFRS 2, Share-
based Payment, an entity is required to apply graded-vesting amortization to grants that have
multiple vesting dates.

1 These are alternative performance measures: please see “Alternative Performance Measures” below. Page 39
Cash Flows
The adoption of IFRS has had no impact on the net cash flows of the Company. The changes made to the
balance sheets and statements of earnings have resulted in the reclassification of amounts on the
statements of cash flows, however there have been no changes to the net cash flows. IAS 7, Statement of
Cash Flows requires that cash flows relating to finance costs/interest and income tax be separately
disclosed within the statement classifications. Under GAAP, these amounts were previously disclosed as
a note to the statement of cash flows. These amounts have been separately disclosed under ‘operating
activities’ within the statement of cash flows under IFRS.
Presentation Reclassifications
IAS 12, Income Taxes, requires that all deferred income taxes be classified as non-current on the balance
sheet. As such, the current portions of the future income tax asset and liability under GAAP at each
balance sheet date presented have been reclassified to the respective non-current deferred tax asset and
liability balances under IFRS.
Alternative Performance Measures
Alternative performance measures are furnished to provide additional information. These performance
measures are included in this MD&A because these statistics are key performance measures that
management uses to monitor performance, to assess how the Company is performing, to plan and to
assess the overall effectiveness and efficiency of mining operations. These performance measures do not
have a meaning within GAAP and, therefore, amounts presented may not be comparable to similar data
presented by other mining companies. These performance measures should not be considered in isolation
as a substitute for measures of performance in accordance with GAAP.
Alternative Performance Measure reconciliation of cash flow from operating activities per common
share:
($ millions except per share amounts) Current
Period
Comparative
Period
Cash flow from operating activities (per consolidated financial statements) 86.4 86.3
Weighted average common shares (basic - per consolidated financial
statements) 295,977,095 198,996,825
Cash flow from operating activities per basic common share 0.29 0.43
($ millions except per share amounts) Current
Quarter
Comparative
Quarter
Cash flow from operating activities 11.1 22.6
Weighted average common shares - basic 375,898,437 200,538,967
Cash flow from operating activities per basic common share 0.03 0.11
Alternative Performance Measure reconciliation of cash cost per pound of payable copper:
Cozamin
Mine
Minto
Mine
Current
Period
Comparative
Period
Payable pounds of copper produced (000’s)
39,654 35,856 75,510 72,999
Cash cost of sales - per consolidated financial
statements ($ millions) 56.5 63.0 119.5 105.6
Inventory adjustment ($ millions) 0.3 (8.1) (7.8) 0.4
Production costs ($ millions) 56.8 54.9 111.7 106.2
Production costs - $ per pound 1.43 1.53 1.48 1.45
- By-product credits - $ per pound - estimated
(0.47) (0.15) (0.32) (0.36)
- Selling costs - $ per pound - estimated 0.31 0.26 0.29 0.31
Total cash cost per payable pound of
copper produced - $ per pound - estimated 1.27 1.64 1.45 1.40

1 These are alternative performance measures: please see “Alternative Performance Measures” below. Page 40
Cozamin
Mine
Minto
Mine
Current
Quarter
Comparative
Quarter
Payable pounds of copper produced (000’s)
11,452 7,588 19,040 18,568
Cash cost of sales ($ millions) 13.9 11.1 20.7 -
Inventory adjustment ($ millions) 0.5 3.5 (3.8) 13.0
Production costs ($ millions) 14.4 14.7 16.9 13.0
Production costs - $ per pound 1.26 1.93 1.52 1.61
- By-product credits - $ per pound - estimated
(0.36) (0.16) (0.28) (0.28)
- Selling costs - $ per pound - estimated 0.24 0.27 0.26 0.33
Total cash cost per payable pound of
copper produced - $ per pound - estimated 1.14 2.04 1.50 1.66
Alternative Performance Measure reconciliation of adjusted net earnings:
($ millions except per share amounts) Current
Period
Comparative
Period
Net earnings (per consolidated financial statements) 60.4 74.6
Stock-based compensation 8.6 4.7
Foreign exchange loss - unrealized 5.3 0.6
Derivative instrument gain - unrealized (36.6) (18.5)
Gain on disposal of investments (1.5) (26.1)
Loss on disposal of fixed assets 0.3 0.1
Deferred income tax expense 15.7 9.8
Adjusted net earnings 52.2 45.2
Weighted average common shares (basic per consolidated financial
statements) 295,977,095 198,996,825
Adjusted net earnings per basic common share 0.18 0.23
Alternative Performance Measure reconciliation of adjusted net earnings:
($ millions except per share amounts) Current
Quarter
Comparative
Quarter
Net earnings 4.9 8.5
Stock-based compensation 1.3 0.8
Foreign exchange loss - unrealized 0.6 0.6
Derivative instrument (gain) loss - unrealized (2.7) 3.8
Gain on disposal of investments - (12.2)
Loss on disposal of fixed assets - 0.3
Deferred income tax expense (recovery) 0.1 (5.3)
Adjusted net earnings (loss) 4.2 (3.5)
Weighted average common shares - basic 375,898,437 200,538,967
Adjusted net earnings (loss) per basic common share 0.01 (0.02)

1 These are alternative performance measures: please see “Alternative Performance Measures” below. Page 41
Alternative Performance Measure reconciliation of cash cost per tonne of mill feed. Cozamin
Current
Period
Minto
Current
Period
Cozamin
Comparative
Period
Minto
Comparative
Period
Tonnes of mill feed processed 981,682 915,051 981,682 915,051
Cost of sales (per consolidated financial statements - $
millions) 56.5 63.0 57.5 48.1
Inventory adjustment ($ millions) 0.3 (8.1) (4.6) 5.2
Production costs ($ millions) 56.8 54.9 52.9 53.3
Cash cost per tonne of mill feed - $ 51.77 43.70 53.84 58.24
Alternative Performance Measure reconciliation of cash cost per tonne of mill feed. Cozamin
Current
Quarter
Minto
Current
Quarter
Cozamin
Comparative
Quarter
Minto
Comparative
Quarter
Tonnes of mill feed processed 304,556 336,949 215,503 258,121
Cost of sales (per consolidated financial statements - $
millions) 13.9 11.1 20.7 -
Inventory adjustment ($ millions) 0.5 3.5 (3.8) 13.0
Production costs ($ millions) 14.4 14.7 16.9 13.0
Cash cost per tonne of mill feed - $ 47.28 43.48 78.42 50.17
Outstanding Share Data and Dilution Calculation The Company is authorized to issue an unlimited number of common shares, without par value. The table
below summarizes the Company’s common shares and securities convertible into common shares as at
March 13, 2012:
Issued and outstanding 378,798,714
Share options outstanding @ a weighted average exercise price of $2.82 19,609,585
Share warrants outstanding @$2.66 until October 15, 2012 4,451,221
Convertible debentures @ 248.5715 shares per C$1,000 principle amount, total
debenture amount of C$4.5 million, expiry March 31, 2012
1,175,495
Fully diluted 404,035,015
Disclosure Controls and Procedures As of December 31, 2011, management has evaluated the design and the operating effectiveness of the
Company’s disclosure controls and procedures as defined by National Instrument 52-109. This evaluation
was performed under the supervision of and with the participation of the CEO and the CFO. Based on this
evaluation, management, being the CEO and the CFO concluded that the design and operation of the
disclosure controls and procedures were effective as of December 31, 2011.
Internal Control over Financial Reporting
As of December 31, 2011, management has evaluated the design and the operating effectiveness of the
Company’s internal control over financial reporting (“ICFR”) as defined by National Instrument 52-109.
This evaluation was performed under the supervision of and with the participation of the CEO and the
CFO.
Based on this evaluation, management, being the CEO and the CFO concluded that the design and
operating effectiveness of ICFR were effective as of December 31, 2011. The Company uses the
Committee of Sponsoring Organizations of the Treadway Commission ("COSO") internal control
framework to design ICFR. Due to its inherent limitations, ICFR may not prevent or detect misstatements
on a timely basis as such systems can only be designed to provide reasonable as opposed to absolute
assurance. Also projections of any evaluation of the effectiveness of ICFR to future periods are subject to

1 These are alternative performance measures: please see “Alternative Performance Measures” below. Page 42
the risk that the controls may become inadequate because of changes in conditions, or that the degree of
compliance with the policies or procedures may deteriorate.
Changes in Internal Control over Financial Reporting
National Instrument 52-109 also requires Canadian public companies to disclose in their MD&A any
change in ICFR during the most recent fiscal quarter that has materially affected, or is reasonably likely to
materially affect, ICFR. There were no changes in ICFR during the quarter ended December 31, 2011 that
materially affected or are reasonably likely to materially affect the Company's ICFR.
Approval The board of directors of Capstone has approved the disclosure contained in this Annual MD&A. A copy
of this MD&A will be provided to anyone who requests it from the Company.
Additional Information
Additional information is available for viewing at the Company’s website at www.capstonemining.com
or on the SEDAR website at www.sedar.com.
Cautionary Note Regarding Forward-Looking Information This document may contain “forward-looking information” within the meaning of Canadian securities
legislation and “forward-looking statements” within the meaning of the United States Private Securities
Litigation Reform Act of 1995 (collectively, “forward-looking statements”). These forward-looking
statements are made as of the date of this document and Company does not intend, and does not assume
any obligation, to update these forward-looking statements, except as required under applicable securities
legislation.
Forward-looking statements relate to future events or future performance and reflect Company
management’s expectations or beliefs regarding future events and include, but are not limited to,
statements with respect to the estimation of mineral reserves and mineral resources, the realization of
mineral reserve estimates, the timing and amount of estimated future production, costs of production,
capital expenditures, success of mining operations, environmental risks, unanticipated reclamation
expenses, title disputes or claims and limitations on insurance coverage. In certain cases, forward-looking
statements can be identified by the use of words such as “plans”, “expects” or “does not expect”, “is
expected”, “budget”, “scheduled”, “estimates”, “forecasts”, “intends”, “anticipates” or “does not
anticipate”, or “believes”, or variations of such words and phrases or statements that certain actions,
events or results “may”, “could”, “would”, “might” or “will be taken”, “occur” or “be achieved” or the
negative of these terms or comparable terminology. In this document, certain forward-looking statements
are identified by words including “may”, “future”, “expected”, “intends” and “estimates”. By their very
nature forward-looking statements involve known and unknown risks, uncertainties and other factors
which may cause the actual results, performance or achievements of the Company to be materially
different from any future results, performance or achievements expressed or implied by the forward-
looking statements. Such factors include, among others, risks related to actual results of current
exploration activities; changes in project parameters as plans continue to be refined; future prices of
resources; possible variations in ore reserves, grade or recovery rates; accidents, labour disputes and other
risks of the mining industry; delays in obtaining governmental approvals or financing or in the completion
of development or construction activities; as well as those factors detailed from time to time in the
Company’s interim and annual financial statements and management’s discussion and analysis of those
statements, all of which are filed and available for review under the Company’s profile on SEDAR at
www.sedar.com.Although the Company has attempted to identify important factors that could cause
actual actions, events or results to differ materially from those described in forward-looking statements,
there may be other factors that cause actions, events or results not to be as anticipated, estimated or
intended. The Company provides no assurance that forward-looking statements will prove to be accurate,
as actual results and future events could differ materially from those anticipated in such statements.
Accordingly, readers should not place undue reliance on forward-looking statements.

1 These are alternative performance measures: please see “Alternative Performance Measures” below. Page 43
National Instrument 43-101 Compliance
Unless otherwise indicated, Capstone has prepared the technical information in this MD&A (“Technical
Information”) based on information contained in the technical reports and news releases (collectively the
“Disclosure Documents”) available under Capstone Mining Corp.’s company profile on SEDAR at
www.sedar.com. Each Disclosure Document was prepared by or under the supervision of a qualified
person (a “Qualified Person”) as defined in National Instrument 43-101 – Standards of Disclosure for
Mineral Projects of the Canadian Securities Administrators (“NI 43-101”). Readers are encouraged to
review the full text of the Disclosure Documents which qualifies the Technical Information. Readers are
advised that mineral resources that are not mineral reserves do not have demonstrated economic viability.
The Disclosure Documents are each intended to be read as a whole, and sections should not be read or
relied upon out of context. The Technical Information is subject to the assumptions and qualifications
contained in the Disclosure Documents.
The disclosure in this MD&A of technical information has been reviewed and approved by John Sagman,
P. Eng., Vice President Technical Services of the Company (technical information related to mining and
production), and Brad Mercer, P. Geol.,, Vice President Exploration of the Company (technical
information related to mineral exploration activities), both Qualified Persons under NI 43-101. In
addition, Gregg Bush, Senior Vice President and Chief Operating Officer for Capstone reviewed all
Technical Information in this news release.