consolidated financial statements - tarkett etats financiers/fi... · consolidated financial...
TRANSCRIPT

Consolidated financialstatementsas of December 31, 2019

This document presents the consolidated financial statements of Tarkett as of December 31, 2019.
The statutory auditors’ report appears on the page 55.
This document is a non-binding "free" translation from French in English as no legal value other than an informative one.
Should there be any difference between the French and the English version, only the text in French language shall be deemed authentic and considered as expressing the exact information published by Tarkett.

Consolidated Financial Statements as of December 31, 2019
FINANCIAL STATEMENTS
Consolidated financial statements as of December 31, 2019 3
1 Consolidated Financial Statements as of December 31, 2019
Consolidated income statement
(in millions of euros) Note 20182019
(3) 2,836.1Net Revenue 2,991.9
(2,321.7)Cost of sales (2,183.7)
Gross profit 670.2 652.4(3)
13.2(3)Other operating income 23.8
(330.1)Selling and distribution expenses (360.9)
(36.0)Research and development (32.8)
(184.0)General and administrative expenses (180.0)
(19.7)Other operating expenses (12.9)(3)
106.6(3) 96.6Result from operating activities
1.0Financial income 1.3
(40.1) (31.1)Financial expenses
Financial income and expenses (38.8)(7) (30.1)
(7.9)Share of profit of equity accounted investees (net of income tax) (4.0)
68.653.8Profit before income tax
(18.5)(8) (14.2)Total income tax
Profit from continuing operations 39.6 50.1
Net profit for the period 39.6 50.1
Attributable to:
49.3Owners of Tarkett 39.6
(0.0) 0.8(2)Non-controlling interests
Net profit for the period 39.6 50.1
Earnings per share:
Basic earnings per share (in euros) 0.78(9) 0.62
Diluted earnings per share (in euros) 0.770.61(9)

Consolidated Financial Statements as of December 31, 2019
FINANCIAL STATMENTS
Consolidated financial statements as of December 31, 20194
Consolidated statement of comprehensive income
2018Note 2019(in millions of euros)
39.6 50.1Net profit for the period
Other comprehensive income (OCI)
12.0Foreign currency translation differences for foreign operations 13.0
(2.7)(7)Changes in fair value of cash flow hedge instruments 0.6
Income tax (0.1)0.7
(0.3)First application of IFRS 9 -
11.0 12.2OCI to be reclassified to profit and loss in subsequent periods
(10.6)Defined benefit plan actuarial gain (losses) 2.3(4)
Income tax 0.72.9
(7.7) 3.0OCI not to be reclassified to profit and loss in subsequent periods
3.3 15.2Other comprehensive income, net of tax
Total comprehensive income for the period 65.342.9
Attributable to:
42.9Owners of Tarkett 65.1
(0.0)Non-controlling interests 0.2
Total comprehensive income for the period 65.342.9

Consolidated Financial Statements as of December 31, 2019
FINANCIAL STATEMENTS
Consolidated financial statements as of December 31, 2019 5
Consolidated statement of financial positionAssets
Note(in millions of euros) Dec. 31, 2018Dec. 31, 2019
650.6(5)Goodwill 662.0
133.3155.6Intangible assets (5)
(5) 514.8607.3Property, plant and equipment (1)
(7) 24.121.7Other financial assets
91.1Deferred tax assets (8) 76.6
-Other intangible assets -
1,410.8Total non-current assets 1,526.3
449.3(3)Inventories 417.5
258.5 350.5(3)Trade receivables
Other receivables 93.8 84.1(3)
95.7(7)Cash and cash equivalents 137.7
979.6Total current assets 907.5
2,390.4Total assets 2,433.8
Equity and liabilities
Dec. 31, 2018(in millions of euros) Dec. 31, 2019Note
(9) 318.6327.8Share capital
145.8167.4Share premium and reserves
Retained earnings 299.5 290.9
Net profit for the period attributable to equity holders of the parents 39.6 49.3
804.6Equity attributable to equity holders of the parent 834.2
2.4(0.0)Non-controlling interests
807.0Total equity 834.2
5.5 -Other non-current liabilities
Financial liabilities (2) 740.2(7) 839.1
4.1Other financial liabilities 0.3(7)
(8) 35.7Deferred tax liabilities 26.4
136.7(4) 129.8Employee benefits
Provisions and other non-current liabilities 40.5(6) 46.4
1,055.1Total non-current liabilities 949.7
(3) 283.6324.0Trade payables
(3) 193.1234.2Other operating liabilities
34.2Financial liabilities and bank overdrafts (3) (7) 10.2
10.09.5Other financial liabilities (7)
(6) 31.448.0Provisions and other current liabilities
528.3649.8Total current liabilities
Total equity and liabilities 2,433.8 2,390.4
(1) Including €89.6 millions in right of use following the application of IFRS 16 as of December 31, 2019.(2) Including €66.7 millions in lease liability following the application of IFRS 16 as of December 31, 2019.(3) Including €22.6 millions of lease liability following the application of IFRS 16 as of December 31, 2019.

Consolidated Financial Statements as of December 31, 2019
FINANCIAL STATMENTS
Consolidated financial statements as of December 31, 20196
Consolidated statement of cash flows
(in millions of euros) 20182019Note
Cash flows from operating activities
68.653.8Profit for the period before income tax
Adjustments for:
Depreciation, amortization and impairment (1) 158.1 121.5
(0.5)(3)(Gain) loss on sale of fixed assets (2.7)
(7) 30.1Net finance costs (2) 38.8
6.2Change in provisions and other non-cash items (9.1)
7.9Share of profit of equity accounted investees (net of tax) 4.0
218.5Operating cash flow before working capital changes 258.2
16.985.0(Increase) / Decrease in trade receivables
(Increase) / Decrease in other receivables 0.6 (1.4)
(Increase) / Decrease in inventories 33.1 (13.1)
(15.6)Increase / (Decrease) in trade payables 38.9
0.932.8Increase / (Decrease) in other payables
(12.3)Changes in working capital 190.4
(22.7) (17.2)Net interest paid
Net income taxes paid (30.5) (25.3)
(11.2)Other operating items (0.7)
163.0Net cash flows from operating activities 384.3
Cash flows from investing activities
(231.9)(2) (2.5)Acquisition of subsidiaries net of cash acquired
(124.6)Acquisitions of intangible assets and property, plant and equipment (128.2)(2)
3.7Proceeds from sale of property, plant and equipment 1.5(5)
-Effect of changes in the scope of consolidation 0.0
(358.6)Net cash flows from investing activities (123.4)
Cash flows from financing activities
(5.5) -(2)Acquisition of NCI without a change in control
Proceeds from loans and borrowings 483.0 230.4
(9.8)Repayment of loans and borrowings (653.6)
(0.4)(31.9)Repayment of lease liabilities (3)
(5.3)Acquisitions/disposals of treasury shares (4.1)
(7.4)(9) (37.9)Dividends
Net cash flows from financing activities (219.5) 177.0
41.4Net increase / (decrease) in cash and cash equivalents (18.6)
114.7Cash and cash equivalents, beginning of period 95.7
(0.4)Effect of exchange rate fluctuations on cash held 0.6
(7) 95.7Cash and cash equivalents, end of period 137.7
(1) Including €29.3 million in depreciation of right-of-use assets (IFRS 16), as of December 31, 2019.(2) Including €4.2 million in financial expenses on lease liabilities (IFRS 16), as of December 31, 2019.(3) In 2019, concerned leases within the scope of IFRS 16, and in 2018, concerned financial leases within the scope of IAS 17.

Consolidated Financial Statements as of December 31, 2019
FINANCIAL STATEMENTS
Consolidated financial statements as of December 31, 2019 7
Consolidated statement of changes in equity
(in millions of euros) Non-controlling
interests
Translation reserves
Totalequity
Sharepremium
and reserves
Equityattributable toequity holders
of the parent
ReservesShareCapital
778.4(55.4)As of January 1, 2018 780.6369.4145.8318.6 2.2
49.3-- 0.849.3-Net profit for the period 50.1
16.112.6Other comprehensive income, net of tax
15.53.5-- (0.6)
(0.3)-- -(0.3)-First application for IFRS 9 (0.3)
65.112.6Total comprehensive income forthe period
65.352.5-- 0.2
(37.9)-- -(37.9)-Dividends (37.9)
(5.3)-Own shares (acquired) / sold (5.3)(5.3)-- -
3.9-- -3.9-Share-based payments 3.9
--Acquisition of NCI without a change in control
---- -
0.3-- -0.3-First application of IFRS 9 0.3
0.1-Other 0.10.1-- -
(38.9)-- -(38.9)-Total transactions with shareholders
(38.9)
804.6(42.8)As of December 31, 2018 807.0383.0145.8318.6 2.4
(4.3)-- -(4.3)-First application of IFRIC 23 (1) (4.3)
800.3(42.8)As of January 1, 2019 802.7378.7145.8318.6 2.4
--9.1 -9.1-Capital increase (2) 9.1
21.5-Share premium (2) 21.5-21.5- -
39.6-- (0.0)39.6-Net profit for the period 39.6
3.313.0Other comprehensive income, net of tax
3.3(9.7)-- -
29.9-- (0.0)42.913.0Total comprehensive income forthe period
42.9
(38.1)-Dividends (2) (38.1)(38.1)-- -
(0.4)-- -(0.4)-Own shares (acquired) / sold (0.4)
0.1-Share-based payments 0.10.1-- -
(3.2)-- (2.3)(3.2)-Acquisition of NCI without a change in control
(5.5)
1.9-Other 1.81.9-- (0.1)
(39.7)-- (2.4)(39.7)-Total transactions with shareholders
(42.1)
834.2(29.8)As of December 31, 2019 834.2368.9167.4327.8 (0.0)
(1) cf. Note 1.2(2) cf. Note 9
Notes to the consolidated financial statements
FINANCIAL STATMENTS
Consolidated financial statements as of December 31, 20198
2 Notes to the consolidated financial statementsNote 1 > Basis of preparation 91.1 General information 91.2 Significant accounting principles 91.3 Significant developments 12
Note 2 > Changes in the scope of consolidation 132.1 Consolidation methods 132.2 Business combinations 132.3 Foreign currency translation 132.4 Changes in the scope of consolidation 142.5 Joint ventures 15
Note 3 > Operating Data 153.1 Components of the income statement 153.2 Segment information 173.3 Other operating income and expenses 193.4 Breakdown of working capital requirement 193.5 Free cash flow 21
Note 4 > Employee benefits 224.1 Retirement benefits 224.2 Personnel costs and compensation of senior management 264.3 Share based payment transactions 27
Note 5 > Intangible assets and property, plant and equipment 275.1 Goodwill 275.2 Intangible assets and property, plant and equipment 295.3 Impairment 325.4 Lease commitments 335.5 Impact of exemptions to IFRS 16 34
Note 6 > Provisions 346.1 Provisions 346.2 Potential liabilities 36
Note 7 > Financing and Financial Instruments 367.1 Significant accounting principles 367.2 Financial income and expenses 377.3 Net debt – interest-bearing loans and borrowings 387.4 Other financial assets and liabilities 417.5 Fair value of financial assets and liabilities 427.6 Financial risks and Financial Instruments 437.7 Guarantees 48
Note 8 > Income tax 488.1 Income tax expense 488.2 Deferred tax 49
Note 9 > Equity and liabilities 509.1 Share capital 509.2 Earnings per share and dividends 50
Note 10 > Related parties 5110.1 Joint ventures 5110.2 Principal shareholders 5210.3 Members of the Management Board and Supervisory Board 52
Note 11 > Subsequent events 52
Note 12 > Statutory auditor fees 52
Note 13 > Principal consolidated entities 53

Notes to the consolidated financial statements
FINANCIAL STATEMENTS
Consolidated financial statements as of December 31, 2019 9
Note 1 > Basis of preparation1.1 General information
Tarkett’s Consolidated Financial Statements as of and forthe year ended December 31, 2019 comprise the Companyand its subsidiaries (hereafter the “Group”) as well as itsinterests in associates and joint ventures.
The Group is a leading global flooring company, providing alarge range of flooring and sports surface solutions tobusiness and residential end-users.
The Group completed its initial public offering on November21, 2013, and is listed on Compartment B (Compartment Auntil January 31, 2020 and Compartment B since February 1,2020) of Euronext Paris, ISIN code: FR0004188670 - TickerSymbol: TKTT.
The Group’s registered office is located at 1 Terrasse Bellini- Tour Initiale - 92919 Paris La Défense, France.
The Group’s Consolidated Financial Statements as of andfor the year ended December 31, 2019 were finalized by theManagement Board on February 11, 2020 and reviewed bythe Supervisory Board on February 13, 2020. They will besubmitted for shareholder approval on April 30, 2020.
1.2 Significant accounting principles1.2.1 Statement of compliance and applicable
standardThe Group’s Consolidated Financial Statements as of andfor the year ended December 31, 2019 have been prepared inaccordance with IFRS (International Financial ReportingStandards) as adopted by the European Union as of suchdate, which are available at https://ec.europa.eu/info/index_en. These standards have been applied consistentlyfor the fiscal years presented.
a) Amendments, new standards, or revisions to existing standards and interpretations applied during the period
The following new published standards have been applied tothe period by the Group:
> IFRS 16: Leases
Presentation and general principles
On January 13, 2016, the IASB published IFRS 16, “Leases,”which replaces IAS 17 and the related interpretations: IFRIC4 (“Determining whether an Arrangement Contains aLease”), SIC 15 (“Operating Leases - Incentives”), and SIC 27(“Evaluating the Substance of Transactions in the LegalForm of a Lease”).
The new standard, adopted by the European Union onOctober 31, 2017 and applicable as of January 1, 2019,eliminates the distinction between between opeating leasesand finance leases for leases with terms of longer than oneyear. It requires leases to be recorded on the lessee’sbalance sheet as follows:
• with an asset representing the leased asset’s right ofuse;
• with a liability for the obligation to make rentalpayments; and
• with amortization of the right of use and interestexpense recorded for the interest on the lease liability.
Application by the Group
The Group considers an arrangement to be a lease withinthe meaning of IFRS 16 if it gives the lessee the right tocontrol the use of an identified asset.
At Tarkett, the greatest number of lease agreements concerncars and forklifts; however, measured by value, leaseagreements primarily concern real property (offices, plants,and warehouses).
The Group has deployed a dedicated information system togenerate the accounting entries relating to this standard,which makes it possible to do the following:
• identify lease agreements, within the meaning of IFRS16;
• update information in real time;
• generate accounting entries;
• manage forecast data; and
• analyze financial impacts.
Method of transition
The Group uses the “simplified retrospective” method, inwhich a liability is recorded on the transition date equal tothe present value of the remaining payments, accompaniedby a right-of use adjusted for any prepaid or accrued leasepayments. The application of IFRS 16 had no impact onshareholders’ equity.
In addition, this transition method does not allow for therestatement of comparative information provided for the2018 fiscal year in the 2019 consolidated financialstatements.
It provides for various simplification and exemptionmeasures both during the transitional period and on anongoing basis.
The Group has decided to use the general exemptions:
• leases with an initial term of less than 12 months;
• leases concerning low value assets (those whose value,when new, was less than €5,000 or $5,000).
For the transition, the Group opted:
• to use the remaining term of the lease to determine thediscount rate as of the transition date; and
• to exclude initial direct costs from the valuation of theright of use as of the date of first application.

Notes to the consolidated financial statements
FINANCIAL STATMENTS
Consolidated financial statements as of December 31, 201910
Discount rate
Among the key assumptions, the Group decided to use adifferent discount rate for each contract, determined basedon its characteristics, term, country risk, and credit risk ofthe lessee entity, as well as the terms of the Group’s outsidefinancing.
Thus, the discount rate is determined for each asset on thebasis of the incremental borrowing rate on the effective dateof the contract and corresponds to the interest rate thateach of the Group’s entities would incur to borrow theamount necessary to acquire a similar asset, for a durationand in an economic environment similar to that of the lease.
For existing contracts on the transition date, in order tocalculate the right of use and the lease liability, the Groupapplies a discount rate for each contract as of January 1,2019 (the date on which the standard entered into force).
The Group’s weighted average interest rate applied to leaseliabilities as of January 1, 2019 is 4.14%.
Term of lease
The initial term of the lease corresponds to the period duringwhich it cannot be terminated, plus, where applicable,renewal or termination options that the Group is reasonablycertain it will exercise.
For certain types of leased assets (primarily vehicles), theGroup believes that there is no option to extend that it isreasonably certain to exercise; as a result, the term runsuntil the first date on which it is possible to terminate thelease.
The enforceable period of a lease is the period during whichthe lease cannot be cancelled. The initial term used for eachcontract corresponds to the length of the enforceable period,to which is added any option to extend or to terminate earlywithin the control of the Tarkett Group company and that itwould be reasonably certain to exercise.
In assessing whether it is reasonably certain to exercise ornot to exercise an option to extend or to terminate early,each Group entity considers all of the relevant facts andcircumstances that would influence it to exercise or notexercise the option.
A Group entity may revise the length of a lease during itsterm, where an option to extend or to terminate had notinitially been deemed exercised for purposes of determiningthe initial term of the lease, or where a significant event suchas a loss or significant change in the environment occursand requires the entity to consider the option.
With respect to the depreciation of non-removable leaseholdimprovements, the Tarkett Group decided to use the shorterof the following periods:
• the useful life of the leasehold improvement, as definedin IAS 16, “Property, Plant and Equipment”; and
• the lease term of the related leased asset, in light of thelegal limit for the use of the asset imposed by the leaseagreement.
Improvements associated with leased real property arerecorded outside the scope of application of IFRS 16.
As of year-end 2019, the Group is not affected by the IFRIC’sNovember 2019 update clarifing the relationship betweenthe enforceable period of the lease agreement and theleased asset’s non-removable improvements.
Types of lease agreements
• Goods and real property
For leases of land and buildings within the scope of IFRS 16,the lease term and discount rate are determined asdescribed above.
Leases of land and buildings do not include clausesguaranteeing the value of the leased assets.
When a building is leased and local law requires the lesseeto lease the land on which the building sits in the form of along-term lease, the Tarkett Group uses an economicapproach, limiting the lease term for the land to the leaseterm for the related building.
With respect to so-called “3-6-9” leases, the Tarkett Group,in accordance with the French Accounting StandardsAuthority (Autorité des Normes Comptables - ANC) assumesthat:
• the non-termination period of the commercial leaseis three years;
• the maximum term of the commercial lease is nineyears, with any extension of the lease following thenine years constituting a new lease agreement; and
• in light of the termination options that only the lesseeholds following the triennial periods;
the Group uses a nine-year term for this type of contract.None of the Group’s commercial leases currently in effectincludes an exception extending the nine-year maximumterm.
The Tarkett Group’s principal commercial lease is the leaseof premises for the Group’s registered office.
• Equipment and machinery
The Group’s leases of equipment and machines within thescope of IFRS 16 primarily include company cars andforklifts used in the Group’s plants. All company cars withlease terms of greater than 12 months are treated inaccordance with IFRS 16.
The lease term and discount rate used in calculating thelease liability are determined in the manner described above.Equipment and machinery leases do not include clausesguaranteeing the value of the leased asset.
• Non-capitalized lease agreements
◦ Short-term leases
Short-term leases have terms of one year or less. TheGroup’s short-term leases consist primarily of short-termcar leases.
◦ Low value leases
Low value leases are those for which the value of the asset,if new, would be less than or equal to €5,000 or $5,000. TheGroup’s low value leases consist primarily of leases of smallmachines and office equipment.

Notes to the consolidated financial statements
FINANCIAL STATEMENTS
Consolidated financial statements as of December 31, 2019 11
Impact of applying the standard on the principal financial aggregates
Right of use recorded in assets
As of the transition date, rights of use were valued on thebasis of lease liability as of January 1, 2019.
In the absense of significant initial direct costs, the right ofuse corresponds to the present value of rental payments.The right is amortized and is impaired if there areindications of a potential loss of value.
The Tarkett Group includes all significant initial direct costsin valuing the right of use. These costs consist of theincremental costs that, first, would not have been incurred ifthe lease agreement had not been entered into, and second,were directly attributable to the negotiation and entry intothe lease agreement. Generally speaking, these costsinclude the cost of negotiating and finalizing the lease,attorney fees, commissions, any eviction indemnity paid tothe previous tenant, etc. These initial direct costs excludegeneral expenses as well as any costs for construction,improvements, or installation.
See Note 5.2, Intangible assets and property, plant andequipment.
Lease liabilities
As of January 1, 2019, lease liabilities totalled €104.0 million(including €3.3 million aleady recognized in respect offinance leases), as compared with lease commitments of€114.2 million as of December 31, 2018.
A reconciliation between off-balance sheet commitmentsand the opening date is presented in Note 5.4, Leasecommitments.
The lease liability recorded coresponds to the present valueof the remaining rent payments due to the lessor.
These liabilities are included in the Group’s financialliabilities. However, lease liabilities and the cancellation oflease expenses are excluded for purposes of calculating theratio of net indebtedness to adjusted EBITDA used infinancial covenants (see Note 7.3.3, Financial ratiocovenants).
Income statement and statement of cash flows
In addition to the balance sheet, the income statement andstatement of cash flows are affected. Thus:
• operating lease expenses, previously recorded on astraight-line basis in EBITDA, will be replaced with anamortization expense for rights of use and an interestcharge in financial income
• rights of use are amortized on a straight-line basis overthe term of the lease;
• cash flows from operating leases (excluding variablerent based on the use or performance of the underlyingasset) will be replaced with cash flows from therepayment of liabilities and interest.
Deferred tax
The Group takes the position that because the asset andliability resulting from the application of IFRS 16 arise out ofthe same contract, they must be treated together incalculating deferred tax. As of the initial date on which theasset and the liability were recorded, there is no temporarydifference, as the two have the same value.
> IFRIC 23: Uncertainty over income tax treatments
On June 7, 2017, the IASB published IFRIC 23, Uncertaintyover income tax treatments. This interpretation, adopted bythe European Union on October 23, 2018, applies as fromJanuary 1, 2019. IFRIC 23 clarifies the application of IAS 12,Income taxes, with respect to recording and valuation whereuncertainty exists as to income tax treatment.
The interpretation provides clarification regarding:
• the unit of tax treatment, which is the level at which thetax risk to which the rules on accounting for and valuingassets and liabilities apply are assessed: eithercollectively (at the level of the taxable entity,jurisdiction, or group), or individually at the level of eachrisk;
• the risk of detection, which must be fully included whenaccounting for and valuing tax risk. It must be assumedthat the tax authorities will perform an audit and thatthey will have access to all information in order toidentify the error or misinterpretation of the taxstandard;
• the accounting principle regarding estimation of theprobability (in the sense of “more likely than not”) thatthe tax authorities will accept the uncertain taxtreatment. Thus, and to the extent that it is more than50% likely that the tax authorities will not accept the taxtreatment applied, the uncertain tax treatment must bereflected in the financial statements in tax due and/or indeferred tax; and
• the principle regarding valuation of a provision basedon an estimation of the amount that the entity expectsto pay or to recover from the tax authorities. Either oftwo valuation methods may be used, on a case-by-casebasis: the more probable amount, or the weightedaverage of the various possible scenarios.
The Group has chosen to apply the partially retrospectivetransition method, which means accounting for thecumulative impact in equity at the start of the fiscal year, asof January 1, 2019, and permits not restating thecomparable period.
In view of IFRIC 23, and more specifically after applying a100% risk of detection, the Group now believes that their areuncertainties as to the tax treatment of certain specificintragroup flows. As a result, equity was decreased by €4.3million as of January 1, 2019, balanced by recording taxeson the balance sheet.

Notes to the consolidated financial statements
FINANCIAL STATMENTS
Consolidated financial statements as of December 31, 201912
> Amendments
As of January 1, 2019, the Group has applied the followingadditional amendments:
• amendment to IFRS 9, Prepayment Features withNegative Compensation;
• amendment to IAS 19: Plan Amendment, Curtailment, orSettlement;
• amendment to IAS 28: Long Term Interests inAssociates and Joint Ventures;
• amendment to IFRS 3: Definition of a Businessregarding the multi-step acquisition of businesspreviously considered a joint venture;
• amendment to IAS 12: tax consequences of thedistribution of dividends within the meaning of IFRS 9;and
• amendment to IAS 23: Borrowing Costs.
These amendments, applicable as of January 1, 2019, haveno significant impact as of December 31, 2019.
b) Early adoption of new standards or interpretations during the period
• Amendment to IFRS 9, IAS 39, and IFRS 7 published bythe IASB in September 2019.
The Group has chosen early application, beginning in 2019,of the amendment to IFRS 9, IAS 39, and IFRS 7 published bythe IASB in September 2019 in connection with the interestrate benchmark reform.
The amendment allows the Group not to account foruncertainties as to future benchmark interest rates whenvaluing the effectiveness of its hedge transactions or inassessing whether the hedged risk is highly probably, thusenabling the Group to securitize existing or future hedgerelationships until the uncertainties are resolved.
Interest rate derivatives documented as part of a hedge arepresented in Note 7.6. The Group is in the process ofanalyzing the impacts of the future modification ofbenchmark indices.
c) New standards and interpretations not adoptedThe following published standards have not been applied bythe Group:
> IFRS 17: Insurance Contracts
On May 18, 2017, the IASB published IFRS 17, InsuranceContracts, on accounting for and valuing insurancecontracts, which will replace IFRS 4. As it has not yet beenadopted by the European Union, and given the IASB’sdecision to postpone by one year, the first application will beon January 1, 2022.
1.2.2 Accounting estimates and judgmentsThe preparation of the Group’s Consolidated FinancialStatements requires it to make a number of estimates andassumptions that have an effect on the amounts recordedon its balance sheet and income statement.
These judgments and estimates relate principally to:
Note
Measurement of the fair value of the consideration transferred, NCI and assets acquired and liabilities assumed
2
5.3Impairment testing of assets
Accounting treatment of Financial Instruments 7.6
4.1Provisions for employee benefits
Valuation of deferred tax assets 8.2
6Determination of other provisions (warranties and disputes)
Management reviews these estimates and assumptions onan ongoing basis, by reference to past experience andinformation deemed significant given the currentenvironment. Actual results may differ significantly fromthese estimates.
The Group’s Consolidated Financial Statements have beenprepared on the basis of historical cost with the exception ofthe following assets and liabilities, which have beenmeasured at fair value: derivatives, investments held fortrading, available-for-sale financial assets, pension planassets and other assets when required. The carrying amountof assets and liabilities subject to fair value hedging hasbeen adjusted in line with the changes in fair valueattributable to the hedged risks.
1.3 Significant developments
On February 19, 2019, Tarkett and Sonae Arauco announcedtheir intention to cease operating their joint venture,LaminatePark GmbH & Co. KG.
In addition, on April 17, 2019, Tarkett announced changes inits manufacturing footprint in North America. Thesechanges are part of the Group’s strategy to optimize itsoperations and to better position itself to respond to theneeds of the North American market.
During the 2019 fiscal year, that strategy led to the transferof manufacturing activities to production sites in the UnitedStates and to asset sales. These movements resulted inclosing the plant in Waterloo, Ontario (Canada), whichmanufactured flooring accessories, and the plant in Truro inNova Scotia (Canada), which produced commercial carpetrolls.

Notes to the consolidated financial statements
FINANCIAL STATEMENTS
Consolidated financial statements as of December 31, 2019 13
Note 2 > Changes in the scope of consolidation2.1 Consolidation methods2.1.1 Full consolidationA subsidiary is an entity controlled by the Groupe. TheGroup controls an entity when it is exposed to, or has theright to, variable returns from its involvement with the entityand has the ability to affect those returns through its powerover the entity. The financial statements of subsidiaries areincluded in the Consolidated Financial Statements from thedate that control commences until the date that controlceases.
The accounting policies of subsidiaries have been changedwhen necessary to align them with the policies adopted bythe Group.
Losses applicable to non-controlling interests in asubsidiary are allocated to the non-controlling interests,even if doing so causes the non-controlling interests to havea deficit balance.
2.1.2 Equity method accounting for joint ventures and associates
A joint venture, for purposes of IFRS 11, is an arrangement inwhich the Group has joint control, whereby the Group hasright to the net assets of the arrangement, rather than rightsto its assets and obligations for its liabilities. The Group’sinterests in equity-accounted joint ventures compriseprincipally the joint venture Laminate Park GmbH & Co.
They are recognized initially at cost, which includestransaction costs. Subsequent to initial recognition, theConsolidated Financial Statements include the Group’sshare of the profit or loss and OCI of equity accountedinvestees, until the date on which significant influence orjoint control ceases.
The accounting policies described hereafter have beenapplied to all the periods presented in the ConsolidatedFinancial Statements and have been uniformly applied by allGroup entities acquired prior to December 31, 2019 (seeNote 2.4 “Changes in Scope of Consolidation”).
2.2 Business combinations
Business combinations are accounted for using theacquisition method on the acquisition date - i.e. whencontrol is transferred to the Group.
The Group measures goodwill at the acquisition date as:
> the fair value of the consideration transferred; plus
> the recognized amount of any non-controlling interests inthe acquiree; plus
> if the business combination is achieved in stages, the fairvalue of the pre-existing equity interest in the acquiree;less
> the net recognized amount (generally fair value) of theidentifiable assets acquired and liabilities assumed.
When the excess is negative, a bargain purchase gain isrecognized immediately in profit or loss.
Transactions costs, other than those associated with theissue of debt or equity securities, that the Group incurs inconnection with a business combination are expensed asincurred.
Any contingent consideration payable is measured at fairvalue at the acquisition date. If the contingent considerationis classified as equity, then it is not remeasured andsettlement is accounted for within equity. However,subsequent changes in the fair value of the contingentconsideration are recognized in profit or loss.
Acquisition of NCI without a change in control
For each business combination, the Group elects to measureany non-controlling interests in the acquiree either:
> at fair value; or
> at their proportionate share of the acquiree’s identifiablenet assets, which are generally at fair value.
Changes in the Group’s interest in a subsidiary that do notresult in a loss of control are accounted for as transactionswith owners in their capacity as owners. Adjustments to non-controlling interests are based on a proportionate amountof the net assets of the subsidiary. No adjustments aremade to goodwill and no gain or loss is recognized in profitor loss.
Share put options granted by the Group
The Group may write a put option or enter into a forwardpurchase agreement with the non-controlling shareholdersin an existing subsidiary on their equity interests in thatsubsidiary. The Group consolidates the entity as though thenon-controlling interests had already been acquired. Thisposition leads to recognizing a liability for the present valueof the price payable in the event that the non-controllinginterests exercise their option.
As of December 31, 2019, all buyback options have beenexercised.
2.3 Foreign currency translation
The functional currency of Tarkett and its subsidiarieslocated in the euro zone is the euro. Group entities operateon an autonomous basis and therefore the functionalcurrency of entities operating outside the euro zone isgenerally their local currency.
The functional currency of entities in the Commonwealth ofIndependent States (“CIS”) is the euro. After analyzing theprimary and secondary indicators set forth in IAS 21.9, theGroup has confirmed this choice for the 2019 financialstatements.
The Group presents its financial statements in euros.

Notes to the consolidated financial statements
FINANCIAL STATMENTS
Consolidated financial statements as of December 31, 201914
Foreign currency transactions
Transactions in foreign currencies are translated into therespective functional currencies of the Group entities at theforeign exchange rate as of the date of the transaction.Foreign exchange rate differences arising on thesetransactions are recognized either in the operating profit foroperational transactions or in the financial result forfinancing transactions.
Some items are covered by hedging transactions; theaccounting treatment for those transactions is described inNote 7.6.
Non-monetary items are translated using the historicalexchange rates, while monetary items are translated usingthe foreign exchange rates ruling at the balance sheet date.
Financial statements of foreign operations
On the balance sheet date, assets and liabilities of foreignoperations are translated at the closing rate, and incomeand expenses are translated at the average exchange ratefor the period.
Foreign currency differences are recognized in othercomprehensive income (OCI), and presented in thetranslation reserve in equity.
Net investments in foreign operations
When long-term loan in foreign currency is granted to asubsidiary, it may be deemed a net investment in a foreigncompany. Foreign exchange gains and losses relating tothese long-term loans are then recognized in translationreserves in other comprehensive income.
2.4 Changes in the scope of consolidation
The Tarkett Group’s scope of consolidation is as follows (see Note 13, which contains a list of consolidated companies):
LiquidationsAcquisitionsand creations
December 31, 2018Number of companies December 31, 2019Mergers
Fully consolidated companies
(2)(3)78 752
12 3-Equity-accounted consolidated companies
-
(2)(3)80 783Total
2.4.1 Transactions completed in 2019The year’s main transactions are as follows:
a) Acquisitions and creationsIn June 2019, in Germany, Fieldturf Tarkett acquired theshares of Denus. The name of this entity is now TarkettSports GmbH.
Through its subsidiary Tarkett GDL, the Tarkett Group alsoacquired 40% of the shares of FED Inc. in July 2019, a U.S.company consolidated through the equity method.
In July 2019, Tarkett Argentina was formed in Argentina.
b) MergersIn January 2019, Tandus Centiva Inc. and Tandus CentivaUS LLC were merged into Tarkett USA Inc.
In December 2019, The Tennis & Track Company wasmerged into L.E.R. Inc.
c) LiquidationsVinisin Kft and Desso Ltd were liquidated respectively inAugust 2019 and December 2019.
d) Other transactions
In May 2019, in the United Stated, through its subsidirayFieldTurf USA, Inc., Tarkett acquired the assets of BeyondThe Turf.
In November 2019, the Group purchased the 30% of theshares held by Tarkett Aspen’s minority shareholders. This
transaction did not result in a change in the company’smethod of consolidation.
2.4.2 Transactions completed in 2018a) AcquisitionsIn late 2017, FieldTurf Tarkett SAS acquired 30% of theshares of AllSports Constructions & Maintenance, a Scottishcompany, which was consolidated through the equitymethod in 2018.
On January 31, 2018, through its subsidiary FieldTurf TarkettSAS, Tarkett acquired the assets of Grass ManufacturersPty Limited (Grassman), a leading Australian artificial turfmanufacturer.
As of July 1, 2018, through its subsidiary FieldTurf TarkettUSA Holding Inc., the Tarkett Group acquired The Tennis andTrack Company, a U.S. company.
In September 2018, Tarkett USA Inc. acquired LexmarkCarpet Mills, which manufactures high quality carpeting,principally for the hotel industry in North America.
In November 2018, through FieldTurf Inc., Tarkett acquiredcertain assets of Thermagreen, a company specialized in themanufacture and sale of polyethylene foam products.
b) MergersIn 2018, in the Netherlands, Fieldturf Benelux BV wasmerged into Tarkett Sports BV, and in Belgium, Tarkett Beluxwas merged into Desso NV.

Notes to the consolidated financial statements
FINANCIAL STATEMENTS
Consolidated financial statements as of December 31, 2019 15
2.5 Joint ventures
The Group holds interests in the following companies:
> AllSports Constructions & Maintenance, a companyestablished in Scotland.
> FED Inc., a U.S. company.
> Laminate Park GmbH & Co KG, jointly held with the SonaeArauco Group.
Note 3 > Operating Data3.1 Components of the income statement3.1.1 Net revenueAs from January 1, 2018, IFRS 15, “Revenue from Contractswith Customers,” replaces IAS 18, “Revenue,” and IAS 11,“Construction Contracts,” and their related interpretations.
The standard includes new rules for recording revenue andsegmenting contracts into performance obligations.
In accordance with the standard, revenue from the sale ofgoods is recognized in profit or loss when the controlinherent to service obligations has been transferred to thebuyer, payment is likely, the associated costs and potentialreturn of the merchandise can be reliably assessed, theGroup is no longer involved in managing the merchandise,and the revenue from the merchandise can be reliablyassessed. Revenue is recognized net of returns, rebates,commercial discounts and bulk discounts.
The Group recognizes revenue using the five-step model setforth in the standard as a function of its two businesssectors: flooring and sports surfaces.
Flooring:
The contracts that the Group enters into relate to the supplyof identifiable and distinct products constituting theprincipal performance obligation. No significant long-termcontracts were identified. The Group acts in its own nameand not as an intermediary. The general terms andconditions of sale provide for payment in under one year,and the Group does not offer variable financing that wouldnecessitate segmented recording pursuant to IFRS 15.Tarkett does not sell extended warranties on its products;therefore, its warranty is not considered as a separateservice and is recorded in accordance with IAS 37,“Provisions, contingent liabilities and contingent assets.”
For this business sector, in general, revenue is recorded atthe time of delivery of the performance obligation. Takinginto consideration the nature of the products and thegeneral terms and conditions of sale, sales are usuallyrecorded on the date on which the products leave theGroup’s warehouses, or upon delivery if Tarkett isresponsible for transport.
Sports Surfaces:
The sports surfaces activity is composed of sales ofproducts directly to distributors and the sale of installationcontracts (including provision of the sports surfaces). Thedirect sale of products to distributors follows the same
Group rules for recording revenue as those described for theflooring activity. With respect to installation contracts, theGroup does not perform installations without also providingthe sports surfaces; it therefore considers the supply of theproducts and the installation to be part of the sameperformance obligation. The general terms and conditions ofsale do not offer variable financing or specific componentsof financing. Tarkett does not sell extended warranties on itsinstallations; therefore, its warranty is not considered aseparate service and is recorded in accordance with IAS 37,“Provisions, contingent liabilities and contingent assets.”
In this business segment, revenue from services rendered orfrom construction contracts is recognized in profit or loss inproportion to the stage of completion of the transaction atthe balance sheet date. Revenue is recorded as theperformance obligation are completed. The stage ofcompletion is assessed by reference to surveys of workperformed. The use of the percentage-of-completionmethod requires satisfaction of one of the three priorconditions provided for in IFRS 15 paragraph 35.
Pursuant to that paragraph of the standard, the Grouprecognizes revenue over time to the exent that it complieswith two of the three following conditions referred to in thestandard:
• the asset created by the Tarkett Group’s performancedoes not have an alternative use to that provided for inthe contract; and
• the Group has an enforceable right to payment forperformance completed to date.
Net sales comprise revenue from the sale of goods andservices net of price reductions and taxes, and afterelimination of intragroup sales.
3.1.2 Operating resulta) GrantsGrants relating to assets are deducted from the carryingamount of the property, plant and equipment. The grants arethus recognized as income over the lives of the assets byway of a reduced depreciation charge.
Grants are recognized when there is reasonable assurancethat the Group will comply with the conditions attaching tothem and that the grants will be received. Other grants arerecognized as income on a systematic basis over theperiods necessary to match them with the related costswhich they are intended to compensate.

Notes to the consolidated financial statements
FINANCIAL STATMENTS
Consolidated financial statements as of December 31, 201916
b) Expenses
Cost of sales
Cost of sales comprises the cost of manufactured products,the acquisition cost of purchased goods which have beensold, and the supply chain, logistic and freight costs.
Selling and distribution expenses
Selling and distribution expenses comprise the expenses ofthe marketing department and the sales force, as well asadvertising expenses, distribution expenses, salescommissions and bad debts.
Research and development
Research and development costs are recognized asexpenses when incurred, unless the criteria are met for themto be capitalized, as per Note 5.2.1.
General and administrative expenses
General and administrative expenses comprise theremuneration and overhead expenses associated withmanagement and administrative personnel with theexception of amounts charged to other cost centers.
c) Other operating income and expensesThis category includes all operating income and expensesthat cannot be directly attributed to business functions,including operating expense related to retirementcommitments and costs with respect to certain disputes.
3.1.3 Adjusted EBITDAAdjusted EBITDA is a key indicator permitting the Group to measure its operating and recurring performance.
It is calculated by taking operating income beforedepreciation and amortization and removing the followingrevenues and expenses:
> restructuring costs to improve the future profitability ofthe Group;
> gains or losses on disposals of significant assets;
> impairment and reversal of impairment based on Groupimpairment testing only;
> costs related to business combinations and legalreorganizations, including legal fees, transactions costs,advisory fees and other adjustments;
> expenses related to share-based payments due to theirnon-cash nature; and
> other one-off expenses considered exceptional by theirnature.
2019
(in millions of euros) Of which adjustments
2019adjusted
Gains/Losseson asset sales
/ impairment
Share-based
payments
Re-structuring
OtherBusinessCombinations
--(0.0) 2,991.9Net revenue --2,991.9
2.6(0.2)(2,321.7) 0.0(0.5)12.7 (2,307.1)Cost of sales
0.0(0.5)12.7 684.8Gross profit 2.6(0.2)670.2
(0.1)-(360.9) 0.00.11.5 (359.5)Selling and distribution expenses
0.0-0.5 (32.3)Research and development --(32.8)
1.20.1(184.0) 4.10.41.6 (176.7)General and administrative expenses
-(2.2)3.5 5.5Other operating income and expenses
--4.1
3.6(0.1)96.6 4.1(2.2)19.7 121.8Result from operating activities (EBIT)
-0.0- 158.2Depreciation and amortization --158.2
(0.1)19.7254.7 3.64.1(2.2)EBITDA 280.0

Notes to the consolidated financial statements
FINANCIAL STATEMENTS
Consolidated financial statements as of December 31, 2019 17
In 2019, the application of IFRS 16 increased EBITDA by €30.5 million. As a reminder, the standard was not applied in 2018.
(in millions of euros) Of which adjustments
2018Adjusted
2018 Share-based payments
Gains/Losseson asset sales
/ impairment
BusinessCombinations
Re-structuring
Other
--2,836.1 ---Net revenue 2,836.1
-2.8Cost of sales (2,171.0)2.47.6(2,183.7) -
2.47.6652.4 --2.8Gross profit 665.2
0.1-Selling and distribution expenses
(329.3)-1.0(330.1) (0.2)
-0.4(36.0) ---Research and development (35.6)
4.00.6General and administrative expenses
(170.0)2.41.9(180.0) 1.1
0.30.30.3 ---Other operating income and expenses
1.0
4.13.3Result from operating activities (EBIT)
131.35.111.2106.6 0.9
-(0.7)121.5 --(3.3)Depreciation and amortization
117.5
4.1-EBITDA 248.75.110.5228.1 0.9
3.2 Segment information
In accordance with IFRS 8, “Operating Segments,” theGroup’s activities have been segmented based on theorganization of its internal management structure and of itsproducts.
As in 2018, the Group is organized in four segments:
> Europe, Middle East and Africa (“EMEA”);
> North America;
> Commonwealth of Independent States (“CIS”), AsiaPacific (“APAC”) and Latin America; and
> Sports surfaces.
Certain expenses are not allocated, including the expensesof headquarters and of the R&D Group.
Reminder on the organization of the CIS and Asia Pacific (APAC)/Latin America divisions
Reporting reviewed by the chief operating decision maker isorganized by division, of which there are currently six: EMEA,North America, CIS, APAC, Latin America, and SportsSufaces.
The CIS and APAC/Latin America Divisions have beencombined to form the “CIS, APAC and Latin America”segment, for the following reasons:
> The markets of the divisions had similar economiccharacteristics (similar growth trends in the relevantmarkets).
> The products sold, manufacturing methods, types ofclients, and distribution modes of the zones are similar.
In addition, the relatively small contribution of revenue andoperating income from Asia-Pacific/Latin America (lessthan 10% of the Group’s net revenue and adiusted EBITDA)highlighted that there was no need to present the division ina separate segment.

Notes to the consolidated financial statements
FINANCIAL STATMENTS
Consolidated financial statements as of December 31, 201918
By operating segment
2019
Central Group
Flooring
SportsSurfaces
EMEA(in millions of euros) CIS, APACand LatinAmerica
NorthAmerica
2,991.9910.4Net revenue 587.4825.9 -668.1
187.9 0.1127.5 670.2240.6Gross profit 114.1
26.4% 22.4%% of net revenue 19.4%22.7% 19.1%
59.9105.3 75.2Adjusted EBITDA 85.9 280.0(46.1)
% of net revenue 14.6% 9.4%7.3%11.6% 11.2%
(12.3)(7.2) (0.1)Of which adjustments (0.2) (25.3)(5.6)
EBITDA 85.8 254.7(51.7)47.698.1 75.1
5.8%10.8% 8.5%11.2%% of net revenue 14.6%
Result from operating activities (EBIT) 37.7(28.3) (16.3)51.1 96.652.5
7.6% 3.2%5.8%% of net revenue 6.4%-3.4%
Ongoing capital expenditures 19.929.4 11.214.6 124.148.9
Flooring2018
Central GroupSportsSurfacesEMEA(in millions of euros) CEI, APAC et
Amériquelatine
NorthAmerica
908.4 -Net revenue 563.6 2,836.1580.5783.6
244.0 0.2Gross profit 105.6111.5191.1 652.4
24.4%26.9%% of net revenue 18.7%19.2% 23.0%
70.2 248.797.3 (45.7)Adjusted EBITDA 52.874.1
12.8%9.0% 8.8%10.7%% of net revenue 9.4%
Of which adjustments (1.5)(1.7)(4.0) (20.6)(5.8) (7.6)
91.5 (53.4)EBITDA 51.472.466.1 228.1
8.4%10.1%% of net revenue 9.1%12.5% 8.0%
14.9 106.648.9 (14.8)Result from operating activities (EBIT) 31.026.6
3.8%4.6%1.9%5.4%% of net revenue 5.5%
22.241.7 127.340.1 10.4Ongoing capital expenditures 12.9
Information on activity in France and in other significant countries
The Group’s activity in France represented less than 10% ofrevenue in 2019 and in 2018.
Non-current assets in France, excluding the non-affectedgoodwill arising out of the merger between Tarkett andSommer in the early 2000’s, also represent less than 10% ofthe Group’s total non-current assets in 2019 and in 2018.
Tarkett considers the threshold of 25% of revenues to besignificant. Only the United States is above that threshold,with 43% of the Group’s consolidated revenue in 2019 (41%in 2018).
The United States represents 50% of the Group’s total non-current assets as of December 31, 2019 (50% as ofDecember 31, 2018).
No single customer represents more than 10% of theGroup’s revenues. In 2019, the largest customer represented3% of consolidated revenues (3% in 2018).

Notes to the consolidated financial statements
FINANCIAL STATEMENTS
Consolidated financial statements as of December 31, 2019 19
3.3 Other operating income and expenses
20182019(in millions of euros)
0.52.7Gains on disposal of fixed assets
21.1Other operating income 12.7
23.8Other operating income 13.2
-Losses on disposal of fixed assets -
Other operating expenses (12.9)(19.7)
Other operating expenses (12.9)(19.7)
Total other operating income and expenses 0.34.1
3.4 Breakdown of working capital requirement3.4.1 InventoriesInventories are stated on a FIFO (first in, first out) basis, atthe lower of manufacturing/acquisition costs and netrealizable value. Manufacturing costs of self-producedinventories comprise all costs that are directly attributableand a systematic allocation of production overhead and
depreciation of production facilities based on normaloperating capacity. Net realizable value is the estimatedselling price in the ordinary course of business, less theestimated costs of completion and selling expenses.
December 31, 2019(in millions of euros) December 31, 2018
138.9Raw materials and supplies 148.0
85.3Work in progress 75.5
Finished goods 264.0241.4
Samples 2.41.6
Displays (2.3)-
22.821.6Consumables and spare parts
510.4488.8Total gross Value
(71.3)Provision for inventory depreciation (61.1)
417.5Total net inventory 449.3
Detail of the provision for inventory depreciation
December 31, 2019
December 31, 2018
(in millions of euros) DecreaseAllowance OtherForeignexchange
gain & loss
(5.0)(10.4) (0.1)3.3 (10.4)2.0Raw materials and supplies
Work in progress 5.6(4.3) (6.6)(0.0) (12.9)(7.8)
(36.1) (0.4)11.7 (40.8)(1.0)Finished goods (14.9)
(0.2) -(0.0) (0.5)(0.3)Samples 0.1
0.5 (6.6)-Consumables and spare parts (0.6)(6.5) 0.0
(0.5) (71.3)(61.1)Total provision for inventory depreciation 21.1(25.0) (5.6)
The rate of inventory provisions is applied in a similar way for the different periods.
Cost of raw materials was €1,223 million in 2019, as compared with €1,179 million in 2018.

Notes to the consolidated financial statements
FINANCIAL STATMENTS
Consolidated financial statements as of December 31, 201920
3.4.2 Trade receivablesTrade receivables are stated at their invoiced valueconverted at the closing rate, less any allowance fordoubtful accounts.
The Group conducts a review of each of its customerreceivables individually, taking into account the probabilityof default by the counterparty as well as the extent to whichthe receivables were hedged, and uses the simplifiedmethod provided for by IFRS 9 to provision the expectedlosses over the remaining maturity of the receivables.
Factoring of trade receivables
Certain of the Tarkett Group’s subsidiaries have transferredtrade receivables to specialised credit institutions without
recourse, transferring nearly all of the risks and benefitsattached to the transferred receivables.
Receivables transferred and having payment dates laterthan December 31, 2019, totaled €138.7 million and are nolonger recorded on the Group’s balance sheet.
Provision for doubtful receivables
Where trade receivables are not covered by credit insurance,provisions to cover the risk of failing to collect tradereceivables either in full or in part are recorded using theexpected loss method (see Note 7.1).
Doubtful receivables are identified and provisioned as folows:
> a statistical provision, based on the age of the outstanding receivables, is defined as follows:
Impairment(as a percentage of the gross amount)
Receivables, trade overdue
25%From 61 to 180 days
50%From 181 to 270 days
From 271 to 360 days 75%
100%More than 360 days
> An additional provision on a case-by-case basis based on an application of professional judgment.
(in millions of euros) December 31, 2018December 31, 2019
Related party receivables 8.111.9
360.1264.8Trade receivables
368.2276.7Total gross value
(18.1)Provisions for doubtful receivables (17.7)
258.5Total net receivables 350.5
The variation of the provision for doubtful receivablesamounts to €(0.4) million and is mainly explained as follows:
> €(3.9) million of allowance;
> €3.4 million of reversals;
> €0.1 million of foreign exchange impact.
Detail of unimpaired overdue receivables
December 31, 2018December 31, 2019(in millions of euros)
39.2Receivables, trade overdue 0-180 days 54.0
1.1Receivables, trade overdue 181-270 days 1.0
0.6Receivables, trade overdue 271-360 days 0.2
Receivables, trade overdue > 360 days 0.81.4
Receivables, bankruptcy procedure/legal cases 1.41.0
Total unimpaired overdue Receivables 57.443.3

Notes to the consolidated financial statements
FINANCIAL STATEMENTS
Consolidated financial statements as of December 31, 2019 21
3.4.3 Other receivables
(in millions of euros) December 31, 2018December 31, 2019
-Other receivables non-current -
19.6Prepaid expenses current 15.2
27.1Income tax receivable current 24.6
VAT and other taxes 16.916.3
35.1Other accounts receivable and other assets current 23.0
84.1Other receivables current 93.8
3.4.4 Trade payablesPayables due more than a year in the future are discounted to net present value. Payables due more than a year in the future,including €5.5 million in deferred income are discounted to net present value.
December 31, 2019(in millions of euros) December 31, 2018
324.0Trade payables 281.5
Trade notes payable 2.1-
324.0 283.6Trade payables
3.4.5 Other liabilities
December 31, 2018December 31, 2019(in millions of euros)
110.9Liabilities related to employees 96.4
13.3Current tax 22.4
15.7VAT and other taxes 20.6
41.4Sales rebates 39.9
Other liabilities 27.839.0
193.1Other current liabilities 234.2
3.5 Free cash flow
Free cash flow is defined as the liquidity generated byoperating activities after deducting investments other thanacquisitions of subsidiaries and other changes in the scopeof consolidation.
Free cash flow is calculated based on the items presented inthe consolidated cash flow statement, and consists of thefollowing items:
> Operating cash flow before working capital changes;
> Changes in working capital requirement
> net interest paid;
> net income taxes paid;
> miscellaneous operational items paid;
> acquisitions of intangible assets and property, plant andequipment;
> proceeds from sales of property, plant and equipment;
> repayment of lease liabilities.
Following the entry into force of IFRS 16, the change in leaseliabilities presented in the line item “repayment of leaseliabilities” of the statement of cash flows is henceforthincluded in the definition of free cash flow.

Notes to the consolidated financial statements
FINANCIAL STATMENTS
Consolidated financial statements as of December 31, 201922
Free cash-flow
2018(in millions of euros) 2019
258.2 218.5Operating cash flow before working capital changes (A)
(31.9)Repayment of lease liabilities (B) (1) (0.4)
218.1226.3Total (A+B)
(12.3)Changes in working capital requirement 190.4
Net interest paid (22.7) (17.2)
(30.5)Net income taxes paid (25.3)
Miscellaneous operating items paid (0.7)(11.2)
(124.6)Acquisitions of intangible assets and property, plant and equipment (128.2)
3.7Proceeds from sale of property, plant and equipment 1.5
36.0Free cash flow 231.4
(1) In 2019, payments on lease liabilities recorded in accordance with IFRS 16 and in 2018, payment of finance leases in accordance with former IAS 17.
In 2019, the changes in working capital requirement benefited from the factoring and securitization lines (for a total amount of€126.3 million as of December) and the reduction in inventories (-€46.2 million).
Note 4 > Employee benefits4.1 Retirement benefits
Within the Tarkett Group, various systems for providing forretirement benefits depending on the legal, economic andtax environment of each country exist. In accordance withthe laws and uses applied in each country, the Groupparticipates in pension, welfare, health and retirementbenefit plans whose benefits are dependent on variousfactors such as length of service, salary and thecontributions paid to institutions.
Defined contribution plans
Defined contribution plans are post-employment benefitplans under which the Group pays fixed contributions andwill have no legal or constructive obligation to pay furthercontributions if the fund does not hold sufficient assets topay all employee benefits relating to employee service in thecurrent and prior periods.
These contributions, based on services rendered byemployees, are recognized as an expense in profit or loss asincurred.
Defined benefit plans
Defined benefit plans are post-employment benefit plansunder which the Group assumes the obligation of providingemployees with future benefits and thus also assumes therelated actuarial and investment risks. The defined benefitliability is calculated using the projected unit credit methodand is discounted to its present value from which theamount of past service cost for the period may also bededuced.
The detailed actuarial calculation requires the use ofactuarial hypotheses for demographic variables (mortality,employee turnover) and economic variables (futureincreases in salaries and medical costs, discount rate).
When defined benefit plans are totally or partially funded bycontributions paid to a separate fund or insurance company,those entities’ assets are measured at their fair value.
Their amount is then deducted from the obligation to definenet liability disclosed in the Group’s balance sheet.
The Group’s obligation in respect of such arrangements iscalculated by independent actuaries, in accordance with IAS19, “Employee Benefits”.

Notes to the consolidated financial statements
FINANCIAL STATEMENTS
Consolidated financial statements as of December 31, 2019 23
Description of plans
As of December 31, 2019, the Group’s largest retirementplans were in the United States, Germany, Sweden, Canada,the United Kingdom, and Russia. Those six countriesrepresent close to 93.2% of total benefit obligations underthe defined benefits plans.
In the United States and the United Kingdom, the Group’sretirement plans have been closed to new participants andto the accrual of rights for several years. Most of theGroup’s plans in Canada are now closed. These plans areprefinanced in accordance with local legislation.Additionally, the Group operates medical and life-insurancebenefit plans for certain employees in the United States.These plans are not covered by financing assets and arenow closed.
In Sweden, defined benefit retirement plans are mandatoryfor employees born prior to 1979 under the applicablecollective bargaining agreement. Employees born after thatdate participate in the mandatory defined contribution plan.In Germany, the Group offers a pension plan, service awardsand early retirement.
The Group also offers lump-sum retirement payments asprovided for by applicable legislation or collective bargainingagreements in certain countries, including Russia, Franceand Italy.
The weighted average duration of the defined benefitobligation is 13 years.
Special Events
In 2019, a “Wind-up” campaign was launched for twoCanadian plans. The goal is to offer plan beneficiaries achoice between exiting with a lump sum payment or exitingwith a mix of lump-sum and annuity payments. Thecampaign will be completed in 2020. The final accountingimpact will be known and recorded during 2020.
No other special events occurred in 2019.
Assumptions
Accounting for actuarial values relies on long-term interestrates, predicted future increases in salaries and inflationrates. The main assumptions are presented below:
December 31, 2019 December 31, 2018
Pensions Other benefitobligations
PensionsOther benefitobligations
Weighted discount rate 3.10%2.17%
Including:
3.00%3.20% 4.25%United States 4.25%
-0,30% / 0% / 0,75%Germany 1.50%
1.75%Sweden 2.50%
United Kingdom 2.75%2.00%
2.55% / 2.90%Canada 3.75%/4.00%
Russia 9.00%6.50% / 7.50%
2.33%Salary increases 2.60%
2.20%Inflation 2.16%
Discount rates are determined by reference to the yield onhigh-quality bonds. They are calculated on the basis ofexternal indices commonly used as references:
> United States: iBoxx $ 15+ year AA;
> Euro zone: iBoxx € Corporate AA 10+;
> Sweden: bonds of Swedish companies;
> United Kingdom: iBoxx £ 15+ year AA;
> Canada: Canadian AA “Mercer Yield Curve Canada”bonds;
> Russia: Russian government bonds.
December 31, 2019 December 31, 2018
PensionsTOTALAmounts recognized in the statement offinancial position (in millions of euros)
Other benefitobligations
TOTALPensions Other benefitobligations
222.4227.9Defined Benefit Obligations 229.71.8 1.8220.6
-(92.9) (92.6)(92.9) (92.6)-Fair value on plan assets
Net liability booked in the statement of financial position 136.71.8 1.8128.0 129.8135.0
Notes to the consolidated financial statements
FINANCIAL STATMENTS
Consolidated financial statements as of December 31, 201924
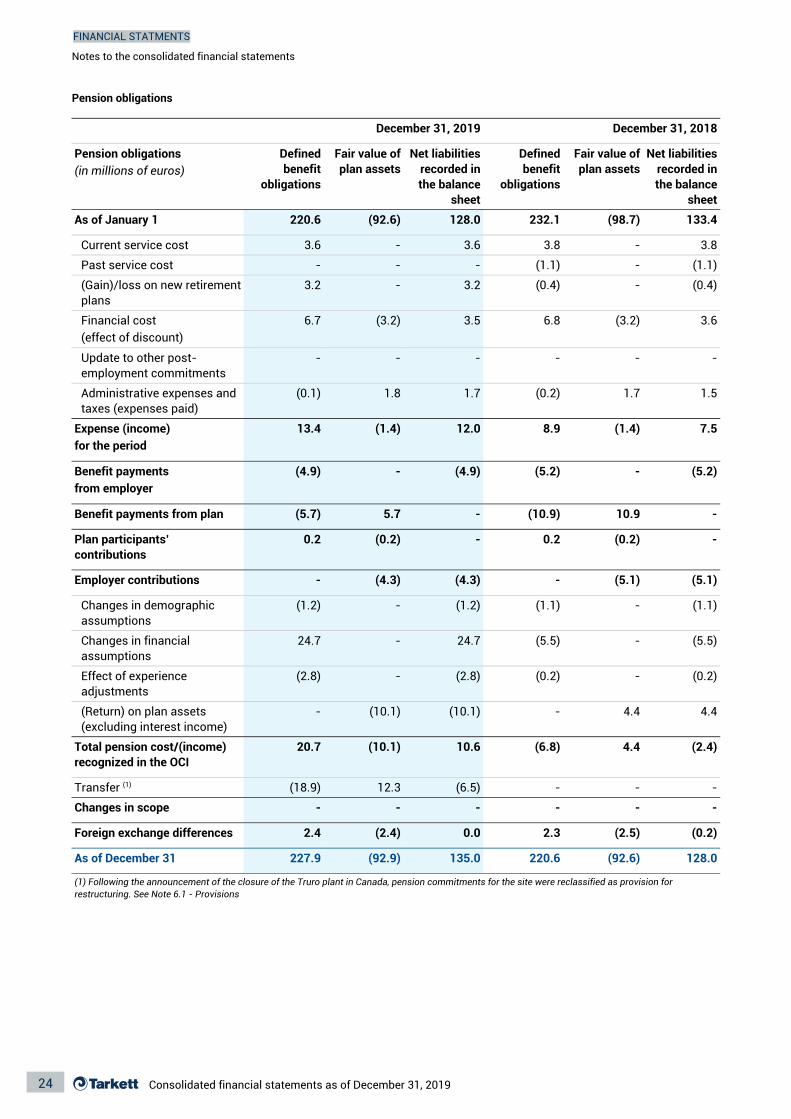
Pension obligations
December 31, 2018December 31, 2019
Fair value ofplan assets
Net liabilities recorded inthe balance
sheet
Definedbenefit
obligations
Pension obligations (in millions of euros)
Fair value ofplan assets
Net liabilitiesrecorded inthe balance
sheet
Definedbenefit
obligations
232.1 133.4220.6As of January 1 128.0(92.6) (98.7)
3.8 3.83.6Current service cost 3.6- -
- (1.1)- (1.1)-Past service cost -
3.2 (0.4)(Gain)/loss on new retirementplans
3.2 (0.4)--
6.7 6.8Financial cost (effect of discount)
3.5 3.6(3.2)(3.2)
--Update to other post-employment commitments
-- --
1.5(0.1)Administrative expenses and taxes (expenses paid)
1.71.8 1.7(0.2)
12.0 7.5(1.4)Expense (income) for the period
(1.4)13.4 8.9
Benefit payments from employer
(4.9)- -(5.2) (5.2)(4.9)
10.9Benefit payments from plan 5.7(5.7) (10.9)- -
(0.2) (0.2)0.2 -0.2Plan participants’ contributions
-
(4.3)- -(4.3) (5.1)(5.1)Employer contributions
(1.1) (1.1)(1.2)Changes in demographic assumptions
(1.2)- -
(5.5) (5.5)24.7Changes in financial assumptions
24.7- -
(2.8) (0.2)(2.8) (0.2)-Effect of experience adjustments
-
- -(Return) on plan assets (excluding interest income)
(10.1) 4.44.4(10.1)
(2.4)20.7Total pension cost/(income) recognized in the OCI
10.6(10.1) 4.4(6.8)
-12.3Transfer (1) --(6.5)(18.9)
- --Changes in scope -- -
2.4 2.30.0 (0.2)(2.5)Foreign exchange differences (2.4)
128.0227.9As of December 31 135.0(92.9) (92.6)220.6
(1) Following the announcement of the closure of the Truro plant in Canada, pension commitments for the site were reclassified as provision for restructuring. See Note 6.1 - Provisions

Notes to the consolidated financial statements
FINANCIAL STATEMENTS
Consolidated financial statements as of December 31, 2019 25
Other benefit obligations
31 décembre 2019 31 décembre 2018
Definedbenefit
obligations
Other benefit obligations (in millions of euros)
Net liabilitiesrecorded on
in thebalance
sheet
Definedbenefit
obligations
Fair valueof planassets
Fair valueof planassets
Net liabilitiesrecorded on in
the balancesheet
1.8 2.01.8 2.0-As of January 1 -
--- -Current service cost - -
--Past service cost -- --
- -- --(Gain)/loss on new retirement plans -
0.1 0.1-Financial cost (effect of discount) -0.1 0.1
-- -Update to other post- employment commitments
- --
Administrative expenses and taxes (expenses paid)
-- -- --
0.1 0.10.1 0.1-Expense (income) for the period -
- -- --Benefit payments from plan -
(0.2) (0.3)-Benefit payments from employer -(0.2) (0.3)
- --Plan participants’ contributions -- -
-Employer contributions -- -- -
(0.0) -Changes in demographic assumptions (0.0) ---
- -(0.1) (0.1)0.1Changes in financial assumptions 0.1
-(0.1)Effect of experience adjustments (0.1)- --
-- -- --(Return) on plan assets (excluding interest income)
Total pension cost/(income) recognized in the OCI
0.0- -(0.1) (0.1)0.0
- -- --Changes in scope -
- -0.1 0.10.0Foreign exchange differences 0.0
-1.8-As of December 31 1.81.81.8

Notes to the consolidated financial statements
FINANCIAL STATMENTS
Consolidated financial statements as of December 31, 201926
Allocation of plan assets by type of investment
December 31, 2018
December 31, 2019
Shares 36.7%34.7%
39.2%47.0%Bonds
14.0%12.1%Insurance contracts
3.8%Cash & cash equivalent (liquidity)
7.1%
2.4% 3.0%Real Estate
Sensitivity to discount rate assumptions
December 31,2019
(in millions of euros) December 31,2018
Increase of 50 points
(15.0)Increase (Decrease) in defined benefit obligations
(13.5)
Decrease of 50 points
Increase (Decrease) in defined benefit obligations
14.916.4
Sensitivity to inflation rate assumptions
(in millions of euros) December 31, 2018
December 31, 2019
Increase of 50 points
Increase (Decrease) in defined benefit obligations
4.86.0
Decrease of 50 points
(5.2) (4.4)Increase (Decrease) in defined benefit obligations
Benefits to be paid in the next five years
Benefits to be paid in the next five years under retirementand similar plans are estimated as follows:
December 31, 2019 December 31, 2018
2019 11.8-
2020 11.011.9
2021 11.212.1
11.111.72022
11.411.22023
11.12024 -
58.0 56.5TOTAL
4.2 Personnel costs and compensation of senior management
December 31, 2019(in millions of euros) December 31, 2018
Wages and salaries (668.6)(718.1)
Pension costs (2.3)(6.8)
Total Personnel costs (670.9)(724.9)
12,90712,950Employees (average number)
Key management personnel compensation
The key management personnel includes the members of the Executive Management Committee and the members of theSupervisory Board.
Key management personnel received the following compensation:
December 31, 2018December 31, 2019(in millions of euros)
6.26.0Short-term employee benefits
0.1-Retirement benefits
-Other long-term benefits -
0.8Lump-sum retirement payments 0.9
0.9Share-based payments 3.2
Total 10.47.7
Compensation of the Group’s key management personnel includes salaries, attendance fees and non-cash benefits.

Notes to the consolidated financial statements
FINANCIAL STATEMENTS
Consolidated financial statements as of December 31, 2019 27
4.3 Share based payment transactions
The Group regularly implements share grant plans. Thegrant-date fair value of equity-settled share-based paymentawards granted to employees is generally recognized as anexpense, with a corresponding increase in equity, over thevesting period of the shares awarded. At the end of eachfiscal year, the amount recognized as an expense isadjusted such that amount ultimately recognized is basedon the number of shares awarded that meet the relatedservice and non-market performance conditions at thevesting date.
For the three plans in effect, ordinary shares will be grantedto the beneficiaries at the end of a two-year vesting period.The grant will be subject to satisfying an economicperformance condition (based on the Group’s 3-year plan)and the beneficiaries’ continuous employment through theend of the vesting period. The 2018 and 2019 LTIP plans arealso conditional on a market performance condition.
In 2019, the 2016 LTIP plan resulted in a payment of 116,944shares.
LTIP 2018LTIP 2017 LTIP 2019
July 25, 2018September 25, 2017 June 24, 2019Grant date
June 30, 2021June 30, 2020 June 30, 2022End of the vesting period
228,765Number of shares 324,270271,417
19.8537.00 19.74Estimated value as of the plan’s start date (in euros)
135,709114,383 324,270Estimate of number of shares to be delivered as of December 31, 2019
Distribution of sharesForm of settlement
(1.3)(1.0)2019 expenses (in millions of euros) (1.3)
-2018 expenses (in millions of euros) (1.2)(2.0)
2017 expenses (in millions of euros) (1.4) --
Note 5 > Intangible assets and property, plant and equipment
5.1 Goodwill
For the measurement of goodwill at initial recognition,Tarkett applies IFRS 3 Revised (see 2.2), except foracquisitions accounted for before December 31, 2009, forwhich IFRS 3 (2004) was applied.
Negative goodwill (badwill) is recognized directly in profit orloss.
Goodwill is allocated to cash-generating units and is notamortized, but instead is tested at least annually for
impairment on the basis described in Note 5.3, or followingany event that could lead to a loss of value.
Subsequently, goodwill is measured at cost lessaccumulated impairment losses.
In respect of equity accounted investees, the carryingamount of goodwill is included in the carrying amount of theinvestment.
Changes in goodwill
December 31, 2019(in millions of euros) December 31, 2018
Opening carrying amount 510.5662.0
Goodwill on acquisitions during the period 132.41.7
Adjustment to initial purchase price allocation -(21.8)
19.18.7Foreign exchange gain & loss
662.0650.6Closing carrying amount

Notes to the consolidated financial statements
FINANCIAL STATMENTS
Consolidated financial statements as of December 31, 201928
The change is explained primarily by the acquisition over theperiod of the assets of Beyond The Turf, the foreignexchange impact relating to the evolution in the exchangerate between the euro and the U.S. dollar, and the update ofgoodwill from Lexmark.
On October 1, 2018, the Group finalized the acquisition ofLexmark Carpet Mills, in the United States, whichmanufactures high quality carpeting, principally for the hotelindustry in North America.
In 2018, Lexmark’s revenues totaled €101 million, and itsoperating income was €16 million (non audited data).Consolidated revenue for the fourthquarter in 2018 was €24million, and result from operating activities was €1 million.
Consideration for the acquisition totaled €222.6 million andincludes the repayment of Lexmark’s debt, for a value of€104.4 million.
As of December 31, 2019, goodwill from Lexmark totaled€112.9 million and was broken down as follows:
Changes in goodwill from Lexmark
December 31,2019
Variance Foreignexchange impact
December 31,2018
(in millions of euros)
227.24.3222.6 0.3Consideration paid (+)
94.4 1.818.2Fair Value of assets acquired (-) 114.3
2.5Total Goodwill recognized 112.9(17.8)128.2
The amount of goodwill recorded as of December 31, 2019 isfinal.
This goodwill is explained primarily by the following:
> Specific technology and know-how;
> Market share acquired in the hospitality and commercialcarpet segments in the United States; and
> Sales and supply chain synergies leveraging bothcompanies’ broad products portfolios.
In addition, on January 31, 2018, through its subsidiaryFieldTurf Tarkett SAS, Tarkett acquired the assets of GrassManufacturers Pty Limited (Grassman), a leading Australianartificial turf manufacturer. The Grassman acquisitionexpands FieldTurf’s presence on the Australian market, inparticular in hockey, tennis, and landscaping,complementing its football and rugby business. Thisacquisition will also provide a strong platform for servingfield builders and installers throughout Australia.
As of December 31, 2019, goodwill from Grassman totaled €3.9 million and was broken down as follows:
Changes in goodwill from Grassman
(in millions of euros) December 31,2019
VarianceDecember 31,2018
Foreignexchange impact
9.4- 0.19.3Consideration paid (+)
5.5-1.5 3.9Fair Value of assets acquired (-)
7.8 0.1(3.9)Total Goodwill recognized 3.9
The amount of goodwill recorded as of December 31, 2019 is final.
5.1.1 Allocation of goodwill between the various CGUsAs of December 31, within the EMEA segment, followingcessation of the laminates business performed essentiallyby the joint venture LaminatePark GmbH & Co. KG., theLaminate CGU was combined with Wood CGU.
In addition, in North America, following a reorganization atthe end of the year, the combining of the sales forces and all
support functions for the Commercial (other than carpet)CGU and Tandus & Centiva, they were combined into a newCommercial and Hospitality CGU.
Impairment tests were performed on each CGU individuallybefore the combinations.

Notes to the consolidated financial statements
FINANCIAL STATEMENTS
Consolidated financial statements as of December 31, 2019 29
Allocation of goodwill between the various CGUs is as follows:
December 31, 2019(in millions of euros) December 31, 2018
Net valueGross value Net valueGross value
70.4Resilient and miscellaneous 70.469.8 69.8
33.5 33.533.5Carpet 33.5
--Wood (1) --
--n/a n/aLaminate (1)
103.9 103.3103.9EMEA 103.3
n/a 55.8Commercial (excluding carpet) (2) 72.8n/a
Tandus & Centiva (2) n/an/a 312.9312.9
-375.0Commercial and hospitality (2) -358.0
-Residential -- -
375.0North America 385.7358.0 368.7
96.5 95.596.5CIS 95.5
(0.0)(0.0)APAC (0.0)(0.0)
0.10.1 0.10.1Latin America
95.6 95.696.6CIS, APAC and Latin America 96.6
Athletic tracks 34.440.0 33.439.1
Synthetic grass & other 61.459.3 61.059.9
100.5Sports Surfaces 93.799.9 94.4
675.4 662.0686.7Total goodwill 650.6
(1) CGU "Laminate" combined with CGU "Wood" in 2019.(2) CGUs "Commercial (excluding carpet)" and "Tandus & Centiva" merged in CGU "Commercial and hospitality" in 2019.
5.2 Intangible assets and property, plant and equipment5.2.1 Intangible assetsResearch and development
In accordance with IAS 38, expenditures on research anddevelopment are expensed as incurred except when thecriteria for capitalization are met.
Patents
Patents obtained by the Group are stated at cost lessaccumulated amortization and impairment losses.
Capitalized costs for internally generated patents principallyrelate to the costs of legal counsel. Patents capitalized areamortized on a straight-line basis over the shorter of thelength of the patent or estimated length of use.
Software licenses
Software is stated at cost less accumulated amortizationand impairment losses.
Amortization
Amortization of intangible assets is recorded on a straight-line basis from the date of their availability:
> patents and trademarks: the shorter of the length of thepatent or its length of use;
> development costs: 3 - 62/3 years;
> computer software: 3-5 years.

Notes to the consolidated financial statements
FINANCIAL STATMENTS
Consolidated financial statements as of December 31, 201930
5.2.2 Property, plant and equipmentProperty, plant and equipment are stated at cost lessaccumulated depreciation and impairment losses.
Acquisition cost
Acquisition cost includes purchase cost or production costplus the other costs incurred for bringing the items to theiroperating location and condition. The cost of a self-constructed asset includes the costs of raw materials anddirect labor, the initially estimated cost of any obligation fordismantling, removing and restoring the site on which theasset is located, and an appropriate allocation for directlyattributable production overhead.
When an item of property, plant and equipment includesmaterial components with different useful lives, each majorcomponent is accounted for separately.
Subsequent costs
Replacements and improvements are capitalized andrecorded as a separate asset if it is probable that the Groupwill derive economic advantages from the item, whilegeneral repairs, day to day servicing and maintenance arecharged to expenses as incurred.
Depreciation
Depending on the economic use of the asset, straight-linedepreciation is recorded over the following periods:
> Buildings: 20-30 years;
> Equipment and machinery: 62/3 - 10 years;
> Printing cylinders: 2 years;
> Other equipment and furnishings: 3-5 years.
IFRS 16: Leases
The rights of use resulting from leases are recognized asitems of property, plant and equipment and broken down bycategory at an amount equal to the present value of therental payments, adjusted, where applicable, for anyprepayments.
As a reminder, all of the accounting principles and methodsused by the Group are presented in Note 1.2.
The allocation of net values of intangible assets and property, plant and equipment is as follows:
(in millions of euros) December 31, 2018December 31, 2019
Research and development 5.14.1
11.29.6Patents
29.127.7Trademarks
22.8Software licenses 24.9
69.1Other intangible assets 51.6
22.2Advance payments and fixed assets in progress 11.4
Intangible Assets 133.3155.6
Goods and real property 197.0269.4
of which right to use goods and real property -73.7
Technical equipment and machinery 230.7235.8
of which right to use technical equipment and machinery -15.9
-Leased equipment 2.9
Advance payments and fixed assets in progress 84.2102.1
Property, plant and equipment 514.8607.3

Notes to the consolidated financial statements
FINANCIAL STATEMENTS
Consolidated financial statements as of December 31, 2019 31
The variations in gross value, depreciation and amortization break down as follows:
Change inscope
December 31, 2018
Disposal December 31, 2019
Acquisition costs (in millions of euros)
Acqui-sition
ForeignExchange
differences
TransferImpact ofIFRS 16 as
of Jan 1,2019
Research and development 17.70.7- -- 0.70.016.3
2.7-141.0 (0.1)0.7 (1.4)(0.0)Patents 142.8
1.655.2Trademarks 57.60.0- -- 0.8
-Software licenses 150.10.7-146.0 (10.2)7.1 6.5
(0.0) 1.414.768.2Other intangible assets 84.60.4- -
15.1 (4.5)0.0Advance payments and fixed assets in progress
22.30.3-11.4 -
- -(10.3) 6.617.0438.1Intangible assets 475.123.9
529.5 (3.9)17.6 9.3-Goods and real property 640.73.684.5
of which right to use goods and real property
(0.7) 94.28.8 1.184.5 (0.0)0.5 -
16.1 -(26.9) 8.411.11,404.1Technical equipment and machinery
1,445.532.7
16.1 (0.0)7.7 -of which right to use technical equipment and machinery
(1.3) 28.96.2 0.1
65.5 (47.7)-Advance payments and fixed assets in progress
102.10.3-84.2 (0.2)
100.7 -(31.0) 12.3(27.3)2,017.8Property, plant and equipment
2,188.3115.9
Allowance Foreignexchange
differences
Impact ofIFRS 16 as
of Jan 1,2019
TransferDecember31, 2018
Change inscope
Cumulative depreciation, amortization, and impairment (in millions of euros)
Disposal/reversal
December 31, 2019
(11.2) -(2.0) --Research and development
(13.6)(0.4)-
Patents (133.1)(0.9)- -0.1 (2.6)-(129.7)
(0.5)-(26.1) -(3.5) --Trademarks (29.9)
(0.2)(121.1)Software licenses (127.2)(15.1)- -10.1 (0.8)
-Other intangible assets (15.6)(0.4)-(16.7) 0.0(10.9) 12.4
10.2 (4.6)12.1(304.8)Intangible assets (319.5)(32.4)- -
(40.7) 0.1-Goods and real property
(371.3)(1.7)-(332.3) 3.2
(20.3) 0.0- -(0.3) -of which right to use goods and real property
0.2 (20.5)
26.5 (6.3)26.3(1,170.5)Technical equipment and machinery
(1,209.7)(85.6)- -
(5.2) -of which right to use technical equipment and machinery
1.2 (13.0)(8.9) (0.2)- 0.1
-Property, plant and equipment (1,581.0)(8.0)-(1,502.8) 29.6(126.3) 26.4
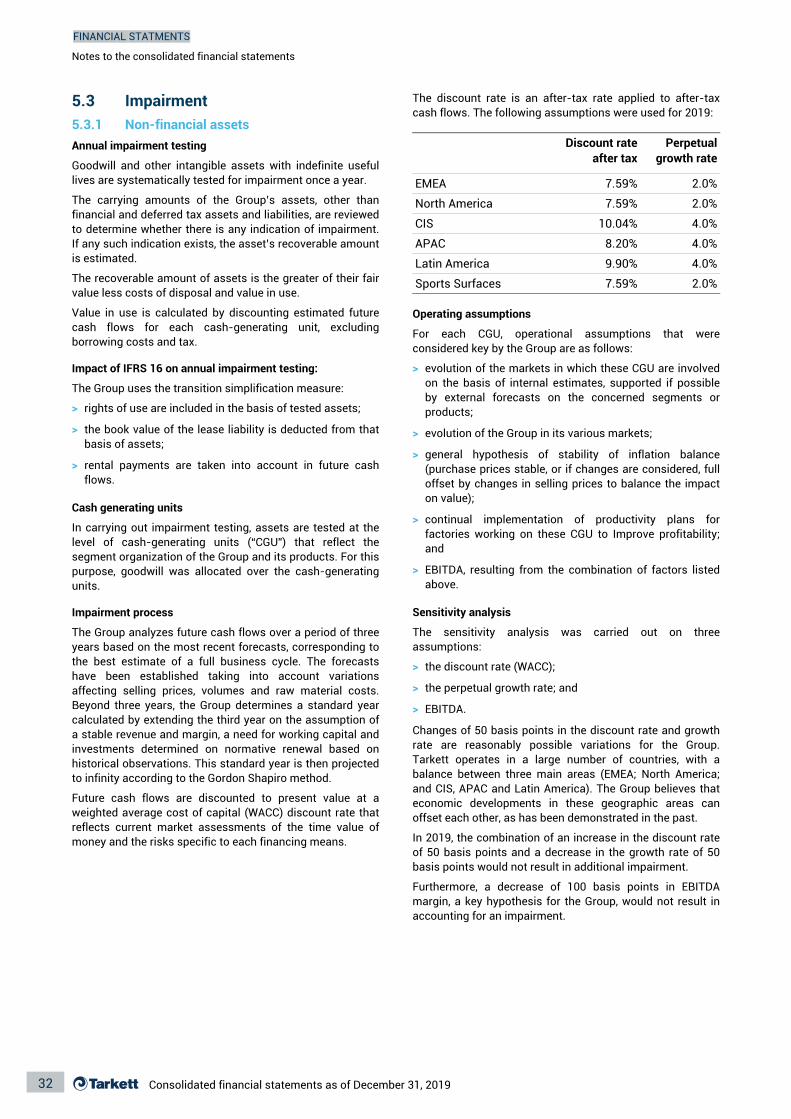
Notes to the consolidated financial statements
FINANCIAL STATMENTS
Consolidated financial statements as of December 31, 201932
5.3 Impairment5.3.1 Non-financial assetsAnnual impairment testing
Goodwill and other intangible assets with indefinite usefullives are systematically tested for impairment once a year.
The carrying amounts of the Group’s assets, other thanfinancial and deferred tax assets and liabilities, are reviewedto determine whether there is any indication of impairment.If any such indication exists, the asset’s recoverable amountis estimated.
The recoverable amount of assets is the greater of their fairvalue less costs of disposal and value in use.
Value in use is calculated by discounting estimated futurecash flows for each cash-generating unit, excludingborrowing costs and tax.
Impact of IFRS 16 on annual impairment testing:
The Group uses the transition simplification measure:
> rights of use are included in the basis of tested assets;
> the book value of the lease liability is deducted from thatbasis of assets;
> rental payments are taken into account in future cashflows.
Cash generating units
In carrying out impairment testing, assets are tested at thelevel of cash-generating units (“CGU”) that reflect thesegment organization of the Group and its products. For thispurpose, goodwill was allocated over the cash-generatingunits.
Impairment process
The Group analyzes future cash flows over a period of threeyears based on the most recent forecasts, corresponding tothe best estimate of a full business cycle. The forecastshave been established taking into account variationsaffecting selling prices, volumes and raw material costs.Beyond three years, the Group determines a standard yearcalculated by extending the third year on the assumption ofa stable revenue and margin, a need for working capital andinvestments determined on normative renewal based onhistorical observations. This standard year is then projectedto infinity according to the Gordon Shapiro method.
Future cash flows are discounted to present value at aweighted average cost of capital (WACC) discount rate thatreflects current market assessments of the time value ofmoney and the risks specific to each financing means.
The discount rate is an after-tax rate applied to after-taxcash flows. The following assumptions were used for 2019:
Discount rate after tax
Perpetualgrowth rate
7.59%EMEA 2.0%
North America 2.0%7.59%
CIS 4.0%10.04%
APAC 4.0%8.20%
4.0%9.90%Latin America
2.0%7.59%Sports Surfaces
Operating assumptions
For each CGU, operational assumptions that wereconsidered key by the Group are as follows:
> evolution of the markets in which these CGU are involvedon the basis of internal estimates, supported if possibleby external forecasts on the concerned segments orproducts;
> evolution of the Group in its various markets;
> general hypothesis of stability of inflation balance(purchase prices stable, or if changes are considered, fulloffset by changes in selling prices to balance the impacton value);
> continual implementation of productivity plans forfactories working on these CGU to Improve profitability;and
> EBITDA, resulting from the combination of factors listedabove.
Sensitivity analysis
The sensitivity analysis was carried out on threeassumptions:
> the discount rate (WACC);
> the perpetual growth rate; and
> EBITDA.
Changes of 50 basis points in the discount rate and growthrate are reasonably possible variations for the Group.Tarkett operates in a large number of countries, with abalance between three main areas (EMEA; North America;and CIS, APAC and Latin America). The Group believes thateconomic developments in these geographic areas canoffset each other, as has been demonstrated in the past.
In 2019, the combination of an increase in the discount rateof 50 basis points and a decrease in the growth rate of 50basis points would not result in additional impairment.
Furthermore, a decrease of 100 basis points in EBITDAmargin, a key hypothesis for the Group, would not result inaccounting for an impairment.

Notes to the consolidated financial statements
FINANCIAL STATEMENTS
Consolidated financial statements as of December 31, 2019 33
Impairment losses
An impairment loss is recognized whenever the carryingamount of a cash-generating unit exceeds its recoverableamount. Impairment losses are recognized in profit or loss.
Impairment losses recognized in respect of cash-generatingunits are allocated first to reduce the carrying amount ofany goodwill allocated to the cash-generating unit and then,to reduce the carrying amount of the other assets in the unit.
An impairment loss recorded in respect of goodwill cannotbe reversed. In respect of other assets, an impairment lossis reversed if there has been a change in the estimates usedto determine the recoverable amount.
5.3.2 Non-derivative financial assetsA financial asset not carried at fair value through profit orloss is assessed at each reporting date to determinewhether there is objective evidence that it is impaired.
For financial assets held for sale, a significant or prolongeddecline in fair value as compared with cost is results inrecognition of impairment on the income statement.
Impairment loss on an available-for-sale financial asset ismeasured as the difference between its carrying amount andits fair value, less any impairment loss previouslyrecognized in profit or loss.
An impairment loss in respect of a financial asset measuredat amortized cost is calculated as the difference between itscarrying amount and the present value of the estimatedfuture cash flows discounted at the asset’s original effectiveinterest rate.
Impairment
In 2019 no loss of value was recorded. In 2018, a loss ofvalue of €2.8 million was recorded and is broken down asfollows:
(in millions of euros) December 31, 2018
December 31, 2019
North America (2.8)-
TOTAL (2.8)-
5.4 Lease commitments
As of December 31, 2019, lease commitments concerncontracts that were not restated following the application ofIFRS 16, namely, primarily:
> contracts considered to be of low value pursuant toparagraph 5 of IFRS 16;
> service agreements that do not meet the definition of alease within the meaning of IFRS 16.
Minimum lease payments under operating leases arerecorded as expenses on a straight-line basis over the termof the lease.
Future minimum rental commitments under operatingleases with initial or remaining non-cancellable terms inexcess of one year, are summarized below:
December 31, 2019
(in millions of euros) December 31, 2018
Less than 1 year 28.12.3
3.0 69.91 to 5 years
0.0 16.2More than 5 years
Total future minimum lease payments 114.25.3
Reconciliation of off balance sheet commitments and the lease liabilities as of January 1, 2019
As of December 31, 2018, the Group’s operating leasecommitments are mainly commitments for buildings,vehicles, computer hardware and software, and offices.Such commitments totaled €114.2 million as of December31, 2018.
The difference between this amount and liabilities on leaseagreements pursuant to IFRS 16 is due to the following:
> lease liabilities do not include contracts signed prior toDecember 2018 but taking effect after January 1, contraryto off balance sheet commitments;
> lease liabilities do not include contracts with initial termsof one year or less, pursuant to the exceptions providedfor in paragraph 5(a) of IFRS 16, contrary to off balancesheet commitments;
> lease liabilities do not include contracts in which theunderlying asset is considered to be of low value,pursuant to the exceptions provided for in paragraph 5(b)of IFRS 16, contrary to off balance sheet commitments;
> estimation of the terms of certain leases pursuant to IFRS16 may differ from those of off balance sheetcommitments: these are contracts for which the Group isreasonably certain to exercise an option to renew or toterminate early, as the case may be;
> the effect of discounting liabilities on leases to presentvalue does not apply to off balance sheet commitments.

Notes to the consolidated financial statements
FINANCIAL STATMENTS
Consolidated financial statements as of December 31, 201934
Reconciliation of off-balance sheet commitments and lease liability as of January 1, 2019
January 1, 2019(in millions of euros)
Off balance sheet commitments in respect of operating leases as of December 31, 2018 114.2
4.0Leases signed as of December 31, 2018 and entering into effect as of January 1, 2019
Service agreements (and service portion of lease agreements) (2.0)
(0.7)Exemption for short-term leases (12 months or less)
Exemption for leases of low value (less than or equal to €5,000 or $5,000) (1.0)
0.0Effects of renewal and early termination options used
0.2Other
Gross lease liabilities as of January 1, 2019 114.7
(14.0)Discount effect
Lease liabilities as of January 1, 2019 100,7
5.5 Impact of exemptions to IFRS 16
The Group applies the exemptions provided for under IFRS16, Leases, keeping rental operating charges where thelease term as of the effective date is less than or equal to 12months and rental charges where the value of the underlyingasset is less than €5,000 or $5,000.
Such rental charges totaled €2.9 million and €0.8 million,respectively, as of December 31, 2019.
< or equal to 5 K€ / 5K$ Total> or equal to 12 months(in millions of euros)
(2.6)Cost of sales (0.3) (2.9)
(0.3)(0.1)Selling and distribution expenses (0.1)
- (0.0)(0.0)Research and development
(0.4) (0.5)(0.1)General and administrative expenses
-Other operating expenses - -
(3.7)(2.9)Impact on result from operating activities (0.8)
Note 6 > Provisions6.1 Provisions
Provisions come primarily from environmental risks, legaland tax risks, litigation and other risks.
A provision is recognized when the Group has a presentlegal or constructive obligation as a result of a past event,and it is probable that an outflow of economic benefits willbe required to settle the obligation. If the effect is material,provisions are determined by discounting the expectedfuture cash flows.
The amount recognized as a provision is the best estimateof the expenditure required to settle the present obligation at
the balance sheet date. Provisions are reversed when theyare no longer required.
A provision for warranties is recognized when the underlyingproducts are sold. The provision is based on historicalwarranty data. In the event of risks relating to specificproducts, an additional provision may be recorded.
A provision for restructuring is recorded when the Group hasapproved a detailed and formal restructuring plan, and therestructuring has been either implemented or publiclyannounced. Future operating losses are not provisioned.

Notes to the consolidated financial statements
FINANCIAL STATEMENTS
Consolidated financial statements as of December 31, 2019 35
Change in provisions
December 31, 2019
AllowanceDecember 31, 2018
Change inscope
(in millions of euros) Decrease Foreignexchange
gain & loss
Transfer
3.80.83.1 (0.0)(0.1) 0.0-Product warranty provision
--- -- (0.0)-Restructuring provisions
2.92.22.3 -(1.6) (0.0)-Claims & litigation provisions
3.42.17.6 -(3.3) -(3.0)Other provisions
0.1-0.1 -(0.0) 0.0-Provision for additional tax assessments
30.32.433.3 -(6.0) 0.6-Financial provisions (1)
40.57.546.4 (0.0)(11.1) 0.7(3.0)Total Provisions – long-term
14.15.318.9 (0.0)(8.5) 0.3(2.0)Product warranty provision
19.55.31.3 0.0(0.7) 0.013.6Restructuring provisions
14.15.711.0 -(4.7) 0.12.0Claims & litigation provisions
0.20.10.2 -(0.1) 0.0-Other provisions
48.016.531.4 0.0(13.9) 0.413.6Total Provisions – short-term
88.423.977.8 0.0(25.1) 1.110.6Total Provisions
Foreignexchange
gain & loss
December 31, 2017
(in millions of euros) DecreaseAllowance TransferChange inscope
December 31, 2018
-3.7Product warranty provision (1.1)0.5 -- 3.1
--Restructuring provisions -- -- -
(0.2)2.9Claims & litigation provisions (0.5)0.1 -- 2.3
-5.2Other provisions (0.6)- 3.0- 7.6
-1.2Provision for additional tax assessments
(1.1)- -- 0.1
1.636.7Financial provisions (1) (5.0)- -- 33.3
1.449.7Total Provisions – long- term (8.3)0.6 3.0- 46.4
0.619.1Product warranty provision (5.9)6.1 (1.0)- 18.9
-2.0Restructuring provisions (0.7)- -- 1.3
0.18.1Claims & litigation provisions (3.5)5.5 1.0(0.2) 11.0
-0.2Other provisions -- -- 0.2
0.729.4Total Provisions – short- term (10.1)11.6 -(0.2) 31.4
2.179.1Total Provisions (18.4)12.2 3.0(0.2) 77.8(1) Variations in provisions for financial liabilities relate to the provision for asbestos litigation recorded by Domco Products Texas Inc.

Notes to the consolidated financial statements
FINANCIAL STATMENTS
Consolidated financial statements as of December 31, 201936
6.2 Potential liabilitiesAsbestos
In the United States, the Group has been a defendant inlawsuits by third parties relating to personal injury fromasbestos. Expected costs of the current or future cases arecovered by Group’s insurances, sellers’ guarantees granted
by third-parties and by provisions that management, basedon the advice and information provided by its legal counsel,considers to be sufficient.
Note 7 > Financing and Financial Instruments7.1 Significant accounting principlesOther financial assets
Financial assets are initially recognized at their fair valueplus any applicable transaction costs except for financialassets at fair value through profit or loss for whichtransactions costs are recognized in profit or loss asincurred.
Under IFRS 9, all financial assets for which the cash flowsdo not represent solely payment of principal and interest(SPPI) must be recorded at fair value through profit andloss. However, IFRS 9 introduces an option that may beirrevocably elected at the time of initial recognition,investment by investment, permitting equity investments tobe recorded at fair value through other comprehensiveincome, without later being moved to profit and loss, even inthe event of a disposal. Only the dividends are recognized inprofit or loss.
Financial assets for which the cash flows do representsolely payment of principal and interest (SPPI) arerecognized at amortized cost using the effective interestrate method.
For non-current assets valued at amortized cost,impairment is assessed individually, taking into account therisk profile of the counterparty and the warranties obtained.At the time of the initial recording of such non-currentfinancial assets, impairment is systematically recorded inthe amount of the credit losses expected to result fromevents that may occur in the next twelve months. In theevent of a significant deterioration in the counterparty’scredit quality, the initial impairment is supplemented tocover all of the expected losses over the remaining maturityof the receivable.
For commercial receivables, the Group conducts a review ofeach of its customer receivables individually, taking intoaccount the probability of default by the counterparty aswell as the extent to which the receivables were hedged, anduses the simplified method provided for by IFRS 9 toprovision the expected losses over the remaining maturity ofthe receivables.
Non-derivative financial liabilities
Financial liabilities comprise financial debt and trade andother operating payables. They are accounted for atamortized cost using the effective interest rate method.
Derivative instruments
Derivatives are recognized in the balance sheet at their fairvalue (whether positive or negative) with changes in fairvalue immediately recognized in profit or loss.
However, derivative instruments that are part of a hedgingrelationship are classified either as fair value hedges (FVH)(when their purpose is to hedge an existing asset orliability’s exposure to the risk of changes in its fair value) orcash flow hedges (CFH) (when their purpose is to hedge theexposure to changes in the cash flows associated withhighly probable future transactions).
Derivative instruments that are part of a hedge aredocumented on the basis of intrinsic value for exchange rateand interest rate options, and on the basis of the spot pricecomponent for forward contracts.
Changes in fair value relating to the effective portion ofderivative exchange rate and interest rates instrumentsqualified as fair value hedges (FVH) are recognized withinincome. The value of the hedged items is adjusted to theirfair value and the changes in fair value attributable to thehedged risk(s) are also recognized in profit and loss.
Changes in fair value relating to the effective portion ofderivative exchange rate and interest rates instrumentsqualified as cash flow hedges (CFH) are recognized withinother comprehensive income, and the result of such hedgesis recorded in profit and loss, symmetrically to the risk beinghedged.
The time value of exchange rate and interest rate options isrecorded as a cost of hedging. Changes in time valuerecorded over the life of the option are recorded as acounterpart to other comprehensive income. The initialoption premium is either (i) moved into profit or loss whenthe hedged transaction impacts profit or loss, where thehedged item is related to a transaction (commercial foreignexchange hedges); or (ii) amortized in profit or loss over theduration of the hedge, where the hedged item is related to aperiod of time (interest rate hedges).
Changes in value of the swap point for forward contractsclassified as hedges are recorded in profit and loss.
Cash and cash equivalents
Cash and cash equivalents comprise cash at bank and onhand, term deposits, monetary UCITs, and other monetaryinvestments with initial maturities not exceeding threemonths and subject to an insignificant risk of changes invalue.

Notes to the consolidated financial statements
FINANCIAL STATEMENTS
Consolidated financial statements as of December 31, 2019 37
7.2 Financial income and expenses
Financial expense includes, in particular, interest payable onborrowings accounted for at amortized cost using theeffective interest method, and the effects of the relatedhedges.
Other financial income and expense includes the incomeand expenses associated with loans and receivables
accounted for at amortized cost, the gains recognized inrespect of investment of cash and cash equivalents,financial charges relating to the discounting of post-employment expenses, exchange rate gains and losses,impairment losses relating to financial assets, anddividends, which are recorded in net income when the rightto payment vests.
December 31, 2019(in millions of euros) December 31, 2018
1.1Interest income on loan assets & cash equivalents 0.7
0.2Other financial income 0.3
Total financial income 1.01.3
Interest on financial liabilities (15.2)(18.8)
Financial expense relating to leases (0.2)(4.2)
(3.5)(4.8)Commission expenses on financial liabilities
(1.0)(1.1)Cost of loans and debt renegotiation
(5.3)Interest on provisions for pensions (5.1)
0.5Foreign exchange gains or losses (4.8)
(0.1)Impairment of financial assets -
Changes in value of interest rate hedge instruments (1.2)(5.8)
Other financial expenses (0.1)(0.7)
Total financial expenses (31.1)(40.1)
(30.1)(38.8)Financial income and expenses

Notes to the consolidated financial statements
FINANCIAL STATMENTS
Consolidated financial statements as of December 31, 201938
7.3 Net debt – interest-bearing loans and borrowings7.3.1 Net DebtNet debt is defined as the sum of interest bearing loans andborrowings minus cash and cash equivalents. Interest-bearing loans and borrowings refer to any obligation for the
repayment of funds received or raised that are subject torepayment terms and interest charges. They also includeliabilities on finance leases.
December 31, 2019(in millions of euros) December 31, 2018
Short-termLong-termShort-termLong-term
0.7240.9Bank loans 3.657.2
612.1Private placements -595.5-
1.8 0.90.2Other loans -
7.2-Bank overdrafts 7.8-
0.82.5 0.82.5Leases (1)
839.111.6673.6Interest bearing loans and borrowings 10.2
849.3Total interest bearing loans and borrowings 685.2
(95.7)Cash and cash equivalents (137.7)
547.5Net debt before application of IFRS 16 (1) 753.6
22.766.6Leases (2) --
636.8 753.6Net debt (2)
(1) Leases recorded in accordance with former IAS 17 – finance leases.(2) Leases recorded in accordance with IFRS 16 (excluding leases previously recorded in accordance with IAS 17).
The change in net debt during the fiscal year relatesprimarily to cash flows from operating activities, to reducedworking capital requirement, and to the non-recourseassignment of certain trade receivables in certainsubsidiaries.
In June 2019, Tarkett entered into a non-recourse factoringline of credit for certain European and Australiansubsidiaries and a non-recourse securitization line of creditfor certain U.S. subsidiaries. As a result, the prior €50.0million French, German, and Spanish-law assigment ofreceivables with recourse, which was not used, has beenterminated.
As of December 31, 2019, Tarkett is using its factoring andsecuritization lines of credit in the amounts of €101.2 millionand $28.2 million.
All of the interest-bearing loans and borrowings areunsecured and include mainly:
> A "Schuldschein" of €144.0 million and $26.5 millionentered into in June 2019 and maturing in June 2026 for€51.0 million, in June 2025 for €45.0 million, and in June2024 for the remainder;
> A "Schuldschein" of €252.5 million and $50.0 millionentered into in April 2017 and maturing in April 2024 for€150.5 million and in April 2022 for the remainder;
> A "Schuldschein" of €147.5 million entered into in June2016 and maturing in June 2023 for €91.0 million and inJune 2021 for €56.5 million, and for which the previousvariable rate tranches were repayed using theSchuldschein of June 2019;
> A multi-currency revolving syndicated loan with acapacity of €700.0 million subscribed in May 2019 for aterm of five years with two options to extend for anadditional year, and which was used in the amount of€53.4 million as of December 31, 2019.

Notes to the consolidated financial statements
FINANCIAL STATEMENTS
Consolidated financial statements as of December 31, 2019 39
7.3.2 Details of loans and borrowings
3 to 5 ansuntil
31/12/2024
Currencyof draw-
down
TOTALInterest rate 2 years until
31/12/2021
12 months orless until
31/12/2020
December 31, 2019 (in millions of euros)
Morethan 5years
Bank loans
-European revolving credit facilities
-2.49%USD -53.4 53.4
1.6Other bank loans -5,22%-5,70%RMB 3.67.4 2.2
Subtotal Bank loans 1.63.6 -55.660.8
1.15%-1.722%
56.5- 96.0391.5EURPrivate placements Europe 544.0
3,48%-3,57% -- -68.1USDPrivate placements Europe 68.1
--- -Financing backed by business receivables
-
-0,25% -4,05%
EUR -1.8 0.90.9Other loans
7.2 --7.2Bank overdrafts -
0.83.3 1.6Leases (1) 0.8 0.1
517.7685.2Interest bearing loans and borrowings (1)
59.811.6 96.1
89.3 28.8Leases (2) 26.7 11.122.7
774.5Interest bearing loans and borrowings (2) 86.534.3 107.2546.5
(1) Leases recorded in accordance with former IAS 17 – finance leases(2) Leases recorded in accordance with IFRS 16 (excluding leases previously recorded in accordance with IAS 17).
December 31, 2018 (in millions of euros)
Morethan 5years
Interest rateCurrencyof draw-
down
12 months orless until 31/12
/2019
TOTAL 3 to 5 ansuntil 31/12/
2023
2 years until 31/12/
2020
Bank loans
-USDEuropean revolving credit facilities
235.83.27%-3.55%
235.8- -
3.6RMBOther bank loans 5.85.22% 1.50.7 -
241.6Subtotal bank loans 237.30.7 -3.6
Private placements Europe 502.51.15%-1.722%
-- 150.5352.0EUR
Private placements Europe 93.04.07%-4.54%
-- -93.0USD
Financing backed by business receivables
0.93,85%-5,75% -0.9 --EUR
Other loans 0.20.25% 0.1- -0.1EUR
Bank overdrafts - -7.87.8 -
Leases (1) 0.80.8 0.11.63.3
150.610.2849.3 450.3Interest bearing loans and borrowings (1)
238.2
- ---Leases (2) -
10.2849.3 450.3Interest bearing loans and borrowings (2) 238.2 150.6
(1) Leases recorded under the former IAS 17 – Leases.(2) Leases recorded under IFRS 16 (excluding leases previously recorded under IAS 17).

Notes to the consolidated financial statements
FINANCIAL STATMENTS
Consolidated financial statements as of December 31, 201940
7.3.3 Financial ratio covenantsThe facilities mentioned above contain covenants bindingon the borrower, including financial ratio covenants: theratio of net debt to adjusted EBITDA may not exceed 3.0 asof December 31, of each year and 3.5 as of June 30 of eachyear, with additional leeway of 0.5 in the event of asignificant acquisition.
The Group is in compliance with all of its bankingcommitments as of December 31, 2019, as well as with thefinancial ratio covenants "Net debt / Adjusted EBITDA", asdetailed below:
December 31, 2018December 31, 2019Net debt / Adjusted EBITDA (in millions of euros)
753.6Net debt (1) 547.5
267.4Adjusted EBITDA (2) 249.5
2.2Ratio (3) 2.8(1) Net debt excluding lease liabilities resulting from the application of IFRS 16, but including €3.3 million relating to finances leases (€3.3 million as of December 31, 2018).(2) Adjusted EBITDA used to exclude the impact of the application of IFRS 16 as of December 31, 2019, in accordance with the calculation methods provided for in the underlying financing contract.(3) Must be less than 3.0 as of December 31 and less than 3.5 as of June 30.
As of December 31, 2018, the ratio of adjusted EBIT to net interest was a contractual covenant. This ratio is no longer one of thecovenants required by the new documentation for the syndicated loan and for the June 2019 Schuldschein.
7.3.4 Cash and cash equivalents
December 31, 2019(in millions of euros) December 31, 2018
93.1 31.4Current cash
Remunerated cash balances 56.437.1
7.97.4Short term treasury notes and Money Market funds
137.7 95.7Cash and cash equivalents
7.3.5 Changes in financial liabilitiesThe following table reconciles changes in financial liabilities shown on the balance sheet and the cash flow statement:
ReclassificationDecember31, 2018
December31, 2019
(in millions of euros) Non-cash changeCash-flows
Fair valuechange
Foreignexchange
differences
Acquisition(3)
(175.4)Long-term financial liabilities
740.6-116.4839.6 9.6(49.5)
10.1 (2.3)49.5(23.3)Short-term financial liabilities
34.2--
3.1Long-term financial assets (1)
(23.6)--(33.7) (0.4)7.5
(1.2) --(2.1)Short-term financial assets
(3.3)--
(4.8)Other
Total changes in financing activities (2) (202.5)
Cash-flows from financing activities (2) (202.5)
(1) Excluding shares accounted for by the equity method.
(2) Excluding dividends, acquisition of treasury shares and acquisition of non-controlling interests.
(3) of which €100.7 million for IFRS 16 as of January 1, 2019 and €15.7 million related to new leases in 2019.

Notes to the consolidated financial statements
FINANCIAL STATEMENTS
Consolidated financial statements as of December 31, 2019 41
7.4 Other financial assets and liabilities7.4.1 Other financial assets
December 31, 2018December 31, 2019(in millions of euros)
0.0Long-term investments -
24.1Financial investments and receivables – long-term (1) 21.7
Other financial assets 24.121.7
(1) Financial investments and receivables – long-term include shares of companies accounted for by the equity method.
The variations in gross value, depreciation and amortization break down as follows:
IncreasesAcquisition costs (in millions of euros)
December 31, 2019
TransferDecreasesDecember 31, 2018
Foreign exchange differences
-- ---Long-term investments -
(7.5)12.126.6 24.20.4(7.4)Financial investments and receivables – long-term
24.2(7.4)26.6Other financial assets 0.4(7.5)12.1
December 31, 2018
December 31, 2019
Impairment losses
DisposalAllowance Foreignexchange
differences
Accumulated depreciation and amortization (in millions of euros)
TransferDecrease
- ----Security deposit – long-term
---
(2.5)--(2.5)Long-term financial assets and receivables
0.1--(0.1)
---(2.5) (2.5)0.1-(0.1)Other financial assets
7.4.2 Other financial liabilities
(in millions of euros) December 31, 2018December 31, 2019
--Fair value of derivatives non-current
0.3 4.1Other financial liabilities non-current
4.1Other financial liabilities non-current 0.3
2.11.3Accrued interest expenses current
3.6Fair value of derivatives current 2.0
5.9Other financial liabilities current 4.5
10.0Other financial liabilities current 9.5

Notes to the consolidated financial statements
FINANCIAL STATMENTS
Consolidated financial statements as of December 31, 201942
7.5 Fair value of financial assets and liabilities
When measuring the fair value of an asset or a liability, theGroup uses market observable data as far as possible.
Fair values are categorized into three levels based on theinputs used in the valuation techniques, as follows:
> level 1: quoted prices (unadjusted) on active markets foridentical assets or liabilities;
> level 2: prices determined using valuation techniquesbased on observable market data;
> level 3: inputs relating to the asset or liability that are notbased on observable market data (unobservable inputs).
The fair value of interest rate swaps and of interest rate andforeign currency options is the estimated amount that theGroup would expect to receive or have to pay in order tocancel each derivative instrument at the balance sheet date,taking into account the current level of interest rates and the
credit risk associated with these instruments’counterparties.
The derivative Financial Instruments (swaps, caps, floors,etc.) entered into by the Group are traded on over-the-counter markets on which there are no quoted prices. Theyare therefore measured using the valuation modelscommonly employed by operators in the market (Level 2).
Derivative instruments are entered into exclusively with firstclass banks or other financial institutions, and with the solepurpose of providing security for the Group’s currentoperations and for the financing thereof.
In the case of receivables and payables with maturities ofless than a year and certain floating rate receivables andpayables, historical cost is considered as a reasonableapproximation of their fair value.
Fairvalue
Fair value ofinterest rate
hedgeinstruments
Assets atamortized
cost
December 31, 2019 Carrying amount
Fair valuethrough
profit andloss
Liabilities atamortized
cost
FairValue
Category
(in millions of euros)
21.7-0.1Financial assets, non-current 21.721.6-Level 2
3.4--Level 2 3.43.4-Other current financial assets
258.5-258.5Trade receivables 258.5--Level 2
137.7137.7-Level 2 137.7--Cash and cash equivalents
774.5--Interest-bearing loans and borrowings 774.5-774.5Level 2
0.3-0.3Level 2 0.3--Other non-current financial liabilities
9.53.7-Other current financial liabilities 9.5-5.8Level 2
324.0-324.0Level 2 324.0--Trade payables
December 31, 2018 Fairvalue
Fair valuethrough
profit andloss
Assets atamortized
cost
FairValue
Category
Carrying amount
Fair value ofinterest rate
hedgeinstruments
Liabilities atamortized
cost
(in millions of euros)
24.116.5Level 2 --7.6Financial assets, non-current 24.1
3.1--Other current financial assets 3.13.1-Level 2
350.5-Level 2 --350.5Trade receivables 350.5
---Cash and cash equivalents 95.795.795.7Level 2
849.3-Level 2 -849.3-Interest-bearing loans and borrowings 849.3
-4.1-Other non-current financial liabilities 4.14.1-Level 2
10.0-Level 2 2.08.0-Other current financial liabilities 10.0
-283.6-Trade payables 283.6283.6-Level 2

Notes to the consolidated financial statements
FINANCIAL STATEMENTS
Consolidated financial statements as of December 31, 2019 43
7.6 Financial risks and Financial Instruments7.6.1 Financial risk managementThe Group’s financial risk (market risk, credit risk andliquidity risk) management objectives and policies areconsistent with those disclosed in the consolidated financialstatements as at and for the year ended December 31,2018.
7.6.2 Derivative instrumentsThe Group uses derivative Financial Instruments to hedgesome of its exposure to foreign currency risk and interestrate risk associated with its purchases and salesdenominated in foreign currencies and with its financing andinvestment transactions.
The derivatives employed include interest rate options, otherforward contracts and foreign currency options.
In accordance with its policy in respect of FinancialInstruments, the Group neither uses nor issues derivativeFinancial Instruments for trading purposes.
7.6.3 Financial market risksExposure to interest rate, currency, liquidity and credit risksarises in the normal course of Tarkett’s activities. Derivativefinancial instruments are used to reduce the exposure tofluctuations in both foreign exchange and interest rates.Liquidity and credit risk are managed following specificprocedures approved by the Group’s management bodies.
The portfolio of derivative instruments is broken down as follows:
Counterpart in OCI (1)Maturity Fair valueAccountingclassification
December 31, 2019(in millions of euros)
-1.9FVH < Mar 2020Currency swaps
1.9 -Exchange rate derivative instruments
< May 2021Forward exchange contracts (0.9)(1.0)CFH
< Dec 2020Options (0.5)CFH (0.2)
(1.4)(1.2)Exchange rate derivatives related to commercial transactions
(0.9)CFH < April 2024Caps (1.0)
(1.0)Interest rate derivatives (0.9)
(2.4)Total (0.2)(1) Corresponds to the balance of the counterpart in OCI as of December 31, 2019.
Fair valueAccountingclassification
December 31, 2018(in millions of euros)
Counterpart in OCI (1)Maturity
< June 2019Currency swaps -0.4FVH
-Exchange rate derivative instruments 0.4
CFH 0.2Forward exchange contracts 0.2< Mar 2020
0.8< Jan 2020Options 0.5CFH
Exchange rate derivatives related to commercial transactions
0.71.0
(0.5)(0.3)CFH < April 2024Caps
(0.3) (0.5)Interest rate derivatives
Total 0.21.1(1) Corresponds to the balance of the counterpart in OCI as of December 31, 2018.

Notes to the consolidated financial statements
FINANCIAL STATMENTS
Consolidated financial statements as of December 31, 201944
The nominal amounts of derivative instruments hedging the main exposures are broken as follows:
December 31, 2019(in millions of euros) December 31, 2018
GBP NOKUSDCurrency of exposure PLNNOKCADPLN CADGBPUSD
275.3 4.5102.5-0.1 -30.1Exchange rate derivative instruments 33.641.62.3
-- 10.3- 35.315.346.6- -Exchange rate derivatives related to commercial transactions
-
33.615.3Nominals hedging the main currencies (in euros)
2.3 30.1102.541.646.7 10.3275.3 39.8
a) Interest rate riskThe Group manages its exposure to interest rate riskcentrally. The Group’s general debt strategy is to givepreference to floating interest rate debt over fixed interestrate debt, but also to use interest rate derivatives to protecta part of the floating rate debt over a period of three to fiveyears against a rate increase that could result in extensive
damage. The hedging tools used are mainly cap or tunneltype derivatives. The cost of the cap may be offset in part orin full by a tunnel.
Following is the interest rate structure of the Group’s netdebt before and after application of interest rate hedges.
December 31, 2019Fixed rate(in millions of euros) Floating rate
406.6 774.5367.9Interest-bearing loans and borrowings
Cash and cash equivalents (129.7) (137.7)(8.0)
636.8359.9Net debt before hedging 276.9
-112.0Effect of hedging (112.0)
164.9 636.8471.9Net debt after hedging
December 31, 2018(in millions of euros) Floating rateFixed rate
343.3 849.3Interest-bearing loans and borrowings 506.0
(87.8)(7.9) (95.7)Cash and cash equivalents
Net debt before hedging 418.2335.4 753.6
-Effect of hedging (111.2)111.2
446.6 753.6Net debt after hedging 307.0

Notes to the consolidated financial statements
FINANCIAL STATEMENTS
Consolidated financial statements as of December 31, 2019 45
Sensitivity analysis
Sensitivity to interest-rate fluctuations is calculated on thebasis of interest-bearing non-derivatives and derivativeFinancial Instruments, as well as interest-bearing loansgranted to joint ventures or third parties. The analysis is
based on the market index in effect at the balance sheetdate and on assumptions of constant debt and constantdebt management policy over one year.
December 31,2019(in millions of euros) December 31, 2018
3.2
Increase of 100 basis points
Increase (Decrease) in financial expense 2.4
(3.0)
Increase of 100 basis points (1)
Increase (Decrease) in financial expense (1.5)(1) With a floor of 0%
b) Exchange rate risk
Transaction risk
Exchange rate fluctuations have a direct impact on theGroup’s Consolidated Financial Statements, derived fromtransactions regarding the Group entities that incurrevenues and expenses in currencies other than theirfunctional currency.
Exchange rate derivatives related to commercial transactions
The Group has attempted to develop its productioncapacities in the same geographic and monetary areaswhere it distributes its products. Moreover, through thechoice of the invoicing currency for certain intra-grouptransactions, the Group aims to offset revenues with costsin the same currency. In certain unstable currency countries,the Group may also offset the local currencies fluctuationswith price indexations. Therefore the remaining exposure oncross-border transactions is moderate. The currencies towhich the Group is most exposed are the British pound, theNorwegian crown, the U.S. dollar, the Polish zloty, theAustralian dollar, the Canadian dollar, the Russian ruble andthe euro as a foreign currency for certain subsidiaries.
The Group has attempted to reduce the impact of short-termfluctuations of currencies on its revenue throughcentralized management of exchange risks and the use ofderivatives. Nevertheless, in the long-term, significant andlong lasting variations in exchange rates could affect theGroup’s competitive position in foreign markets, as well asits results of operations.
The Group’s policy is to hedge certain significant residualexposure, decided upon periodically by the financedepartment based on monitoring Value at Risk. Thisexposure includes exposure recorded on the balance sheet,namely all recognized trade receivables, trade payables andborrowings denominated in a foreign currency, andunrecorded exposure, which consists of forecast sales andpurchases over a six-month period.
Exchange rate derivative instruments relating to financing
The Group may be exposed to transactional exchange-raterisk on certain intragroup loans and borrowings resultingfrom the financing of its foreign subsidiaries. The Groupminimizes this risk either (i) by borrowing in the samecurrency or (ii) by entering into currency swaps or forwardsreflecting the maturity of the hedged item.

Notes to the consolidated financial statements
FINANCIAL STATMENTS
Consolidated financial statements as of December 31, 201946
7.6.4 Liquidity risksa) Future cash flows on Financial InstrumentsThe following figures show the estimated future cash flowson interest-bearing loans and borrowings recorded asliabilities on the balance sheet.
The estimate of future cash flows on interest is based on thedebt amortization table and on the assumption of acrystallization of the interest rates outstanding as of theclosing date, unless a better estimate is available.
December 31,2019
More than 5years
Financial liabilities Less than 12months
1 to 2 years 3 to 5 years
InterestPrincipalInterestCarryingamount
InterestPrincipal(in millions of euros) Totalfuture
cashflows
PrincipalInterestPrincipal
Interest-bearing loans
74.6 -Bank loans 55.63.23.3 -60.8 7.31.63.6
459.656.5652.2 96.0Private placements 10.410.8- 1.5612.1 17.4
- -1.8Other loans 0.90.90.11.9 ---
7.2 ---7.2 --Bank overdrafts --7.2
-- -3.3 -0.80.83.3 0.1Finance leases 1.6
103.1 11.1Leases 3.04.122.7 2.289.3 4.528.826.7
Total 546.586.518.3842.3 107.229.216.634.3 3.7774.5
Other financial liabilities
-324.0 --324.0324.0 -Trade payables ---
--- -0.3 --0.30.3 -Other non-current financial liabilities
-9.5 ---9.5 -9.5Other current financial liabilities
--
-Total --333.8333.8 --0.3333.5 -
86.8367.81,176.1 107.2Total financial liabilities 546.516.618.3 3.71,108.3 29.2

Notes to the consolidated financial statements
FINANCIAL STATEMENTS
Consolidated financial statements as of December 31, 2019 47
December 31, 2018Financial liabilities 1 to 2 yearsLess than 12months
More than 5 years3 to 5 years
Totalfuture
cashflows
PrincipalInterestPrincipal InterestPrincipalInterestCarryingamount
InterestPrincipal(in millions of euros)
-- --Interest-bearing loans ---- --
-241.6 0.2237.30.7257.0 -Bank loans 3.65.010.2
11.611.5- 0.8595.5 19.0445.0-638.4 150.5Private placements
0.11.4 -0.10.10.9 -1.1Other loans 0.10.1
-Bank overdrafts -0.17.97.8 ---7.8 -
0.80.83.3 0.1Finance leases 1.6-- -3.3 -
10.2 0.8849.3 19.3450.3238.2908.0 150.6Total 16.721.9
--- --Other financial liabilities ---- -
-283.6283.6 ---283.6 --Trade payables -
4.1 -Other non-current financial liabilities
--- -4.1 -4.1-
--10.0 -Other current financial liabilities
--10.0 -10.0 -
293.6 -297.7Total -4.1-297.7 ---
1,147.0 19.316.7242.3303.8 0.8150.6Total financial liabilities 450.321.91,205.7
b) Liquidity positionThe Group’s debt capacity is €1,502.8 million, including€89.3 million related to the leasing debt (IFRS 16), of which€774.5 million has been used (see Note 7.3.1). Includingcash and cash equivalents, the liquidity position of theGroup amounts to €866.0 million.
(in millions of euros) December31, 2018
December31, 2019
728.3 533.5Amount available on credit facilities
137.7 95.7Cash and cash equivalents
Total 629.2866.0
7.6.5 Credit riskCredit risk represents the risk of financial loss for the Groupin the event that a counterparty to a financial instrumentdefaults in paying its contractual obligations.
The financial assets potentially bearing this risk are mainly:
> cash deposits;
> derivative instruments;
> trade receivables;
> loans granted.
The maximum potential credit risk on the financial assets isequal to their net accounting value less the indemnificationreceivable from credit insurance.
a) Customer credit riskThe Group believes that its exposure to counterparty risk islimited, because of its large number of customers, itsdispersion in many geographical areas, and its follow-uppolicy. The Group has established a credit policy whichincludes, among other things, a credit limit for eachcustomer, collections processes, and a computer-aidedcredit scoring and customer payment behavior follow-up.
The total of receivables overdue over 60 days amounts toapproximately 11% of total accounts receivable as of
December 31, 2019 (9.0% of total accounts receivable as ofDecember 31, 2018).
The Group believes that there is no need to assume thatthere is risk on outstanding receivables less than 60 daysoverdue.
With respect to outstanding receivables that are more than60 days overdue, the Group believes that risks are limitedgiven existing procedures for customer risk management(as detailed above).
b) Credit risk management on equities and derivativesThe counterparties to the Group’s financial derivatives areleading banks, all of which have business relationships withthe Group for debt or cash management. The Group’s policywith regard to investments and cash deposits is to onlyinvest in liquid securities and only with the leading creditinstitutions in the countries where the investments aremade.
The Group is not exposed to a material risk due to anysignificant concentration, and does not anticipate anycounterparty default.
The effect of Credit and Debit Valuation Adjustments (CVA/DVA) on the measurement of the fair value of the derivativeFinancial Instruments was not material as at the closingdate and was therefore not booked.
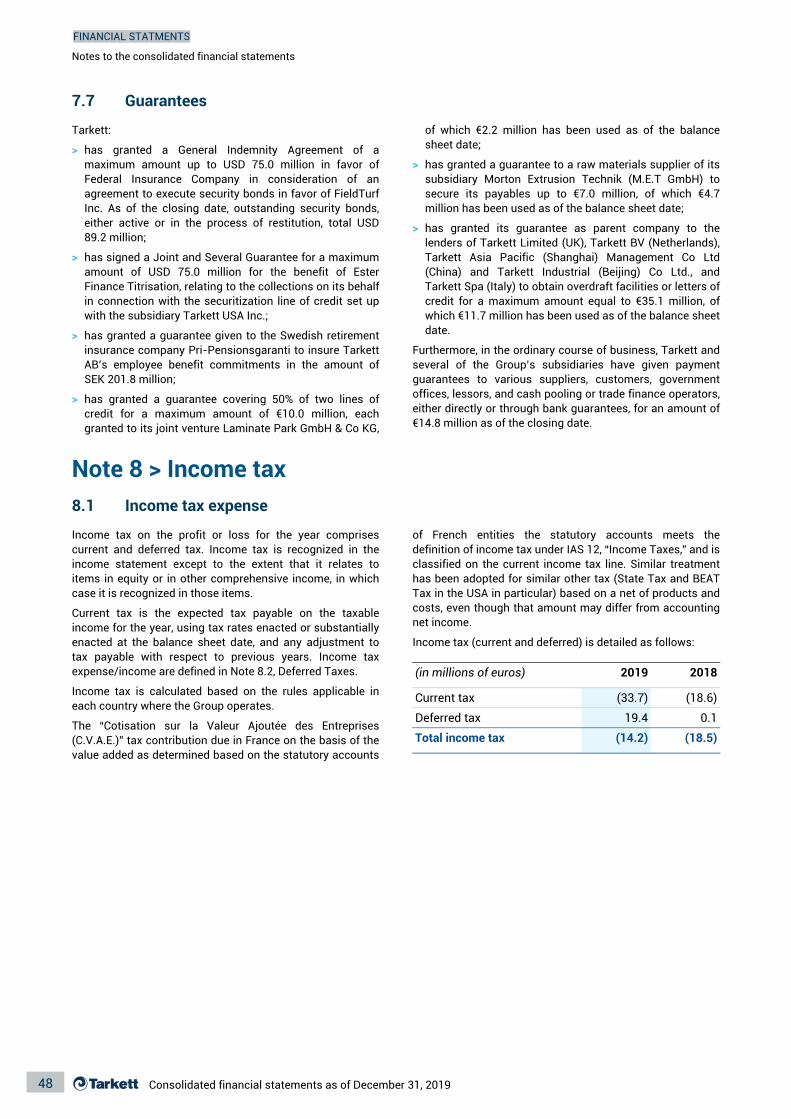
Notes to the consolidated financial statements
FINANCIAL STATMENTS
Consolidated financial statements as of December 31, 201948
7.7 Guarantees
Tarkett:
> has granted a General Indemnity Agreement of amaximum amount up to USD 75.0 million in favor ofFederal Insurance Company in consideration of anagreement to execute security bonds in favor of FieldTurfInc. As of the closing date, outstanding security bonds,either active or in the process of restitution, total USD89.2 million;
> has signed a Joint and Several Guarantee for a maximumamount of USD 75.0 million for the benefit of EsterFinance Titrisation, relating to the collections on its behalfin connection with the securitization line of credit set upwith the subsidiary Tarkett USA Inc.;
> has granted a guarantee given to the Swedish retirementinsurance company Pri-Pensionsgaranti to insure TarkettAB’s employee benefit commitments in the amount ofSEK 201.8 million;
> has granted a guarantee covering 50% of two lines ofcredit for a maximum amount of €10.0 million, eachgranted to its joint venture Laminate Park GmbH & Co KG,
of which €2.2 million has been used as of the balancesheet date;
> has granted a guarantee to a raw materials supplier of itssubsidiary Morton Extrusion Technik (M.E.T GmbH) tosecure its payables up to €7.0 million, of which €4.7million has been used as of the balance sheet date;
> has granted its guarantee as parent company to thelenders of Tarkett Limited (UK), Tarkett BV (Netherlands),Tarkett Asia Pacific (Shanghai) Management Co Ltd(China) and Tarkett Industrial (Beijing) Co Ltd., andTarkett Spa (Italy) to obtain overdraft facilities or letters ofcredit for a maximum amount equal to €35.1 million, ofwhich €11.7 million has been used as of the balance sheetdate.
Furthermore, in the ordinary course of business, Tarkett andseveral of the Group’s subsidiaries have given paymentguarantees to various suppliers, customers, governmentoffices, lessors, and cash pooling or trade finance operators,either directly or through bank guarantees, for an amount of€14.8 million as of the closing date.
Note 8 > Income tax8.1 Income tax expense
Income tax on the profit or loss for the year comprisescurrent and deferred tax. Income tax is recognized in theincome statement except to the extent that it relates toitems in equity or in other comprehensive income, in whichcase it is recognized in those items.
Current tax is the expected tax payable on the taxableincome for the year, using tax rates enacted or substantiallyenacted at the balance sheet date, and any adjustment totax payable with respect to previous years. Income taxexpense/income are defined in Note 8.2, Deferred Taxes.
Income tax is calculated based on the rules applicable ineach country where the Group operates.
The “Cotisation sur la Valeur Ajoutée des Entreprises(C.V.A.E.)” tax contribution due in France on the basis of thevalue added as determined based on the statutory accounts
of French entities the statutory accounts meets thedefinition of income tax under IAS 12, “Income Taxes,” and isclassified on the current income tax line. Similar treatmenthas been adopted for similar other tax (State Tax and BEATTax in the USA in particular) based on a net of products andcosts, even though that amount may differ from accountingnet income.
Income tax (current and deferred) is detailed as follows:
(in millions of euros) 20182019
(18.6)Current tax (33.7)
19.4 0.1Deferred tax
(14.2)Total income tax (18.5)

Notes to the consolidated financial statements
FINANCIAL STATEMENTS
Consolidated financial statements as of December 31, 2019 49
Theoretical income taxes determined using the French corporate income tax rate of 34.43% for 2019 and 2018 can bereconciled as follows to the actual income tax charge:
20182019(in millions of euros)
53.8Pre-tax profit from continuing operations (a) 68.6
Profit from equity-accounted subsidiaries (b) (1) (7.9)3.5
76.5Pre-tax profit from fully consolidated activities (a- b) 50.3
(17.3) (26.3)Income tax at nominal French income tax rate
Effect of:
8.8Taxation of foreign companies at different rates 6.2
3.6Exchange rate effects on non-monetary assets (3.5)
Valuation of deferred tax assets (1.3)3.1
3.6Permanent differences (1.8)
(3.4) (0.1)Taxes on dividends (Withholding at the source, 3% contribution)
(4.5)Other items 0.3
Income tax expenses (18.5)(14.2)
Effective rate 24.2%28.3%
(1) In 2019, the result of companies consolidated with equity method was restated by €7.5 million for an expense carried by a fully integrated company relating to the closure of Laminate Park, which is consolidated with equity method.
Taxation of foreign companies at different rates:
The main contributing countries are Russia, with a localincome tax rate of 20%, Sweden, with a local tax rate of21.40%, and Luxembourg, with a local income tax rate of28.09%.
Exchange rate effects on non-monetary assets
The deferred tax income of €3.6 million is due to the effect ofchanges in the exchange rate on non-monetary assets andliabilities of entities whose functional currency is differentfrom the local currency. Recognition of this income isrequired by IFRS, even if the revalued tax basis does notgenerate any tax obligation in the future.
Changes in unrecognized deferred tax assets
The Group has activated a net amount of €3.1 million inrespect of the future taxable results of certain subsidiaries.
Other items
In 2019, an additional tax for €3.1million related to the BEATtax in the United States.
8.2 Deferred tax
Deferred tax is calculated using the balance sheet method,providing for temporary differences between the carryingamounts of assets and liabilities for financial reportingpurposes and the amounts used for taxation purposes. Theamount of deferred tax provided is based on the expectedmanner of realization or settlement of the carrying amountof assets and liabilities, using tax rates enacted orsubstantially enacted at the balance sheet date.
The following temporary differences are not provided for:
> goodwill not deducted for tax purposes;
> the initial recognition of assets or liabilities, other than inthe context of transactions involving businesscombinations, that affect neither accounting nor taxableprofit;
> differences relating to investments in subsidiaries to theextent that they will probably not reverse in theforeseeable future.
A deferred income tax asset is recognized only to the extentthat it is probable that there will be future taxable profitsover the next five years against which this asset can beutilized.
In accordance with IAS 12, where an entity’s tax return isprepared in a currency other than its functional currency,changes in the exchange rate between the two currenciesgenerate temporary differences with respect to the valuationof non-monetary assets and liabilities. As a result, deferredtax is recognized in profit or loss.

Notes to the consolidated financial statements
FINANCIAL STATMENTS
Consolidated financial statements as of December 31, 201950
Deferred taxation is shown on the balance sheet separately from current tax assets and liabilities and is categorized in non-current items.
(in millions of euros) 20182019
25.333.9Valuation of deferred tax assets
45.3DTA for pensions and healthcare benefits 39.5
39.1Other items temporarily non deductible 56.5
(1.6)Provision for other deferred tax liabilities (2.1)
3.3Internal profit eliminations 2.5
Netted against deferred tax assets (28.2)(45.8)
76.6Deferred tax assets 91.1
46.6 39.8Fixed assets revaluation
25.6Other deferred tax liabilities 24.1
Netted against deferred tax assets (28.2)(45.8)
26.4 35.7Deferred tax liabilities
The Group had €33.9 million in deferred tax assets related totax loss carryforwards and unused tax credits, of which€12.3 million related to Luxembourg, €13.3 million related tothe Group’s North American (United States) taxconsolidation group, and €5.0 million related to France.
The €33.9 million can be broken down as follows: €23.5million of net deferred tax assets for tax loss carryforwards,and €10.4 million of net unused tax credits.
As of December 31, 2019, unrecognized deferred tax assetsrelated to loss carryforwards and unused tax credits amountto €170.8 million.
Note 9 > Equity and liabilities9.1 Share capital
Share capital comprises the par value of the ordinary sharesminus incremental costs directly attributable to the issue ofordinary shares and share options, net of any tax effects.When share capital recognized as equity is repurchased, theamount of consideration paid, which includes directlyattributable costs, is net of any tax effects, and is recognized
as a deduction from equity classified as own shares. Whenown shares are sold or reissued subsequently, the amountreceived is recognized as an increase in equity, and theresulting surplus or deficit on the transaction is transferredto/from retained earnings.
December 31, 2018December 31, 2019
318,613,480327,751,405Share capital (in euros)
65,550,281 63,722,696Number of shares
5.0Par value (in euros) 5.0
9.2 Earnings per share and dividendsWeighted average number of shares outstanding (basic earnings)
(in thousands of shares) December 31, 2018December 31, 2019
63,72364,636Average number of shares outstanding (basic earnings)
(356) (434)Average number of treasury shares held by Tarkett during the year
63,289Weighted average number of shares outstanding (basic earnings) 64,280

Notes to the consolidated financial statements
FINANCIAL STATEMENTS
Consolidated financial statements as of December 31, 2019 51
Basic earnings per share
Basic earnings per share as of December 31, 2019 arecalculated on the basis of the Group’s share of net profit andon the weighted average number of shares outstanding
during the period (and after deduction of the weightedaverage number of treasury shares).
December 31, 2018(in thousands of shares) December 31, 2019
Profit for the period attributable to Tarkett shareholders (in millions of euros)
49.339.6
63,28964,280Weighted average number of shares outstanding (basic earnings)
0.62 0.78Basic earnings per share (in euros)
Weighted average number of shares outstanding (diluted)
December 31, 2019(in thousands of shares) December 31, 2018
63,289Number of shares outstanding at year-end 64,280
345 370Impact of share- based payment plans (1)
64,625Weighted average number of shares outstanding during the period (diluted) 63,659
(1) Free share grant plans provide only for the grant of existing shares and not for issuance of new shares
Diluted earnings per share
Diluted earnings per share as of December 31, 2019 are calculated on the basis of the Group’s share of net profit and on theweighted average number of shares outstanding during the period and the weighted average number of potential sharesoutstanding (and after deduction of the weighted average number of treasury shares).
December 31, 2018(in thousands of shares) December 31, 2019
39.6 49.3Profit for the period attributable to Tarkett shareholders (in millions of euros)
64,625.4Weighted average number of shares outstanding (diluted) 63,658.7
Diluted earnings per share (in euros) 0.770.61
Dividends
On April 26, 2019, the General Shareholders’ Meeting decided to pay a dividend of €0.60 per share and offered the option toreceive payment of the dividend in newly issued shares.
As a result, on July 4, 2019, Tarkett paid €7.4 million and carried out a capital increase of €30.6 million.
In 2018, the Group had paid a dividend of €0.60 per share for a total amount of €37.9 million.
Note 10 > Related partiesIn accordance with IAS 24, “Related Party Disclosures,” theGroup has identified the following related parties:
> The joint ventures;
> The Group’s principal shareholder, Société InvestissementDeconinck (“SID”);
> The members of Tarkett’s Management Board andSupervisory Board.
Transactions entered into during the period with the Group’sjoint ventures and principal shareholders are detailedbelow.
10.1 Joint ventures
All transactions between fully consolidated entities areeliminated in consolidation.
Transactions with related entities and jointly held entitiesare entered into on arm’s length terms.
The Group has three joint ventures, including Laminate ParkGmbH & Co KG in Germany, jointly controlled with the Sonaegroup.
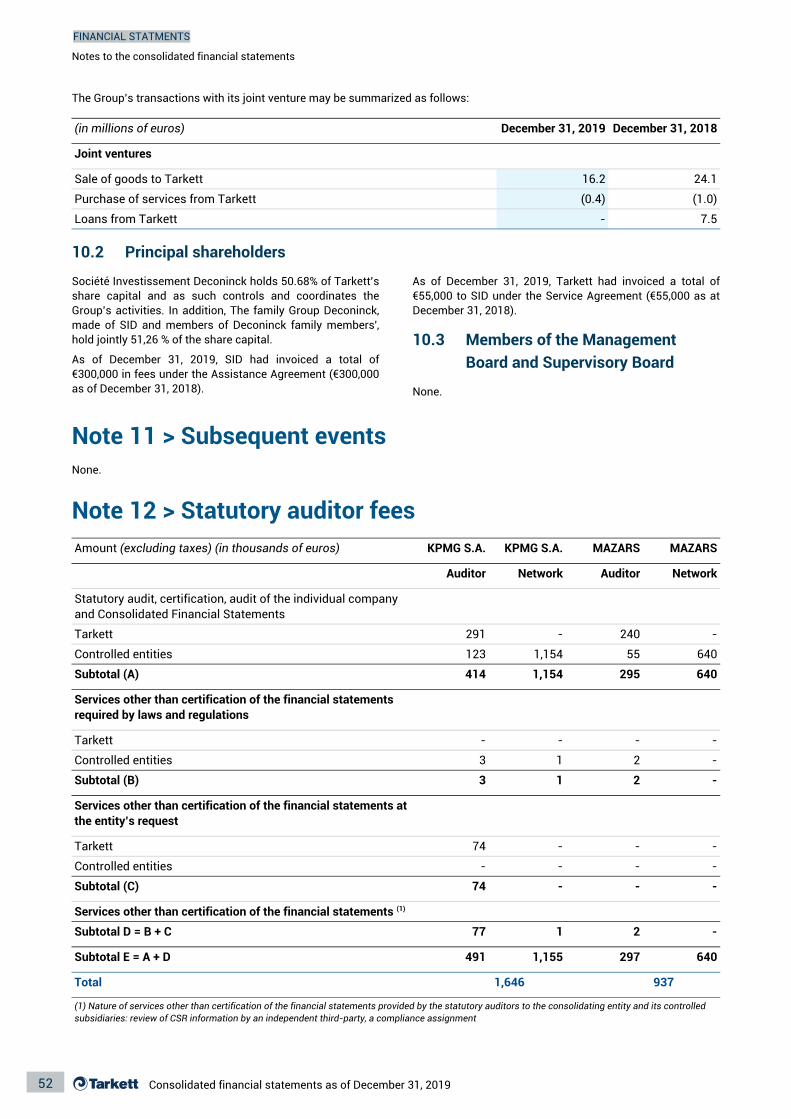
Notes to the consolidated financial statements
FINANCIAL STATMENTS
Consolidated financial statements as of December 31, 201952
The Group’s transactions with its joint venture may be summarized as follows:
December 31, 2018December 31, 2019(in millions of euros)
Joint ventures
24.1Sale of goods to Tarkett 16.2
(1.0)(0.4)Purchase of services from Tarkett
-Loans from Tarkett 7.5
10.2 Principal shareholders
Société Investissement Deconinck holds 50.68% of Tarkett’sshare capital and as such controls and coordinates theGroup’s activities. In addition, The family Group Deconinck,made of SID and members of Deconinck family members',hold jointly 51,26 % of the share capital.
As of December 31, 2019, SID had invoiced a total of€300,000 in fees under the Assistance Agreement (€300,000as of December 31, 2018).
As of December 31, 2019, Tarkett had invoiced a total of€55,000 to SID under the Service Agreement (€55,000 as atDecember 31, 2018).
10.3 Members of the Management Board and Supervisory Board
None.
Note 11 > Subsequent eventsNone.
Note 12 > Statutory auditor feesKPMG S.A.Amount (excluding taxes) (in thousands of euros) MAZARSKPMG S.A. MAZARS
NetworkAuditor AuditorNetwork
Statutory audit, certification, audit of the individual company and Consolidated Financial Statements
Tarkett -- 240291
55123 1,154Controlled entities 640
640414 2951,154Subtotal (A)
Services other than certification of the financial statements required by laws and regulations
Tarkett -- --
23 1Controlled entities -
-13 2Subtotal (B)
Services other than certification of the financial statements atthe entity’s request
-Tarkett --74
- --Controlled entities -
--74 -Subtotal (C)
Services other than certification of the financial statements (1)
1Subtotal D = B + C -277
491 2971,155Subtotal E = A + D 640
1,646 937Total
(1) Nature of services other than certification of the financial statements provided by the statutory auditors to the consolidating entity and its controlled subsidiaries: review of CSR information by an independent third-party, a compliance assignment

Notes to the consolidated financial statements
FINANCIAL STATEMENTS
Consolidated financial statements as of December 31, 2019 53
Note 13 > Principal consolidated entitiesPourcentage of interest
as of December 31, 2019Consolidation
methodCompanies Pourcentage of interest
as of December 31, 2018Country
G: Full consolidationE: Equity methodNC: Not consolidatedEMEA
100%Tarkett AB 100%GSwedenTarkett AS 100%G 100%Norway
GTarkett OY 100%100%Finland100%Belgium 100%GTarkett NV
Denmark 100%Tarkett A/S 100%G100%PolandTarkett Polska Sp.z.o.o. 100%G
GTarkett Aspen Zemin AS (1) 70%100%TurkeyELaminate Park GmbH & Co KG 50%Germany 50%
100%GGermany 100%Tarkett Holding GmbH100%GermanyM.E.T GmbH 100%G100%GermanyTarkett Sports GmbH (1) N/AG100%France Parent CompanyTarkett SA 100%100%GTarkett Services 100%France
Tarkett France 100%GFrance 100%100%G 100%FranceTarkett Bois SAS100%100%France GFieldturf Tarkett SAS
Luxembourg 100%GTarkett GDL SA 100%100%Tarkett Capital SA 100%GLuxembourg
Somalré 100%G 100%LuxembourgGTarkett SpA 100%100%Italy
100%Portugal 100%GTarkett - Produtos Internacionias, SAGreece 100%Tarkett Monoprosopi Ltd. 100%G
100%SpainTarkett Floors S.A. Spain 100%GGFieldturf Poligras SA 100%100%SpainGTarkett BV 100%Netherlands 100%
100%GNetherlands 100%Tarkett Sports BV100%NetherlandsDesso Sports System BV 100%G100%Netherlands GDesso Refinity BV 100%100%GDesso Holding BV 100%Netherlands
Tarkett Ltd. 100%GGreat Britain 100%100%G 0%Great BritainDesso Ltd. (1)
30%30%Great Britain EAllsports construction and maintenance Ltd.40%United States
of AmericaF.E.D. Inc. (1) N/AE
CzechRepublic
100%GDesso Czech Republic 100%
100%Tarkett Schweiz 100%GSwitzerlandDesso Ambiente Textil Handelsgesellschaft m.b.h 100%G 100%AustriaNorth America
United Statesof America
100%GTarkett INC. (Delaware) (TKT) 100%
0%Tandus Centiva Inc. (1) 100%GUnited Statesof America
Tandus Centiva US LLC (1) 100%G 0%United Statesof America
100%United Statesof America
100%GDomco Products Texas Inc (AZR)
United Statesof America
100%Tarkett Alabama Inc. (NAF) 100%G
100%United Statesof America
Tarkett Finance Inc. 100%G
GTarkett USA Inc. (DUS) 100%United Statesof America
100%

Notes to the consolidated financial statements
FINANCIAL STATMENTS
Consolidated financial statements as of December 31, 201954
Pourcentage of interestas of December 31, 2019
Consolidationmethod
Companies Pourcentage of interestas of December 31, 2018
Country
100%100%United States
of AmericaEasy Turf 100%G
100%United Statesof America
GBeynon Sport Surfaces Inc 100%
100%GFieldturf Tarkett USA Holding 100%United Statesof America
Fieldturf USA Inc. 100%GUnited Statesof America
100%
100%G 100%United Statesof America
Diamond W
100%100%United Statesof America
GDesso (U.S.A.) Inc
United Statesof America
100%GLexmark Carpet Mills 100%
100%Tarkett Inc. 100%GUnited Statesof America
Tandus Centiva Limited 100%G 100%CanadaGFieldturf Inc 100%100%Canada
100%Canada 100%GJohnsonite Canada Inc.United States
of America0%The Tennis and Track Company (1) 100%G
CIS, APAC and Latin AmericaGTarkett Australia Pty.Ltd. 100%100%Australia
100%Brazil 100%GTarkett Brasil Revestimentos LTDAMexico 100%Tarkett Flooring Mexico 100%G
100%ChinaTarkett Asia Pacific (Shanghai) Management Co Ltd.
100%G
GTarkett Hong Kong Ltd. 100%100%Hong KongGTarkett Industrial (Beijing) Co, Ltd 100%China 100%
100%GChina 100%Tandus Flooring (Suzhou) Co. Ltd100%RussiaAO Tarkett 100%G100%Russia GAO Tarkett Rus 100%100%GTarkett Sommer OOO 100%Russia
Tarkett d.o.o. 100%GSerbia 100%100%G 100%SerbiaTarkett SEE100%100%Serbia GGalerija Podova
Ukraine 100%GTarkett UA 100%100%Vinisin 100%GUkraine
Tarkett Kazakhstan 100%G 100%KazakhstanGVinisin Kft (1) 100%0%Hungary
100%Belarus 100%GTarkett BelSingapore 100%Tarkett Flooring Singapore 100%G
100%IndiaTarkett Flooring India Private 100%GGFieldturf Australia (Grassman) 100%100%Australia
(1) cf. Note 2.4.
The percentages of equity and voting rights held for each entity of the Group are identical.

Statutory Auditors' Report on the Consolidated Financial Statements
FINANCIAL STATEMENTS
Consolidated financial statements as of December 31, 2019 55
3 Statutory Auditors' Report on the Consolidated Financial Statements
This is a translation into English of the statutory auditors’ report on the financial statements of the Company issued in French and it is provided solely for theconvenience of English speaking users.
This statutory auditors’ report includes information required by European regulation and French law, such as information about the appointment of the statutoryauditors or verification of the management report and other documents provided to shareholders.
This report should be read in conjunction with, and construed in accordance with, French law and professional auditing standards applicable in France.
For the year ended 31 December 2019
To the general meeting of shareholders of Tarkett,
OpinionIn compliance with the engagement entrusted to us by your annual general meeting, we have audited the accompanyingconsolidated financial statements of Tarkett for the year ended 31 December 2019.
In our opinion, the consolidated financial statements give a true and fair view of the assets and liabilities and of the financialposition of the Group as at 31 December 2019 and of the results of its operations for the year then ended in accordance withInternational Financial Reporting Standards as adopted by the European Union.
The audit opinion expressed above is consistent with our report to the Audit, Risks and Compliance Committee.
Basis for opinionAudit framework
We conducted our audit in accordance with professional standards applicable in France. We believe that the audit evidence wehave obtained is sufficient and appropriate to provide a basis for our opinion.
Our responsibilities under those standards are further described in the “Statutory Auditors’ Responsibilities for the Audit of theConsolidated Financial Statements” section of our report.
Independence
We conducted our audit engagement in compliance with independence rules applicable to us, for the period from 1st January2019 to the date of our report and specifically we did not provide any prohibited non-audit services referred to in Article 5(1) ofRegulation (EU) No 537/2014 or in the French Code of ethics (code de déontologie) for statutory auditors.
Emphasis of matterWithout qualifying our conclusion, we draw your attention on the note “1.2.1. Statement of compliance and applicable standard”to the consolidated financial statements which sets out the impacts of the first application of IFRS 16 “Lease” and IFRIC 23“Uncertainty over Income Tax Treatments” as at 1st January 201.9
Justification Assessments - Key Audit MattersIn accordance with the requirements of Articles L.823-9 and R.823-7 of the French Commercial Code (code de commerce)relating to the justification of our assessments, we inform you of the key audit matters relating to risks of materialmisstatement that, in our professional judgment, were of most significance in our audit of the consolidated financial statementsof the current period, as well as how we addressed those risks.
These matters were addressed in the context of our audit of the consolidated financial statements as a whole, and in formingour opinion thereon, and we do not provide a separate opinion on specific items of the consolidated financial statements.
Long term assets valuation
Key audit matterGoodwill, intangible assets and property, plant and equipment have net book values at 31 December 2019 of 650,6M€, 155,6M€and 607,3M€, respectively, and represent a significant amount of the consolidated balance sheet. These assets are accounted inaccordance with the principles described in notes “2.2 - Business Combinations”, “5.1 – Goodwill” and “5.2 - Tangible andintangible assets” to the consolidated financial statements.
These assets may present a risk of impairment caused by internal or external factors, such as the deterioration of the Group'sperformance, changes in the competitive environment, unfavorable market conditions and changes in legislation or regulations.These changes can have an impact on the Group's cash flow forecasts and consequently on the determination of therecoverable amounts of these assets.
Management performs impairment tests if there is an impairment trigger event and at least once a year for goodwill and othernon-amortizable intangible assets or for other non-financial assets as described in Note 5.3.1 - Non-Financial Assets. Assetsare tested at the level of the cash-generating units (“CGUs”) defined by the Group. An impairment loss is recognized if the netbooked value of an asset or cash-generating unit is higher than its recoverable value. The recoverable value is the higher

Statutory Auditors' Report on the Consolidated Financial Statements
FINANCIAL STATMENTS
Consolidated financial statements as of December 31, 201956
amount between the fair value less the transfer costs and the value in use. Value in use is determined according to thediscounted future cash flow projections method (excluding interest on borrowings and taxes) for each cash generating unit.
The assessment of the recoverable value of these assets is a key audit matter, given the significant potential of impairment andthe high degree of estimation and judgment required by management for this assessment. The judgments include, in particular,assumptions regarding the future evolution of selling prices, volumes and costs of raw materials, renewal investments andchanges in working capital requirements related to the operation of these assets, and the determination of infinite growth ratesand discount rates applied to the appropriate future cash flows.
Audit approachWe reviewed the impairment testing process implemented by Group management, in order to identify trigger events andconduct to impairment testing, on the base of cash-flow forecasts from the budget and business plan established by the Boardof Management and presented to the Supervisory Board, and assessed the permanence of the method used.
We also assessed appropriateness and relevance of Group management’s approach to determine the cash-generating unitsand units mergers for long-term assets’ testing.
We adapted our audit approach when impairment triggers events occur on such cash-generating units. Concerning value in use,we assessed the reasonableness of key management assumptions with respect to earnings forecasts (with comparison toboth budget and historical performance), of growth and discount rates.
With the help of our valuation experts, we reviewed Group management’s key assumptions related to the discount and growthrates, comparing them with external market data and other comparable sectors’ companies.
For a selection of CGUs, we assessed the reasonableness of future cash flow projections, including the infinity normativeterminal cash flow amount, with respect to past achievements, our knowledge of business activity supported by interviews withGroup or division managers and, according to their availability, external data of other comparable sectors’ companies.Weanalyzed the sensitivity of the impairment test to assess the materiality of the potential impacts on the recoverable value of theassets bearing the highest risk
Litigations and provisions
Key audit matterThe Group is exposed to a variety of legal and tax risks, as well as cases of litigation, including asbestos claims in the UnitedStates.
As indicated in note “6.1 – Provisions” to the consolidated financial statements, these risks and litigations are covered byprovisions established in accordance with the applicable accounting standard (IAS 37 "Provisions") and amount to 88,4M€ at31 December 2019 including essentially asbestos litigations.
Significant contingent liabilities for these risks and litigations, the amount and timing of which can not be reliably estimated, aredescribed in note “6.2 - Contingent liabilities” to the consolidated financial statements.
The identification of risks and litigations, the valuation of provisions for such risks and litigations constitute a key audit mattergiven the amounts involved and the high degree estimate and judgment required from management.
Audit approachIn order to obtain an understanding of litigations, contingent liabilities and related valuations, we reviewed the process ofidentification, qualification and valuation implemented by Group management for such provisions through various interviewswith Group's legal and finance departments, divisions and main subsidiaries.
We conducted a critical review of the internal analysis notes for the likelihood and potential impact of each risk, examining theavailable procedural elements (letters, claims, judgments, notifications, etc.).
We obtained direct confirmations from the main lawyers involved to confirm our understanding of risks and litigations andassessed the relevance of the amount of provisions accrued.
Based on historical data used by the Group to estimate its provisions for asbestos claims:
> We assessed the permanence of methods used, the relevance and reliability of underlying data and calculations applied;
> We compared amounts paid to previously recognized provisions to assess the quality of the management estimates.
> We exercised our professional judgment to assess, in particular, wether the positions held by Management are in theacceptable range ok risk assessment and the validity of the evolution over time of such positions.
Specific verificationsAs required by French laws and regulations, we have also verified in accordance with professional standards applicable inFrance the information pertaining to the Group presented in the management report of Boards of Directors.
We have no matters to report as to its fair presentation and its consistency with the consolidated financial statements.
We attest that the consolidated declaration of extra-financial performance, required under Article L. 225-102-1 of the FrenchCommercial Code (Code de commerce), is included in the management report [or in the information relating to the groupprovided in the management report], being specified that, in accordance with the provisions of Article L. 823-10 of this Code, wehave not verified the fair presentation and the consistency with the consolidated financial statements of the informationprovided in this declaration and this information must be reported by an independent third party.

Statutory Auditors' Report on the Consolidated Financial Statements
FINANCIAL STATEMENTS
Consolidated financial statements as of December 31, 2019 57
Statutory Auditors’ Responsibilities for the Audit of the Consolidated Financial Statements Objectives and audit approach
Our role is to issue a report on the consolidated financial statements. Our objective is to obtain reasonable assurance aboutwhether the consolidated financial statements as a whole are free from material misstatement. Reasonable assurance is a highlevel of assurance, but is not a guarantee that an audit conducted in accordance with professional standards will always detecta material misstatement when it exists. Misstatements can arise from fraud or error and are considered material if, individuallyor in the aggregate, they could reasonably be expected to influence the economic decisions of users taken on the basis of theseconsolidated financial statements.
As specified in Article L.823-10-1 of the French Commercial Code (code de commerce), our statutory audit does not includeassurance on the viability of the Company or the quality of management of the affairs of the Company.
As part of an audit conducted in accordance with professional standards applicable in France, the statutory auditor exercisesprofessional judgment throughout the audit and furthermore:
> Identifies and assesses the risks of material misstatement of the consolidated financial statements, whether due to fraud orerror, designs and performs audit procedures responsive to those risks, and obtains audit evidence considered to besufficient and appropriate to provide a basis for his opinion. The risk of not detecting a material misstatement resulting fromfraud is higher than for one resulting from error, as fraud may involve collusion, forgery, intentional omissions,misrepresentations, or the override of internal control.
> Obtains an understanding of internal control relevant to the audit in order to design audit procedures that are appropriate inthe circumstances, but not for the purpose of expressing an opinion on the effectiveness of the internal control.
> Evaluates the appropriateness of accounting policies used and the reasonableness of accounting estimates and relateddisclosures made by management in the consolidated financial statements.
> Assesses the appropriateness of management’s use of the going concern basis of accounting and, based on the auditevidence obtained, whether a material uncertainty exists related to events or conditions that may cast significant doubt onthe Company’s ability to continue as a going concern. This assessment is based on the audit evidence obtained up to thedate of his audit report. However, future events or conditions may cause the Company to cease to continue as a goingconcern. If the statutory auditor concludes that a material uncertainty exists, there is a requirement to draw attention in theaudit report to the related disclosures in the consolidated financial statements or, if such disclosures are not provided orinadequate, to modify the opinion expressed therein.
> Evaluates the overall presentation of the consolidated financial statements and assesses whether these statementsrepresent the underlying transactions and events in a manner that achieves fair presentation.
> Obtains sufficient appropriate audit evidence regarding the financial information of the entities or business activities withinthe Group to express an opinion on the consolidated financial statements. The statutory auditor is responsible for thedirection, supervision and performance of the audit of the consolidated financial statements and for the opinion expressed onthese consolidated financial statements.
Report to the Audit, Risks and Compliance CommitteeWe submit a report to the Audit, Risks and Compliance Committee which includes in particular a description of the scope of theaudit and the audit program implemented, as well as the results of our audit. We also report, if any, significant deficiencies ininternal control regarding the accounting and financial reporting procedures that we have identified.
Our report to the Audit, Risks and Compliance Committee includes the risks of material misstatement that, in our professionaljudgment, were of most significance in the audit of the consolidated financial statements of the current period and which aretherefore the key audit matters, that we are required to describe in this audit report.
We also provide the Audit, Risks and Compliance Committee with the declaration provided for in Article 6 of Regulation (EU) N°537/2014, confirming our independence within the meaning of the rules applicable in France such as they are set in particularby Articles L.822-10 to L.822-14 of the French Commercial Code (code de commerce) and in the French Code of Ethics (code dedéontologie) for statutory auditors. Where appropriate, we discuss with the Audit, Risks and Compliance Committee the risksthat may reasonably be thought to bear on our independence, and the related safeguards.
Paris La Défense, on the 13 February 2020
The statutory auditors
French original signed by
KPMG Audit Mazars
Renaud Laggiard
Partner
Eric Schwaller
Partner
Anne-Laure Rousselo
Partner

Design and production
www.pomelo-paradigm.com
