consolidated financial statements tokai tokyo financial
TRANSCRIPT
Consolidated Financial Statements
Tokai Tokyo Financial Holdings, Inc.
and Subsidiaries
Year ended March 31, 2020
with Independent Auditor’s Report
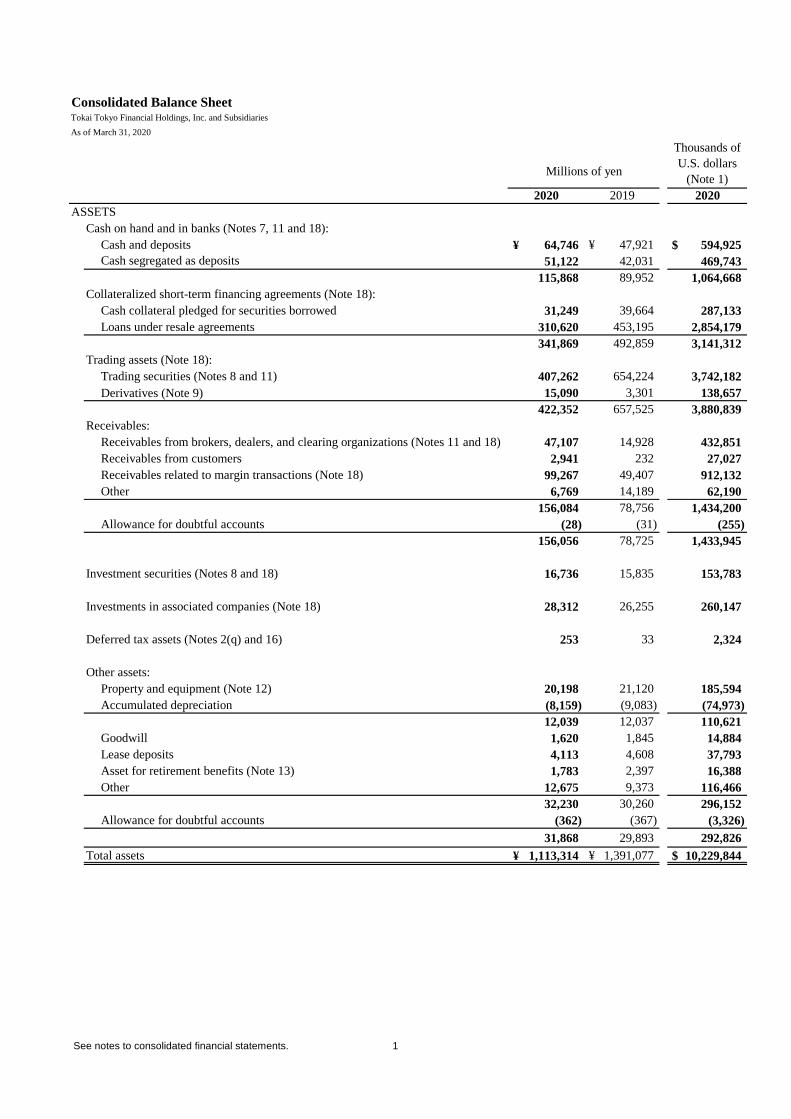
Consolidated Balance SheetTokai Tokyo Financial Holdings, Inc. and Subsidiaries
As of March 31, 2020
ASSETS
Cash on hand and in banks (Notes 7, 11 and 18):
Cash and deposits ¥ 64,746 ¥ 47,921 $ 594,925
51,122 42,031 469,743
115,868 89,952 1,064,668
Collateralized short-term financing agreements (Note 18):
Cash collateral pledged for securities borrowed 31,249 39,664 287,133
Loans under resale agreements 310,620 453,195 2,854,179
341,869 492,859 3,141,312
Trading assets (Note 18):
Trading securities (Notes 8 and 11) 407,262 654,224 3,742,182
Derivatives (Note 9) 15,090 3,301 138,657
422,352 657,525 3,880,839
Receivables:
Receivables from brokers, dealers, and clearing organizations (Notes 11 and 18) 47,107 14,928 432,851
Receivables from customers 2,941 232 27,027
Receivables related to margin transactions (Note 18) 99,267 49,407 912,132
Other 6,769 14,189 62,190
156,084 78,756 1,434,200
Allowance for doubtful accounts (28) (31) (255)
156,056 78,725 1,433,945
Investment securities (Notes 8 and 18) 16,736 15,835 153,783
Investments in associated companies (Note 18) 28,312 26,255 260,147
Deferred tax assets (Notes 2(q) and 16) 253 33 2,324
Other assets:
Property and equipment (Note 12) 20,198 21,120 185,594
Accumulated depreciation (8,159) (9,083) (74,973)
12,039 12,037 110,621
Goodwill 1,620 1,845 14,884
Lease deposits 4,113 4,608 37,793
Asset for retirement benefits (Note 13) 1,783 2,397 16,388
Other 12,675 9,373 116,466
32,230 30,260 296,152
Allowance for doubtful accounts (362) (367) (3,326)
31,868 29,893 292,826
Total assets ¥ 1,113,314 ¥ 1,391,077 $ 10,229,844
Cash segregated as deposits
Thousands of
U.S. dollars
(Note 1)Millions of yen
2020 2019 2020
See notes to consolidated financial statements. 1

Consolidated Balance SheetTokai Tokyo Financial Holdings, Inc. and Subsidiaries
As of March 31, 2020
LIABILITIES AND EQUITY
Borrowings (Notes 10, 11 and 18):
Short-term borrowings ¥ 125,660 ¥ 120,645 $ 1,154,645
Commercial paper 16,000 16,000 147,018
Current portion of long-term debt 31,122 27,765 285,971
Long-term debt 95,406 85,703 876,648
268,188 250,113 2,464,282
Collateralized short-term financing agreements (Notes 11 and 18):
Cash received on securities loaned 12,239 17,789 112,462
Borrowings under repurchase agreements 199,319 327,510 1,831,467
211,558 345,299 1,943,929
Trading liabilities (Note 18):
Trading securities (Note 8) 330,162 540,358 3,033,739
Derivatives (Note 9) 11,255 6,142 103,418
341,417 546,500 3,137,157
Payables (Note 18):
Payables to brokers, dealers, and clearing organizations 50,366 16,170 462,794
Payables to customers 48,173 33,430 442,642
Payables related to margin transactions (Note 11) 8,944 11,656 82,182
Other 15,674 13,698 144,031
123,157 74,954 1,131,649
Deferred tax liabilities (Notes 2(q) and 16) 56 389 514
Accrued and other liabilities:
Income taxes payable 695 349 6,389
Provision for bonuses 1,522 2,016 13,983
Liability for retirement benefits (Note 13) 245 267 2,254
Other 5,452 6,271 50,092
7,914 8,903 72,718
Statutory reserves 619 619 5,690
Total liabilities 952,909 1,226,777 8,755,939
Equity (Notes 14, 15 and 25)
Common stock:
Authorized: 972,730,000 shares
Issued: 36,000 36,000 330,791
Capital surplus 24,588 28,962 225,926
Stock acquisition rights 479 540 4,400
Retained earnings 101,277 100,541 930,596
(5,292) (6,183) (48,628)
Accumulated other comprehensive income:
Unrealized (loss) gain on available-for-sale securities (152) 1,077 (1,392)
Foreign currency translation adjustments (391) (406) (3,588)
Defined retirement benefit plans 500 1,501 4,595
Total 157,009 162,032 1,442,700
Noncontrolling interests 3,396 2,268 31,205
Total equity 160,405 164,300 1,473,905
Total liabilities and equity ¥ 1,113,314 ¥ 1,391,077 $ 10,229,844
Treasury stock, at cost: 12,216,596 shares in 2020
and 12,215,435 shares in 2019
260,582,115 shares in 2020
Thousands of
U.S. dollars
(Note 1)Millions of yen
2020 2019 2020
and 270,582,115 shares in 2019
See notes to consolidated financial statements. 2

Consolidated Statement of IncomeTokai Tokyo Financial Holdings, Inc. and Subsidiaries
For the year ended March 31, 2020
Revenues:
Commissions (Note 19) ¥ 29,172 ¥ 28,954 $ 268,054
Net gain on trading (Note 4) 29,511 32,179 271,162
Interest and dividend income (Note 4) 3,012 3,639 27,674
Total revenues 61,695 64,772 566,890
Interest expense 1,927 2,219 17,705
Net revenues 59,768 62,553 549,185
Selling, general and administrative expenses (Note 20) 60,592 62,945 556,756
Operating loss (824) (392) (7,571)
Other income, net (Note 21) 3,873 1,920 35,589
Income before income taxes 3,049 1,528 28,018
Income taxes (Note 16):
Current 273 605 2,512
Prior years (46) (141) (427)
Deferred 60 (88) 553
Total income taxes 287 376 2,638
Net income 2,762 1,152 25,380
Net (loss) income attributable to noncontrolling interests (1) 72 (9)
Net income attributable to owners of the parent ¥ 2,763 ¥ 1,080 $ 25,389
Per share of common stock (Notes 2(t) and 23): U.S. dollars
Basic net income ¥ 11.04 ¥ 4.18 $ 0.10
Diluted net income - 4.18 -
Cash dividends applicable to the year 8.00 16.00 0.07
Thousands of
U.S. dollars
(Note 1)Millions of yen
2020 2019 2020
Yen
See notes to consolidated financial statements. 3

Consolidated Statement of Comprehensive Income
Tokai Tokyo Financial Holdings, Inc. and Subsidiaries
For the year ended March 31, 2020
Net income ¥ 2,762 ¥ 1,152 $ 25,380
Other comprehensive income (Note 22):
Unrealized loss on available-for-sale securities (1,190) (1,390) (10,935)
Foreign currency translation adjustments 19 (238) 171
Defined retirement benefit plans (948) (1,188) (8,707)
Share of other comprehensive income in associates (96) (108) (879)
Comprehensive income (loss) ¥ 547 ¥ (1,772) $ 5,030
Total comprehensive income (loss) attributable to (Note 22):
Owners of the parent ¥ 548 ¥ (1,844) $ 5,039
Noncontrolling interests (1) 72 (9)
Millions of yen
Thousands of
U.S. dollars
(Note 1)
2020 2019 2020
See notes to consolidated financial statements. 4

Consolidated Statement of Changes in Equity
Tokai Tokyo Financial Holdings, Inc. and Subsidiaries
For the year ended March 31, 2020
Common Treasury
stock stock
Balance as of April 1, 2018 270,582 12,225 ¥ 36,000 ¥ 28,959 ¥ 556 ¥ 108,761 ¥ (6,188) ¥ 2,520 ¥ (168) ¥ 2,745 ¥ 173,185 ¥ 1,664 ¥ 174,849
Net income attributable to owners of the parent - - - - - 1,080 - - - - 1,080 - 1,080
Cash dividends, ¥36.00 per share - - - - - (9,300) - - - - (9,300) - (9,300)
Purchase of treasury stock - 2 - - - - (1) - - - (1) - (1)
Disposal of treasury stock - (12) - 3 - - 6 - - - 9 - 9
Cancellation of treasury stock - - - - - - - - - - - - -
Change in the parent's ownership interest due to transactions
with noncontrolling interests- - - - - - - - - - - - -
Net change in the year - - - - (16) - - (1,443) (238) (1,244) (2,941) 604 (2,337)
Balance as of March 31, 2019 270,582 12,215 ¥ 36,000 ¥ 28,962 ¥ 540 ¥ 100,541 ¥ (6,183) ¥ 1,077 ¥ (406) ¥ 1,501 ¥ 162,032 ¥ 2,268 ¥ 164,300
Net income attributable to owners of the parent - - - - - 2,763 - - - - 2,763 - 2,763
Cash dividends, ¥8.00 per share - - - - - (2,027) - - - - (2,027) - (2,027)
Purchase of treasury stock - 10,001 - - - - (3,441) - - - (3,441) - (3,441)
Disposal of treasury stock - 0 - (0) - - 0 - - - 0 - 0
Cancellation of treasury stock (10,000) (10,000) - (4,332) - - 4,332 - - - - - -
Change in the parent's ownership interest due to transactions
with noncontrolling interests- - - (42) - - - - - - (42) - (42)
Net change in the year - - - - (61) - - (1,229) 15 (1,001) (2,276) 1,128 (1,148)
Balance as of March 31, 2020 260,582 12,216 ¥ 36,000 ¥ 24,588 ¥ 479 ¥ 101,277 ¥ (5,292) ¥ (152) ¥ (391) ¥ 500 ¥ 157,009 ¥ 3,396 ¥ 160,405
Balance as of March 31, 2019 $ 330,791 $ 266,118 $ 4,962 $ 923,832 $ (56,817) $ 9,900 $ (3,726) $ 13,791 $ 1,488,851 $ 20,846 $ 1,509,697
Net income attributable to owners of the parent - - - 25,389 - - - - 25,389 - 25,389
Cash dividends, $0.07 per share - - - (18,625) - - - - (18,625) - (18,625)
Purchase of treasury stock - - - - (31,616) - - - (31,616) - (31,616)
Disposal of treasury stock - (0) - - 0 - - - 0 - 0
Cancellation of treasury stock - (39,805) - - 39,805 - - - - - -
Change in the parent's ownership interest due to transactions
with noncontrolling interests- (387) - - - - - - (387) - (387)
Net change in the year - - (562) - - (11,292) 138 (9,196) (20,912) 10,359 (10,553)
Balance as of March 31, 2020 $ 330,791 $ 225,926 $ 4,400 $ 930,596 $ (48,628) $ (1,392) $ (3,588) $ 4,595 $ 1,442,700 $ 31,205 $ 1,473,905
Thousands of shares Millions of yen
Accumulated other comprehensive income
Unrealized Foreign Defined
retirement
Common Capital acquisition Retained Treasury available-for-sale translation
Stock (loss) gain on currency
benefit Noncontrolling Total
stock surplus rights earnings stock securities adjustments plans Total interests equity
Thousands of U.S. dollars (Note 1)
Accumulated other comprehensive income
Unrealized Foreign Defined
retirement
Common Capital acquisition Retained Treasury available-for-sale translation
Stock (loss) gain on currency
benefit Noncontrolling Total
stock Surplus rights earnings stock securities adjustments plans Total interests equity
See notes to consolidated financial statements. 5

Consolidated Statement of Cash FlowsTokai Tokyo Financial Holdings, Inc. and Subsidiaries
For the year ended March 31, 2020
Cash flows from operating activities:
Income before income taxes ¥ 3,049 ¥ 1,528 $ 28,018
Income taxes - refund (paid) 232 (5,041) 2,128
Depreciation and amortization 3,227 2,322 29,650
Amortization of goodwill 252 245 2,318
Decrease in allowance for doubtful accounts (7) (39) (69)
Decrease in liability for retirement benefits (827) (630) (7,600)
Increase in provision for statutory reserves 1 7 5
Equity in losses of associated companies 94 62 864
Gain on sales of investment securities (107) (1,466) (983)
Gain on change in equity (2,055) - (18,879)
Gains on sales of fixed assets (144) - (1,320)
Impairment loss on fixed assets 1 152 11
Impairment loss on investment securities 121 258 1,113
Gain on reversal of stock acquisition rights (167) (139) (1,530)
Special retirements benefits - 598 -
Changes in assets and liabilities, net of effects from:
(Increase) Decrease in receivables (75,102) 3,981 (690,087)
Increase (Decrease) in payables 48,034 (19,668) 441,368
Changes in Trading assets and liabilities 30,104 (5,235) 276,617
Changes in Collateralized short-term financing agreements 17,460 (55,980) 160,435
Other, net (13,221) 6,294 (121,488)
Total adjustments 7,896 (74,279) 72,553
Net cash provided by (used in) operating activities 10,945 (72,751) 100,571
Cash flows from investing activities:
Purchases of property and equipment (2,589) (4,915) (23,792)
Proceeds from sales of property and equipment 452 - 4,161
Purchases of investment securities (14,392) (2,928) (132,241)
Proceeds from sales of investment securities 12,394 5,327 113,880
Purchases of a share of associates (45) (5,040) (415)
Proceed from sales of associates - 53 -
Other, net (2,507) (2,113) (23,034)
Net cash used in investing activities (6,687) (9,616) (61,441)
Cash flows from financing activities:
Increase in short-term borrowings - net 5,016 42,144 46,092
Proceeds from long-term debt 61,182 48,925 562,184
Repayment of long-term debt (48,169) (46,418) (442,610)
Proceeds from commercial paper 72,500 74,000 666,177
Redemption of commercial paper (72,500) (70,000) (666,177)
Proceeds from exercise of stock options - 8 -
Purchases of treasury stock (3,440) - (31,612)
Net increase in treasury stock (0) (1) (4)
Cash dividends paid (2,017) (9,300) (18,531)
Subscription money received from the noncontrolling interests 6,324 540 58,111
Payments of cash dividends to noncontrolling interests (7) (8) (69)
Payments from changes in ownership interests in subsidiaries (77) - (708)
that do not result in change in scope of consolidation
Other, net (584) (194) (5,366)
Net cash provided by financing activities 18,228 39,696 167,487
Effect of exchange rate change on cash and cash equivalents (12) (259) (107)
Net increase (decrease) in cash and cash equivalents 22,474 (42,930) 206,510
(5,547) - (50,973)
Cash and cash equivalents at the beginning of year 46,274 89,204 425,199
Cash and cash equivalents at the end of year (Note 7) ¥ 63,201 ¥ 46,274 $ 580,736
Decrease in cash and cash equivalents
resulting from change of scope of consolidation
Adjustments for:
Thousands of
U.S. dollars
(Note 1)Millions of yen
2020 2019 2020
See notes to consolidated financial statements. 6

7
Notes to Consolidated Financial Statements Tokai Tokyo Financial Holdings, Inc. and Subsidiaries
Year ended March 31, 2020
1. Basis of presentation of consolidated financial statements
The accompanying consolidated financial statements have been prepared by Tokai Tokyo Financial
Holdings, Inc. (the “Company”) and its subsidiaries (collectively, the “Group”) in accordance with the
provisions set forth in the Japanese Financial Instruments and Exchange Act and its related accounting
regulations, and in accordance with accounting principles generally accepted in Japan (“Japanese
GAAP”), which are different in certain respects as to the application and disclosure requirements of
International Financial Reporting Standards (IFRS).
In preparing these consolidated financial statements, certain reclassifications and rearrangements have
been made to the consolidated financial statements issued in Japan in order to present them in a form
which is more familiar to readers outside Japan. In addition, certain reclassifications have been made in
the 2019 consolidated financial statements to conform to the classifications used in 2020.
The consolidated financial statements are stated in Japanese yen, the currency of the country in which
the Company is incorporated and operates. The translation of Japanese yen amounts into U.S. dollars is
included solely for the convenience of readers outside Japan, using the prevailing exchange rate at
March 31, 2020, which was ¥108.83 to USD1. The amounts in Japanese yen are directly converted into
U.S. dollar amounts even for the amounts presented only in millions of Japanese yen in the consolidated
financial statements. As such, there are cases in which the conversion of the amounts in millions of
Japanese yen using the prevailing exchange rate are different from those in U.S. dollars shown in the
consolidated financial statements. The translation should not be construed as a representation that the
Japanese yen amounts have been, could have been or could be converted into U.S. dollars at that or any
other rate.
2. Summary of significant accounting policies
a. Principles of consolidation The consolidated financial statements as of March 31, 2020, include the accounts of the Company and its
27 (26 in 2019) subsidiaries. Three consolidated subsidiaries, which were newly established for the year
ended March 31, 2020, were included in the scope of consolidation. One consolidated subsidiary was
excluded from the scope of consolidation and included in associated companies accounted for using the
equity method. Another consolidated subsidiary was also merged and therefore excluded from the scope
of consolidation in the year ended March 31, 2020.
Under the control and influence concepts, those companies in which the Company, directly or indirectly,
is able to exercise control over operations are fully consolidated, and those companies over which the
Group has the ability to exercise significant influence are accounted for by the equity method.
Investments in 12 (10 in 2019) associated companies are accounted for by the equity method. One
consolidated subsidiary, which was excluded from the scope of consolidation, was included in
associated companies accounted for using the equity method.Another associated company was included
in the scope of application of the equity method from the year ended March 31, 2020, as it was become
material.
Cost in excess of the net assets of subsidiaries acquired is amortized on a straight-line basis within a
period of 20 years by judging each respective case.
All significant intercompany balances and transactions have been eliminated in consolidation. All
material unrealized profit included in assets resulting from transactions within the Group is eliminated.
b. Unification of accounting policies applied to foreign subsidiaries for the consolidated financial
statements
Under Accounting Standards Board of Japan (“ASBJ”) Practical Issues Task Force (PITF) No. 18,
“Practical Solution on Unification of Accounting Policies Applied to Foreign Subsidiaries for the

8
Consolidated Financial Statements” the accounting policies and procedures applied to a parent company
and its subsidiaries for similar transactions and events under similar circumstances should in principle be
unified for the preparation of the consolidated financial statements. However, financial statements
prepared by foreign subsidiaries in accordance with either IFRS or generally accepted accounting
principles in the United States of America (FASB Accounting Standards Codification) tentatively may be
used for the consolidation process, except for the following items that should be adjusted in the
consolidation process so that net income is accounted for in accordance with Japanese GAAP, unless
they are not material: (a) amortization of goodwill; (b) scheduled amortization of actuarial gains or
losses of pensions that have been directly recorded in equity through other comprehensive income; (c)
expensing capitalized development costs of R&D; (d) cancellation of the fair value model of accounting
for property, plant and equipment and investment properties and incorporation of the cost model of
accounting; and (e) recording a gain or loss through profit or loss on the sale of an investment in an
equity instrument for the difference between the acquisition cost and selling price, and recording
impairment loss through profit or loss for other-than-temporary declines in the fair value of an
investment in an equity instrument, where a foreign subsidiary elects to present in other comprehensive
income subsequent changes in the fair value of an investment in an equity instrument.
c. Unification of accounting policies applied to foreign associated companies for the equity method ASBJ Statement No. 16, “Accounting Standard for Equity Method of Accounting for Investments”
requires adjustments to be made to conform the associate’s accounting policies for similar transactions
and events under similar circumstances to those of the parent company when the associate’s financial
statements are used in applying the equity method, unless it is impracticable to determine the necessary
adjustments. In addition, financial statements prepared by foreign associated companies in accordance
with either IFRS or generally accepted accounting principles in the United States of America tentatively
may be used in applying the equity method if the following items are adjusted so that net income is
accounted for in accordance with Japanese GAAP, unless they are not material: (a) amortization of
goodwill; (b) scheduled amortization of actuarial gain or loss of pensions that has been directly
recorded in equity through other comprehensive income; (c) expensing capitalized development costs of
research and development (R&D); (d) cancellation of the fair value model of accounting for property,
plant and equipment and investment properties and incorporation of the cost model of accounting; and
(e) recording a gain or loss through profit or loss on the sale of an investment in an equity instrument
for the difference between the acquisition cost and selling price, and recording impairment loss through
profit or loss for other-than-temporary declines in the fair value of an investment in an equity
instrument, where a foreign associate elects to present in other comprehensive income subsequent
changes in the fair value of an investment in an equity instrument.
d. Business combinations Business combinations are accounted for using the purchase method. Acquisition-related costs, such as
advisory fees or professional fees are accounted for as expenses in the periods in which the costs are
incurred. If the initial accounting for a business combination is incomplete by the end of the reporting
period in which the business combination occurs, an acquirer shall report in its financial statements
provisional amounts for the items for which the accounting is incomplete. During the measurement
period, which shall not exceed one year from the acquisition, the acquirer shall retrospectively adjust
the provisional amounts recognized at the acquisition date to reflect new information obtained about
facts and circumstances that existed as of the acquisition date and that would have affected the
measurement of the amounts recognized as of that date. Such adjustments shall be recognized as if the
accounting for the business combination had been completed at the acquisition date. The acquirer
recognizes the bargain purchase gain in profit or loss immediately on the acquisition date after
reassessing and confirming that all of the assets acquired and all of the liabilities assumed have been
identified after a review of the procedures used in the purchase price allocation. A parent's ownership
interest in a subsidiary might change if the parent purchases or sells ownership interests in its subsidiary.
The carrying amount of noncontrolling interests is adjusted to reflect a change in the parent's ownership
interest in its subsidiary while the parent retains its controlling interest in its subsidiary. Any difference
between the fair value of the consideration received or paid and the amount by which the noncontrolling
interest is adjusted is accounted for as capital surplus as long as the parent retains control over its
subsidiary.
e. Cash and cash equivalents
Cash and cash equivalents disclosed in the consolidated statement of cash flows comprise cash on hand,

9
demand deposits and ordinary deposits which can be easily liquidated on demand with original
maturities of three months or less.
f. Financial instruments The purpose of trading activities is to make profits or reduce losses from short-term volatility and
arbitrage between markets in stock prices, interest rates, foreign exchange rates and other market
indices. The scope of trading activities mainly consists of the following:
1) Buying and selling of securities
2) Derivative market transactions
3) Over-the-counter (OTC) derivative transactions
Securities, derivative contracts and other financial instruments classified as trading assets and liabilities
are stated at fair value based on the mark-to-market method.
Other securities, including short-term investment securities and investment securities, are held for
non-trading purposes and are classified as available-for-sale. Available-for-sale securities that have a
market quotation are stated at the market price prevailing at the end of the fiscal year. Differences
between the cost of securities held determined by the moving-average method and the fair value less
associated deferred taxes are recorded in “Unrealized gain (loss) on available-for-sale securities” in
equity in the consolidated balance sheet. Available-for-sale securities without a market quotation are
stated at cost as determined by the moving average. Where available-for-sale securities have declined
significantly and such impairment of value is deemed not temporary, such securities are written down to
their fair value and the resulting losses are charged to income for the period.
g. Property and equipment Property and equipment are stated at cost. Depreciation of tangible fixed assets is calculated by the
declining-balance method based on the estimated useful lives of the assets. However, buildings
(excluding leasehold improvements) acquired by the Company and its domestic consolidated
subsidiaries on or after April 1, 1998, and leasehold improvements and structures acquired on or after
April 1, 2016 are depreciated by the straight-line method. The estimated useful lives of tangible fixed
assets are mainly as follows:
Buildings 2-50 years
Fixtures and furniture 2-20 years
h. Long-lived assets The Group reviews its long-lived assets for impairment whenever events or changes in circumstances
indicate the carrying amount of an asset or asset group may not be recoverable. An impairment loss is
recognized if the carrying amount of an asset or asset group exceeds the sum of the undiscounted future
cash flows expected to result from the continued use and eventual disposition of the asset or asset group.
The impairment loss would be measured as the amount by which the carrying amount of the asset
exceeds its recoverable amount, which is the higher of the discounted cash flows from the continued use
and eventual disposition of the asset or the net selling price at disposition.
i. Intangible fixed assets
Amortization of intangible fixed assets is calculated by the straight-line method. Software for internal
use is amortized by the straight-line method over its economic useful life (five years).
Intangible fixed assets recognized in the acquisition of subsidiaries are amortized over the estimated
useful life reflecting the pattern of the assets’ future economic benefits.
j. Allowance for doubtful accounts For the future loss from doubtful accounts, an allowance for doubtful accounts is recognized using the
historical rate of actual losses for normal receivables and the estimated non-recoverable amount for
specific doubtful receivables after considering the recoverability of each account.
k. Retirement and pension plan The Company and its domestic subsidiaries have defined benefit corporate pension plans and defined
contribution retirement plan. There are some cases in which extra retirement benefits are paid to
employees when they retire. Tokai Tokyo Securities Co., Ltd. (“Tokai Tokyo Securities”), a wholly
owned major subsidiary of the Company, contributed to the retirement benefit trust for its pension plan.

10
Certain domestic consolidated subsidiaries apply the simplified method to state the liability based on the
amount that would be paid if employees retired at the consolidated balance sheet date.
The Company accounts for the liability for retirement benefits based on the projected benefit
obligations and plan assets at the balance sheet date. The projected benefit obligations are attributed to
periods on a straight-line basis. Actuarial gains and losses and past service costs that are yet to be
recognized in profit or loss are recognized within equity (accumulated other comprehensive income),
after adjusting for tax effects and are recognized in profit or loss over 10 years, no longer than the
expected average remaining service period of the employees. The discount rate is determined using a
single weighted average discount rate reflecting the estimated timing and amount of benefit payment.
Certain subsidiaries record retirement benefits for directors and Audit & Supervisory Board members at
the amount that would be required if all directors and Audit & Supervisory Board members retired at
each consolidated balance sheet date.
l. Asset retirement obligations An asset retirement obligation is recorded for a legal obligation imposed either by law or contract that
results from the acquisition, construction, development and the normal operation of a tangible fixed
asset and is associated with the retirement of such tangible fixed asset. The asset retirement obligation is
recognized as the sum of the discounted cash flows required for the future asset retirement and is
recorded in the period in which the obligation is incurred if a reasonable estimate can be made. If a
reasonable estimate of the asset retirement obligation cannot be made in the period the asset retirement
obligation is incurred, the liability should be recognized when a reasonable estimate of the asset
retirement obligation can be made. Upon initial recognition of a liability for an asset retirement
obligation, an asset retirement cost is capitalized by increasing the carrying amount of the related fixed
asset by the amount of the liability. The asset retirement cost is subsequently allocated to expense
through depreciation over the remaining useful life of the asset. Over time, the liability is accreted to its
present value each period. Any subsequent revisions to the timing or the amount of the original estimate
of undiscounted cash flows are reflected as an adjustment to the carrying amount of the liability and the
capitalized amount of the related asset retirement cost.
m. Statutory reserves The Japanese Financial Instruments and Exchange Act and its related regulations require a securities
company to set aside a reserve in proportion to its securities transactions and other related trading to
cover future eventual operational losses caused by the securities company for customer transactions.
n. Stock options
The cost of employee stock options is measured based on the fair value at the date of grant and
recognized as compensation expense over the vesting period as consideration for receiving goods or
services. In the consolidated balance sheet, stock options are presented as stock acquisition rights as a
separate component of equity until exercised.
o. Leases
In March 2007, the ASBJ issued ASBJ Statement No. 13, “Accounting Standard for Lease Transactions,”
which revised the previous accounting standard for lease transactions.
Under the previous accounting standard, finance leases that were deemed to transfer ownership of the
leased property to the lessee were capitalized. However, other finance leases were permitted to be
accounted for as operating lease transactions if certain “as if capitalized” information was disclosed in
the notes to the lessee’s financial statements. The revised accounting standard permits leases that existed
at the transition date and that do not transfer ownership of the leased property to the lessee to continue
to be accounted for as operating lease transactions.
The Group applied the revised accounting standard effective April 1, 2008. In addition, the Group
continues to account for leases that existed at the transition date and do not transfer ownership of the
leased property to the lessee as operating lease transactions. All other leases are accounted for as
operating leases.
p. Bonuses to directors and Audit & Supervisory Board members Bonuses to directors and Audit & Supervisory Board members are accrued at the end of the year to

11
which such bonuses are attributable.
q. Income taxes The provision for income taxes is computed based on the pretax income included in the consolidated
statement of income. The asset and liability approach is used to recognize deferred tax assets and
liabilities for the expected future tax consequences of temporary differences between the carrying
amounts and the tax bases of assets and liabilities. Deferred taxes are measured by applying currently
enacted income tax rates to the temporary differences.
The Group files a tax return under the consolidated corporate-tax system, which allows companies to
base tax payments on the combined profits or losses of the parent company and its wholly-owned
domestic subsidiaries.
A transition was performed to a group tax sharing system established in the “Act for Partial Amendment
of the Income Tax, etc.” (Act. 8 of 2020) and there was a review on the transition to a non-consolidated
taxation system in line with the group tax sharing system. For the items subject to such transition or the
review, the Company and certain consolidated subsidiaries in Japan do not apply the provisions of (44)
of ASBJ Guidance No. 28, “Implementation Guidance on Tax Effect Accounting” in accordance with
the treatment under Paragraph (3) of ASBJ PITF No. 39, “Treatment of Tax Effect Accounting for the
Transition from the Consolidated Taxation System to the Group Tax Sharing System” (March 31, 2020).
The amounts of deferred tax assets and deferred tax liabilities are based on the provisions of the Tax Act
prior to the amendment.
r. Foreign currency transactions
All short-term and long-term monetary receivables and payables denominated in foreign currencies are
translated into Japanese yen at the exchange rates at the consolidated balance sheet date. The foreign
exchange gains and losses from translation are recognized in the consolidated statement of income to
the extent that they are not hedged by forward exchange contracts.
s. Foreign currency financial statements The balance sheet and statement of income accounts of the consolidated foreign subsidiaries are
translated into Japanese yen at the current exchange rate as of the balance sheet date except for equity,
which is translated at the historical rate. Differences arising from such translation are shown as “Foreign
currency translation adjustments” under accumulated other comprehensive income in a separate
component of equity.
t. Per share information
Basic net income per share is computed by dividing net income attributable to common shareholders by
the weighted-average number of common shares outstanding for the period, retroactively adjusted for
stock splits.
Diluted net income per share reflects the potential dilution that could occur if securities were exercised
or converted into common stock. Diluted net income per share of common stock assumes full
conversion of the outstanding convertible notes and bonds at the beginning of the year (or at the time of
issuance) with an applicable adjustment for related interest expense, net of tax, and full exercise of
outstanding warrants.Diluted net income per share is not disclosed because it is anti-dilutive for the year
ended March 31, 2020.
Cash dividends per share presented in the accompanying consolidated statement of income are
dividends applicable to the respective fiscal years, including dividends to be paid after the end of the
year.
u. Accounting changes and error corrections
Under Statement No. 24, “Accounting Standard for Accounting Changes and Error Corrections,” and
ASBJ Guidance No. 24, “Guidance on Accounting Standard for Accounting Changes and Error
Corrections,” accounting treatments are required as follows: (1) Changes in Accounting
Policies―When a new accounting policy is applied following a revision of an accounting standard, the
new policy is applied retrospectively unless the revised accounting standard includes specific

12
transitional provisions, in which case the entity shall comply with the specific transitional provisions.
(2) Changes in Presentation―When the presentation of financial statements is changed, prior-period
financial statements are reclassified in accordance with the new presentation. (3) Changes in
Accounting Estimates―A change in an accounting estimate is accounted for in the period of the change
if the change affects that period only and is accounted for prospectively if the change affects both the
period of the change and future periods. (4) Corrections of Prior-Period Errors―When an error in
prior-period financial statements is discovered, those statements are restated.
v. New accounting pronouncement
(1) Revenue Recognition
On March 30, 2018, the ASBJ issued ASBJ Statement No. 29, “Accounting Standard for Revenue
Recognition,” and ASBJ Guidance No. 30, “Implementation Guidance on Accounting Standard for
Revenue Recognition.” The core principle of the standard and guidance is that an entity should
recognize revenue to depict the transfer of promised goods or services to customers in an amount that
reflects the consideration to which the entity expects to be entitled in exchange for those goods or
services. An entity should recognize revenue in accordance with that core principle by applying the
following steps:
Step 1: Identify the contract(s) with a customer
Step 2: Identify the performance obligations in the contract
Step 3: Determine the transaction price
Step 4: Allocate the transaction price to the performance obligations in the contract
Step 5: Recognize revenue when (or as) the entity satisfies a performance obligation
The accounting standard and guidance are effective for annual periods beginning on or after April 1,
2021. Earlier application is permitted for annual periods beginning on or after April 1, 2018.
The Company expects to apply the accounting standard and guidance for annual periods beginning on
or after April 1, 2021, and is in the process of measuring the effects of applying the accounting standard
and guidance in future applicable periods.
(2) Fair Value Measurement
On July 4, 2019, the ASBJ issued ASBJ Statement No. 30, "Accounting Standard for Fair Value
Measurement" and ASBJ Guidance No. 31, "Implementation Guidance on Accounting Standard for Fair
Value Measurement," and revised related ASBJ Statements and ASBJ Guidance (the "New Accounting
Standards"). Under the New Accounting Standards, nonmarketable available-for-sale equity securities
are stated at cost, while under the current accounting standards, nonmarketable available-for-sale
securities are stated at cost.
The New Accounting Standards are effective for the annual periods beginning on or after April 1, 2021.
Earlier application is permitted for annual periods beginning on or after April 1, 2020, or annual periods
ending on or after March 31, 2020. The New Accounting Standards shall be applied prospectively,
however, under certain circumstances, it is permitted to be applied retrospectively.
The Company expects to apply the accounting standard and guidance for annual periods beginning on
or after April 1, 2021 and is in the process of measuring the effects of applying the accounting standards
and guidance in future applicable periods.
(3) Accounting Policy Disclosures, Accounting Changes and Error Corrections On March 31, 2020, the ASBJ issued ASBJ Statement No.24 (revised 2020) “Accounting Standard for
Accounting Policy Disclosures, Accounting Changes and Error Corrections.”
The core principle of the standard is that an entity should disclose the principle and the outline of the
adopted accounting treatment for those which are not clearly stated in the related accounting standards.
The Company expects to apply the accounting standard on and after March 31, 2021.
(4) Disclosure of Accounting Estimates
On March 31, 2020, the ASBJ issued ASBJ Statement No. 31 “Accounting Standard for Disclosure of

13
Accounting Estimates.”
The core principle of the standard is that an entity should disclose the useful information for the users of
the financial statements regarding the accounting estimates reflected to the financial statements for the
current fiscal year involving risks which may significantly impact the financial statements for the
following fiscal year.
The Company expects to apply the accounting standard on and after March 31, 2021.

14
3. Accounting Change Starting from the fiscal year ended March 31, 2020, the consolidated subsidiaries of the Company
which adopt IFRS has adopted IFRS 16, “Lease” and recognize the right of use asset and the lease
liability at the date of the initial application for the leases that the Company as lessee. The effect of the
change is immaterial.
4. Change in Presentation
Prior to the fiscal year ended March 31, 2020, the derivative gain and loss related to the bonds issued
by the Group was included in “Interest and dividend income” or “Interest expense” in the Consolidated
Statement of Income. Since during this fiscal year ended March 31, 2020, the amount increased
significantly due to the business diversification, such amount is disclosed in “Net gain on trading” of
the Consolidated Statement of Income for the year ended March 31, 2020. The amount included in
“Interest and dividend income” for the fiscal year ended March 31, 2019, was ¥1,899 million.
5. Business Combination
Merger between consolidated subsidiaries
Based on the resolution at the Board of Directors meeting by the Company held on March 1, 2019, two
consolidated subsidiaries, Takagi Securities Co., Ltd. (“Takagi Securities”) and Tokai Tokyo Securities
Co., Ltd. have merged.
(1) Outline of the business combination
(a) Name of the companies involved and business outline
Surviving company:
Name - Tokai Tokyo Securities
Business outline - Financial instrument business
Dissolving company:
Name - Takagi Securities
Business outline - Financial instrument business
(b) Effective date of the business combination
September 1, 2019
(c) Legal form of the business combination
An absorption-type merger, with Tokai Tokyo Securities as the surviving company and Takagi
Securities as the dissolving company
(d) Name of the company after the business combination
Tokai Tokyo Securities
(e) Major reason for the business combination
The purpose of this merger is to effectively realize further improvement of customer service
and to enhance of corporate value of the Group in response to fierce competition given entries
of multiple industries into the securities industry, and changes in the environment surrounding
the securities industry and market trends.
(2) Outline of the accounting treatment applied for this business combination
This business combination was accounted for as a transaction under common control in accordance
with "Accounting Standard for Business Combinations" (ASBJ Statement No.21, January 16, 2019)
and “Implementation Guidance on Accounting Standard for Business Combinations and Accounting
Standard for Business Divestitures” (ASBJ Statement No. 10, January 16, 2019).
6. Additional Information Corporate restructuring within the Group, capital increase by third-party allotment to a consolidated
subsidiary and change in the scope of consolidation
(1) Summary and purpose of corporate restructuring
Based on the resolution at the Board of Directors meeting on January 30, 2019, the Company made an
absorption-type split agreement with Juroku Bank, Ltd. (“Juroku Bank”) and the corporate split was
completed on June 3, 2019. Juroku Tokai Tokyo Securities (“JTTS”) succeeded to one of the
businesses of Tokai Tokyo Securities, a wholly-owned subsidiary of the Company, on four locations in
Gifu prefecture by the way of corporate split.
Consequently, JTTS was excluded from the scope of the consolidation and accounted for by the equity
method, as JTTS increased its capital by third-party allotment to Juroku Bank on June 3, 2019.

15
(a) Business alliance
The Company has started the management plan, “New Age's, Flag Bearer 5,” under which the
Company is adapting to rapid changes in the business environment represented by diversification and
sophistication of customer needs, and penetration of digital financial services such as FinTech and AI,
and is aiming at evolution into an advanced "comprehensive financial group."
Juroku Bank started the fourteenth medium-term management plan, “All For Your Smile: Providing
Wholehearted Services ~2nd stage~,” under which Juroku Bank is aiming to be “a financial group that
is needed by customers and grows with customers.” At the same time, Juroku Bank is making efforts to
transform the business model on the basis of “engagement first” principle in which Juroku Bank can
contribute to customers and regional economic growth, and a sustainable income structure to support
the region circulates virtuously.
Business alliance among these entities based in Tokai region will enable them to support mutually as
equal partners, reinforce their sales infrastructure, and promote contribution to the region.
Therefore, the Company and Juroku Bank made an agreement for this corporate split as the initial
business alliance was agreed on March 23, 2018, and opened JTTS on January 30, 2019.
(b) Corporate split
The corporate split is an absorption-type corporate split, in which Tokai Tokyo Securities and JTTS are
the restructuring company and the succeeding company, respectively.
(c) Capital increase by third-party allotment
Juroku Bank underwrote the capital increase by third-party allotment immediately after the corporate
split and JTTS became a joint venture of Juroku Bank and the Company (held 60% and 40%
respectively).
(2) Outline of corporate split
(a) Effective date: June 3, 2019
(b) Assets and liabilities split and succeeded were as follows:
Assets (Millions of
yen)
(Thousands of U.S. dollars)
Cash and deposits ¥ 4 $ 34
Cash segregated as deposits 607 5,580
Receivables related to margin transactions 246 2,260
Other current assets 3 29
Tangible assets 95 870
Intangible assets 1 12
Investments and other assets 37 343
Total assets ¥ 993 $ 9,128
Liabilities (Millions of
yen) (Thousands of
U.S. dollars)
Payables related to margin transactions ¥ 246 $ 2,260 Payables to customers 566 5,197
Other current liabilities 43 393
Other fixed liabilities 0 0
Total liabilities ¥ 855 $ 7,850
(c) Consideration for the corporate split
The succeeding company, JTTS, issued 3,500 shares of common stock, and delivered them to Tokai
Tokyo Securities on the effective date. On the same day, Tokai Tokyo Securities distributed the above
shares to the Company as a dividend.
(3) Outline of the capital increase by third-party allotment
(a) Subscription and allotment of new shares: The third-party allotment
(b) Number of shares newly issued: 5,400 shares of common stock
(c) Issue price: ¥1 million ($9 thousand) per share
(d) Total issue price: ¥5,466 million ($50,225 thousand)

16
(e) Capital incorporation;
Increased common stock: ¥2,950 million ($27,107 thousand)
Increased capital surplus: ¥2,516 million ($23,119 thousand)
(f) Payment date: June 3, 2019
(4) Change in the scope of consolidation
The capital increase by third-party allotment above resulted in a decrease in the Company’s share in
JTTS. Consequently, JTTS was excluded from the scope of consolidation and became an equity
method affiliate of the Company. As a result, the Company recognized ¥2,055 million ($18,879
thousand) of “Gain on change in equity” in “Other income, net” in the consolidated statements of
income in June 2019.
7. Cash and cash equivalents Reconciliations between cash and cash equivalents in the consolidated statement of cash flows and cash
and deposits in the consolidated balance sheet as of March 31, 2020 and 2019, were presented as follows:
(Thousands of U.S. dollars) (Millions of yen)
2020 2019 2020
Cash and deposits ¥ 64,746 ¥ 47,921 $ 594,925
Time deposits with maturity of over three months (1,545) (1,647) (14,189)
Cash and cash equivalents ¥ 63,201 ¥ 46,274 $ 580,736

17
8. Securities (1) Trading securities as of March 31, 2020 and 2019, consisted of the following:
(2) Investment securities with market value as of March 31, 2020 and 2019, consisted of the following: (Millions of yen)
2020 2019
Balance
Sheet
Acquisition
Cost Difference
Balance Sheet
Acquisition Cost
Difference
Available-for-sale securities
Securities with market values that
exceed acquisition cost:
¥
1,212
¥
732
¥
480
¥
3,959
¥
2,879
¥
1,080
Stocks 1,212 732 480 3,958 2,878 1,080
Other - - - 1 1 0
Securities with market values that
do not exceed acquisition cost:
3,492 4,840 (1,348) 1,993 2,543 (550)
Stocks 3,492 4,840 (1,348) 1,993 2,543 (550)
¥ 4,704 ¥ 5,572 ¥ (868) ¥ 5,952 ¥ 5,422 ¥ 530
(Thousands of U.S. dollars)
2020
Balance
Sheet Acquisition
Cost Difference
Available-for-sale securities:
Securities with market values that
exceed acquisition cost: $ 11,135 $ 6,722 $ 4,413
Stocks 11,135 6,722 4,413
Other - - -
Securities with market values that
do not exceed acquisition cost: 32,090 44,475 (12,385)
Stocks 32,090 44,475 (12,385)
$ 43,225 $ 51,197 $ (7,972)
(Thousands of U.S. dollars) (Millions of yen)
2020 2019 2020
Trading assets:
Equity and warrants
¥ 8,012 ¥ 34,674 $ 73,623
Bonds
360,714 582,327 3,314,468
Beneficiary certificates of investment trusts
38,536 37,223 354,091
Total ¥ 407,262 ¥ 654,224 $ 3,742,182
Trading liabilities:
Equity and warrants
¥ 64,896 ¥ 26,735 $ 596,303
Bonds
264,885 513,623 2,433,936
Beneficiary certificates of investment trusts
381 0 3,500
Total ¥ 330,162 ¥ 540,358 $ 3,033,739

18
(3) The proceeds from sales of investment securities and gross realized gain and loss on investment
securities for the years ended March 31, 2020 and 2019, were summarized as follows:
(Millions of yen)
(Thousands of
U.S. dollars)
2020 2019 2020
Proceed from sales ¥ 12,393 ¥ 5,327 $ 113,880
Stocks 324 4,886 2,978
Bonds - - -
Other 12,069 441 110,902
Gross realized gain 156 1,520 1,434
Gross realized loss (49) (53) (451)
(4) The impairment loss on available-for-sale securities for the years ended March 31, 2020 and 2019
were ¥121 million ($1,113 thousand) and ¥258 million, respectively.
9. Derivatives The Group enters into derivative financial instruments, including foreign currency forward contracts,
currency swaps, and currency options to hedge foreign exchange risk associated with certain assets and
liabilities denominated in foreign currencies. The Group also makes use of derivative financial instruments
such as bond futures, interest rate futures, interest rate swaps, caps and floors, and swaptions to manage its
interest rate exposures on certain liabilities. In addition, the Group entered into stock-related derivative
transactions to manage the fluctuation of stock prices.
The methods for calculating fair value are based on the internal rules for calculating fair value. The
principal methods for calculating fair value are as follows:
Category Method
Stock index options Settlement price at the main financial instruments exchange.
Bond future options
Foreign currency forward
contracts
Discounting the receipt and payment amounts using the interest rate of
the applicable currency and converting them into yen at the currency
exchange rate of the day, and then subtracting the present value of
payments from the present value of receipts.
Stock index futures Liquidation index at the main financial instruments exchange.
Interest rate futures Liquidation price or equivalent price at the financial instruments
exchange or foreign financial instruments exchange.
Bond futures Liquidation price at the main financial instruments exchange.
OTC equity options
Stock lending transactions
with equity options
Equity swaps
Present value calculated by price valuation model based on interest
rate, dividend yield, volatility, prices of underlying securities, length of
transaction, etc.
Currency options
Calculating the future value of receipts and payments by reference to
the swap rate, volatility, correlation, etc., and discounting them using
the interest rate of the respective currencies, and then converting them
into yen at the currency rate of the day. The present value of payments
in yen is subtracted from the present value of receipts in yen.
Interest rate swaps
Caps and floors
Currency swaps
Interest rate swaptions
Calculating the future value of receipts and payments by reference to
the swap rate, volatility, etc., and discounting them using the interest
rate of the respective currencies, and then converting them into yen at
the currency rate of the day. The present value of payments in yen is
subtracted from the present value of receipts in yen.
For transactions in which mutual payment of cash is generated or
expired under certain conditions, the present value is the discounted
amount of future value reflecting the probability distribution of the net
amount of receipts and payments.
Derivative transactions to which hedge accounting is not applied

19
(1) Currency-related transactions (Millions of yen)
At March 31, 2020
Contract
amount
Contract
amount
due after
one year
Fair value
Unrealized
gain
(loss)
OTC:
Foreign currency forward contracts:
Selling ¥ 42,813 - ¥ 68 ¥ 68
Buying 40,043 - 109 109
Currency options contracts:
Selling 225,997 ¥ 127,872 9,842 348
Buying 181,804 99,275 5,530 (1,145)
Currency swaps contracts 77,593 66,086 769 769
(Millions of yen)
At March 31, 2019
Contract amount
Contract amount
due after one year
Fair value
Unrealized gain
(loss)
OTC:
Foreign currency forward contracts:
Selling ¥ 45,646 - ¥ 53 ¥ 53
Buying 30,096 - 12 12
Currency options contracts:
Selling 110,848 ¥ 88,521 6,258 1,379
Buying 96,868 69,786 3,753 (1,064)
Currency swaps contracts 42,979 35,035 677 677
(Thousands of U.S. dollars)
At March 31, 2020
Contract
amount
Contract
amount
due after
one year
Fair value
Unrealized
gain
(loss)
OTC:
Foreign currency forward contracts:
Selling $ 393,394 - $ 629 $ 629
Buying 367,943 - 1,002 1,002
Currency options contracts:
Selling 2,076,610 $ 1,174,969 90,437 3,194
Buying 1,670,528 912,206 50,814 (10,522)
Currency swaps contracts 712,971 607,238 7,068 7,068

20
(2) Interest rate-related transactions (Millions of yen)
At March 31, 2020
Contract
amount
Contract
amount
due after
one year
Fair value Unrealized
gain (loss)
Listed:
Interest rate futures:
Selling - - - -
Buying - - - -
Bond futures:
Selling ¥ 23,785 - ¥ 53 ¥ 53
Buying 27,726 - (9) (9)
Bond futures option:
Selling 51 - 16 34
Buying 58 - 15 (44)
OTC:
Interest rate swaps:
Fixed rate receipt, floating rate payment 215,173 ¥ 203,505 3,442 3,442
Fixed rate payment, floating rate receipt 210,292 202,742 (983) (983)
Yen/Yen basis swap 88,950 84,950 63 63
Fixed rate receipt, Fixed rate payment 12,500 12,500 88 88
Caps and Floors:
Selling 5,000 5,000 1 205
Buying 4,000 4,000 0 (57)
Interest rate swaptions:
Selling 78,500 78,500 1,416 78
Buying - - - -
(Millions of yen)
At March 31, 2019
Contract amount
Contract amount
due after one year
Fair value Unrealized gain (loss)
Listed:
Interest rate futures:
Selling ¥ 133,052 - ¥ (187) ¥ (187)
Buying 133,071 - 231 231
Bond futures:
Selling 21,601 - (136) (136)
Buying 147,294 - 205 205
Bond futures option:
Selling - - - -
Buying 29,035 - 16 (1)
OTC:
Interest rate swaps:
Fixed rate receipt, floating rate payment 87,190 ¥ 78,078 1,765 1,765
Fixed rate payment, floating rate receipt 94,786 72,935 (1,559) (1,559)
Yen/Yen basis swap 56,450 56,450 (143) (143)
Fixed rate receipt, Fixed rate payment 12,500 12,500 185 185
Caps and Floors:
Selling 5,000 5,000 4 201
Buying 4,000 4,000 2 (56)
Interest rate swaptions:
Selling 52,000 52,000 727 224
Buying - - - -

21
(Thousands of U.S. dollars)
At March 31, 2020
Contract
amount
Contract
amount
due after
one year
Fair value Unrealized
gain (loss)
Listed:
Interest rate futures:
Selling - - - -
Buying - - - -
Bond futures:
Selling $ 218,548 - $ 488 $ 488
Buying 254,765 - (79) (79)
Bond futures option:
Selling 466 - 151 315
Buying 534 - 133 (401)
OTC:
Interest rate swaps:
Fixed rate receipt, floating rate payment 1,977,147 $ 1,869,934 31,630 31,630
Fixed rate payment, floating rate receipt 1,932,300 1,862,922 (9,033) (9,033)
Yen/Yen basis swap 817,330 780,575 581 581
Fixed rate receipt, Fixed rate payment 114,858 114,858 812 812
Caps and Floors:
Selling 45,943 45,943 9 1,881
Buying 36,755 36,755 4 (528)
Interest rate swaptions:
Selling 721,308 721,308 13,015 715
Buying - - - -
(3) Stock-related transactions (Millions of yen)
At March 31, 2020
Contract
amount
Contract
amount
due after
one year
Fair
value
Unrealized
gain (loss)
Listed:
Stock index futures:
Selling ¥ 8,657 - ¥ 50 ¥ 50
Buying 71,287 - 6,362 6,362
Stock index options:
Selling 74,271 ¥ 6,825 3,193 (967)
Buying 51,538 4,350 2,798 968
Equity options:
Selling - - - -
Buying 6 - 0 0
OTC:
Stock lending transactions with equity options:
Selling - - - -
Buying 2,305 - 248 230
OTC equity options:
Selling 10,786 1,165 1,554 (658)
Buying 37,350 - 1,562 460
Equity swaps 12,287 6,320 3,032 3,032

22
(Millions of yen)
At March 31, 2019
Contract Amount
Contract
amount due after one year
Fair
value
Unrealized gain (loss)
Listed:
Stock index futures:
Selling ¥ 18,881 - ¥ 32 ¥ 32
Buying 10,680 - 53 53
Stock index options:
Selling 60,153 ¥ 8,375 937 88
Buying 69,698 5,550 541 (96)
Equity options:
Selling - - - -
Buying - - - -
OTC:
Stock lending transactions with equity options:
Selling - - - -
Buying 6,020 - 87 59
OTC equity options:
Selling 5,411 1,754 487 (28)
Buying 6,760 - 226 (9)
Equity swaps 12,850 6,540 2,739 2,739
(Thousands of U.S. dollars)
At March 31, 2020
Contract
Amount
Contract
amount
due after
one year
Fair
value
Unrealized
gain (loss)
Listed:
Stock index futures:
Selling $ 79,548 - $ 458 $ 458
Buying 655,032 - 58,463 58,463
Stock index options:
Selling 682,452 $ 62,712 29,339 (8,885)
Buying 473,565 39,971 25,713 8,891
Equity options:
Selling - - - -
Buying 52 - 1 1
OTC:
Stock lending transactions with equity options:
Selling - - - -
Buying 21,180 - 2,278 2,114
OTC equity options:
Selling 99,106 10,708 14,279 (6,045)
Buying 343,196 - 14,348 4,228
Equity swaps 112,901 58,072 27,856 27,856
Derivative transactions to which hedge accounting is applied
There are no derivative transactions to which hedge accounting is applied.

23
10. Borrowings Borrowings as of March 31, 2020 and 2019, were as follows:
(Thousands of U.S. dollars)
(Weighted-aver
age interest rate or interest rate
range) (Millions of yen)
2020 2019 2020
2020
Short-term borrowings:
Borrowings from financial institutions ¥ 125,260 ¥ 120,245 $ 1,150,970
Borrowings from securities finance
companies
400
400
3,675
Total ¥ 125,660 ¥ 120,645 $ 1,154,645 0.14%
Commercial paper:
Short-term bonds ¥ 16,000 ¥ 16,000 $ 147,018 0.05-0.07%
Total ¥ 16,000 ¥ 16,000 $ 147,018
Long-term debt:
Borrowings from financial institutions ¥ 91,930 ¥ 71,452 $ 844,710 0.47-0.56%
Straight bonds 16,743 22,134 153,842 0.05-2.85%
Exchangeable bonds 12,147 9,720 111,614 0.10-19.10%
Step-up callable bonds 700 700 6,432 0.40-0.81%
Callable bonds 2,800 7,200 25,728 0.51-1.70%
Dual currency bonds 1,808 1,072 16,617 0.15-8.60%
Floating rate bonds 400 400 3,676 0.55%
Index-linked bonds - 790 - 0.95-7.40%
Total ¥ 126,528 ¥ 113,468 $ 1,162,619
Less current portion (31,122) (27,765) (285,971)
Long-term debt, less current portion ¥ 95,406 ¥ 85,703 $ 876,648
Total borrowings ¥ 268,188 ¥ 250,113 $ 2,464,282
The aggregate annual maturities of long-term debt as of March 31, 2020, were as follows:
Year ending March 31
(Millions of yen)
(Thousands of
U.S. dollars)
2020 2020
2021 ¥ 31,122 $ 285,971
2022 9,191 84,449
2023 2,005 18,424
2024 18,105 166,360
2025 3,505 32,206
2026 and thereafter 62,600 575,209
Total ¥ 126,528 $ 1,162,619

24
11. Assets pledged as collateral (1) Assets pledged as collateral for borrowings as of March 31, 2020 and 2019, were summarized as
follows:
(Millions of yen)
Obligations
secured by
pledged assets
Pledged assets
Cash and
Deposits
Trading
Securities
Receivables
from brokers,
dealers, and
clearing
organizations
Total
2020 Short-term borrowings ¥ 80,400 ¥ 1,001 ¥ 120,202 - ¥ 121,203
Cash received on
securities loaned
12,239 - - - -
Borrowings under
repurchase
agreements
199,319 - 172,781 - 172,781
Payables related to
margin transactions 6,876 - 570 ¥ 21,100 21,670
Total ¥ 298,834 ¥ 1,001 ¥ 293,553 ¥ 21,100 ¥ 315,654
(Millions of yen)
Obligations secured by
pledged assets
Pledged assets
Cash and
Deposits Trading
Securities Receivables from
brokers, dealers,
and clearing
organizations
Total
2019
Short-term borrowings ¥ 80,400 ¥ 12 ¥ 114,438 - ¥ 114,450
Cash received on
securities loaned 17,789 - - - -
Borrowings under
repurchase
agreements
327,510 - 282,962 - 282,962
Payables related to
margin transactions 9,627 - 570 - 570
Total ¥ 435,326 ¥ 12 ¥ 397,970 - ¥ 397,982
(Thousands of U.S. dollar)
Obligations
secured by
pledged assets
Pledged assets
Cash and
Deposits
Trading
Securities
Receivables
from brokers,
dealers, and
clearing
organizations
Total
2020 Short-term borrowings $ 738,767 $ 9,196 $ 1,104,491 - $ 1,113,687
Cash received on
securities loaned
112,462 - - - -
Borrowings under
repurchase
agreements
1,831,467 - 1,587,624 - 1,587,624
Payables related to
margin transactions 63,186 - 5,239 $ 193,881 199,120
Total $ 2,745,882 $ 9,196 $ 2,697,354 $ 193,881 $ 2,900,431

25
(*1) In addition to the above, the following were pledged as collateral for the above obligations:
(Thousands of U.S. dollars) (Millions of yen)
2020 2019 2020
Stocks received as collateral from customers
under self-financing margin transactions ¥ 1,131 ¥ 6,405 $ 10,394
Securities received as collateral for short-term
guarantees
- 148 -
Securities borrowed for collateralized short-term financing agreements
72,390 81,276 665,169
(*2) The following assets were pledged as initial margin for futures transactions and as collateral for other
transactions:
(Thousands of U.S. dollars) (Millions of yen)
2020 2019 2020
Trading securities - ¥ 15 -
Receivables from brokers, dealers, and clearing
organizations ¥ 15 - $ 138
(2) The fair values of securities pledged and received as collateral at March 31, 2020 and 2019, were
as follows:
(Millions of yen) (Thousands of U.S. dollars)
2020 2019 2020
Pledged securities:
Securities loaned to customers for margin transactions ¥ 2,071 ¥ 2,110 $ 19,026
Securities pledged as collateral to securities finance
companies or securities exchange brokers for borrowings under margin transactions
6,523 9,482 59,938
Securities loaned for collateralized short-term
financing agreements 12,612 18,897 115,888
Securities sold under repurchase agreements 198,938 328,132 1,827,967
Securities pledged as collateral for short-term
guarantees 4,249 11,452 39,041
Received securities:
Securities borrowed from finance companies or
securities exchange brokers for margin transactions ¥ 71,471 ¥ 18,110 $ 656,717
Securities received as collateral from customers for
loans under margin transactions 20,252 28,348 186,087
Securities borrowed for collateralized short-term
financing agreements 44,042 53,100 404,682
Securities purchased under resale agreements 310,253 454,197 2,850,802
Securities received as collateral for short-term
guarantees 37,427 38,385 343,907
Other 1,112 1,050 10,217

26
12. Property and equipment Property and equipment as of March 31, 2020 and 2019, consisted of the following:
(Thousands of U.S. dollars) (Millions of yen)
2020 2019 2020
Land ¥ 3,435 ¥ 3,769 $ 31,558
Buildings 7,640 8,458 70,205
Fixtures and furniture 9,123 8,893 83,831
Total 20,198 21,120 185,594
Accumulated depreciation (8,159) (9,083) (74,973)
Net property and equipment ¥ 12,039 ¥ 12,037 $ 110,621
13. Retirement benefits The Company and its domestic subsidiaries have a defined benefit corporate pension plan as a main
defined benefit plan and have a defined contribution retirement plan. There are some cases in which extra
retirement benefits are paid to employees when they retire. Tokai Tokyo Securities contributed to the
retirement benefit trust for its pension plan. Certain domestic consolidated companies apply the simplified
method to state the liability based on the amount that would be paid if employees retired at the
consolidated balance sheet date.
In addition, retirement benefits to directors and Audit & Supervisory Board members of ¥64 million ($587
thousand) and ¥75 million at March 31, 2020 and 2019, respectively, were included in “Liability for
retirement benefits” in the consolidated balance sheet.
1. Defined benefit plans, excluding the plans to which the simplified method is applied
(1) The changes in defined benefit obligation for the years ended March 31, 2020 and 2019, were as
follows:
(Millions of yen)
(Thousands of
U.S. dollars)
2020 2019 2020
Balance at beginning of year ¥ 11,814 ¥ 11,602 $ 108,558
Current service cost 588 615 5,401
Interest cost 110 108 1,009
Actuarial losses 57 462 525
Benefits paid (1,074) (973) (9,868)
Balance at end of year ¥ 11,495 ¥ 11,814 $ 105,625
(2) The changes in plan assets for the years ended March 31, 2020 and 2019, were as follows:
(Millions of yen)
(Thousands of
U.S. dollars)
2020 2019 2020
Balance at beginning of year ¥ 14,211 ¥ 15,144 $ 130,584
Expected return on plan assets 242 225 2,220
Actuarial losses (727) (873) (6,678)
Contributions from the employer 626 688 5,755
Benefits paid (1,074) (973) (9,868)
Balance at end of year ¥ 13,278 ¥ 14,211 $ 122,013

27
(3) Reconciliation between the liability and asset recorded in the consolidated balance sheet and the
balances of defined benefit obligation and plan assets were as follows:
(Millions of yen)
(Thousands of
U.S. dollars)
2020 2019 2020
Funded defined benefit obligation ¥ 11,495 ¥ 11,814 $ 105,625
Plan assets (13,278) (14,211) (122,013)
Total ¥ (1,783) ¥ (2,397) $ (16,388)
Unfunded defined benefit obligation - - -
Net asset arising from defined benefit
obligation
¥ (1,783) ¥ (2,397) $ (16,388)
(Millions of yen)
(Thousands of
U.S. dollars)
2020 2019 2020
Liability for retirement benefits - - -
Asset for retirement benefits ¥ 1,783 ¥ 2,397 $ 16,388
Net asset arising from defined benefit
obligation
¥ (1,783) ¥ (2,397) $ (16,388)
(4) The components of net periodic benefit costs for the years ended March 31, 2020 and 2019, were
as follows:
(Millions of yen)
(Thousands of
U.S. dollars)
2020 2019 2020
Service cost ¥ 588 ¥ 615 $ 5,401
Interest cost 110 108 1,009
Expected return on plan assets (242) (225) (2,220)
Amortization of prior service benefit (530) (326) (4,880)
Recognized actuarial gains (51) (51) (468)
Net periodic benefit costs ¥ (125) ¥ 121 $ (1,158)
(5) Amounts recognized in other comprehensive income (before income tax effect) in respect of
defined retirement benefit plans for the years ended March 31, 2020 and 2019, were as follows:
(Millions of yen)
(Thousands of
U.S. dollars)
2020 2019 2020
Prior service benefit ¥ (51) ¥ (51) $ (468)
Actuarial losses (1,315) (1,661) (12,084)
Total ¥ (1,366) ¥ (1,712) $ (12,552)
(6) Amounts recognized in accumulated other comprehensive income (before income tax effect) in
respect of defined retirement benefit plans as of March 31, 2020 and 2019, were as follows:
(Millions of yen)
(Thousands of
U.S. dollars)
2020 2019 2020
Unrecognized prior service benefit ¥ (38) ¥ (89) $ (351)
Unrecognized actuarial gains (752) (2,067) (6,907)
Total ¥ (790) ¥ (2,156) $ (7,258)

28
(7) Plan assets
(a) Components of plan assets
Plan assets as of March 31, 2020 and 2019, consisted of the following:
2020 2019
Equity investments 51.00% 53.02%
Debt investments 31.02 29.44
General account 12.92 11.42
Others 5.06 6.12
Total 100.00% 100.00%
(*1) The retirement benefit trust contributed to the pension plan is included in the plan assets and constitutes 32.52% and 32.92% of the total plan assets at March 31, 2020 and 2019, respectively.
(b) Method of determining the expected rate of return on plan assets
The expected rate of return on plan assets is determined considering the current and future
asset portfolio and the long-term rates of return which are expected currently and in the
future from the variety of asset portfolios in plan assets.
(8) Assumptions used for the years ended March 31, 2020 and 2019, were set forth as follows:
2020 2019
Discount rate 0.93% 0.93%
Expected rate of return on plan assets 1.69 1.43
Expected rate of future salary increases 4.70 5.40
(*1) These percentages are based on a weighted average.
2. Defined benefit plans to which the simplified method is applied
(1) The changes in liability for retirement benefits for the years ended March 31, 2020 and 2019,
were as follows:
(Millions of yen)
(Thousands of U.S.
dollars)
2020 2019 2020
Balance at beginning of year ¥ 192 ¥ 209 $ 1,760
Net periodic benefit costs 44 54 409
Benefits paid (55) (71) (502)
Decrease by the change in the
scope of consolidation -
- -
Balance at end of year ¥ 181 ¥ 192 $ 1,667
(2) Reconciliation between the liability and asset recorded in the consolidated balance sheet and the
balances of defined benefit obligation and plan assets
(Millions of yen)
(Thousands of
U.S. dollars)
2020 2019 2020
Unfunded defined benefit obligation ¥ 181 ¥ 192 $ 1,667
Net liability arising from defined
benefit obligation
¥ 181 ¥ 192 $ 1,667

29
(Millions of yen)
(Thousands of
U.S. dollars)
2020 2019 2020
Liability for retirement benefits ¥ 181 ¥ 192 $ 1,667
Net liability arising from defined
benefit obligation
¥ 181 ¥ 192 $ 1,667
Net periodic benefit costs based on the simplified method for the years ended March 31, 2020 and
2019, were ¥44 million ($409 thousand) and ¥54 million, respectively.
3. Defined contribution retirement plan
The Group’s contributions to the defined contribution pension plan for the years ended March 31,
2020 and 2019, were ¥575 million ($5,283 thousand) and ¥585 million, respectively.
14. Equity Japanese companies are subject to the Companies Act of Japan (the “Companies Act”). The significant
provisions in the Companies Act that affect financial and accounting matters are summarized below:
(a) Dividends
Under the Companies Act, companies can pay dividends at any time during the fiscal year in addition
to the year-end dividend upon resolution at the shareholders’ meeting. Additionally, for companies that
meet certain criteria including (1) having a Board of Directors, (2) having independent auditors, (3)
having an Audit & Supervisory Board, and (4) the term of service of the directors being prescribed as
one year rather than the normal two year term by its articles of incorporation, the Board of Directors
may declare dividends (except for dividends-in-kind) at any time during the fiscal year if the company
has prescribed so in its articles of incorporation. With respect to the third condition above, the Board of
Directors of companies with an audit and supervisory committee (as implemented under the Company
Act effective May 1, 2015) may also declare dividends at any time during the fiscal year. Because such
companies by nature, meet the criteria under the Companies Act. However, the Company has not
described so in its articles of incorporation.
The Companies Act permits companies to distribute dividends-in-kind (noncash assets) to shareholders
subject to certain limitations and additional requirements. Semiannual interim dividends may also be
paid once a year upon resolution by the Board of Directors if the articles of incorporation of the
company so stipulate. The Companies Act provides certain limitations on the amounts available for
dividends or the purchase of treasury stock. The limitation is defined as the amount available for
distribution to the shareholders, but the amount of net assets after dividends must be maintained at no
less than ¥3million.
(b) Increases/decreases and transfer of common stock, reserve and surplus
The Companies Act requires that an amount equal to 10% of dividends must be appropriated as a legal
reserve (a component of retained earnings) or as additional paid-in capital (a component of capital
surplus), depending on the equity account charged upon the payment of such dividends, until the
aggregate amount of the legal reserve and additional paid-in capital equals 25% of common stock.
Under the Companies Act, the total amount of additional paid-in capital and legal reserve may be
reversed without limitation. The Companies Act also provides that common stock, legal reserve,
additional paid-in capital, other capital surplus and retained earnings can be transferred among the
accounts within equity under certain conditions upon resolution of the shareholders.
(c) Treasury stock and treasury stock acquisition rights
The Companies Act also provides for companies to purchase treasury stock and dispose of such
treasury stock by resolution of the Board of Directors. The amount of treasury stock purchased cannot
exceed the amount available for distribution to the shareholders which is determined by a specific
formula. Under the Companies Act, stock acquisition rights are presented as a separate component of
equity. The Companies Act also provides that companies can purchase both treasury stock acquisition
rights and treasury stock. Such treasury stock acquisition rights are presented as a separate component
of equity or deducted directly from stock acquisition rights.

30
At the Board of Directors meeting held on May 20, 2019, the Company resolved to purchase treasury
stock in accordance with Article 156 of the Company Act applicable pursuant to Article 165, paragraph
(3)of the same law, and cancellation of treasury stock in accordance with Article 178 of the Company
Act.
(1) Purchase of treasury stock
(a) Type of purchased shares: Common stock
(b) Number of purchased shares: 10,000,000 shares
(c) Period of the purchase: From June 3, to July 10, 2019
(d) Amount of the purchase: ¥3,440 million ($ 31,612 thousand)
(2) Cancellation of treasury stock
(a) Type of cancelled shares: Common stock
(b) Number of cancelled shares: 10,000,000 shares
(c) Date of cancellation: August 30, 2019

31
15. Stock options The stock options outstanding for the year ended March 31, 2020, were as follows:
(*1) The exercise prices of the 2015-1and the 2016-1 stock options were adjusted, following the Company’s disposal of treasury stock at a price lower than the fair value price. The fair value prices as of the grant date were not revalued, as the fair value prices of stock options at the date when issuance conditions were determined were lower than those at the grant date.
(*2) 2015-1 stock option reached exercise periods by September 30, 2019.
The stock option activity was as follows: 2015-1
stock option
2016-1
stock option
2017-1
stock option
2018-1
stock option
2019-1
stock option
2020-1
stock option
(Shares) (Shares) (Shares) (Shares) (Shares) (Shares)
For the year ended March 31, 2019
Non-vested
April 1, 2018 – Outstanding - - 1,120,000 1,198,000 - -
Granted - - - - 1,412,000 -
Canceled - - 4,000 8,000 4,000 -
Vested - - 1,116,000 - - -
March 31, 2019 - Outstanding - - - 1,190,000 1,408,000 -
Vested
April 1, 2018 Outstanding 1,052,000 1,048,000 - - - -
Vested - - 1,116,000 - - -
Exercised - - 8,000 - - -
Canceled 21,000 4,000 - - - -
March 31, 2019 - Outstanding 1,031,000 1,044,000 1,108,000 - - -
For the year ended March 31, 2020
Non-vested
March 31, 2019 - Outstanding - - - 1,190,000 1,408,000 -
Granted - - - - - 1,359,000
Stock Option
Persons Granted
Number of options granted
Date of Grant
Exercise price Exercise period
2015-1
stock option
3 directors
39 officers, senior councilors and
councilors
181 employees
2 directors of subsidiaries
1,092,000
Shares
September 5,
2014
¥816
($7.50)
From October 1, 2016
to September 30, 2019
2016-1 stock option
2 directors
39 officers, senior councilors and
councilors
184 employees
2 directors of subsidiaries
1,092,000
Shares
September 4,
2015
¥923
($8.48)
From October 1, 2017
to September 30, 2020
2017-1 Stock Option
2 directors
43 officers, senior councilors and
councilors
190 employees
2 directors of subsidiaries
1,156,000
Shares
September 6,
2016
¥542
($4.98)
From October 1, 2018
to September 30, 2023
2018-1 Stock Option
2 directors
47 officers, senior councilors and
councilors
197 employees
2 directors of subsidiaries
1,216,000
Shares
September 6,
2017
¥673
($6.18)
From October 1, 2019
to September 30, 2024
2019-1 Stock Option
2 directors
53 officers, senior councilors and
councilors
201 employees
20 directors of subsidiaries
7 officers, senior councilors and councilors
of subsidiaries
1,412,000
Shares
September 28,
2018
¥687
($6.31)
From October 1, 2020
to September 30, 2025
2020-1 Stock Option
2 directors
50 officers, senior councilors and
councilors
202 employees
22 directors and 1 employee of subsidiaries
1,359,000
Shares
September 6,
2019
¥305
($2.80)
From October 1, 2021
to September 30, 2026

32
Canceled - - - 24,000 42,000 8,000
Vested - - - 1,166,000 - -
March 31, 2020 - Outstanding - - - - 1,366,000 1,351,000
Vested
March 31, 2019 - Outstanding 1,031,000 1,044,000 1,108,000 - - -
Vested - - - 1,166,000 - -
Exercised - - - - - -
Canceled 1,031,000 8,000 8,000 4,000 - -
March 31, 2020 - Outstanding - 1,036,000 1,100,000 1,162,000 - -
Exercise price ¥816 ¥923 ¥542 ¥673 ¥687 ¥305
($7.50) ($8.48) ($4.98) ($6.18) ($6.31) ($2.80)
Average stock price at exercise - - - - - -
- - - - - -
Fair value price at grant date ¥162.12 ¥99.31 ¥113.52 ¥110.13 ¥96.48 ¥47.56
($1.49) ($0.91) ($1.04) ($1.01) ($0.89) ($0.44)
The assumptions used to measure the fair value of the 2020-1 stock options Estimate method: Black-Scholes option-pricing model Volatility of stock price: 33.26%
Estimated remaining outstanding period: 4.57 years
Estimated dividend: ¥27 per share
Risk-free interest rate: 0.00%

33
16. Income taxes The Company and its domestic subsidiaries are subject to Japanese national and local income taxes, which,
in the aggregate, resulted in normal effective statutory tax rates of approximately 30.63% for the years
ended March 31, 2020 and 2019.
The significant components of deferred tax assets and liabilities as of March 31, 2020 and 2019, were as
follows:
(Millions of yen) (Thousands of U.S. dollars)
2020 2019 2020
Deferred tax assets:
Allowance for doubtful accounts ¥ 119 ¥ 121 $ 1,094
Enterprise tax payable 162 24 1,494
Provision for bonuses 466 616 4,279
Liability for retirement benefits 737 568 6,771
Retirement benefits to directors and Audit & Supervisory Board members
47
35 430
Statutory reserves 189 189 1,734
Impairment loss on investment securities 108 90 996
Impairment loss on fixed assets 42 274 383
Appraisal gain at market value of assets
accompanied with participation in the
consolidated corporate-tax system
-
1 -
Depreciation 48 563 440
Other 1,338 1,430 12,298
Total of tax loss carried forward and
temporary differences 3,256 3,911 29,919
Less valuation allowance (907) (1,540) (8,332)
Deferred tax assets ¥ 2,349 ¥ 2,371 $ 21,587
Deferred tax liabilities:
Unrealized gain on available-for-sale
securities ¥ 282 ¥ 552 $ 2,594
Other 1,870 2,175 17,183
Deferred tax liabilities 2,152 2,727 19,777
Net deferred assets (liabilities) ¥ 197 ¥ (356) $ 1,810
(*1) Valuation allowance decreased by ¥633 million ($5,819 thousand), which resulted from impairment
losses on fixed assets of ¥230 million ($2,115thousand), depreciation of ¥192 million
($1,765thousand), accrued liabilities of ¥72 million ($660 thousand), assets retirement obligation of
¥70 million ($644 thousand) and losses on valuation of golf club memberships of ¥53 million ($484
thousand).

34
A reconciliation between the actual effective tax rate reflected in the accompanying consolidated statement
of income and the normal effective statutory tax rate for the years ended March 31,2020 and 2019, was as
follows:
2020 2019
Effective statutory tax rate 30.63% 30.63%
Increase (decrease) due to:
Permanent differences, such as entertainment expenses 6.47 15.38
Permanently nontaxable items, such as dividend income (104.45) (153.42)
Inhabitants tax per capita levy 2.77 6.48
Gain on change in equity (20.64) -
Equity in gain of associated companies (0.95) 1.24
Amortization of goodwill - 4.91
Valuation allowance (10.49) (46.66)
Adjustment for unrealized profits resulting from transactions
within the Group and other – net 101.74 148.65
Taxable retained income of foreign subsidiaries 5.28 7.47
Taxes for prior years (1.53) 9.23
Other 0.58 0.68
Effective income tax rate 9.41% 24.59%
17. Lease
Future minimum lease payments under noncancelable operating leases were as follows:
Millions of Yen Thousands of
U.S. Dollars
2020 2020
Operating Leases Operating Leases
Due within one year ¥ 1,647 $ 15,135
Due after one year 3,152 28,966
Total ¥ 4,799 $ 44,101
18. Financial instruments and related disclosures (1) Group policy for financial instruments
The Group is involved in the financial instruments trading business, including trading securities, acting
as an intermediary of securities trading, underwriting and offering securities, soliciting and offering
securities, offering private placement securities and other financial instruments treating of trading
business, and services related or incidental to financial instruments trading business. Due to the Group’s
involvement in the financial instruments trading business, the Group holds financial instruments.
In conducting its financial instruments trading business, the Group sets its basic policy as providing
accurate information to meet its various customers’ needs and products through transactions inside or
outside of the stock exchange market. The Group intends to realize sound market functions and smooth
execution of agency trades in the exchange market and fair price formation and smooth distribution of
financial instruments for trading outside the exchange market.
To raise funds to operate the financial instruments trading business, in addition to using indirect
financing such as bank loans, the Group issues commercial paper and bonds taking into account market
conditions and the balance of maturities of loans.
(2) Nature and extent of risks arising from financial instruments
The financial assets and liabilities held by the Group are composed of the following:

35
(a) Securities, such as stocks and bonds, held for trading with customers or for proprietary trading;
derivatives publicly traded on exchanges, such as futures and options, based on stock price indices
and bond futures and bond options; derivatives not traded on outside exchanges, such as bonds with
options, OTC securities options, foreign exchange forward contracts, currency rate swaps, and
interest rate swaps; and securities, such as stock held for investment;
(b) Loan receivables from customers related to margin transactions and borrowings from securities
finance companies incidental to the loan receivables; and
(c) Cash collateral pledged for securities borrowed/cash received on securities loaned based on
collateralized financing agreements with institutional investors and loan receivables as
consideration for purchases of bonds under resale agreements/borrowings as proceeds from sales of
bonds securities under repurchase agreements.
The securities held and transaction balances of derivatives are exposed to market risks triggered by
changes in market values of stock, and interest rate and foreign exchange rate fluctuations.
Receivables related to margin transactions, cash collateral pledged for securities borrowed, loan
receivables for purchases of bonds under resale agreements and OTC derivative transactions are
exposed to credit risks that occur when transaction counterparties’ default. In addition, due to a lack
of liquidity, some of these financial instruments are exposed to market liquidity risks that trigger
losses due to market turmoil, which may result in the Group’s inability to transact in the market or
cause the Group to conduct transactions at significantly unfavorable prices.
Also, with regard to the funding side, the Group owns financial liabilities, such as commercial
paper, bonds and borrowings from financial institutions. As a result of a downturn in the Group’s
business or other reasons, these financial instruments are exposed to funding liquidity risk,
resulting in obstacles to raising funds or being forced to borrow at significantly higher interest rates
than usual, leading to losses.
Besides these assets and liabilities, the Group owes financial liabilities, such as temporary deposits
received from customers for their securities transactions and guarantee deposits received from
customers as transaction deposits for margin transactions and derivative transactions. The financial
assets attributable to customers in these transactions are segregated from our own financial assets
and entrusted as segregated customer’s money trust to the trust bank in accordance with the rules of
Financial Instruments and Exchange Act.
(3) Risk management for financial instruments
(a) Comprehensive risk management
Due to the complexity and diversification of product lines, such as rapid advances of derivative
transactions, the Company regards market, credit, and liquidity risk management as being
extremely important in conducting the Group’s financial instruments trading operations, the main
business line of the Group. The Company puts risk management for the entire group and each
group company as one of the first priorities for the business. The Company and each group
company established a risk management basic policy in order to control risks appropriately by
identifying, analyzing, and managing risks as the responsibility of each group company and to
maintain the soundness of business for a long period of time.
In accordance with this risk management basic policy, the Company established the Total Risk
Management Committee to provide the framework for securing financial soundness and profits by
gathering and controlling information on various risks inherent in the Company and each group
company. The committee discusses matters concerning management of these risks. The committee
meets in principle monthly to monitor implementation status and to provide the framework of
reporting of necessary information to the Board of Directors.
In addition, Tokai Tokyo Securities, a Class I financial instruments trader in the Group, established
a Market and Credit Risk Committee and a Management and Finance Committee and established
the related rules to facilitate the risk management system to prepare for market risk, credit risk, and
liquidity risk. From the perspective of securing business and financial soundness, Tokai Tokyo
Securities set the “target of controlled equity ratio” at the Board of Directors meeting after
deliberation by the Market and Credit Risk Committee that should be maintained at a minimum and
established a basic policy for the purpose of risk management operations to keep the “target.”

36
Regarding risk management relating to the financial instruments trading business, which is our
principal business, the risk controlling department, which is organizationally and physically
independent from the trading execution department (the “Risk Controlling Department”), performs
risk control by calculating risk, positions, and profit or loss on a daily basis and reports it along with
the status of the capital adequacy ratio of Tokai Tokyo Securities to management and related
departments every day. In addition, a discussion and report on risk management is made at the
Market and Credit Risk Committee meeting and at the Management and Finance Committee
meeting.
An appropriate risk control has been in place at the securities trading subsidiaries other than Tokai
Tokyo Securities as well.
(b) Management for market risk
Tokai Tokyo Securities sets basic policies relating to market risk management based on the Group’s
risk management rules and manages the proprietary trading operations.
The Board of Directors of Tokai Tokyo Securities sets market related risk limits within the amount
equivalent to the risk of loss provided in article 8 of the Cabinet Office Ordinance concerning the
Financial Instruments and Exchange Act, the risk limits that are derived by the “target of controlled
equity ratio,” which should be maintained at a minimum. In addition, in order to structure a
management system that checks excessive risk taking actions, Tokai Tokyo Securities also
enhances the functions of overall risk management by the following: to the extent of the market risk
limit of the Group, the Market and Credit Risk Committee restricts market risk by setting the value
at risk (“VaR”)-based position limit on each department holding proprietary trading positions
taking into account the budget and profit performance of each department; setting annual and
monthly loss limits and warning lines for these limits for each department in order to prevent losses
from increasing; and maintaining the Group’s internal rules.
The management method of market risk for the positions held by the trading department includes
management based on VaR (10-day holding period with confidence interval of 99% and
observation period 750 days) computed using historical simulation method; measurement of stress
value (one day and 10-day holding periods and observation period 750 days); and back testing of
the relationship between the VaR (holding period of one day) data and daily profit/loss data,
periodically. In addition, stress tests under the various scenarios by products or by ratings have
been periodically conducted.
The department that owns positions exposed to market liquidity risk, which is triggered when it
becomes impossible to execute transactions in the market because of market turmoil, etc., caused
by low liquidity or which arises when the Group is forced to enter into the transactions at
significantly unfavorable prices, sets an upper limit on the exposure of the market liquidity risk
position.
The risk limits set and allocated for related departments, use of loss limits, profits and losses, stress
value, and status of market liquidity risk positions are analyzed, managed on a daily basis, and
reported to top management by the Risk Controlling Department. Also, analysis of market risk
management and overall reports are made to the Market and Credit Risk Committee. In addition,
the status of market risk management is reported monthly to the Board of Directors.

37
The estimated amount of market risk (estimated amount of loss) of Tokai Tokyo Securities as of
March 31, 2020 and 2019, was as follows:
(Millions of yen)
(Thousands of
U.S. dollars)
2020 2019 2020
Amount of Market Risk
(VaR)
¥ 550 ¥ 499 $ 5,058
(Note) VaR measures the amount of market risk with a certain probability that is statistically calculated based on
historical market fluctuations. Therefore, the risk may not be fully captured under a market environment that
changes drastically.
(c) Credit risk management
Based on our risk management rules, Tokai Tokyo Securities controls the risk of incurring damages
arising from the default of counterparties of transactions or other reasons within predetermined
limits. At Tokai Tokyo Securities, the Director in charge of the Risk Controlling Department
manages risks by setting the upper risk limit within the amount equivalent to the risk of loss
provided in article 8 of the Cabinet Office Ordinance concerning to the Financial Instruments and
Exchange Act, which is led by the “target of controlled equity ratio” that should be maintained at
minimum.
Upon setting the credit risk limits for each counterparty of a transaction, the Risk Controlling
Department evaluates financial conditions, etc., of each counterparty of the transaction and sets the
upper limit of the credit and determines the acceptability of the transaction in accordance with the
authority of granting the credit limit, taking into account the net worth of the counterparty or Tokai
Tokyo Securities. It also reviews the credit limit periodically.
Also, in order to control the credit balance after the transaction contract, with the cooperation of the
related department, the office related to each counterparty periodically collects financial
information of the counterparty and observes changes in the credit condition of the counterparty
during the course of daily business operations. When the credit condition of the counterparty
deteriorates, the Risk Controlling Department consults with the related department and takes
measures to secure the credit, such as suspension of a new transaction, reduction of the credit limit,
change of the terms of the transaction, or requiring collateral, to the extent of the approved credit
limits.
Depending upon the nature of the products, the current exposure method or potential exposure
method is adopted in calculating credit risks. The credit risk is analyzed and managed on a daily
basis and reported to top management by the Risk Controlling Department. Also, the analysis of
credit risk management status and overall reports are made to the Credit and Operational Risk
Committee. In addition, the status of credit risk management is reported monthly to the Board of
Directors.
(d) Liquidity risk management
Based on our liquidity risk management rules, the Company and Tokai Tokyo Securities set and
operate basic policies for the risk management framework for appropriate funding.
The Company develops a strategy for the liquidity risk of funding by gathering and analyzing
information, such as stock prices and reputation, to identify and assess liquidity risks for funding
that may affect the Company’s funding. To manage funding risk, the Company implements
necessary measures, taking into account the situation in managing the funding risk, depending upon
the possibility of cash flow problems of consolidated subsidiaries affecting the Company’s funding
based on the subsidiaries’ performance.
Also, in order to secure the adequacy of funding management, the funding control department of
Tokai Tokyo Securities determines the accurate funding situation based on the daily management
status of various daily funding relating to funds raised and fund management and plans and controls
the prospects of monthly and quarterly funding. The status and forecast of funding are reported
monthly to the Board of Directors.

38
The funding control department conducts as-needed management relating to funding in response to
movements in the market environment. Information relating to the activities is reported to the
Board of Directors after promptly assessing the impact on funding.
In relation to the securing of assets for payment reserves and the fund-raising method, the funding
control department secures the financing method depending upon the degree of funding ability
(normal, concerned, crisis, etc.) and payment reserve assets for settlements. In addition, it secures
funding methods, assuming a period of crisis by holding assets available for sale or collateral in
Japan and overseas and setting borrowing facilities in order to obtain funds from commercial
banks.
(4) Supplementary explanations of matters related to the fair value of financial instruments
Fair values of financial instruments include values based on market prices and values obtained by
reasonable estimates when financial instruments have no market prices. Because certain assumptions
are adopted in calculating these values, they may differ when different assumptions are adopted.
(5) Fair values of financial instruments
Fair values of financial instruments are based on quoted prices in active markets. If a quoted price is not
available, another rational valuation technique is used instead.
(a) Fair values of financial instruments
The carrying amounts, aggregate fair values, and net unrealized loss of financial instruments at
March 31, 2020 and 2019, were as follows:
(Millions of yen)
March 31, 2020 Carrying
amount Fair value
Unrealized
loss
Cash and deposits ¥ 64,746 ¥ 64,746 -
Cash segregated as deposits 51,122 51,122 -
Cash collateral pledged for securities
borrowed
31,249 31,249 -
Loans under resale agreements 310,620 310,620 -
Trading securities 407,262 407,262 -
Derivatives 18,613 18,613 -
Receivables from brokers, dealers, and
clearing organizations
47,107 47,107 -
Receivables related to margin transactions 99,267 99,267 -
Short-term investment securities and
Investment securities
4,704 4,704 -
Assets total ¥ 1,034,690 ¥ 1,034,690 -
Short-term borrowings ¥ 125,660 ¥ 125,660 -
Commercial paper 16,000 16,000 -
Current portion of long-term debt 31,122 31,122 -
Long-term debt 95,406 95,735 ¥ (329)
Cash received on securities loaned 12,239 12,239 -
Borrowings under repurchase agreements 199,319 199,319 -
Trading securities 330,162 330,162 -
Derivatives 11,437 11,437 -
Payables to brokers, dealers, and clearing
organizations
50,366 50,366 -
Payables to customers 48,173 48,173 -
Payables related to margin transactions 8,944 8,944 -
Liabilities total ¥ 928,828 ¥ 929,157 ¥ (329)

39
(Millions of yen)
March 31, 2019 Carrying
amount Fair value Unrealized
loss
Cash and deposits ¥ 47,921 ¥ 47,921 -
Cash segregated as deposits 42,031 42,031 -
Cash collateral pledged for securities
borrowed 39,664 39,664 -
Loans under resale agreements 453,195 453,195 -
Trading securities 654,224 654,224 -
Derivatives 6,470 6,470 -
Receivables from brokers, dealers, and
clearing organizations 14,928 14,928 -
Receivables related to margin transactions 49,407 49,407 -
Short-term investment securities and
Investment securities 5,952 5,952 -
Assets total ¥ 1,313,792 ¥ 1,313,792 -
Short-term borrowings ¥ 120,645 ¥ 120,645 -
Commercial paper 16,000 16,000 -
Current portion of long-term debt 27,765 27,765 -
Long-term debt 85,703 86,266 ¥ (563)
Cash received on securities loaned 17,789 17,789 -
Borrowings under repurchase agreements 327,510 327,510 -
Trading securities 540,358 540,358 -
Derivatives 6,332 6,332 -
Payables to brokers, dealers, and clearing
organizations 16,170 16,170 -
Payables to customers 33,430 33,430 -
Payables related to margin transactions 11,656 11,656 -
Liabilities total ¥ 1,203,358 ¥ 1,203,921 ¥ (563)
(Thousands of U.S. dollars)
March 31, 2020 Carrying
amount Fair value
Unrealized
loss
Cash and deposits $ 594,925 $ 594,925 -
Cash segregated as deposits 469,743 469,743 -
Cash collateral pledged for securities
borrowed
287,133 287,133 -
Loans under resale agreements 2,854,179 2,854,179 -
Trading securities 3,742,182 3,742,182 -
Derivatives 171,032 171,032 -
Receivables from brokers, dealers, and
clearing organizations
432,851 432,851 -
Receivables related to margin transactions 912,132 912,132 -
Short-term investment securities and
Investment securities
43,225 43,225 -
Assets total $ 9,507,402 $ 9,507,402 -

40
(Thousands of U.S. dollars)
March 31, 2020 Carrying
amount Fair value Unrealized
loss
Short-term borrowings $ 1,154,645 $ 1,154,645 -
Commercial paper 147,018 147,018 -
Current portion of long-term debt 285,971 285,971 -
Long-term debt 876,648 879,674 $ (3,026)
Cash received on securities loaned 112,462 112,462 -
Borrowings under repurchase agreements 1,831,467 1,831,467 -
Trading securities 3,033,739 3,033,739 -
Derivatives 105,096 105,096 -
Payables to brokers, dealers, and clearing
organizations
462,794 462,794 -
Payables to customers 442,642 442,642 -
Payables related to margin transactions 82,182 82,182 -
Liabilities total $ 8,534,664 $ 8,537,690 $ (3,026)
Methods for determining fair values of financial instruments for the years ended March 31, 2020 and
2019, were as follows:
Cash and deposits, Cash segregated as deposits, Cash collateral pledged for securities borrowed,
Loans under resale agreements, Receivables from brokers, dealers and clearing organizations, and Receivables related to margin transactions
The carrying values of these financial instruments approximate fair values because they are
settled in a short period.
Trading securities The fair values of these financial instruments are determined in accordance with the internal
rules of fair value assessment.
Short-term investment securities and Investment securities The fair values of these financial instruments are measured at the quoted market price in
active markets in accordance with the internal rules of fair value assessment.
Short-term borrowings, Commercial paper, Current portion of long-term debt, Cash received on securities loaned, Borrowings under repurchase agreements, Payables to brokers, dealers and clearing organizations, Payables to customers and Payables related to margin transactions
The carrying values of these financial instruments approximate fair values because they are
settled in a short period.
Derivatives
Fair value information for derivatives is included in Note 9.
Long-term debt Long-term debt from banks and other financial institutions
The fair value of long-term debt with floating interest rates is equal to book value on the
basis that carrying values of long-term debt approximate fair values because the long-term
debt is based on variable interest rates reflecting market interest rates in a short period of
time, and credit conditions have not significantly changed since the execution. The fair value
of long-term debt with fixed interest rates is set as the present value of the total amount of
principal and interest to be paid estimated by applying the discount rate assumed when a
similar and new borrowing is made.
Bonds Payable The fair value is measured at a quoted market price in active markets. If a quoted price is not
available, the fair value is calculated as the present value of the total amount of principal and
interest estimated by applying a discount rate commensurate with the remaining period and
credit risk.

41
(b) Carrying amount of financial instruments whose fair values cannot be reliably determined
(Millions of yen)
(Thousands of
U.S. dollars)
2020 2019 2020
Investment in associated companies ¥ 28,312 ¥ 26,255 $ 260,147
Available-for-sale securities:
Stocks (nonlisted) 5,455 4,340 50,126
Other 6,577 5,543 60,432
Total ¥ 40,344 ¥ 36,138 $ 370,705
The fair values of unlisted stocks are not included in “Investment securities” in the table (a) as they do
not have a quoted market price in active markets, the amount of future cash flows cannot be estimated,
and their fair values cannot be reliably determined.
(6) Maturity analysis for financial assets and securities with contractual maturities
(Millions of yen)
March 31, 2020
Due in
one year
or less
Due after one year through
five years
Due after five years through 10
years
Due after 10
Years
Cash and deposits ¥ 3,882 - - -
Total ¥ 3,882 - - -
(Thousands of U.S. dollars)
March 31, 2020
Due in
one year or less
Due after one year through
five years
Due after five years through 10
years
Due after 10
Years
Cash and deposits $ 35,669 - - -
Total $ 35,669 - - -
Please see Note 9 for annual maturities of long-term debt.
19. Commissions Commissions earned for the years ended March 31, 2020 and 2019, consisted of the following:
(Thousands of U.S. dollars) (Millions of yen)
2020 2019 2020
Brokerage ¥ 12,240 ¥ 10,729 $ 112,467
Underwriting and distribution 7,222 8,199 66,364
Other 9,710 10,026 89,223
Total ¥ 29,172 ¥ 28,954 $ 268,054

42
20. Selling, general and administrative expenses Selling, general and administrative expenses for the years ended March 31, 2020 and 2019, consisted of
the following:
(Thousands of U.S. dollars) (Millions of yen)
2020 2019 2020
Employees’ compensation and benefits ¥ 27,828 ¥ 29,544 $ 255,700
Brokerage and other commissions 5,645 5,707 51,872
Communication and transportation 3,109 3,175 28,569
Real estate expenses 7,584 7,845 69,686
Data processing and office supplies 7,516 7,994 69,065
Advertising 1,561 1,789 14,348
Taxes other than income taxes 1,340 1,274 12,308
Depreciation 1,988 1,151 18,268
Amortization 1,239 1,170 11,382
Amortization of goodwill 252 245 2,318
Other 2,530 3,051 23,240
Total ¥ 60,592 ¥ 62,945 $ 556,756
21. Other income and expenses
The components of “Other income, net” in the consolidated statements of income for the years ended
March 31, 2020 and 2019, were as follows:
(Millions of yen)
(Thousands of
U.S. dollars)
2020 2019
2020
Dividend income ¥ 645 ¥ 714 $ 5,929
Rental income 473 500 4,343
Net gain on investment in partnership 236 170 2,173
Equity in loss of associated companies (94) (62) (864)
Foreign exchange losses (47) (15) (428)
Net (loss) gain on sales and Impairment loss on
investment securities (14) 1,209 (130)
Gain on change in equity 2,055 - 18,879
Gain on reversal of stock acquisition rights 167 139 1,530
Net gain on sales of fixed assets 144 - 1,320
Impairment loss on fixed assets (1) (152) (11)
Gain on sales of associated company - 5 -
Special retirement benefits - (598) -
Provision for statutory reserves (1) (7) (5)
Other(*1) 310 17 2,853
Total ¥ 3,873 ¥ 1,920 $ 35,589
(*1) Prior to the fiscal year ended March 31, 2020, “Settlement package” was disclosed sparetely.
Since during this fiscal year ended March 31, 2020, the amount was immaterial, such amount is
included in “Other” in the above. “Settlement package” of ¥89 million for the year ended March
31, 2019 was reclassified to “Other” in the above.
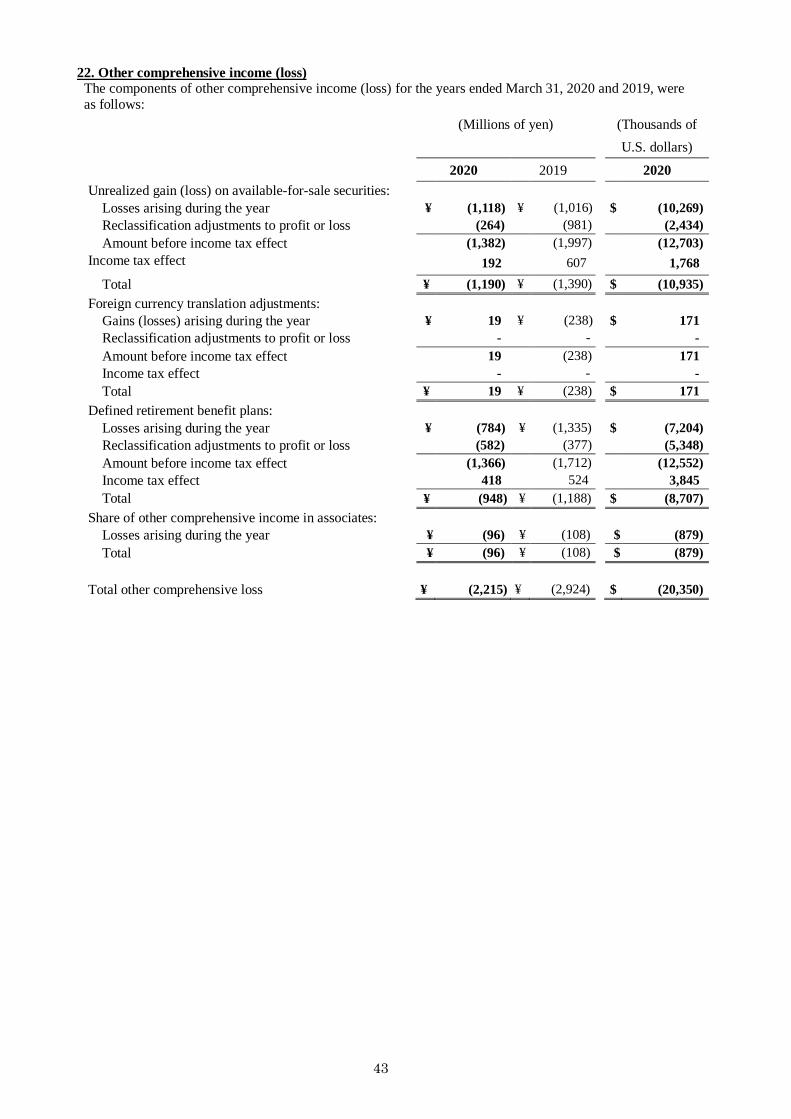
43
22. Other comprehensive income (loss) The components of other comprehensive income (loss) for the years ended March 31, 2020 and 2019, were
as follows:
(Millions of yen)
(Thousands of
U.S. dollars)
2020 2019 2020
Unrealized gain (loss) on available-for-sale securities:
Losses arising during the year ¥ (1,118) ¥ (1,016) $ (10,269)
Reclassification adjustments to profit or loss (264) (981) (2,434)
Amount before income tax effect (1,382) (1,997) (12,703)
Income tax effect 192 607 1,768
Total ¥ (1,190) ¥ (1,390) $ (10,935)
Foreign currency translation adjustments:
Gains (losses) arising during the year ¥ 19 ¥ (238) $ 171
Reclassification adjustments to profit or loss - - -
Amount before income tax effect 19 (238) 171
Income tax effect - - -
Total ¥ 19 ¥ (238) $ 171
Defined retirement benefit plans:
Losses arising during the year ¥ (784) ¥ (1,335) $ (7,204)
Reclassification adjustments to profit or loss (582) (377) (5,348)
Amount before income tax effect (1,366) (1,712) (12,552)
Income tax effect 418 524 3,845
Total ¥ (948) ¥ (1,188) $ (8,707)
Share of other comprehensive income in associates:
Losses arising during the year ¥ (96) ¥ (108) $ (879)
Total ¥ (96) ¥ (108) $ (879)
Total other comprehensive loss ¥ (2,215) ¥ (2,924) $ (20,350)
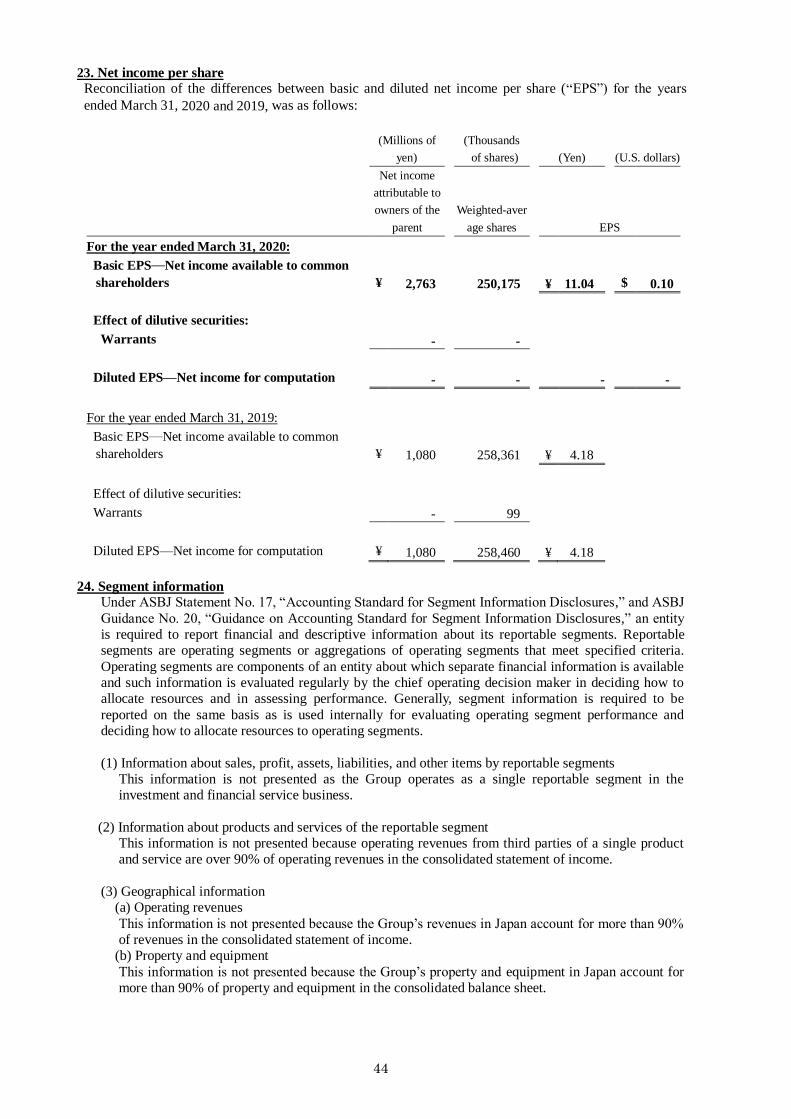
44
23. Net income per share Reconciliation of the differences between basic and diluted net income per share (“EPS”) for the years
ended March 31, 2020 and 2019, was as follows:
(Millions of
yen)
(Thousands
of shares) (Yen)
(U.S. dollars)
Net income
attributable to
owners of the
parent
Weighted-aver
age shares EPS
For the year ended March 31, 2020:
Basic EPS—Net income available to common
shareholders ¥ 2,763 250,175 ¥ 11.04
$ 0.10
Effect of dilutive securities:
Warrants - - ¥
Diluted EPS—Net income for computation - - - -
For the year ended March 31, 2019:
Basic EPS—Net income available to common
shareholders ¥ 1,080 258,361 ¥ 4.18
Effect of dilutive securities:
Warrants - 99
Diluted EPS—Net income for computation ¥ 1,080 258,460 ¥ 4.18
24. Segment information Under ASBJ Statement No. 17, “Accounting Standard for Segment Information Disclosures,” and ASBJ
Guidance No. 20, “Guidance on Accounting Standard for Segment Information Disclosures,” an entity
is required to report financial and descriptive information about its reportable segments. Reportable
segments are operating segments or aggregations of operating segments that meet specified criteria.
Operating segments are components of an entity about which separate financial information is available
and such information is evaluated regularly by the chief operating decision maker in deciding how to
allocate resources and in assessing performance. Generally, segment information is required to be
reported on the same basis as is used internally for evaluating operating segment performance and
deciding how to allocate resources to operating segments.
(1) Information about sales, profit, assets, liabilities, and other items by reportable segments
This information is not presented as the Group operates as a single reportable segment in the
investment and financial service business.
(2) Information about products and services of the reportable segment
This information is not presented because operating revenues from third parties of a single product
and service are over 90% of operating revenues in the consolidated statement of income.
(3) Geographical information
(a) Operating revenues
This information is not presented because the Group’s revenues in Japan account for more than 90%
of revenues in the consolidated statement of income.
(b) Property and equipment
This information is not presented because the Group’s property and equipment in Japan account for
more than 90% of property and equipment in the consolidated balance sheet.

45
(4) Information by major customers
This information is not presented because there are no customers for which sales account for more
than 10% of revenues in the consolidated statement of income.
(5) Information about impairment loss on fixed assets, goodwill, and negative goodwill by reportable
segment
This information is not presented as the Group operates as a single reportable segment in the
investment and financial service business.
25. Subsequent event Appropriation of Retained Earnings
On June 25, 2020, the shareholders approved the appropriation of retained earnings as follows:
(Millions of yen)
(Thousands of U.S. dollars)
Cash dividends, ¥4.00 ($0.04) per share ¥ 993 $ 9,129


