consolidated financial statements (unaudited) as...
TRANSCRIPT
Consolidated
Financial Statements (Unaudited)
As at September 30, 2017 In Millions of U.S. Dollars

1 Israel Chemicals Limited Quarterly Report
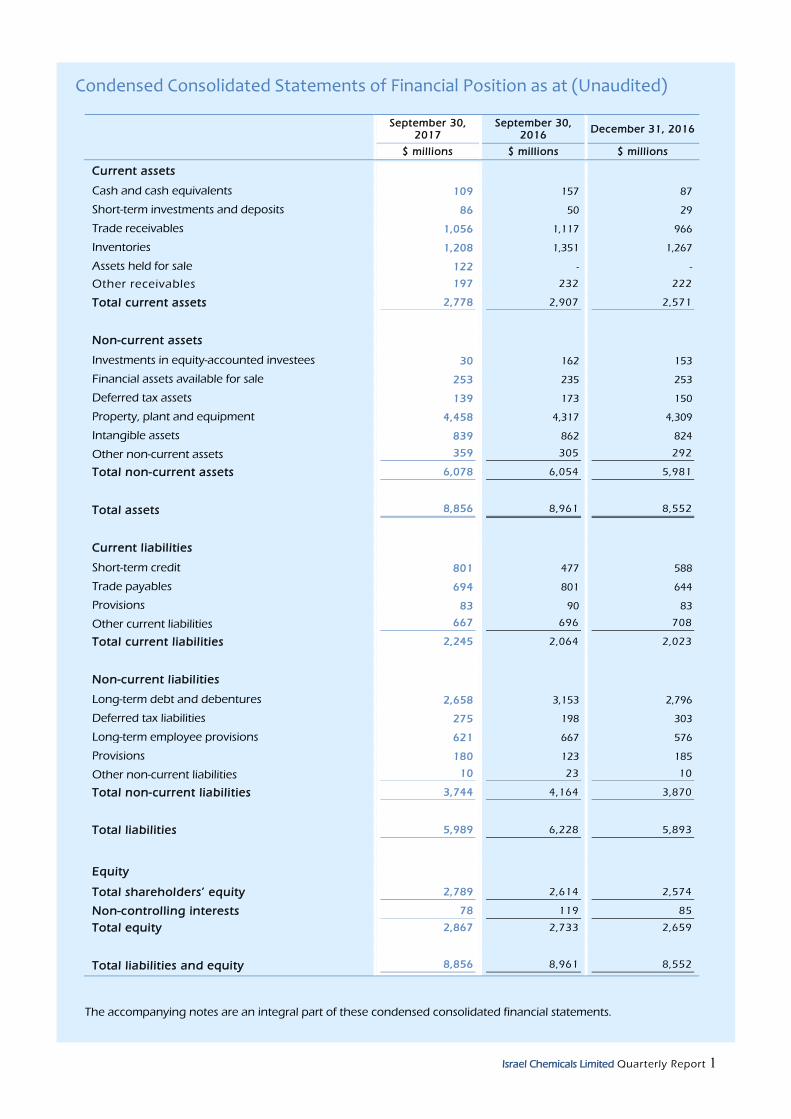
Condensed Consolidated Statements of Financial Position as at (Unaudited)
September 30,
2017 September 30,
2016 December 31, 2016
$ millions $ millions $ millions
Current assets
Cash and cash equivalents 109 157 87
Short-term investments and deposits 86 50 29
Trade receivables 1,056 1,117 966
Inventories 1,208 1,351 1,267
Assets held for sale 122 - -
Other receivables 197 232 222
Total current assets 2,778 2,907 2,571
Non-current assets
Investments in equity-accounted investees 30 162 153
Financial assets available for sale 253 235 253
Deferred tax assets 139 173 150
Property, plant and equipment 4,458 4,317 4,309
Intangible assets 839 862 824
Other non-current assets 359 305 292
Total non-current assets 6,078 6,054 5,981
Total assets 8,856 8,961 8,552
Current liabilities
Short-term credit 801 477 588
Trade payables 694 801 644
Provisions 83 90 83
Other current liabilities 667 696 708
Total current liabilities 2,245 2,064 2,023
Non-current liabilities
Long-term debt and debentures 2,658 3,153 2,796
Deferred tax liabilities 275 198 303
Long-term employee provisions 621 667 576
Provisions 180 123 185
Other non-current liabilities 10 23 10
Total non-current liabilities 3,744 4,164 3,870
Total liabilities 5,989 6,228 5,893
Equity
Total shareholders’ equity 2,789 2,614 2,574
Non-controlling interests 78 119 85
Total equity 2,867 2,733 2,659
Total liabilities and equity 8,856 8,961 8,552
The accompanying notes are an integral part of these condensed consolidated financial statements.
2 Israel Chemicals Limited Quarterly Report
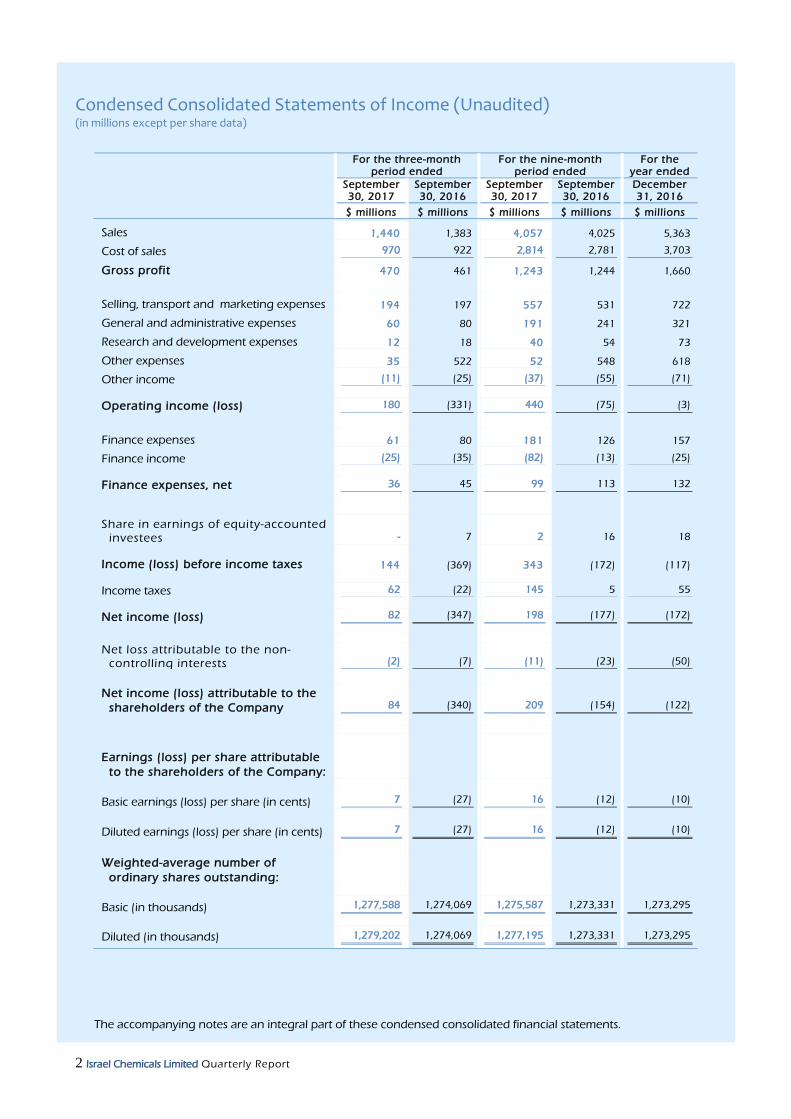
Condensed Consolidated Statements of Income (Unaudited) (in millions except per share data)
For the three-month period ended
For the nine-month period ended
For the year ended
September 30, 2017
September 30, 2016
September 30, 2017
September 30, 2016
December 31, 2016
$ millions $ millions $ millions $ millions $ millions
Sales 1,440 1,383 4,057 4,025 5,363
Cost of sales 970 922 2,814 2,781 3,703
Gross profit 470 461 1,243 1,244 1,660
Selling, transport and marketing expenses 194 197 557 531 722
General and administrative expenses 60 80 191 241 321
Research and development expenses 12 18 40 54 73
Other expenses 35 522 52 548 618
Other income (11) (25) (37) (55) (71)
Operating income (loss) 180 (331) 440 (75) (3)
Finance expenses 61 80 181 126 157
Finance income (25) (35) (82) (13) (25)
Finance expenses, net 36 45 99 113 132
Share in earnings of equity-accounted investees - 7 2 16 18
Income (loss) before income taxes 144 (369) 343 (172) (117)
Income taxes 62 (22) 145 5 55
Net income (loss) 82 (347) 198 (177) (172)
Net loss attributable to the non-
controlling interests (2) (7) (11) (23) (50)
Net income (loss) attributable to the
shareholders of the Company 84 (340) 209 (154) (122)
Earnings (loss) per share attributable
to the shareholders of the Company:
Basic earnings (loss) per share (in cents) 7 (27) 16 (12) (10)
Diluted earnings (loss) per share (in cents) 7 (27) 16 (12) (10)
Weighted-average number of
ordinary shares outstanding:
Basic (in thousands) 1,277,588 1,274,069 1,275,587 1,273,331 1,273,295
Diluted (in thousands) 1,279,202 1,274,069 1,277,195 1,273,331 1,273,295
The accompanying notes are an integral part of these condensed consolidated financial statements.

3 Israel Chemicals Limited Quarterly Report
Condensed Consolidated Statements of Comprehensive Income (Unaudited)
For the three-month
period ended
For the nine-month period ended
For the year
ended
September 30, 2017
September 30, 2016
September 30, 2017
September 30, 2016
December 31, 2016
$ millions $ millions $ millions $ millions $ millions
Net income (loss) 82 (347) 198 (177) (172)
Components of other comprehensive income that will be reclassified subsequently to net income (loss)
Currency translation differences 39 (4) 129 (4) (90)
Changes in fair value of derivatives
designated as a cash flow hedge - - - (1) (1)
Changes in fair value of financial assets
available for sale 40 (19) (11) (11) 17
Tax income (expense) relating to items
that will be reclassified subsequently to
net income (loss) (1) 2 4 - (5)
Total 78 (21) 122 (16) (79)
Components of other comprehensive income that will not be reclassified to net income (loss)
Actuarial gains (losses) from defined
benefit plan 5 (56) (4) (102) (48)
Tax income (expense) relating to items
that will not be reclassified to net income
(loss) (2) 10 - 19 8
Total 3 (46) (4) (83) (40)
Total comprehensive income (loss) 163 (414) 316 (276) (291)
Comprehensive loss attributable to the
non-controlling interests - (7) (7) (27) (59)
Comprehensive income (loss) attributable to the shareholders of the Company
163 (407) 323 (249) (232)
The accompanying notes are an integral part of these condensed consolidated financial statements.
4 Israel Chemicals Limited Quarterly Report
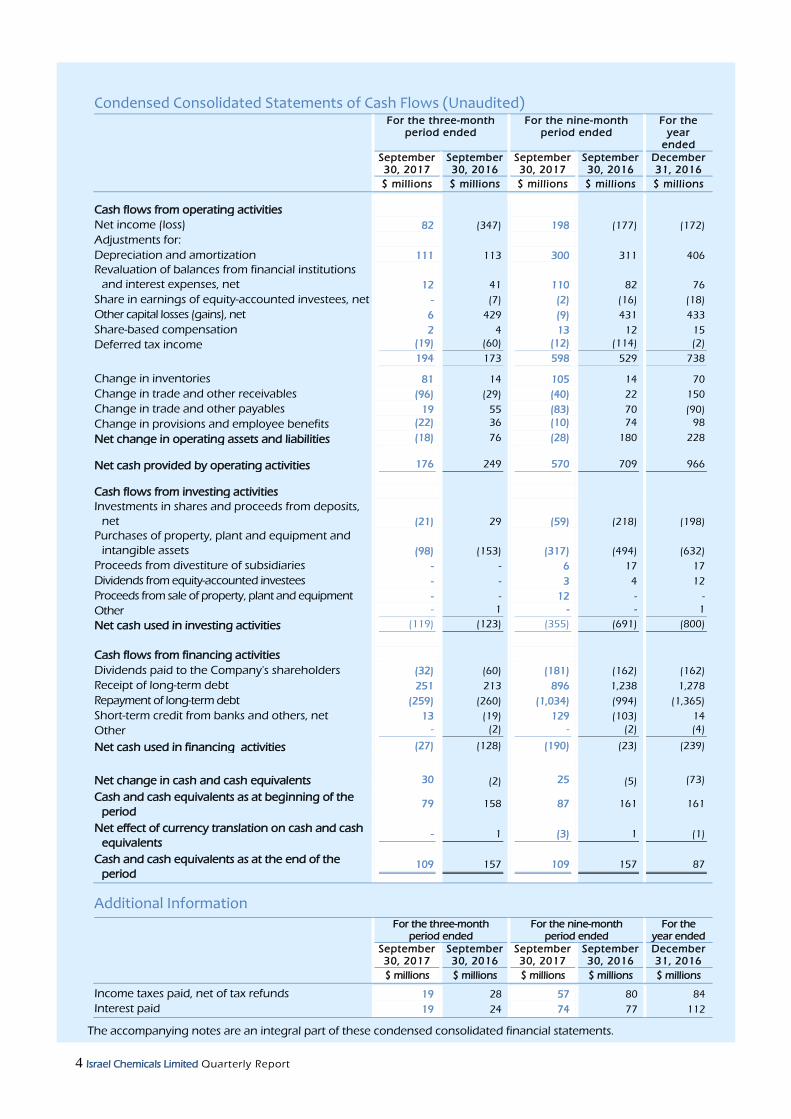
Condensed Consolidated Statements of Cash Flows (Unaudited)
For the three-month period ended
For the nine-month period ended
For the year
ended
September 30, 2017
September 30, 2016
September 30, 2017
September 30, 2016
December 31, 2016
$ millions $ millions $ millions $ millions $ millions
Cash flows from operating activities
Net income (loss) 82 (347) 198 (177) (172)
Adjustments for:
Depreciation and amortization 111 113 300 311 406
Revaluation of balances from financial institutions
and interest expenses, net 12 41 110 82 76
Share in earnings of equity-accounted investees, net - (7) (2) (16) (18)
Other capital losses (gains), net 6 429 (9) 431 433
Share-based compensation 2 4 13 12 15
Deferred tax income (19) (60) (12) (114) (2)
194 173 598 529 738
Change in inventories 81 14 105 14 70
Change in trade and other receivables (96) (29) (40) 22 150
Change in trade and other payables 19 55 (83) 70 (90)
Change in provisions and employee benefits (22) 36 (10) 74 98
Net change in operating assets and liabilities (18) 76 (28) 180 228
Net cash provided by operating activities 176 249 570 709 966
Cash flows from investing activities
Investments in shares and proceeds from deposits,
net (21) 29 (59) (218) (198)
Purchases of property, plant and equipment and
intangible assets (98) (153) (317) (494) (632)
Proceeds from divestiture of subsidiaries - - 6 17 17
Dividends from equity-accounted investees - - 3 4 12
Proceeds from sale of property, plant and equipment - - 12 - -
Other - 1 - - 1
Net cash used in investing activities (119) (123) (355) (691) (800)
Cash flows from financing activities
Dividends paid to the Company's shareholders (32) (60) (181) (162) (162)
Receipt of long-term debt 251 213 896 1,238 1,278
Repayment of long-term debt (259) (260) (1,034) (994) (1,365)
Short-term credit from banks and others, net 13 (19) 129 (103) 14
Other - (2) - (2) (4)
Net cash used in financing activities (27) (128) (190) (23) (239)
Net change in cash and cash equivalents 30 (2) 25 (5) (73)
Cash and cash equivalents as at beginning of the
period 79 158 87 161 161
Net effect of currency translation on cash and cash
equivalents - 1 (3) 1 (1)
Cash and cash equivalents as at the end of the
period 109 157 109 157 87
Additional Information
For the three-month period ended
For the nine-month period ended
For the year ended
September 30, 2017
September 30, 2016
September 30, 2017
September 30, 2016
December 31, 2016
$ millions $ millions $ millions $ millions $ millions
Income taxes paid, net of tax refunds 19 28 57 80 84
Interest paid 19 24 74 77 112
The accompanying notes are an integral part of these condensed consolidated financial statements.
5 Israel Chemicals Limited Quarterly Report
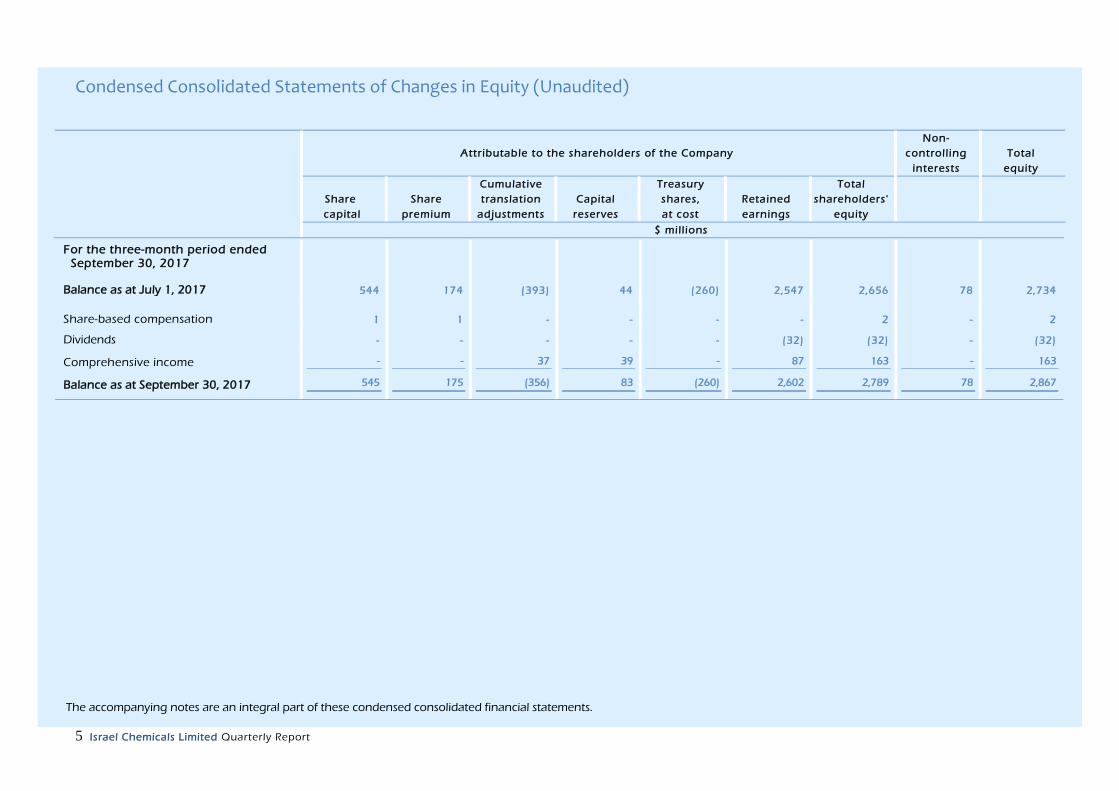
Condensed Consolidated Statements of Changes in Equity (Unaudited)
Attributable to the shareholders of the Company
Non-
control l ing Total
interests equity
Cumulat ive Treasury Total
Share Share translation Capital shares, Retained shareholders '
capital premium adjustments reserves at cost earnings equity
$ mil l ions
For the three-month period ended September 30, 2017
Balance as at July 1, 2017 544 174 (393) 44 (260) 2,547 2,656 78 2,734
Share-based compensation 1 1 - - - - 2 - 2
Dividends - - - - - (32) (32) - (32)
Comprehensive income - - 37 39 - 87 163 - 163
Balance as at September 30, 2017 545 175 (356) 83 (260) 2,602 2,789 78 2,867
The accompanying notes are an integral part of these condensed consolidated financial statements.
6 Israel Chemicals Limited Quarterly Report
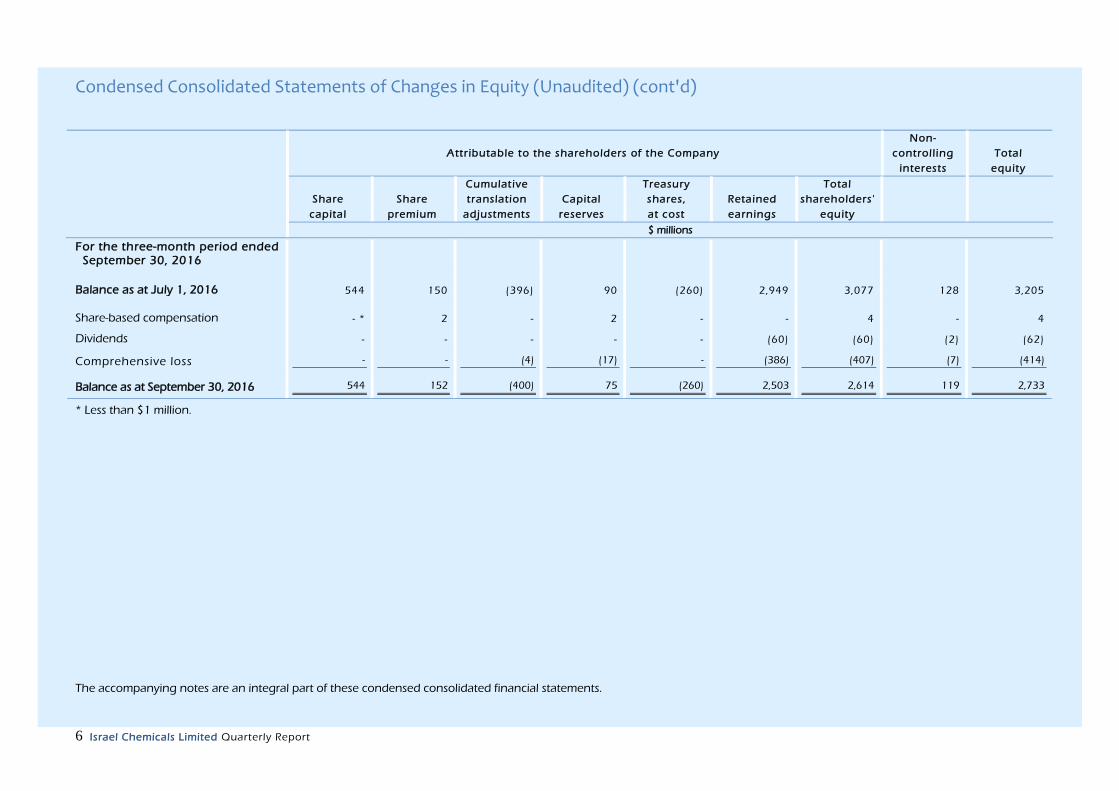
Condensed Consolidated Statements of Changes in Equity (Unaudited) (cont'd)
Attributable to the shareholders of the Company
Non-
control l ing Total
interests equity
Cumulat ive Treasury Total
Share Share translation Capital shares, Retained shareholders '
capital premium adjustments reserves at cost earnings equity
$ millions
For the three-month period ended September 30, 2016
Balance as at July 1, 2016 544 150 (396) 90 (260) 2,949 3,077 128 3,205
Share-based compensation - * 2 - 2 - - 4 - 4
Dividends - - - - - (60) (60) (2) (62)
Comprehensive loss - - (4) (17) - (386) (407) (7) (414)
Balance as at September 30, 2016 544 152 (400) 75 (260) 2,503 2,614 119 2,733
* Less than $1 million.
The accompanying notes are an integral part of these condensed consolidated financial statements.
7 Israel Chemicals Limited Quarterly Report
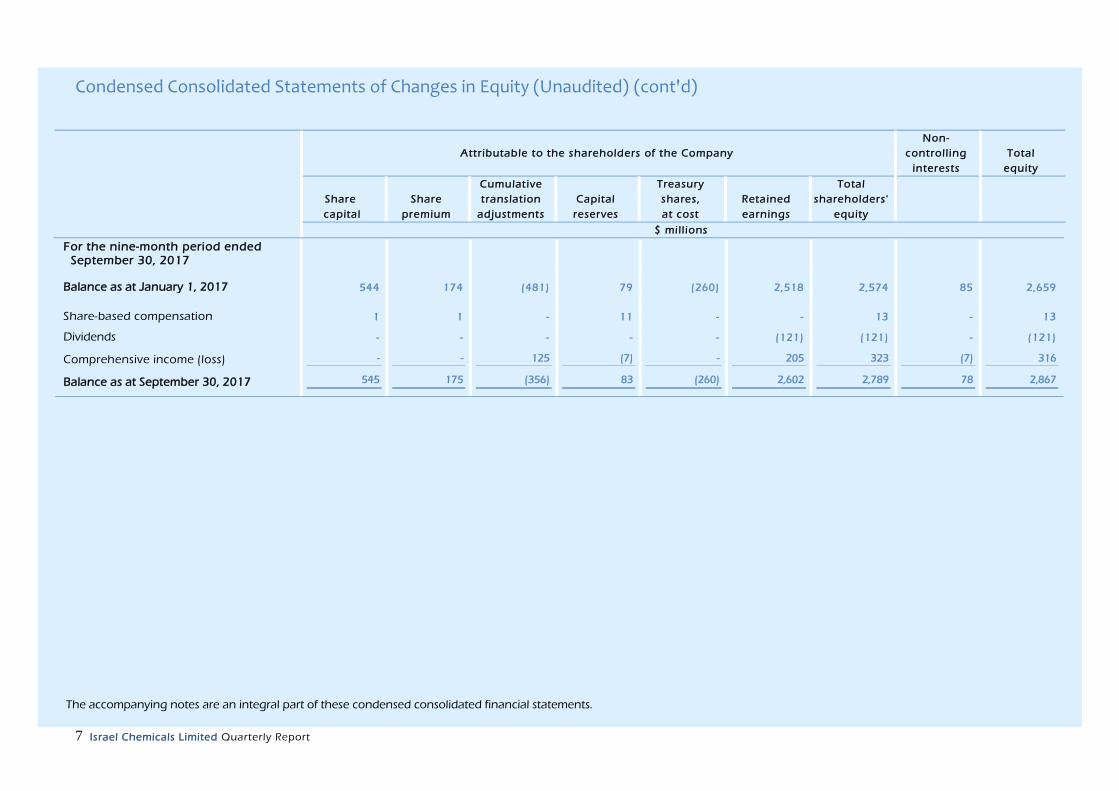
Condensed Consolidated Statements of Changes in Equity (Unaudited) (cont'd)
Attributable to the shareholders of the Company
Non-
control l ing Total
interests equity
Cumulat ive Treasury Total
Share Share translation Capital shares, Retained shareholders '
capital premium adjustments reserves at cost earnings equity
$ mil l ions
For the nine-month period ended September 30, 2017
Balance as at January 1, 2017 544 174 (481) 79 (260) 2,518 2,574 85 2,659
Share-based compensation 1 1 - 11 - - 13 - 13
Dividends - - - - - (121) (121) - (121)
Comprehensive income (loss) - - 125 (7) - 205 323 (7) 316
Balance as at September 30, 2017 545 175 (356) 83 (260) 2,602 2,789 78 2,867
The accompanying notes are an integral part of these condensed consolidated financial statements.

8 Israel Chemicals Limited Quarterly Report
Condensed Consolidated Statements of Changes in Equity (Unaudited) (cont'd)
Attributable to the shareholders of the Company
Non-
control l ing Total
interests equity
Cumulat ive Treasury Total
Share Share translation Capital shares, Retained shareholders '
capital premium adjustments reserves at cost earnings equity
$ mil l ions
For the nine-month period ended September 30, 2016
Balance as at January 1, 2016 544 149 (400) 93 (260) 2,902 3,028 160 3,188
Share-based compensation - * 3 - 9 - - 12 - 12
Dividends - - - - - (162) (162) (2) (164)
Changes in equity of equity-accounted
investees - - - (15) - - (15) - (15)
Non-controlling interests in business
combinations from prior periods - - - - - - - (12) (12)
Comprehensive loss - - - (12) - (237) (249) (27) (276)
Balance as at September 30, 2016 544 152 (400) 75 (260) 2,503 2,614 119 2,733
* Less than $1 million.
The accompanying notes are an integral part of these condensed consolidated financial statements.
9 Israel Chemicals Limited Quarterly Report
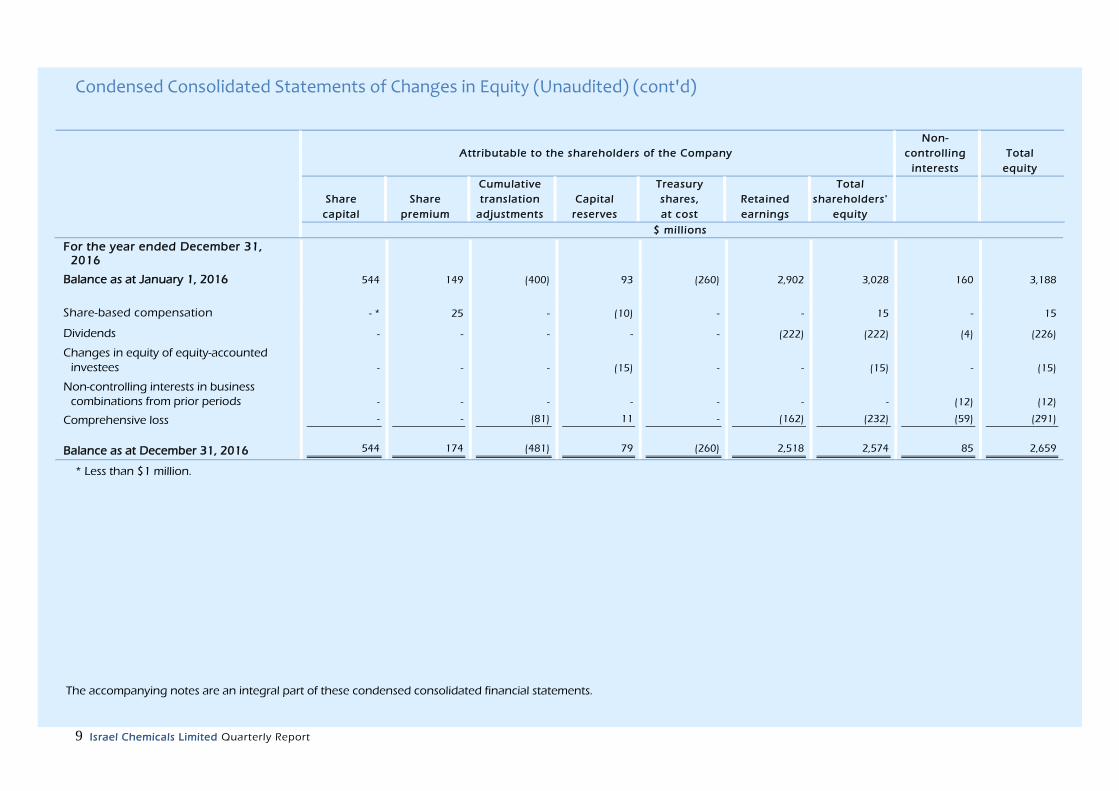
Condensed Consolidated Statements of Changes in Equity (Unaudited) (cont'd)
Attributable to the shareholders of the Company
Non-
control l ing Total
interests equity
Cumulat ive Treasury Total
Share Share translation Capital shares, Retained shareholders '
capital premium adjustments reserves at cost earnings equity
$ mil l ions
For the year ended December 31, 2016
Balance as at January 1, 2016 544 149 (400) 93 (260) 2,902 3,028 160 3,188
Share-based compensation - * 25 - (10) - - 15 - 15
Dividends - - - - - (222) (222) (4) (226)
Changes in equity of equity-accounted
investees - - - (15) - - (15) - (15)
Non-controlling interests in business
combinations from prior periods - - - - - - - (12) (12)
Comprehensive loss - - (81) 11 - (162) (232) (59) (291)
Balance as at December 31, 2016 544 174 (481) 79 (260) 2,518 2,574 85 2,659
* Less than $1 million.
The accompanying notes are an integral part of these condensed consolidated financial statements.
Notes to the condensed consolidated interim financial statements as at September 30, 2017 (Unaudited)
10 Israel Chemicals Limited Quarterly Report
Note 1 – The Reporting Entity
Israel Chemicals Ltd. (hereinafter – the Company or ICL), is a leading global specialty minerals
group that operates a unique, integrated business model.
ICL is a global manufacturer of products based on specialty minerals that fulfill humanity’s
essential needs in three primary markets: agriculture, food and engineered materials, by utilizing a
unique, integrated business model.
The agricultural products produced by ICL help to feed the world’s growing population. The
potash and phosphates ICL mines and manufactures are used as ingredients in fertilizers and serve
as an essential component in the pharmaceutical and food additives industries. ICL’s bromine-
based and phosphorous-based applications allow the safe and widespread use of a variety of
products and materials, help to create energy that is more efficient and environmentally friendly
and prevent the spread of forest fires. The food additives that ICL produces enable greater access
to more varied and higher quality food.
ICL is a company domiciled and incorporated in Israel, the shares of which are traded on the
Tel-Aviv Stock Exchange in Israel and on the New York Stock Exchange (“NYSE”) in the United
States. The Company’s main shareholder is Israel Corporation Ltd.
Note 2 – Significant Accounting Policies
Basis of Preparation The Company's financial statements are prepared in accordance with International Financial
Reporting Standards (“IFRS”) as issued by the International Accounting Standards Board (IASB)
and the Company uses IFRS as its generally accepted accounting principles (“GAAP”).
The condensed consolidated interim financial statements were prepared in accordance with
IAS 34, “Interim Financial Reporting” and do not include all the information required in complete,
annual financial statements. These condensed consolidated interim financial statements and notes
are unaudited and should be read together with the Company's audited financial statements
included in its Annual Report on Form 20-F as at and for the year ended December 31, 2016
(hereinafter – the Annual Financial Statements), as filed with the Securities and Exchange
Commission ("SEC").
The accounting policies and assumptions used in preparation of these condensed consolidated
interim financial statements are consistent with those used in preparation of the Company's
Annual Financial Statements and in the Company's opinion include all the adjustments necessary
to fairly present such information. Interim results are not necessarily indicative of the Company's
expected results for the entire year.
Notes to the condensed consolidated interim financial statements as at September 30, 2017 (Unaudited)
11 Israel Chemicals Limited Quarterly Report
Note 3 - Operating Segments
A. General 1. Information on operating segments:
ICL is a leading global specialty minerals company that operates a unique integrated business
model. The Company operates via two segments: the Essential Minerals Segment and the Specialty
Solutions Segment, which constitute the Company’s strategic business segments.
Essential Minerals Segment – This segment includes three business lines: ICL Potash & Magnesium,
ICL Phosphate and, since January 2017, also ICL Specialty Fertilizers. The comparative data has
been restated in order to reflect the change. The segment targets the Agro market and focuses on
efficiency, process innovation and operational excellence , in order to improve the competitive
position.
ICL Potash & Magnesium – ICL Potash & Magnesium extracts potash from the Dead Sea and
mines and produces potash and salt from subterranean mines in Spain and the UK. ICL Potash
& Magnesium processes the potash into its types and markets it globally and also carries on
other intercompany operations not solely related to the potash activities. The Company also
mines and produces polysulphate (also known as polyhalite) in a subterranean mine in the UK.
The magnesium business markets and sells pure magnesium and magnesium alloys, and also
produces dry carnallite and related by-products, including chlorine and sylvinite.
ICL Phosphate – ICL Phosphate mines and processes phosphate rock from open pit mines –
three of which are located in the Negev Desert in Israel while the fourth is situated in the
Yunnan province in China. In addition, ICL Phosphate produces sulfuric acid, agricultural
phosphoric acid and phosphate fertilizers in its facilities in Israel, China and Europe.
Furthermore, ICL Phosphate manufactures phosphate-based food additives for livestock in
Turkey. ICL Phosphate markets its products worldwide, mainly in Europe, Brazil, India and
China.
ICL Specialty Fertilizers – ICL Specialty Fertilizers produces specialty fertilizers (e.g., water
soluble) in the Netherlands and Belgium, liquid fertilizers and soluble fertilizers in Israel and
Spain and controlled-release fertilizers in the Netherlands and the United States. ICL Specialty
Fertilizers markets its products worldwide, mainly in Europe, North A merica and Israel.
Specialty Solutions Segment – This segment includes three business lines: ICL Industrial Products,
ICL Advanced Additives and ICL Food Specialties. The segment targets industrial markets and
concentrates on achieving growth through a highly-tailored customer focus, product innovation
and commercial excellence.
ICL Industrial Products – ICL Industrial Products produces bromine out of a solution that is
created as a by-product of the potash production process in Sodom, Israel, as well a s
bromine-based compounds. ICL Industrial Products uses most of the bromine it produces for
self-production of bromine compounds at production sites in Israel, the Netherlands and China.
In addition, ICL Industrial Products extracts from the Dead Sea potas sium, salt, magnesium
chloride and magnesia products used in the pharma, specialty steel, oil drilling, and oil
additives industries, along with de-icing and other applications. In addition, ICL Industrial
Products is engaged in the production and marketing of phosphorous-based flame retardants
and additional phosphorus-based products.
Notes to the condensed consolidated interim financial statements as at September 30, 2017 (Unaudited)
12 Israel Chemicals Limited Quarterly Report
Note 3 - Operating Segments (cont’d)
A. General (cont’d)
1. Information on operating segments: (cont'd)
ICL Advanced Additives – ICL Advanced Additives primarily develops, produces, markets and
sells a broad range of acids and specialty phosphates for various applications in a large
number of industries, including metal and water treatment, paints and coatings, forest fire
retardants, cleaning materials, oral hygiene, carbonated drinks, asphalt modification and fuel
additives. The diverse products and market base support and are consistent with the
Company’s strategy of increasing production of downstream products with higher added
value. ICL Advanced Additives purifies some of the agricultural phosphoric acid manufactured
by ICL Phosphate and also manufactures thermal phosphoric acid. The purified phosphoric acid
and the thermal phosphoric acid are used to manufacture downstream product s with high
added value – phosphate salts and acids – which are used in the various industries mentioned
above.
ICL Food Specialties – ICL Food Specialties is a leader in developing and producing functional
food ingredients and phosphate additives , which provide texture and stability solutions for the
processed meat, fish, dairy, beverage and baked-goods markets. In addition, the business line
produces milk proteins and whey proteins for the food ingredient industry and provides
blended, integrated solutions based on dairy proteins and phosphate additives . The business
line operates primary production locations in Germany and Austria, which mainly process
phosphates, milk and spices, and runs several local blending facilities in Germany, the UK, the
United States, Brazil, China and Australia, enabling the production of "customer specific"
solutions that meet the requirements of the local market .
2. Segment capital investments
The capital investments made by the segments, for each of the reporting periods, include mainly
property, plant and equipment and intangible assets acquired in the ordinary course of business
and as part of business combinations.
3. Inter–segment transfers and unallocated income (expenses)
Segment revenues, expenses and results include inter-segment transfers, which are priced based
on transaction prices in the ordinary course of business. These transfers are eliminated as part of
consolidation of the financial statements. The segment income is measured based on the
operating income, without certain expenses that are not allocated to the operating segments
including general and administrative expenses, as it is included in reports that are regularly
reviewed by the chief operating decision maker.
Notes to the condensed consolidated interim financial statements as at September 30, 2017 (Unaudited)
13 Israel Chemicals Limited Quarterly Report
Note 3 - Operating Segments (cont’d)
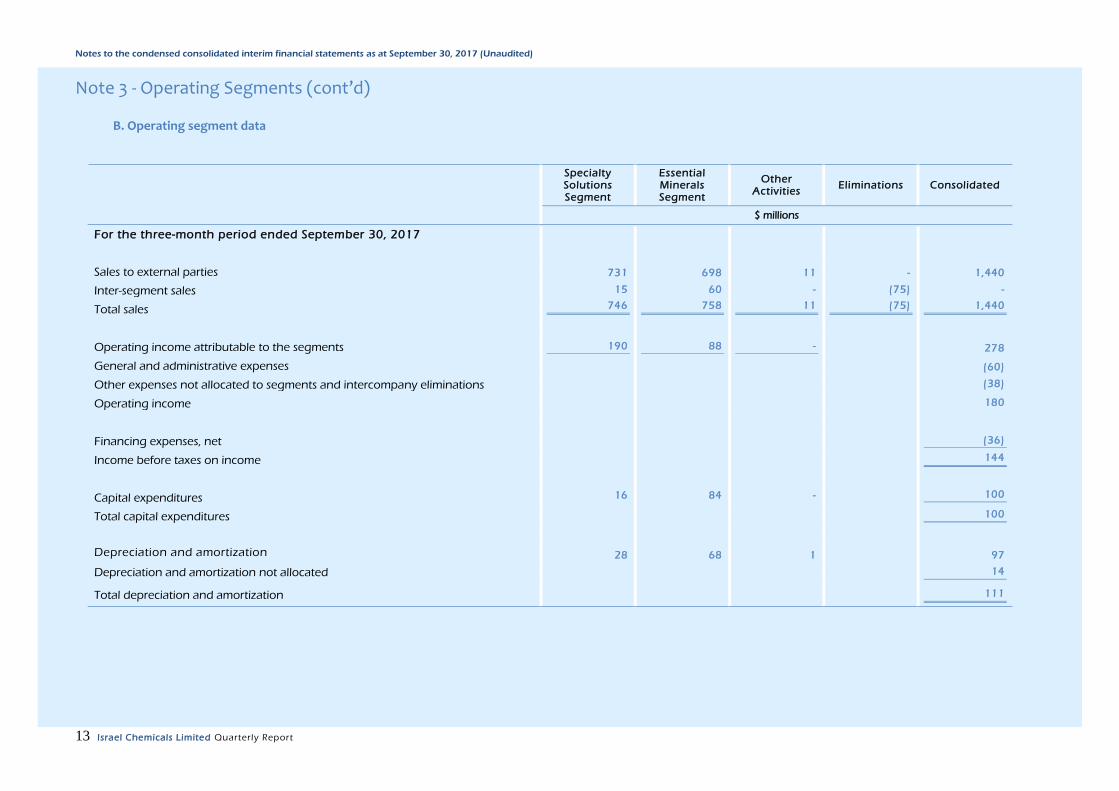
B. Operating segment data
Specialty Solutions Segment
Essential Minerals Segment
Other Activities
Eliminations Consolidated
$ millions
For the three-month period ended September 30, 2017
Sales to external parties 731 698 11 - 1,440
Inter-segment sales 15 60 - (75) -
Total sales 746 758 11 (75) 1,440
Operating income attributable to the segments 190 88 - 278
General and administrative expenses (60)
Other expenses not allocated to segments and intercompany eliminations (38)
Operating income 180
Financing expenses, net
(36)
Income before taxes on income 144
Capital expenditures 16 84 - 100
Total capital expenditures 100
Depreciation and amortization 28 68 1 97
Depreciation and amortization not allocated 14
Total depreciation and amortization 111

Notes to the condensed consolidated interim financial statements as at September 30, 2017 (Unaudited)
14 Israel Chemicals Limited Quarterly Report
Note 3 - Operating Segment (cont'd)
B. Operating segment data (cont'd)
Specialty Solutions Segment
Essential Minerals Segment
Other Activities
Eliminations Consolidated
$ millions
For the three-month period ended September 30, 2016
Sales to external parties 682 691 10 - 1,383
Inter-segment sales 19 57 1 (77) -
Total sales 701 748 11 (77) 1,383
Operating income attributable to the segments 171 89 5 265
General and administrative expenses (80)
Other expenses not allocated to segments and intercompany eliminations (516)
Operating loss (331)
Financing expenses, net (45)
Share in earnings of equity-accounted investee 7
Loss before taxes on income (369)
Capital expenditures 16 121 - 137
Capital expenditures not allocated 20
Total capital expenditures 157
Depreciation and amortization 28 80 2 110
Depreciation and amortization not allocated 3
Total depreciation and amortization 113

Notes to the condensed consolidated interim financial statements as at September 30, 2017 (Unaudited)
15 Israel Chemicals Limited Quarterly Report
Note 3 - Operating Segment (cont'd)
B. Operating segment data (cont'd)
Specialty Solutions Segment
Essential Minerals Segment
Other Activities
Eliminations Consolidated
$ millions
For the nine-month period ended September 30, 2017
Sales to external parties 1,955 2,071 31 - 4,057
Inter-segment sales 44 157 2 (203) -
Total sales 1,999 2,228 33 (203) 4,057
Operating income attributable to the segments 440 235 1 676
General and administrative expenses (191)
Other expenses not allocated to segments and intercompany eliminations (45)
Operating income 440
Financing expenses, net
(99)
Share in earnings of equity-accounted investee 2
Income before taxes on income 343
Capital expenditures 46 271 1 318
Capital expenditures not allocated 3
Total capital expenditures 321
Depreciation and amortization 83 199 2 284
Depreciation and amortization not allocated 16
Total depreciation and amortization 300
Notes to the condensed consolidated interim financial statements as at September 30, 2017 (Unaudited)
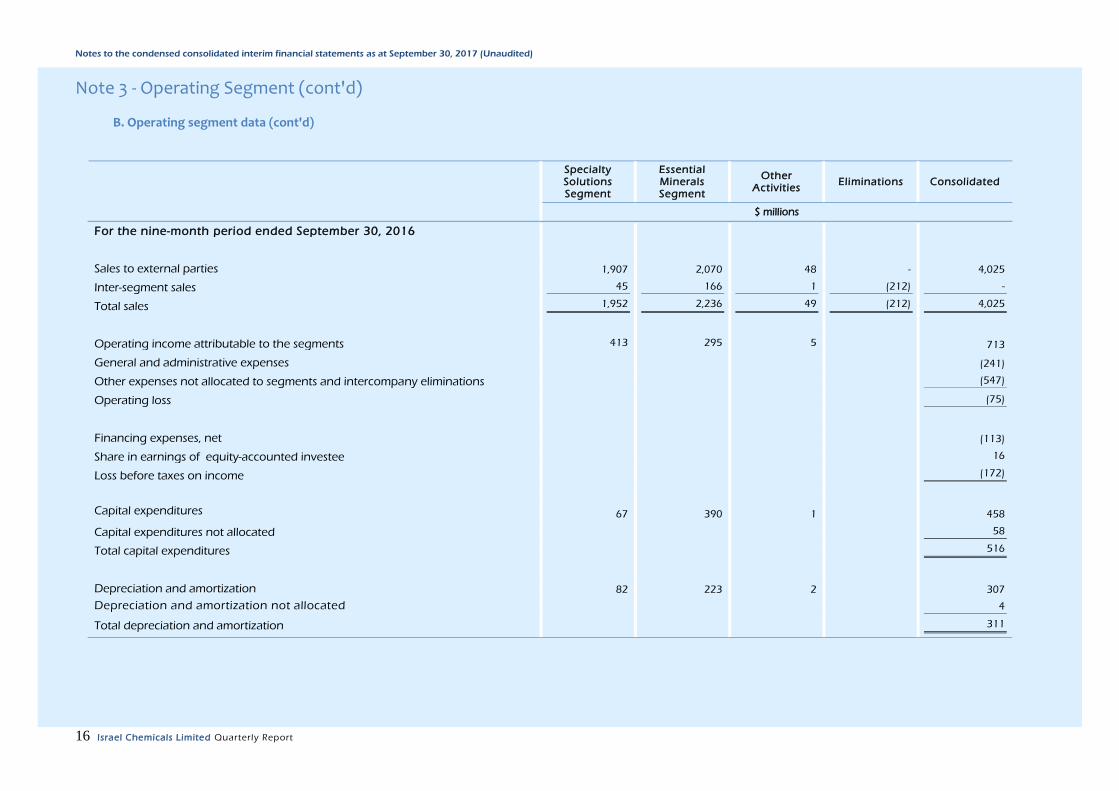
16 Israel Chemicals Limited Quarterly Report
Note 3 - Operating Segment (cont'd)
B. Operating segment data (cont'd)
Specialty Solutions Segment
Essential Minerals Segment
Other Activities
Eliminations Consolidated
$ millions
For the nine-month period ended September 30, 2016
Sales to external parties 1,907 2,070 48 - 4,025
Inter-segment sales 45 166 1 (212) -
Total sales 1,952 2,236 49 (212) 4,025
Operating income attributable to the segments 413 295 5 713
General and administrative expenses (241)
Other expenses not allocated to segments and intercompany eliminations (547)
Operating loss (75)
Financing expenses, net (113)
Share in earnings of equity-accounted investee 16
Loss before taxes on income (172)
Capital expenditures 67 390 1 458
Capital expenditures not allocated 58
Total capital expenditures 516
Depreciation and amortization 82 223 2 307
Depreciation and amortization not allocated 4
Total depreciation and amortization 311
Notes to the condensed consolidated interim financial statements as at September 30, 2017 (Unaudited)
17 Israel Chemicals Limited Quarterly Report
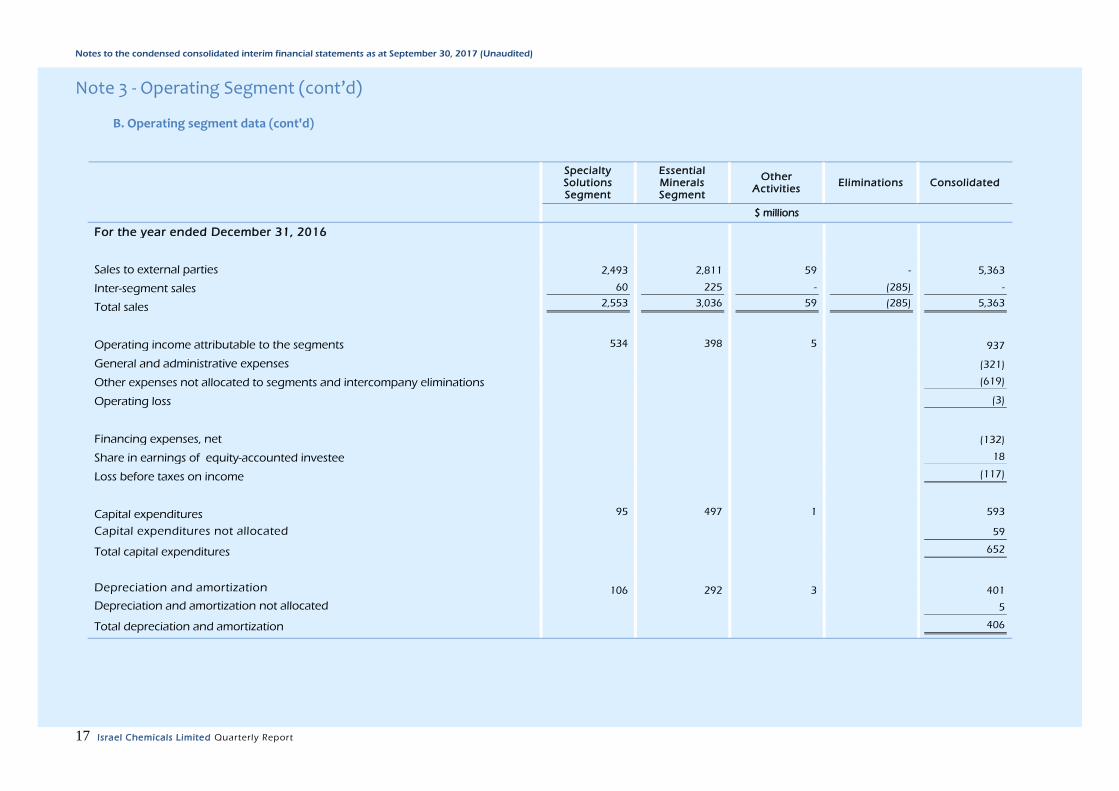
Note 3 - Operating Segment (cont’d) B. Operating segment data (cont'd)
Specialty Solutions Segment
Essential Minerals Segment
Other Activities
Eliminations Consolidated
$ millions
For the year ended December 31, 2016
Sales to external parties 2,493 2,811 59 - 5,363
Inter-segment sales 60 225 - (285) -
Total sales 2,553 3,036 59 (285) 5,363
Operating income attributable to the segments 534 398 5 937
General and administrative expenses (321)
Other expenses not allocated to segments and intercompany eliminations (619)
Operating loss (3)
Financing expenses, net
(132)
Share in earnings of equity-accounted investee 18
Loss before taxes on income (117)
Capital expenditures 95 497 1 593
Capital expenditures not allocated 59
Total capital expenditures 652
Depreciation and amortization 106 292 3 401
Depreciation and amortization not allocated 5
Total depreciation and amortization 406
Notes to the condensed consolidated interim financial statements as at September 30, 2017 (Unaudited)
18 Israel Chemicals Limited Quarterly Report
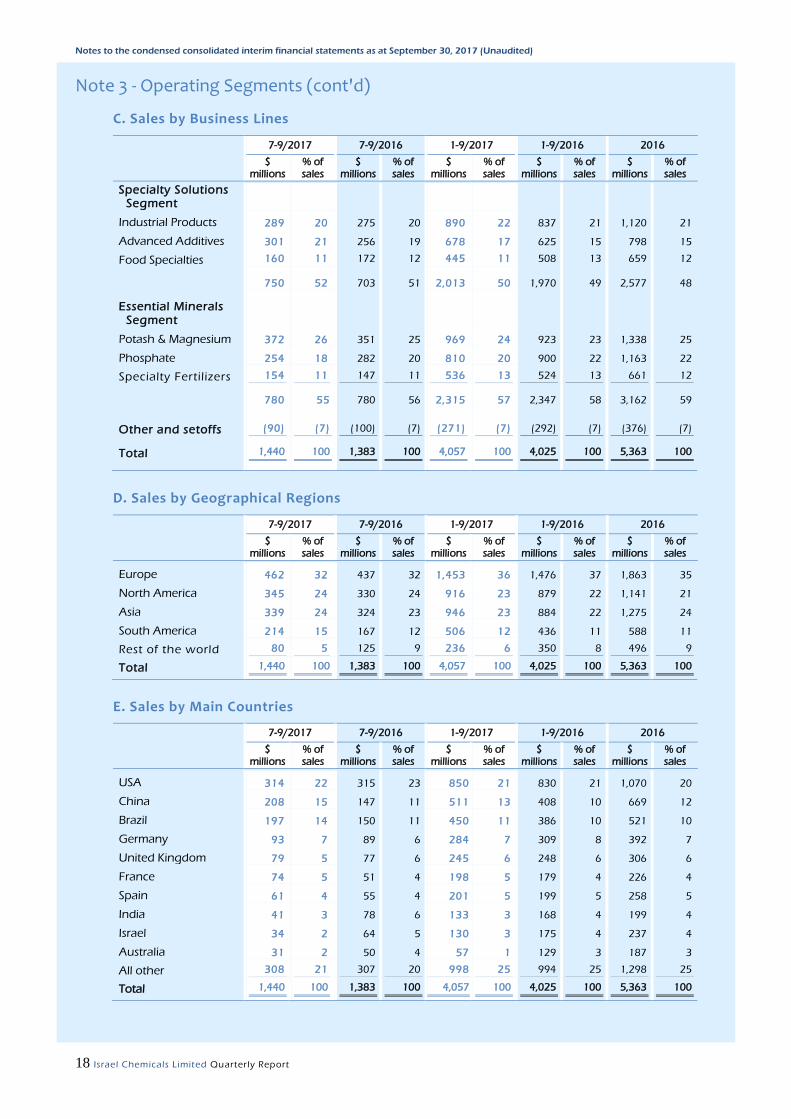
Note 3 - Operating Segments (cont'd)
C. Sales by Business Lines
7-9/2017 7-9/2016 1-9/2017 1-9/2016 2016
$
millions % of sales
$ millions
% of sales
$ millions
% of sales
$ millions
% of sales
$ millions
% of sales
Specialty Solutions Segment
Industrial Products 289 20 275 20 890 22 837 21 1,120 21
Advanced Additives 301 21 256 19 678 17 625 15 798 15
Food Specialties 160 11 172 12 445 11 508 13 659 12
750 52 703 51 2,013 50 1,970 49 2,577 48
Essential Minerals Segment
Potash & Magnesium 372 26 351 25 969 24 923 23 1,338 25
Phosphate 254 18 282 20 810 20 900 22 1,163 22
Specialty Fertilizers 154 11 147 11 536 13 524 13 661 12
780 55 780 56 2,315 57 2,347 58 3,162 59
Other and setoffs (90) (7) (100) (7) (271) (7) (292) (7) (376) (7)
Total 1,440 100 1,383 100 4,057 100 4,025 100 5,363 100
D. Sales by Geographical Regions
7-9/2017 7-9/2016 1-9/2017 1-9/2016 2016
$
millions % of sales
$ millions
% of sales
$ millions
% of sales
$ millions
% of sales
$ millions
% of sales
Europe 462 32 437 32 1,453 36 1,476 37 1,863 35
North America 345 24 330 24 916 23 879 22 1,141 21
Asia 339 24 324 23 946 23 884 22 1,275 24
South America 214 15 167 12 506 12 436 11 588 11
Rest of the world 80 5 125 9 236 6 350 8 496 9
Total 1,440 100 1,383 100 4,057 100 4,025 100 5,363 100
E. Sales by Main Countries
7-9/2017 7-9/2016 1-9/2017 1-9/2016 2016
$
millions % of sales
$ millions
% of sales
$ millions
% of sales
$ millions
% of sales
$ millions
% of sales
USA 314 22 315 23 850 21 830 21 1,070 20
China 208 15 147 11 511 13 408 10 669 12
Brazil 197 14 150 11 450 11 386 10 521 10
Germany 93 7 89 6 284 7 309 8 392 7
United Kingdom 79 5 77 6 245 6 248 6 306 6
France 74 5 51 4 198 5 179 4 226 4
Spain 61 4 55 4 201 5 199 5 258 5
India 41 3 78 6 133 3 168 4 199 4
Israel 34 2 64 5 130 3 175 4 237 4
Australia 31 2 50 4 57 1 129 3 187 3
All other 308 21 307 20 998 25 994 25 1,298 25
Total 1,440 100 1,383 100 4,057 100 4,025 100 5,363 100

Notes to the condensed consolidated interim financial statements as at September 30, 2017 (Unaudited)
19 Israel Chemicals Limited Quarterly Report
Note 4 - Financial Instruments and Risk Management
A. Fair value of financial instruments
The carrying amounts of certain financial assets and financial liabilities, including cash and cash
equivalents, investments, short-term deposits and loans, receivables and other debit balances,
long-term investments and receivables, short-term credit, payables and other credit balances,
long-term loans bearing variable interest and other liabilities, and derivative financial instruments,
correspond to or approximate their fair value.
The following table details the book value and fair value of financial instrument groups presented
in the financial statements not in accordance with their fair value:
September 30, 2017 September 30, 2016 December 31, 2016
Carrying amount Fair value
Carrying amount Fair value
Carrying amount Fair value
$ m i l l i o n s $ m i l l i o n s $ m i l l i o n s $ m i l l i o n s $ m i l l i o n s $ m i l l i o n s
Loans bearing fixed interest 287 296 345 360 293 306
Debentures bearing fixed interest
Marketable 1,250 1,294 1,216 1,215 1,201 1,201
Non-marketable 278 287 278 277 281 283
1,815 1,877 1,839 1,852 1,775 1,790
B. Fair value hierarchy
The following table presents an analysis of the financial instruments measured at fair value, using
a valuation method in accordance with the fair value levels in the hierarchy.
Levels definitions:
Level 1: Quoted (unadjusted) prices in an active market for identical instruments.
Level 2: Observed data in the market (directly or indirectly) not included in Level 1 above.
Level 3: Inputs that are not based on observable market data.
September 30, 2017
Level 2 Level 3 Total
$ millions $ millions $ millions
Financial assets available for sale (1) - 253 253
Derivatives used for economic hedging, net 51 - 51
51 253 304
September 30, 2016
Level 1 Level 2 Level 3 Total
$ millions $ millions $ millions $ millions
Securities held for trading purposes 14 - - 14
Financial assets available for sale (1) - - 235 235
Derivatives used for economic hedging, net - (1) - (1)
14 (1) 235 248
Notes to the condensed consolidated interim financial statements as at September 30, 2017 (Unaudited)
20 Israel Chemicals Limited Quarterly Report
Note 4 - Financial Instruments and Risk Management (cont'd)
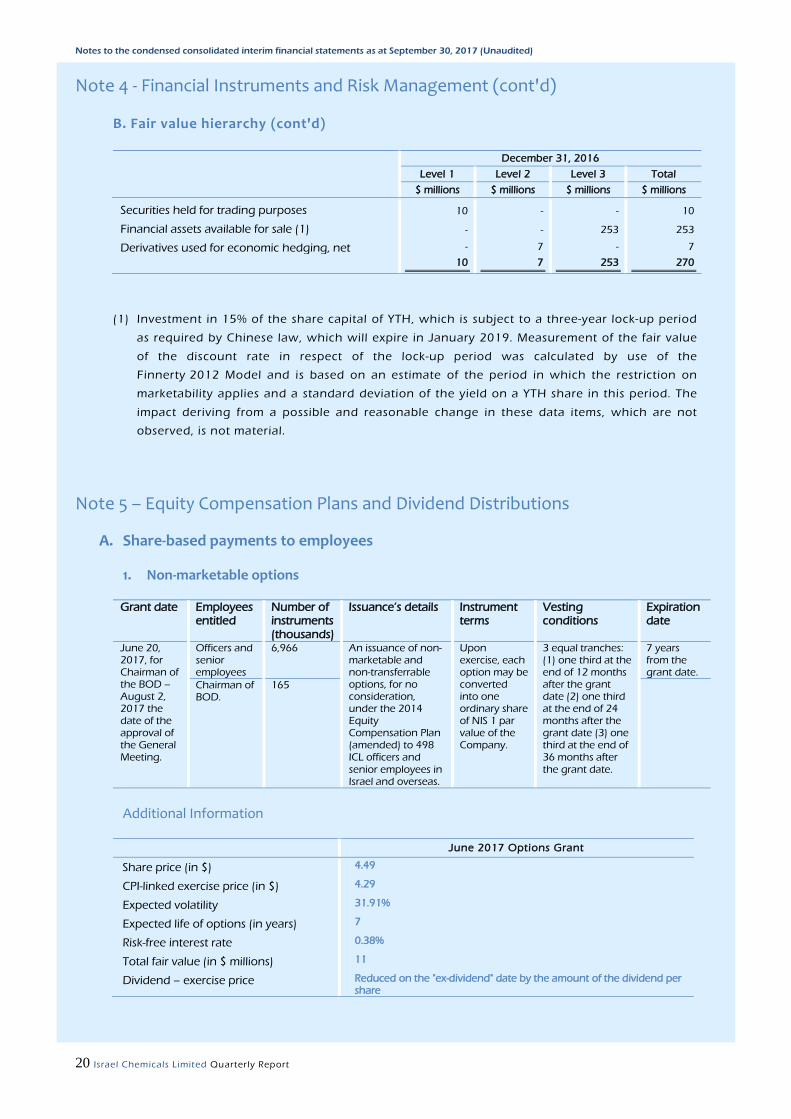
B. Fair value hierarchy (cont'd)
December 31, 2016
Level 1 Level 2 Level 3 Total
$ millions $ millions $ millions $ millions
Securities held for trading purposes 10 - - 10
Financial assets available for sale (1) - - 253 253
Derivatives used for economic hedging, net - 7 - 7
10 7 253 270
(1) Investment in 15% of the share capital of YTH, which is subject to a three-year lock-up period
as required by Chinese law, which will expire in January 2019. Measurement of the fair value
of the discount rate in respect of the lock-up period was calculated by use of the
Finnerty 2012 Model and is based on an estimate of the period in which the restriction on
marketability applies and a standard deviation of the yield on a YTH share in this period. The
impact deriving from a possible and reasonable change in these data items, which are not
observed, is not material.
Note 5 – Equity Compensation Plans and Dividend Distributions
A. Share-based payments to employees
1. Non-marketable options
Grant date Employees entitled
Number of instruments (thousands)
Issuance’s details Instrument terms
Vesting conditions
Expiration date
June 20, 2017, for Chairman of the BOD – August 2, 2017 the date of the approval of the General Meeting.
Officers and senior employees
6,966 An issuance of non-marketable and non-transferrable options, for no consideration, under the 2014 Equity Compensation Plan (amended) to 498 ICL officers and senior employees in Israel and overseas.
Upon exercise, each option may be converted into one ordinary share of NIS 1 par value of the Company.
3 equal tranches: (1) one third at the end of 12 months after the grant date (2) one third at the end of 24 months after the grant date (3) one third at the end of 36 months after the grant date.
7 years from the grant date.
Chairman of BOD.
165
Additional Information
June 2017 Options Grant
Share price (in $) 4.49
CPI-linked exercise price (in $) 4.29
Expected volatility 31.91%
Expected life of options (in years) 7
Risk-free interest rate 0.38%
Total fair value (in $ millions) 11
Dividend – exercise price Reduced on the "ex-dividend" date by the amount of the dividend per share

Notes to the condensed consolidated interim financial statements as at September 30, 2017 (Unaudited)
21 Israel Chemicals Limited Quarterly Report
Note 5 – Equity Compensation Plans and Dividend Distributions (cont’d)
A. Share-based payments to employees (cont’d)
1. Non-marketable options (cont’d)
The options issued to the employees in Israel are covered by the provisions of Section 102 of the
Israeli Income Tax Ordinance. The issuance will be performed through a tru stee under the
Capital Gains Track. The fair value of the options was estimated using the Black & Scholes model
for pricing options. The exercise price is linked to the CPI that is known as of the date of
payment, which is the exercise date. In a case of distribution of a dividend by the Company, the
exercise price is reduced on the “ex dividend” date, by the amount of the dividend per share,
based on the amount thereof in NIS on the effective date.
The expected volatility was determined on the basis of the historical volatility of the Company’s
share prices. The expected life of the options was determined on the basis of Management’s
estimate of the period the employees will hold the options, taking into consideration their
position with the Company and the Company’s past experience regarding employee turnover.
The risk-free interest rate was determined on the basis of the yield to maturity of
shekel-denominated Israeli Government debentures, with a remaining life equal to the
anticipated life of the options.
The cost of the embedded benefits of the said plans will be recognized in the income statements
over the vesting period of each tranche taking into account also the Company’s policy relating
to “Rule 75” (accelerated vesting period for employees which their age plus their years of
employments in the Company exceed 75).
2. Restricted shares
Grant date Employees entitled
Number of instruments (thousands)
Vesting conditions Instrument terms
Additional Information
Fair value at the grant date ($ millions)
June 20, 2017, for Chairman of the BOD – August 2, 2017 the date of the approval of the General Meeting.
Officers and Senior employees
2,233 3 equal tranches: (1) one third at the end of 12 months after the grant date (2) one third at the end of 24 months after the grant date (3) one third at the end of 36 months after the grant date.
An issuance for no consideration, under the 2014 Equity Compensation Plan (amended)
The value of the restricted shares was determined according to the closing price on the TASE on the most recent trading day preceding the grant date (the approval date of the BOD/General meeting)
10
Chairman of BOD.
53 0.3
B. Dividend Distributions
Decision date for dividend distribution by the
Board of Directors
Actual date of dividend
distribution Distributed
amount
($ millions)
Dividend per
share ($)
November 22, 2016 January 4, 2017 60 0.04701
February 14, 2017 April 4, 2017 57 0.04400
May 9, 2017 June 20, 2017 34 0.02600
August 2, 2017 September 13, 2017 32 0.02450
November 7, 2017 (after the date of the report)*
December 20, 2017 57 0.04400
(*) The dividend will be distributed on December 20, 2017, with a record date for eligibility for
the dividend of December 5, 2017.

Notes to the condensed consolidated interim financial statements as at September 30, 2017 (Unaudited)
22 Israel Chemicals Limited Quarterly Report
Note 6 – Provisions, Contingencies and Other Matters
1. On June 30, 2017, there was a partial collapse of the dyke in Pond 3 in the plants of Rotem Amfert
Israel, which is used for accumulation of phosphogypsum water that is created as a by -product of
the production processes. The Company ceased immediately use of the active phosphogypsum
ponds. On July 3, 2017, the Company returned to production at full capacity under a temporary
approval to activate Pond 4 by the Ministry of Environmental Protection. The Company was
instructed by the Ministry of Environmental Protection to submit a plan within the next few months
relating to the future operation of the phosphogypsum water ponds. The Ministry of
Environmental Protection and additional Israeli authorities have commenced examinations for
investigation of the event.
The Company is taking action to explore solutions for, among other things, restoration of the
ponds in the short-term and long-term and rectification of any environmental impacts caused, to
the extent required. The Company’s actions are being carried out in full coordination and close
cooperation with the Israeli environmental authorities, including the Ministry of Environmental
Protection and the Nature and National Parks Authority. The Company is committed to the matter
of environmental protection, and for years has worked closely with the Israeli environmental
protection authorities to maintain the Negev’s natural reserves in the area of its facilities.
In light of the preliminary stages of the process of estimating the costs relating to restoration of the
stream and obtaining the permanent permits for operating the gypsum pond or other ponds, and
taking into account the complexity of the process and the uncertainty regarding the final
restoration plans and the terms of the building permits to be determined by the relevant
authorities, the Company is unable at this stage to estimate the expected costs of the restoration
work and obtaining the permits, as stated. Nevertheless, the Company recorded a provision, in an
immaterial amount, which reflects the expenses that are expected to be incurred in the short term.
The Company is in contact with its insurance carriers with reference to the relevant insurance
policies regarding the matters described above.
2. In July and August 2017, three applications for certification of claims as class actions were filed
against the Company, as a result of a partial collapse of the dyke in the evaporation pond of Rotem
Amfert Israel, which caused contamination of the Ashalim Stream and its surrounding area. The
requesting parties contend that the Company breached various provisions of the environmental
laws, including, the provisions of the Law for Prevention of Environmental Hazards, the Water Law
as well as provisions of the Torts Ordinance, breach of a statutory duty and negligence. In the
framework of the first application, the Court is requested to instruct the Company to rectify the
harm caused as a result of its omissions in order to prevent recurrence of the damage caused as
well as to grant a monetary remedy for non-pecuniary damages.
The monetary remedy was not defined, however, according to the requesting parties, the amount
of the personal claim is NIS 1,000 ($283) for each resident of the State of Israel, which totals
approximately 8.68 million persons. In the framework of the second application, the Court is
requested to grant a monetary remedy in an amount of not less than NIS 250 million ($71 million),
and concurrently to award personal compensation in the amount of NIS 2,000 ($567) for each
resident of the State of Israel, this being in respect of non-pecuniary damages. Furthermore, the
Court was requested to instruct the Company to comply with the relevant laws and the rules
provided thereunder. As part of the third application, the Court was requested to instruct the
Company, among other things, to prepare plans for removal of the pollution, restoration of the
Ashalim Stream and its surrounding area, for control and prevention of recurrence of the damage
caused, to pay monetary relief to the class of injured parties, in the amount of NIS 202.5 million
Notes to the condensed consolidated interim financial statements as at September 30, 2017 (Unaudited)
23 Israel Chemicals Limited Quarterly Report
Note 6 – Provisions, Contingencies and Other Matters (cont’d)
2. (Cont’d)
($55.9 million), and to provide compensation by means of restoring the natural values impaired
and returning the area to its former condition.
In light of the very early stage of the proceeding and the limited number of similar court cases, it is
difficult, at this stage, to predict the outcome of the applications.
3. Further to Note 20 to the Annual Financial Statements, with reference to the royalties’ arbitration
that commenced in 2011 upon filing of a statement of claim by the State, in the amount of about
$265 million, in connection with underpayment of royalties in the years 2000–2009, and pursuant
to the decisions of the arbitrators, during 2014–2016 the Company paid additional royalties of
about $170 million in respect of the years 2000–2014. In October 2017, as part of the said
arbitration proceedings, the State submitted a calculation, in the amount of about $120 million
(not including interest and linkage differences) relating to the years 2000–2014 reflecting,
according to its contention, an additional amount of underpaid royalties. The Company rejects the
calculation and in its estimation the chances the State’s calculation will be approved by the
arbitrators in full are lower than the chances it will be rejected. As at the date of the report, the
Company estimates that it has sufficient provisions in its books relating to this matter .
4. Further to Note 20 to the Annual Financial Statements, on September 1, 2017, the European
Commission determined that ICL Iberia is required to repay the amount of about $8 million
(including interest), which was granted in the past by the authorities in Spain in respect of
subsidies for the Environmental Restoration Programs. In this regard, the European Commission
determined that the amount of the guarantees relating to the environmental protection plan is less
than the amount required according to the European Commission and pursuant to the national
and regional environmental protection laws, and that such guarantees must be in the amount of
about $40 million (in place of $2 million). In light of that stated above, in the financial statements
for the third quarter of 2017, the Company recorded a provision in the amount of $8 million.
5. Further to Note 20 to the Annual Financial Statements, during July 2017, the Electricity Authority
submitted a response affidavit following which the Supreme Court sitting as the High Court of
Justice instructed that negotiations are to be carried on in contemplation of a compromise
arrangement. Negotiations, as stated, were carried on, however, since the parties did not succeed
in formulating a compromise arrangement, in September 2017, the hearing of the case was
returned to the High Court of Justice.
6. On September 5, 2017, a decision of the District Court in Beer Sheva was received regarding a
dispute between the National Company for Roads in Israel and the Company’s subsidiary Dead Sea
Works (hereinafter – “DSW”) regarding damage caused to bridges as a result of leakage of chemical
materials from DSW’s trucks during a shipment to the Eilat port, whereby the Company is to
participate in restoration of the bridges and bear responsibility for the damage, as stated, and
therefore bear a payment of about $6 million. As a result of that stated, during the third quarter of
2017 the Company recorded a provision equal to the above amount, which was recorded in the
“other expenses” category in the statement of income. On October 26, 2017, DSW filed an appeal
in the Supreme Court of the District Court’s decision, as stated.

Notes to the condensed consolidated interim financial statements as at September 30, 2017 (Unaudited)
24 Israel Chemicals Limited Quarterly Report
Note 6 – Provisions, Contingencies and Other Matters (cont’d)
7. Further to Note 20 to the Annual Financial Statements, in September 2017, DSW notified the
executing contractor of the new power station in Sodom (the Spanish company Abengoa) of
cancellation of the construction agreement (EPC) due to a series of violations of the agreement by
the executing contractor, which is experiencing financial difficulties. DSW plans to complete
construction of the power station and to bring it to full operation during the first half of 2018.
8. In September 2017, as part of an agreement of understandings for extension of the labor
agreement between the Company’s subsidiary Bromine Compounds Ltd. (hereinafter – “Bromine
Compounds”) and the Workers’ Council, Bromine Compounds undertook to pay the employees a
one-time payment of about $9 million (to be paid in installments), in exchange for a commitment
by the Workers’ Council for full and unequivocal "industrial peace" until September 30, 2019. In
case of violation of the agreement, the payments not yet made will be cancelled. As a result, in the
third quarter of 2017, the Company recorded a provision, in the amount of about $5 million. The
remaining obligation will be recognized throughout the period of the agreement, subject to
fulfillment of all the required conditions.
9. As at September 30, 2017, as a result of the findings of the geological surveys performed regarding
a new potential mining area (Greenfield) that is located adjacent to the Company's facilities in
Spain, and in light of the conditions of the potash market, the Company does not intend to
continue development of the said area. Accordingly, in the financial statements for the third
quarter of 2017, a write down was recorded, in the amount of about $14 million, representing the
full value of the asset, against the "other expenses" category in the statement of income.
10. On November 1, 2017, Standard & Poor’s Global Ratings (“S&P”) reaffirmed the Company’s
international corporate credit rating at BBB– with a stable outlook. The local rating by S&P Maalot
was also reaffirmed at ilAA with a stable outlook. The above-mentioned ratings also apply to the
Company’s debentures.
In March 2017, Fitch Ratings lowered the Company’s international corporate credit rating to BBB–
with a stable rating outlook. Fitch’s above-mentioned rating also applies to the Company’s
debentures.
11. Further to Note 20 to the Annual Financial Statements, on June 30, 2017, the Supreme Court
determined that the permit to pile up the salt in Sallent, which includes certain conditions, will be
extended by one year, up to June 30, 2018. In addition, the Court determined that before March
31, 2018, the Company will be entitled to request an extension for an additional year, up to
June 30, 2019. With respect to the extension for the second year, the Court determined that the
competent authorities are permitted to provide conditions for granting an extension as stated.
12. On June 7, 2017, the Company signed an agreement for sale of its entire holdings (50%) in IDE, for
a consideration of about $178 million, which is to be paid in cash on the closing date of the
transaction, net of transactions costs and subject to possible price adjustments deriving from the
occurrence of certain events prior to the closing of the transaction. The Company estimates that
the closing date of the transaction is expected to take place in 2017, and it is subject to fulfillment
of preconditions, including receipt of approvals from the competent authorities. In light of that
stated, during the period of the report, the Company reclassified the amount of about $122 million
from the “investments in equity-accounted investees” category to the “assets held for sale”
category.
Notes to the condensed consolidated interim financial statements as at September 30, 2017 (Unaudited)
25 Israel Chemicals Limited Quarterly Report
Note 6 – Provisions, Contingencies and Other Matters (cont’d)
13. In June 2017, the Company received an assessment from the Israeli Tax Authority whereby it is
required to pay additional tax in respect of the 2012–2014 tax years, in the amount of about $50
million. The Company disputes the assessment and is considering its further course of action. Based
on the Company’s estimation, as at the date of the report there is a sufficient provision in the
books, in an immaterial amount.
14. During the second quarter of 2017, as part of the Company’s efficiency plan, the Company signed
a five-year collective labor agreement with the Workers ’ Union of Rotem Amfert Israel, which
includes a plan for early retirement of 30 employees. As a result, in the second quarter of 2017 the
Company increased the provision of termination benefits for employees, in the amount of about
$15 million, against the “other expenses” category in the statement of income.
15. Further to Note 20 to the Annual Financial Statements, in April 2017, the National Council for
Planning and Building approved amendments to the National Outline Plan (NOP) 14B, which
includes the Barir field and transferred the plan for government approval. In addition, in March
2017, the Supreme Court sitting as the High Court of Justice rejected the petition of residents of
Arad, against the approval of the policy document of the National Council for Planning and
Building regarding the mining plan in the Barir field.
16. During March 2017, a claim was filed by Great Lakes Chemicals, a subsidiary of Chemtura
Corporation (hereinafter – "Great Lakes"), against Dead Sea Bromine Company Ltd. (hereinafter –
"DSB"), in the U.S. District Court for the Southern District of New York, in the United States. As part
of the claim, Great Lakes is claiming damages, in an amount of about $27 million, in respect of an
alleged breach of an agreement covering supply and sale of bromine and downstream bromine
products from 2003 and is requesting issuance of a declaratory order enforcing the agreement
from 2003. DSB rejects the damages claimed, including any related responsibility or obligation. The
Company estimates that the chances that Great Lakes’ alleged claims will be rejected exceed the
chances that they will be accepted.
17. Further to Note 25 to the Annual Financial Statements, during the second quarter of 2017, the
Company received short-term loans of $150 million from its controlling shareholder, Israel
Corporation Ltd. The loans were granted for a period of up to nine months and bear interest at the
annual rate of 1.51%-1.88%. In addition, the framework agreement was expanded such that Israel
Corporation Ltd. may make short-term deposits, from time to time, in dollars or in NIS, in an amount
of up to $250 million, subject to the Company’s approval. As at September 30, 2017, the balance of
the short-term loans is $150 million.
ICL Operating and Financial Review September 30, 2017
27 Israel Chemicals Limited Q3 2017 Results
OPERATING AND FINANCIAL REVIEW AND PROSPECTS FORWARD-LOOKING STATEMENTS
This announcement contains statements that constitute “forward-looking statements”, many of
which can be identified by the use of forward-looking words such as “anticipate’”, “believe”,
“could”, “expect”, “should”, “plan”, “intend”, “estimate” and “potential”, among others.
Forward-looking statements appear in a number of places in this announcement and include, but
are not limited to, statements regarding our intent, belief or current expectations.
Forward-looking statements are based on our management’s beliefs and assumptions and on
information currently available to our management. Such statements are subject to risks and
uncertainties, and the actual results may differ materially from those expressed or implied in the
forward- looking statements due to various factors, including, but not limited to :
Loss or impairment of business licenses or mining permits or concessions; volatility of supply and
demand and the impact of competition; the difference between actual reserves and our reserve
estimates; natural disasters; failure to raise the water level in evaporation Pond 5 i n the Dead Sea;
construction of a new pumping station; disruptions at our seaport shipping facilities or regulatory
restrictions affecting our ability to export our products overseas; general market, political or
economic conditions in the countries in which we operate; price increases or shortages with
respect to our principal raw materials; delays in the completion of major projects by third party
contractors and/or governmental obligations; construction of a canal between the Red Sea and
Dead Sea; labor disputes, slowdowns and strikes involving our employees; pension and health
insurance liabilities; changes to governmental programs or tax benefits, creation of new fiscal or
tax related legislation; higher tax liabilities; failure to integrate or realize expected benefits from
mergers and acquisitions, organizational restructuring and joint ventures; currency rate
fluctuations; rising interest rates; government examinations or investigations; disruption of our
information technology systems or breaches of our data security; failure to recruit or maintain key
personnel; inability to realize expected benefits from our cost reduction program according to the
expected timetable; inability to access capital markets on favorable terms; cyclicality of our
businesses; changes in demand for our fertilizer products due to a decline in agricultural product
prices, lack of available credit, weather conditions, government policies or other factors beyond
our control; decreases in demand for bromine based products and oth er industrial products;
volatility or crises in the financial markets; cost of compliance with environmental legislative and
licensing restrictions; hazards inherent to chemical manufacturing , including the impact of the
collapse of the dyke in Pond 3 in our Rotem Amfert facility; litigation, arbitration and regulatory
proceedings; insufficiency of insurance coverage; closing of transactions, mergers and
acquisitions; war or acts of terror; and other risk factors discussed under ”Item 3. Key Information —
D. Risk Factors" in the company's Annual Report on Form 20-F filed with the U.S Securities and
Exchange Commission on March 16, 2017.
Forward-looking statements speak only as of the date they are made, and we do not undertake
any obligation to update or revise them or any other information contained in this report,
whether as a result of new information, future developments or otherwise. You are advised,
however, to read any additional disclosures included in the Immediate Reports furnished by the
Company to the SEC on Form 6-K.
28 Israel Chemicals Limited Q3 2017 Results
Performance Overview Overview
We are a leading global specialty minerals company that operates a unique, integrated business
model. We extract raw materials and utilize sophisticated processing and product formulation
technologies to add value to customers in three attractive end-markets: agriculture, food and
engineered materials. Our operations are organized under two segments: the Essential Minerals
Segment and the Specialty Solutions Segment. The Essential Minerals Segment includes three
business lines: ICL Potash & Magnesium, ICL Phosphate and ICL Specialty Fertilizers. The Specialty
Solutions Segment includes three business lines: ICL Industrial Products, ICL Advanced Additives
and ICL Food Specialties.
Operating Segments
Our operations are organized under two segments: the Essential Minerals Segment and the
Specialty Solutions Segment.
Essential Minerals Segment – This segment targets the Agro markets and focuses on efficiency,
process innovation and operational excellence, in order to improve its competitive position. The
segment includes three business lines: ICL Potash & Magnesium, ICL Phosphate and , since January
2017, also ICL Specialty Fertilizers. Management believes that operating ICL Specialty Fertilizers as
part of the Essential Minerals segment is expected to create synergies given the homogenous
business and customer bases of the segment’s three business lines. Furthermore, the transfer
expands the segment’s portfolio to include a broader range of commodity, specialty and semi-
specialty products. As a result, the comparative data has been restated in order to reflect the
mentioned above change.
ICL Potash & Magnesium – ICL Potash & Magnesium extracts potash from the Dead Sea and
mines and produces potash and salt from subterranean mines in Spain and the UK. ICL P otash
& Magnesium processes the potash into its types and markets it globally and also carries on
other intercompany operations not solely related to the potash activities . The Company also
mines and produces polysulphate (also known as polyhalite) in a su bterranean mine in the UK.
The magnesium business markets and sells pure magnesium and magnesium alloys, and also
produces dry carnallite and related by-products, including chlorine and sylvinite.
ICL Phosphate – ICL Phosphate mines and processes phosphate rock from open pit mines –
three of which are located in the Negev Desert in Israel while the fourth is situated in the
Yunnan province in China. In addition, ICL Phosphate produces sulfuric acid, agricultural
phosphoric acid and phosphate fertilizers in its facilities in Israel, China and Europe.
Furthermore, ICL Phosphate manufactures phosphate-based food additives for livestock in
Turkey. ICL Phosphate markets its products worldwide, mainly in Europe, Brazil, India and
China.
ICL Specialty Fertilizers – ICL Specialty Fertilizers produces specialty fertilizers (e.g., water
soluble) in the Netherlands and Belgium, liquid fertilizers and soluble fertilizers in Israel and
Spain, and controlled-release fertilizers in the Netherlands and the United States. ICL Specialty
Fertilizers markets its products worldwide, mainly in Europe, North America and Israel.
29 Israel Chemicals Limited Q3 2017 Results
Specialty Solutions Segment – This segment targets industrial markets and concentrates on
achieving growth through a highly-tailored customer focus, product innovation and commercial
excellence. The segment includes three business lines: ICL Industrial Products, ICL Advanced
Additives and ICL Food Specialties.
ICL Industrial Products – ICL Industrial Products produces bromine out of a solution that is
created as a by-product of the potash production process in Sodom, Israel, as well as
bromine-based compounds. ICL Industrial Products uses most of the bromine it produces for
self-production of bromine compounds at production sites in Israel, the Netherlands and China.
In addition, ICL Industrial Products extracts from the Dead Sea potassium, salt, magnesium
chloride and magnesia products used in the pharma, specialty steel, oil drilling, and oil
additives industries, along with de-icing and other applications. In addition, ICL Industrial
Products is engaged in the production and marketing of phosphorous -based flame retardants
and additional phosphorus-based products.
ICL Advanced Additives – ICL Advanced Additives primarily develops, produces, markets and
sells a broad range of acids and specialty phosphates for various applications in a large
number of industries, including metal and water treatment, paints and coatings, forest fire
retardants, cleaning materials , oral hygiene, carbonated drinks, asphalt modification and fuel
additives. The diverse products and market base support and are consistent with the
Company’s strategy of increasing production of downstream products with higher added
value. ICL Advanced Additives purifies some of the agricultural phosphoric acid manufactured
by ICL Phosphate and also manufactures thermal phosphoric acid. The purified phosphoric acid
and the thermal phosphoric acid are used to manufacture downstream products with high
added value – phosphate salts and acids – which are used in the various industries mentioned
above.
ICL Food Specialties – ICL Food Specialties is a leader in developing and producing functional
food ingredients and phosphate additives, which provide texture a nd stability solutions for the
processed meat, fish, dairy, beverage and baked goods markets. In addition, the business line
produces milk proteins and whey proteins for the food ingredient industry and provides
blended, integrated solutions based on dairy proteins and phosphate additives. The business
line operates primary production locations in Germany and Austria, which mainly process
phosphates, milk and spices, and runs several local blending facilities in Germany, the UK, the
United States, Brazil, China and Australia, enabling the production of "customer specific"
solutions that meet the requirements of the local market.
30 Israel Chemicals Limited Q3 2017 Results
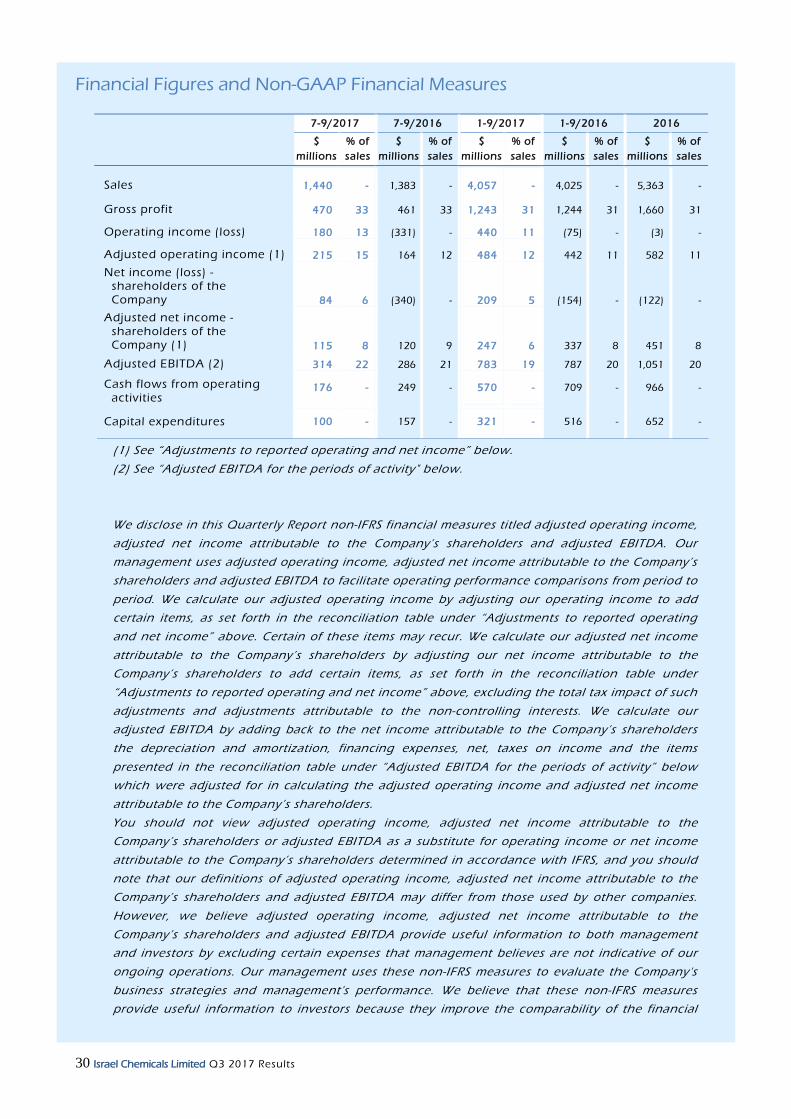
Financial Figures and Non-GAAP Financial Measures
7-9/2017 7-9/2016 1-9/2017 1-9/2016 2016
$
millions
% of
sales
$
millions
% of
sales
$
millions
% of
sales
$
millions
% of
sales
$
millions
% of
sales
(1) See “Adjustments to reported operating and net income” below.
(2) See “Adjusted EBITDA for the periods of activity" below.
We disclose in this Quarterly Report non-IFRS financial measures titled adjusted operating income,
adjusted net income attributable to the Company’s shareholders and adjusted EBITDA. Our
management uses adjusted operating income, adjusted net income attributable to the Company’s
shareholders and adjusted EBITDA to facilitate operating performance comparisons from period to
period. We calculate our adjusted operating income by adjusting our operating income to add
certain items, as set forth in the reconciliation table under “Adjustments to reported operating
and net income” above. Certain of these items may recur. We calculate our adjusted net income
attributable to the Company’s shareholders by adjusting our net income attributable to the
Company’s shareholders to add certain items, as set forth in the reconciliation table under
“Adjustments to reported operating and net income” above, excluding the total tax impact of such
adjustments and adjustments attributable to the non-controlling interests. We calculate our
adjusted EBITDA by adding back to the net income attributable to the Company’s shareholders
the depreciation and amortization, financing expenses, net, taxes on income and the items
presented in the reconciliation table under “Adjusted EBITDA for the periods of activity” below
which were adjusted for in calculating the adjusted operating income and adjusted net income
attributable to the Company’s shareholders.
You should not view adjusted operating income, adjusted net income attributable to the
Company’s shareholders or adjusted EBITDA as a substitute for operating income or net income
attributable to the Company’s shareholders determined in accordance with IFRS, and you should
note that our definitions of adjusted operating income, adjusted net income attributable to the
Company’s shareholders and adjusted EBITDA may differ from those used by other companies.
However, we believe adjusted operating income, adjusted net income attributable to the
Company’s shareholders and adjusted EBITDA provide useful information to both management
and investors by excluding certain expenses that management believes are not indicative of our
ongoing operations. Our management uses these non-IFRS measures to evaluate the Company's
business strategies and management's performance. We believe that these non-IFRS measures
provide useful information to investors because they improve the comparability of the financial
Sales 1,440 - 1,383 -
4,057 - 4,025 - 5,363 -
Gross profit 470 33 461 33
1,243 31 1,244 31 1,660 31
Operating income (loss) 180 13 (331) - 440 11 (75) - (3) -
Adjusted operating income (1) 215 15 164 12 484 12 442 11 582 11
Net income (loss) - shareholders of the Company 84 6 (340) - 209 5 (154) - (122) -
Adjusted net income - shareholders of the Company (1) 115 8 120 9 247 6 337 8 451 8
Adjusted EBITDA (2) 314 22 286 21 783 19 787 20 1,051 20
Cash flows from operating activities
176 - 249 - 570 - 709 - 966 -
Capital expenditures 100 - 157 - 321 - 516 - 652 -

31 Israel Chemicals Limited Q3 2017 Results
results between periods and provide for greater transparency of key measures used to evaluate
our performance.
We present a discussion in the period-to-period comparisons of the primary drivers of changes in
the company’s results of operations. This discussion is based in part on management’s best
estimates of the impact of the main trends in its businesses. We have based the following
discussion on our financial statements. You should read the following discussion together with
our financial statements.
Adjustments to reported operating and net income
7-9/2017 7-9/2016 1-9/2017 1-9/2016 2016
$ millions $ millions $ millions $ millions $ millions
Operating income (loss) 180 (331) 440 (75) (3)
Capital (gain) loss (1) - - (6) 1 1
Write-down and impairment of assets (2) 18 489 18 489 489
Provision for early retirement and dismissal of employees (3) - 20 15 26 39
Provision in respect of prior periods resulting from an arbitration decision (4) 6 10 6 10 13
Retroactive electricity charges (5) - (16) - (16) (16)
Provision for legal claims (6) 11 (8) 11 7 8
Provision for historical waste removal (7) - - - - 51
Total adjustments to operating income (loss) 35 495 44 517 585
Adjusted operating income 215 164 484 442 582
Net income (loss) attributable to the shareholders of the Company 84 (340) 209 (154) (122)
Total adjustments to operating income (loss) 35 495 44 517 585
Adjustments to finance expenses (8) 3 26 3 26 38
Total tax impact of the above operating income & finance expenses adjustments (7) (62) (9) (66) (81)
Tax assessment and deferred tax adjustments (9) - 1 - 14 36
Adjustments attributable to the non-controlling interests - - - - (5)
Total adjusted net income - shareholders of the Company 115 120 247 337 451
(1) Capital (gain) loss from sale of non-core businesses. In 2017, additional consideration received
regarding earn-out of 2015 divestitures.
(2) Impairment in value and write down of assets. In Q3 2017, relating to an impairment of an
intangible asset in Spain, in the amount of $14 million and the write-down of an investment in
Namibia in the amount of $4 million. In 2016, with respect to the write-down of assets (including
expected closure cost) relating to the global ERP project (Harmonization Project), in the amount of
$282 million, write down of assets relating to discontinuance of the activities of Allana Afar in
Ethiopia (including expected closure cost), in the amount of $202 million, and impairment in the
value of assets of a subsidiary in the United Kingdom, in the amount of $5 million.
(3) Provision for early retirement and dismissal of employees in accordance with the Company’s
comprehensive global efficiency plan from 2012 in its production facilities throughout the group.
In 2016, provisions relating to the Company’s facilities in Israel of the Bromine companies (see also
Q1 2016), the Company’s facilities in the United Kingdom and the Company’s facilities of the joint
venture in China (reflected also in the non-controlling interests’ adjustment below). In 2017,
provisions relating to the Company’s facilities in Israel at ICL Rotem.
(4) Provision in connection with prior periods in respect of royalties arbitration in Israel.
32 Israel Chemicals Limited Q3 2017 Results
(5) Reversal of provision in connection with prior periods in respect of costs of management services
of the electricity system in DSW and ICL Rotem.
(6) Provision for legal claims. In Q3 2017, relating to a dispute with the National Company for Roads
in Israel regarding damage caused to bridges by DSW, in the amount of $6 million, and a dispute
with the European Commission concerning past grants received by a subsidiary in Spain, in the
amount of $5 million. In 2016, mainly regarding two claims settled in 2016 related to prior periods.
In Q1 2016, deriving from the settlement agreement that ended the class action brought by the
farmers in Israel regarding potash prices, and in Q2 2016, deriving mainly from the commercial
price dispute with Haifa Chemicals which ended with the arbitration award agreement in Q3
2016.
(7) Provision for removal of waste in respect of prior periods. In 2016, purification and removal of
historical waste from the potash activities in Spain as a result of decisions made by the Spanish
authorities in connection with the plan for treating the salt pile in the Sallent site leading to plan
changes mainly related to the water pumping process involved in the salt treatment.
(8) Interest and linkage expenses in connection with the royalties arbitration and tax assessments in
Israel, and a dispute of a subsidiary in Spain with the European Commission, all relating to prior
periods. In 2017, $3 million related to a dispute with the European Commission. In 2016, $26
million in connection with the royalties arbitration and $12 million relating to a tax assessment in
Israel.
(9) Tax assessments in Israel and Belgium (see also Q1 2016) relating to prior periods.
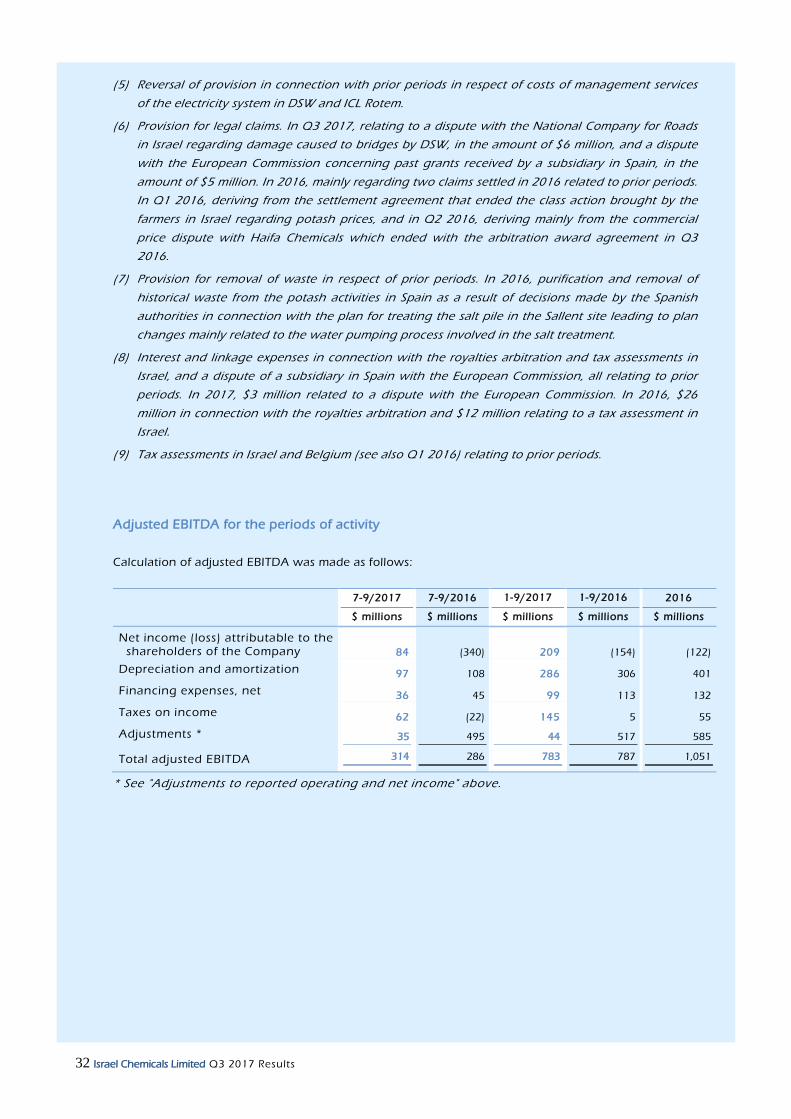
Adjusted EBITDA for the periods of activity
Calculation of adjusted EBITDA was made as follows:
7-9/2017 7-9/2016 1-9/2017 1-9/2016 2016
$ millions $ millions $ millions $ millions $ millions
Net income (loss) attributable to the shareholders of the Company 84 (340) 209 (154) (122)
Depreciation and amortization 97 108 286 306 401
Financing expenses, net 36 45 99 113 132
Taxes on income 62 (22) 145 5 55
Adjustments * 35 495 44 517 585
Total adjusted EBITDA 314 286 783 787 1,051
* See "Adjustments to reported operating and net income" above.

33 Israel Chemicals Limited Q3 2017 Results
Consolidated Results of Operations
Results of operations for the period July – September 2017
$ millions
Sales Expenses Operating
income
Q3 2016 figures 1,383 (1,714) (331)
Total adjustments Q3 2016 * - 495 495
Adjusted Q3 2016 figures 1,383 (1,219) 164
Quantity 21 (6) 15
Price 15 - 15
Exchange rate 21 (32) (11)
Raw materials - (2) (2)
Transportation - 1 1
Operating and other expenses - 33 33
Adjusted Q3 2017 figures 1,440 (1,225) 215
Total adjustments Q3 2017 * - 35 35
Q3 2017 figures 1,440 (1,260) 180
* See "Adjustments to reported operating and net income" above.
- Quantity – the increase derives mainly from fire safety products in ICL Advanced Additives and
phosphoric acid in ICL Phosphate, partly offset by a decrease in phosphate rock and
phosphate fertilizers in ICL Phosphate together with a decrease in dairy proteins in ICL Food
Specialties.
- Price – the increase derives mainly from an increase in potash selling prices together with an
increase in bromine-based products selling prices which positively affected ICL Industrial
Products.
- Exchange rate – the decrease derives mainly from the upward revaluation of the shekel and
the euro against the dollar increasing production costs, partly offset by the upward
revaluation of the euro against the dollar which increased revenue.
- Operating and other expenses – the increase derives mainly from an increase in insurance
income compared to the corresponding quarter last year, a decrease in depreciation expenses
as a result of the Company's Capex-reduction and operational cost-saving measures (including
G&A reduction) throughout the Company.
34 Israel Chemicals Limited Q3 2017 Results
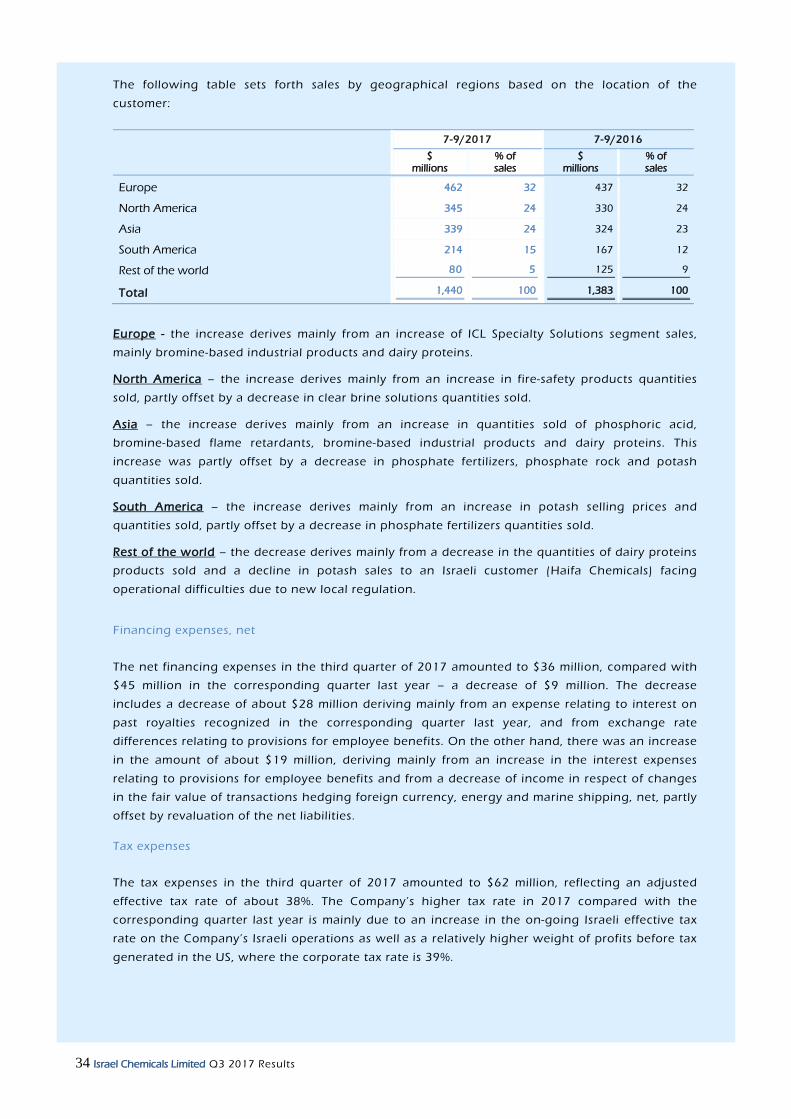
The following table sets forth sales by geographical regions based on the location of the
customer:
7-9/2017 7-9/2016
$
millions % of sales
$ millions
% of sales
Europe 462 32 437 32
North America 345 24 330 24
Asia 339 24 324 23
South America 214 15 167 12
Rest of the world 80 5 125 9
Total 1,440 100 1,383 100
Europe - the increase derives mainly from an increase of ICL Specialty Solutions segment sales,
mainly bromine-based industrial products and dairy proteins.
North America – the increase derives mainly from an increase in fire-safety products quantities
sold, partly offset by a decrease in clear brine solutions quantities sold.
Asia – the increase derives mainly from an increase in quantities sold of phosphoric acid,
bromine-based flame retardants, bromine-based industrial products and dairy proteins. This
increase was partly offset by a decrease in phosphate fertilizers, phosphate rock and potash
quantities sold.
South America – the increase derives mainly from an increase in potash selling prices and
quantities sold, partly offset by a decrease in phosphate fertilizers quantities sold.
Rest of the world – the decrease derives mainly from a decrease in the quantities of dairy proteins
products sold and a decline in potash sales to an Israeli customer (Haifa Chemicals) facing
operational difficulties due to new local regulation.
Financing expenses, net
The net financing expenses in the third quarter of 2017 amounted to $36 million, compared with
$45 million in the corresponding quarter last year – a decrease of $9 million. The decrease
includes a decrease of about $28 million deriving mainly from an expense relating to interest on
past royalties recognized in the corresponding quarter last year, and from exchange rate
differences relating to provisions for employee benefits. On the other hand, there was an increase
in the amount of about $19 million, deriving mainly from an increase in the interest expenses
relating to provisions for employee benefits and from a decrease of income in respect of changes
in the fair value of transactions hedging foreign currency, energy and marine shipping, net, partly
offset by revaluation of the net liabilities.
Tax expenses
The tax expenses in the third quarter of 2017 amounted to $62 million, reflecting an adjusted
effective tax rate of about 38%. The Company’s higher tax rate in 2017 compared with the
corresponding quarter last year is mainly due to an increase in the on-going Israeli effective tax
rate on the Company’s Israeli operations as well as a relatively higher weight of profits before tax
generated in the US, where the corporate tax rate is 39%.
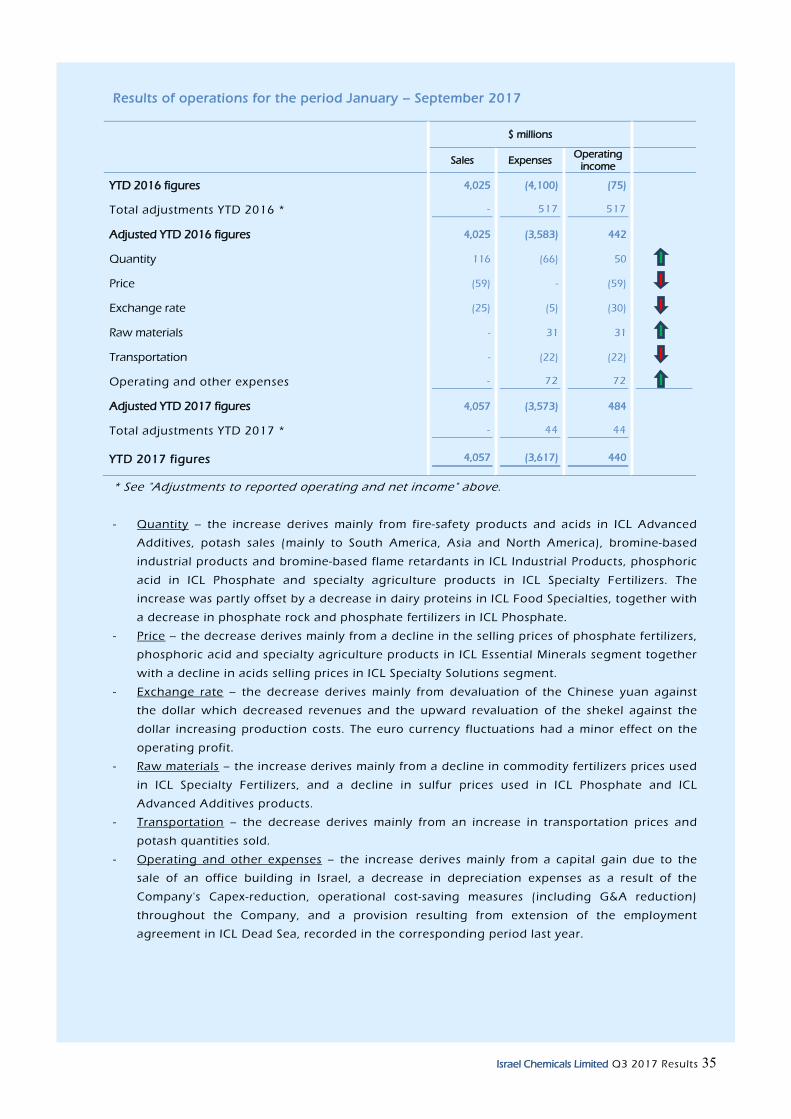
35 Israel Chemicals Limited Q3 2017 Results
Results of operations for the period January – September 2017
$ millions
Sales Expenses Operating
income
YTD 2016 figures 4,025 (4,100) (75)
Total adjustments YTD 2016 * - 517 517
Adjusted YTD 2016 figures 4,025 (3,583) 442
Quantity 116 (66) 50
Price (59) - (59)
Exchange rate (25) (5) (30)
Raw materials - 31 31
Transportation - (22) (22)
Operating and other expenses - 72 72
Adjusted YTD 2017 figures 4,057 (3,573) 484
Total adjustments YTD 2017 * - 44 44
YTD 2017 figures 4,057 (3,617) 440
* See "Adjustments to reported operating and net income" above.
- Quantity – the increase derives mainly from fire-safety products and acids in ICL Advanced
Additives, potash sales (mainly to South America, Asia and North America), bromine-based
industrial products and bromine-based flame retardants in ICL Industrial Products, phosphoric
acid in ICL Phosphate and specialty agriculture products in ICL Specialty Fertilizers. The
increase was partly offset by a decrease in dairy proteins in ICL Food Specialties, together with
a decrease in phosphate rock and phosphate fertilizers in ICL Phosphate.
- Price – the decrease derives mainly from a decline in the selling prices of phosphate fertilizers,
phosphoric acid and specialty agriculture products in ICL Essential Minerals segment together
with a decline in acids selling prices in ICL Specialty Solutions segment.
- Exchange rate – the decrease derives mainly from devaluation of the Chinese yuan against
the dollar which decreased revenues and the upward revaluation of the shekel against the
dollar increasing production costs. The euro currency fluctuations had a minor effect on the
operating profit.
- Raw materials – the increase derives mainly from a decline in commodity fertilizers prices used
in ICL Specialty Fertilizers, and a decline in sulfur prices used in ICL Phosphate and ICL
Advanced Additives products.
- Transportation – the decrease derives mainly from an increase in transportation prices and
potash quantities sold.
- Operating and other expenses – the increase derives mainly from a capital gain due to the
sale of an office building in Israel, a decrease in depreciation expenses as a result of the
Company's Capex-reduction, operational cost-saving measures (including G&A reduction)
throughout the Company, and a provision resulting from extension of the employment
agreement in ICL Dead Sea, recorded in the corresponding period last year.

36 Israel Chemicals Limited Q3 2017 Results
The following table sets forth sales by geographical regions based on the location of the
customer:
1-9/2017 1-9/2016
$
millions % of sales
$ millions
% of sales
Europe 1,453 36 1,476 37
North America 916 23 879 22
Asia 946 23 884 22
South America 506 12 436 11
Rest of the world 236 6 350 8
Total 4,057 100 4,025 100
Europe – the decrease derives mainly from a decline in quantities and selling prices of potash,
partly offset by an increase in ICL Specialty Solutions segment products, mainly clear brine
solutions, bromine-based industrial products and dairy proteins.
North America – the increase derives mainly from an increase in the quantities and selling prices
of potash together with an increase in fire-safety products and phosphate fertilizers quantities
sold. This increase was partly offset by a decrease in quantities sold of ICL Food Specialties’
base-business (single ingredient phosphate additives) products.
Asia – the increase derives mainly from an increase in the quantities sold of potash, phosphoric
acid, dairy proteins, acids, bromine-based flame retardants and specialty agriculture products. This
increase was partly offset by a decrease in phosphate fertilizers and phosphate rock quantities
sold.
South America – the increase derives mainly from an increase in potash selling prices and
quantities sold.
Rest of the world – the decrease derives mainly from a decrease in the quantities of dairy proteins
products sold and a decline in potash sales to an Israeli customer (Haifa Chemicals) facing
operational difficulties due to new local regulation.
Financing expenses, net
The net financing expenses in the nine months ended September 30, 2017 amounted to $99
million, compared with $113 million in the corresponding period last year – a decrease of $14
million. The decrease includes a decline of about $45 million deriving mainly from an expense
relating to interest on past royalties recognized in the corresponding period last year and from an
increase in income in respect of changes in the fair value of transactions hedging foreign
currency, energy and marine shipping, net, partly offset by revaluation of the net liabilities. On the
other hand, there was an increase, in the amount of about $31 million, deriving mainly from fees
paid with respect to early repayment of long-term loans, from exchange rate differences and
interest expenses relating to provisions for employee benefits.
Tax expenses
The tax expenses in the nine months ended September 30, 2017 amounted to $145 million
reflecting an adjusted effective tax rate of about 39%. The Company’s higher tax rate in 2017
compared with the corresponding period last year is mainly due to an increase in the on-going
Israeli effective tax rate on the Company’s Israeli operations and a relatively higher weight of
profits before tax generated in the US, where the corporate tax rate is 39%. In addition the
upward revaluation of the shekel against dollar impacted the Company’s tax expenses. The
relatively low effective tax rate in the corresponding period last year was mainly due to
recognition of deferred tax assets in the amount of $27 million.
37 Israel Chemicals Limited Q3 2017 Results
Segment Information
Segment revenues, expenses and results include inter-segment transfers, which are priced based
on transaction prices in the ordinary course of business. These transfers are eliminated as part of
consolidation of the financial statements. The segment income is measured based on the
operating income, without certain expenses that are not allocated to the operating segments
including general and administrative expenses, as it is included in reports that are regularly
reviewed by the chief operating decision maker.
Specialty Solutions Segment
This segment includes three business lines: ICL Industrial Products, ICL Advanced Additives and
ICL Food Specialties. The segment targets industrial markets and concentrates on achieving
growth through a highly-tailored customer focus, product innovation and commercial excellence.
Significant highlights and business environment
A. Industrial Products
Favorable bromine pricing in China, mainly resulting from stricter environmental regulations ,
affected local production output, and also led to higher prices for bromine-based
compounds.
Demand for bromine-based flame retardants remains stable. However, ICL Industrial Products
is benefitting from lower production of bromine-based flame retardants in China as a result of
stricter local environmental regulations.
ICL Industrial Products is continuing its efforts to secure long-term supply agreements for
bromine-based flame retardants.
The higher price level of phosphorous-based flame retardants, which has been maintained
since the beginning of the year, contributed to h igher sales revenue of the product line
compared to the third quarter of 2016.
Demand for clear brine solutions continues to be soft as a result of the low level of oil prices.
Overall 2017 sales are expected to be in line with 2016.
Stable demand for magnesia products for industrial uses.

Specialty Solutions Segment information as at September 30, 2017 (Unaudited)
38 Israel Chemicals Limited Q3 2017 Results
B. Advanced Additives
Total Advanced Additives performance was favorable compared to the corresponding quarter last
year and was impacted by several factors:
Global sales of salts and acids increased by 7% compared to the corresponding quarter last
year.
º The business line’s performance was driven by higher acid business in Europe,
offsetting price pressure from declining market prices versus the third quarter last
year. Phosphate salts sales in the region remained stable compared to the
corresponding quarter last year.
º Continued growth of the P2O5 business in China is driven by YPH JV’s increased
local market share for acid and higher salt volumes to the oral care market.
º Higher sales volumes of acid and salts partially offset the competitive price
pressure in the North American market. The South American market continued its
favorable performance compared to the corresponding quarter of last year due to
stable demand for phosphate salts and higher acid exports from Brazil to other
South American countries. This development is expected to continue in the next
quarter.
º Compared to the corresponding quarter last year the average pricing was slightly
down in the quarter. However, over the last quarter the average price has
constantly increased, as a result of a new pricing policy.
Higher demand from key customers in North America led to improved P2S5 performance
compared to the corresponding quarter last year. During the quarter, the business line
accumulated suitable inventories to supply customers during an outage due to plant
turnaround which took place in October (the plant has resumed its operations as per
schedule). Main competitors in Europe plan to have turnarounds in the fourth quarter as
well.
Strong wildfire activity in North America and Europe during the third quarter positively
impacted the Fire Safety sub-business line’s performance, resulting in higher sales compared
to the same quarter in 2016. The Class B foam business continues to grow in both existing
and new regions.
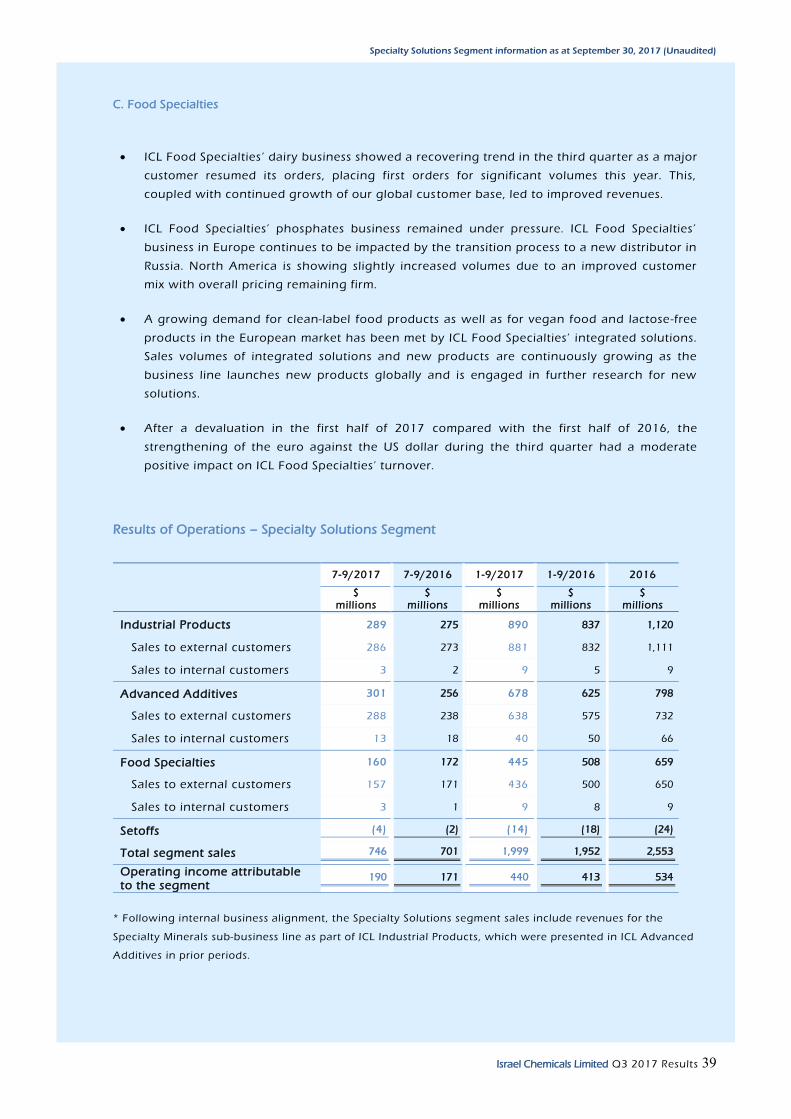
Specialty Solutions Segment information as at September 30, 2017 (Unaudited)
39 Israel Chemicals Limited Q3 2017 Results
C. Food Specialties
ICL Food Specialties ’ dairy business showed a recovering trend in the third quarter as a major
customer resumed its orders, placing first orders for significant volumes this year. This,
coupled with continued growth of our global customer base, led to improved revenues.
ICL Food Specialties’ phosphates business remained under pressure. ICL Food Specialties’
business in Europe continues to be impacted by the transition process to a new distributor in
Russia. North America is showing slightly increased volumes due to an improved customer
mix with overall pricing remaining firm.
A growing demand for clean-label food products as well as for vegan food and lactose-free
products in the European market has been met by ICL Food Specialties’ integrated solutions.
Sales volumes of integrated solutions and new products are continuously growing as the
business line launches new products globally and is engaged in further research for new
solutions.
After a devaluation in the first half of 2017 compared with the first half of 2016, the
strengthening of the euro against the US dollar during the third quarter had a moderate
positive impact on ICL Food Specialties’ turnover.
Results of Operations – Specialty Solutions Segment
7-9/2017 7-9/2016 1-9/2017 1-9/2016 2016
$
millions $
millions $
millions $
millions $
millions
Industrial Products 289 275 890 837 1,120
Sales to external customers 286 273 881 832 1,111
Sales to internal customers 3 2 9 5 9
Advanced Additives 301 256 678 625 798
Sales to external customers 288 238 638 575 732
Sales to internal customers 13 18 40 50 66
Food Specialties 160 172 445 508 659
Sales to external customers 157 171 436 500 650
Sales to internal customers 3 1 9 8 9
Setoffs (4) (2) (14) (18) (24)
Total segment sales 746 701 1,999 1,952 2,553
Operating income attributable to the segment
190 171 440 413 534
* Following internal business alignment, the Specialty Solutions segment sales include revenues for the
Specialty Minerals sub-business line as part of ICL Industrial Products, which were presented in ICL Advanced
Additives in prior periods.

Specialty Solutions Segment information as at September 30, 2017 (Unaudited)
40 Israel Chemicals Limited Q3 2017 Results
Results of operations for the period July – September 2017
Sales analysis Industrial Products
Advanced Additives
Food Specialties
Setoff Segment
Total
$ millions
Total sales Q3 2016 275 256 172 (2) 701
Quantity 6 43 (15) (2) 32
Price 6 (1) (1) - 4
Exchange rate 2 3 4 - 9
Total sales Q3 2017 289 301 160 (4) 746
- Quantity – the increase derives mainly from an increase in quantities sold in the fire safety
and acids sub-business lines of ICL Advanced Additives, and from quantities of bromine-based
industrial products and bromine-based flame retardants sold in ICL Industrial Products. This
increase was partly offset by a decrease in dairy protein quantities sold in ICL Food Specialties.
- Price – the increase derives mainly from an increase in the selling prices of bromine-based
industrial products and phosphorous-based flame retardants in ICL Industrial Products.
- Exchange rate – the increase derives mainly from the upward revaluation of the euro against
the dollar compared to the corresponding quarter last year.
Operating income attributable to the segment analysis $ millions
Total operating income Q3 2016 171
Quantity 14
Price 4
Exchange rate (1)
Raw materials 5
Transportation (2)
Operating and other (expenses) income (1)
Total operating income Q3 2017 190
- Quantity – the increase derives mainly from an increase in quantities sold in the fire safety
sub-business line in ICL Advanced Additives, and from bromine-based industrial products in
ICL Industrial Products. This increase was partly offset by a decrease in the quantities of dairy
proteins sold in ICL Food Specialties.
- Price – the increase derives mainly from an increase in the selling prices of bromine-based
industrial products and phosphorous-based flame retardants in ICL Industrial Products.
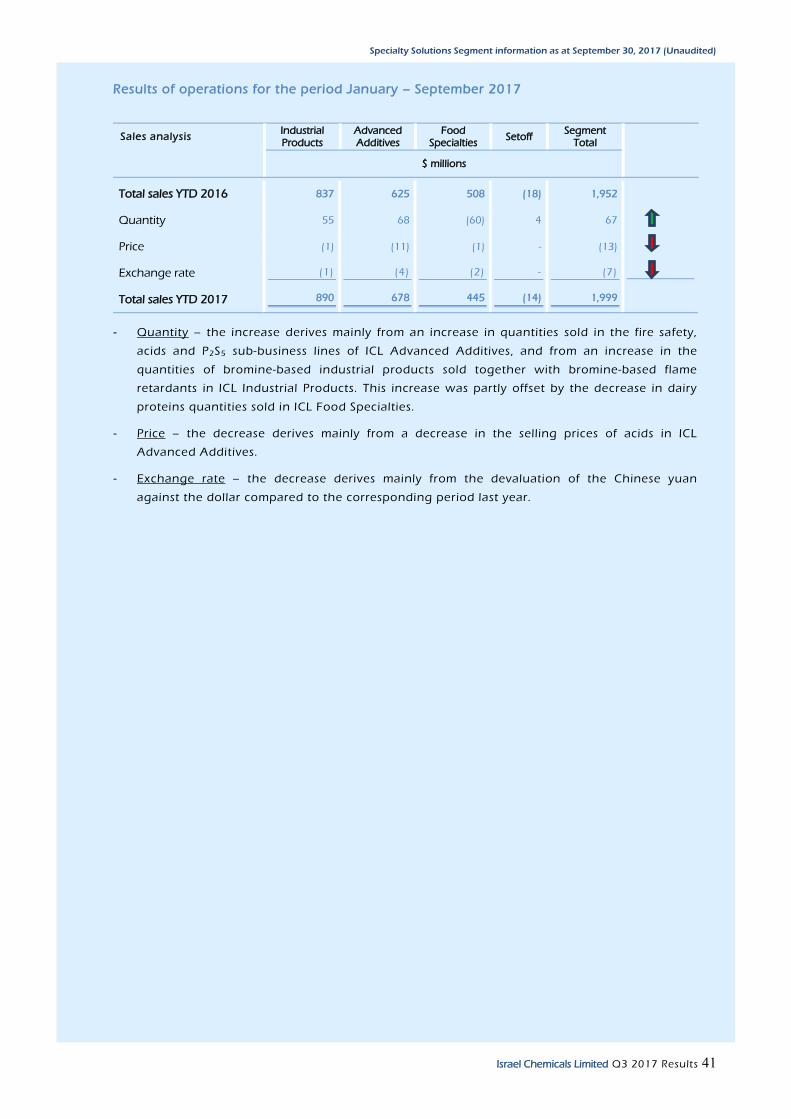
Specialty Solutions Segment information as at September 30, 2017 (Unaudited)
41 Israel Chemicals Limited Q3 2017 Results
Results of operations for the period January – September 2017
Sales analysis Industrial Products
Advanced Additives
Food Specialties
Setoff Segment
Total
$ millions
Total sales YTD 2016 837 625 508 (18) 1,952
Quantity 55 68 (60) 4 67
Price (1) (11) (1) - (13)
Exchange rate (1) (4) (2) - (7)
Total sales YTD 2017 890 678 445 (14) 1,999
- Quantity – the increase derives mainly from an increase in quantities sold in the fire safety,
acids and P2S5 sub-business lines of ICL Advanced Additives, and from an increase in the
quantities of bromine-based industrial products sold together with bromine-based flame
retardants in ICL Industrial Products. This increase was partly offset by the decrease in dairy
proteins quantities sold in ICL Food Specialties.
- Price – the decrease derives mainly from a decrease in the selling prices of acids in ICL
Advanced Additives.
- Exchange rate – the decrease derives mainly from the devaluation of the Chinese yuan
against the dollar compared to the corresponding period last year.
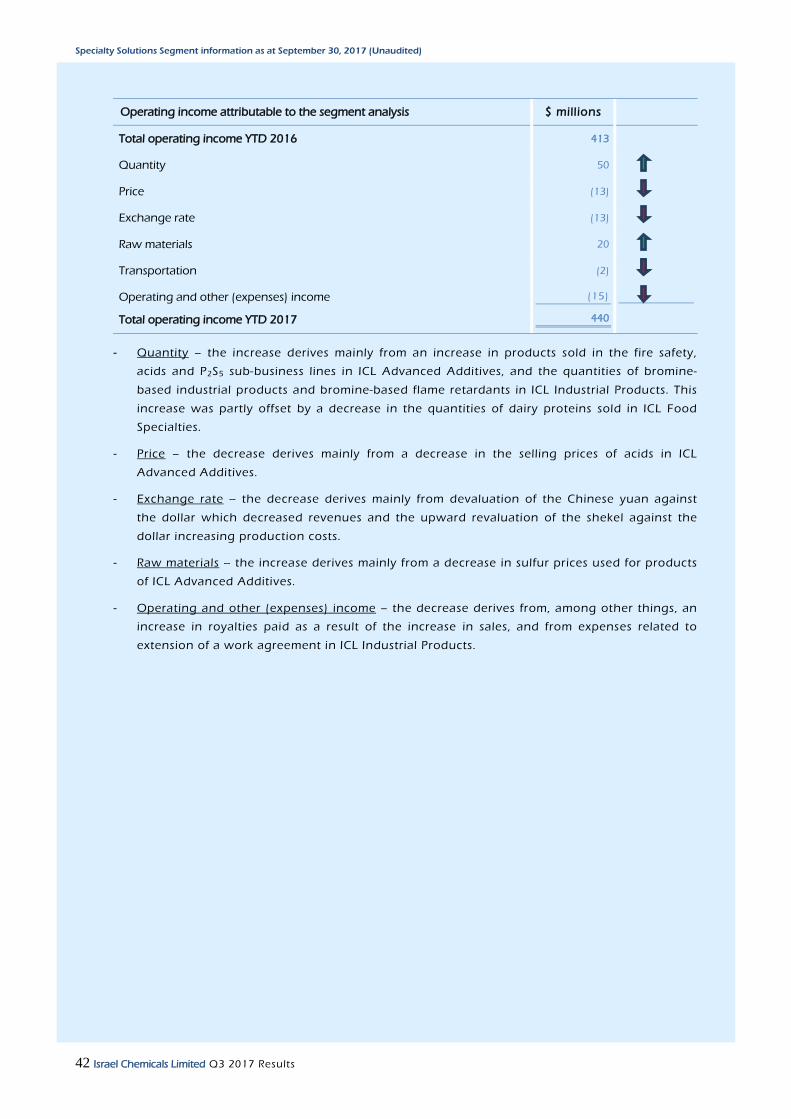
Specialty Solutions Segment information as at September 30, 2017 (Unaudited)
42 Israel Chemicals Limited Q3 2017 Results
Operating income attributable to the segment analysis $ millions
Total operating income YTD 2016 413
Quantity 50
Price (13)
Exchange rate (13)
Raw materials 20
Transportation (2)
Operating and other (expenses) income (15)
Total operating income YTD 2017 440
- Quantity – the increase derives mainly from an increase in products sold in the fire safety,
acids and P2S5 sub-business lines in ICL Advanced Additives, and the quantities of bromine-
based industrial products and bromine-based flame retardants in ICL Industrial Products. This
increase was partly offset by a decrease in the quantities of dairy proteins sold in ICL Food
Specialties.
- Price – the decrease derives mainly from a decrease in the selling prices of acids in ICL
Advanced Additives.
- Exchange rate – the decrease derives mainly from devaluation of the Chinese yuan against
the dollar which decreased revenues and the upward revaluation of the shekel against the
dollar increasing production costs.
- Raw materials – the increase derives mainly from a decrease in sulfur prices used for products
of ICL Advanced Additives.
- Operating and other (expenses) income – the decrease derives from, among other things, an
increase in royalties paid as a result of the increase in sales, and from expenses related to
extension of a work agreement in ICL Industrial Products.

Essential Minerals Segment information as at September 30, 2017 (Unaudited)
43 Israel Chemicals Limited Q3 2017 Results
Essential Minerals Segment
This segment includes three business lines: ICL Potash & Magnesium, ICL Phosphate and ICL
Specialty Fertilizers. The segment targets the Agro markets and focuses on efficiency, process
innovation and operational excellence.
Business environment overview
Global economic activity is strengthening, with global growth projected to rise to 3.6% in
2017 and 3.7% in 2018 (according to World Economic Outlook, October 2017). Recovery is
supported by increases in investments, trade, and industrial production, coupled with
stronger business and consumer confidence.
Grain prices are at a ten-year low level, adversely affecting farmers’ incentive to purchase
fertilizers.
Based on the WASDE report published by the USDA in October 2017, a small decrease is
expected in the grain stock-to-use ratio to 24.8% at the end of the 2017/2018 agricultural
year, compared to 25.5% at the end of the 2016/2017 agricultural year, and a further
decrease from a level of 25.7% in the 2015/2016 agricultural year.
The forecast of the FAO (Food and Agriculture Organization of the UN) of world cereal
production in 2017 rose slightly in October to an estimated 2,612 million tonnes, 6.8 million
tonnes (0.3%) above the 2016 record. This upward adjustment mostly derives from improved
production prospects for coarse grains and wheat, which more than offsets the cut in rice
production.
Essential Minerals Segment information as at September 30, 2017 (Unaudited)
44 Israel Chemicals Limited Q3 2017 Results
Significant highlights and business environment
A. Potash and Magnesium
Potash prices firmed moderately during the third quarter of 2017, supported by the Chinese
and Indian contracts which were signed at a price increase of $11 and $13 per tonne,
respectively. The average CFR Brazil price for the quarter was $261 per tonne, $6 per tonne
higher than the second quarter of 2017, and $38 per tonne (16%) higher than the third
quarter of last year (according to CRU - Fertilizer Week Historical Prices, 9/28/2017).
ICL recorded strong potash shipments during the quarter following signing of contracts with
China and India for quantities of 925 thousand tonnes and 750 thousand tonnes (India –
including options), respectively. Contract prices increased by about 5% compared to the
2016 contracts.
According to Customs data, China imported about 5.49 million tonnes of potash during the
first nine months of 2017, an increase of about 27% over the corresponding period last year.
According to the FAI (Fertilizer Association of India), potash imports during the first nine
months of 2017 amounted to 3.9 million tonnes, an increase of 41% over the corresponding
period last year.
Demand for potash in Brazil was particularly strong. According to ANDA (Brazilian National
Fertilizer Association), potash imports into Brazil during the first nine months of 2017
amounted to 6.982 million tonnes, an increase of 6% over the corresponding period last
year.
Market observers are forecasting price pressure as a result of a new capacity ramp up in the
coming months, mainly in Canada and Russia. CRU is predicting the CFR Brazil price to
decline from an annual average of $265 per tonne in 2017 to $255 per tonne in 2018 and a
continued decline through 2022, reaching $230 per tonne.
Two new Greenfield projects are scheduled for commissioning and ramp-up of production
currently and in the next few months. The new Bethune (formerly - Legacy Project) solution
mining plant of K+S started commercial shipments in October. The plant is expected to reach
an annual capacity of 2 million tonnes by the end of 2017. In Russia, EuroChem’s Usolskiy
and VolgaKaliy potash mines are scheduled for commissioning by the end of this year and in
the beginning of next year, respectively, with an annual capacity of 2.3 million tonnes each.
In April 2017, after receiving all the permits for execution of the Salt Harvesting with the
Government of Israel, ICL’s Board of Directors approved a budget of about $280 million to
further proceed with the execution of the Salt Harvesting in the Dead Sea. This budget
which is part of the Salt Harvesting project, will be executed over the next 13 years, and
constitutes ICL’s share (80%) in the cost of performing this part. In October 2017, Dead Sea
Works Ltd., an ICL subsidiary, signed an agreement in the amount of $280 million for the first
stage of the salt harvesting project, with Holland Shallow Seas Dredging Ltd., a contracting
company that will commence building a special dredger designed to execute the salt
harvesting. The dredger is expected to be operating in the first half of 2019. By then, the
engineering and operational preparations and the extensive infrastructure works that have
been underway during the past few years are planned to be completed and the salt
harvesting operations are expected to begin. For more information, see “Item 4. Information
on the Company—D. Property, Plant and Equipment—Mineral Extraction and Mining
Essential Minerals Segment information as at September 30, 2017 (Unaudited)
45 Israel Chemicals Limited Q3 2017 Results
Operations—The Dead Sea” in our Annual Report on Form 20 -F for the year ended December
31, 2016.
Metal magnesium – global demand for magnesium remains constrained in China, Brazil and
Europe while prices are under pressure due to increased Chinese exports as well as imports
from Russian, Kazakh and Turkish producers to the US.
On a positive note, Alcoa recently announced it will re-start 136 thousand tonnes of primary
aluminum capacity at its facility in Warrick, Indiana. This is the first announcement of an
increase in US production in the past decades .
During the third quarter of 2017, Dead Sea Works Ltd. notified the executing contractor of
the new power station in Sodom (the Spanish company Abengoa) of cancellation of the
construction agreement (EPC) due to a series of violations of the agreement by the
executing contractor, which is experiencing financial difficulties. Dead Sea Works Ltd. plans
to complete construction of the power station and to bring it to full operation during the
first half of 2018. For further information, see Note 6 to the Company’s condensed
consolidated interim financial statements as at September 30, 2017.
During the third quarter of 2017, the Board of Directors approved an investment of $249
million in building the new P-9 pumping station that will replace the current P-88 pumping
station. The investment is scheduled to be carried out until 2020. The building per mits were
obtained and construction has commenced . For more information, see “Item 4. Information
on the Company—D. Property, Plant and Equipment—Mineral Extraction and Mining
Operations—The Dead Sea” in our Annual Report on Form 20 -F for the year ended December
31, 2016.
B. Phosphate
The phosphate market is experiencing a challenging period as the increased supply in low
production cost regions surpassed demand, which resulted in pressure on prices.
Following the quarter, some stability and recovery in phosphate prices was recorded,
following an increase in the price of raw materials (mainly sulphur and ammonia).
DAP average price for the third quarter of 2017 was $352 per tonne FOB Morocco, a
decrease of 5.8% and 2.1% over the second quarter of 2017 and the third quarter of 2016
(according to CRU - Fertilizer Week Historical Prices, 9/28/2017), respectively. Towards the
end of the quarter, prices stabilized and some increases were recorded, mainly
attributable to the increase in the price of raw materials such as ammonia and sulphur.
The average price of phosphate rock (68-72% BPL) during the third quarter of 2017 was
$86 per tonne FOB Morocco, a decrease of 8.2% and 23% over the second quarter of
2017 and the third quarter of 2016 (according to CRU - Fertilizer Week Historical Prices,
9/28/2017), respectively.
Phosphoric acid (100% P2O5) contract price with India was concluded for the second half
of 2017 at $567 per tonne CFR. The new price represents a $23 per tonne decrease over
the second quarter of 2017 price of $590 per tonne CFR and $39 per tonne decrease over
the third quarter of 2016 price of $606 per tonne CFR.

Essential Minerals Segment information as at September 30, 2017 (Unaudited)
46 Israel Chemicals Limited Q3 2017 Results
OCP, the Moroccan producer, added its third (out of 4) one million tonne per year finished
product. Ma’aden, the Saudi Arabian producer, is in the process of commissioning its
Wa’ad Al Shamal facility, with a finished product capacity of 3 million tonnes per year.
Export of phosphates (DAP, MAP and TSP) from China increased by 27% during January to
September 2017 to 7.558 million tonnes, despite lower Indian imports and low margins.
Chinese producers are experiencing continued pressure by Chinese environmental
authorities, which has resulted in some plant closures and additional expenses.
Market observers such as CRU and FertEcon are forecasting a moderate global price
recovery starting next year due to lower exports from China and higher imports to India.
Phosphate imports to Brazil (DAP, MAP, TSP, SSP) in January to September 2017 increased
by 14.3% to 4.29 million tonnes.
DAP imports to India declined significantly in 2017, having a significant adverse effect on
the global market. According to the FAI (Fertilizer Association of India), DAP imports in
January to September 2017 decreased by 17% to 3.077 million tonnes.
Demand in the US was stable to firm. DAP imports in January to August 2017 increased by
15% to 0.641 million tonnes. MAP imports increased by 33% to 0.921 million tonnes.
Sulphur prices rallied during the third quarter due to increased demand and limited
supply. The average price was $95 per tonne FOB Vancouver, an increase of 22% over the
second quarter of 2017, and a significant increase of 34% over the third quarter of 2016
(according to CRU - Fertilizer Week Historical Prices, 9/28/2017).
Despite market conditions, the YPH JV’s results continued to improve in the third quarter
of 2017, driven by a shift to specialty and higher margin products as well as the
implementation of efficiency and cost reduction measures.
ICL Rotem management is working on implementing additional efficiency measures in
order to cope with the market conditions.
ICL Rotem Zin plant was shut down during the third quarter of 2017, as a result of
decreased phosphate rock sales due to lower prices. The plant is expected to return to
activity during the fourth quarter of 2017.
On June 30, 2017, there was a partial collapse of the dyke in Pond 3 in the plants of
Rotem Amfert Israel, which is used for accumulation of phosphogypsum water that is
created as a by-product of the production processes. The Company ceased immediately
use of the active phosphogypsum ponds. On July 3, 2017, the Company returned to
production at full capacity under a temporary approval to activate Pond 4 by the Ministry
of Environmental Protection. The Company was instructed by the Ministry of
Environmental Protection to submit a plan within the next few months relating to the
future operation of the phosphogypsum water ponds. The Ministry of Environmental
Protection and additional Israeli authorities have commenced examinations for
investigation of the event.
Essential Minerals Segment information as at September 30, 2017 (Unaudited)
47 Israel Chemicals Limited Q3 2017 Results
The Company is taking action to explore solutions for, among other things, restoration of
the ponds in the short- term and long-term and rectification of any environmental impacts
caused, to the extent required. The Company’s actions are being carried out in full
coordination and close cooperation with the Israeli environmental authorities, including
the Ministry of Environmental Protection and the Nature and National Parks Authority.
The Company is committed to the matter of environmental protection, and for years has
worked closely with the Israeli environmental protection authorities to maintain the
Negev’s natural reserves in the area of its facilities.
In light of the preliminary stages of the process of estimating the costs relating to
restoration of the stream and obtaining the permanent permits for operating the gypsum
pond or other ponds, and taking into account the complexity of the process and the
uncertainty regarding the final restoration plans and the terms of the building permits to
be determined by the relevant authorities , the Company is unable at this stage to estimate
the expected costs of the restoration work and obtaining the permits, as stated. The
Company is in contact with its insurance carriers with reference to the relevant insurance
policies regarding the matters described above. For further information, see Note 6 to the
Company’s condensed consolidated interim financial statements as at September 30,
2017.
C. Specialty Fertilizers
ICL Specialty Fertilizers demonstrated improved performance compared to the third quarter
of 2016, mainly supported by an increase in volumes and strong demand in Europe and
APAC.
Increased sales quantities in Europe, especially in the ornamental horticulture market.
Sales in Spain benefitted from an increase in t raded products sales, as plant protection
volumes were stronger due to the weather conditions which resulted in higher disease
pressure.
Higher controlled release fertilizers (CRF) sales in APAC supported by the recovery in the
palm oil market, as well as higher sales quantities in China.
Third quarter straight fertilizers (MAP/MKP) results were higher compared to the
corresponding quarter in 2016.
Continued competitive market conditions coupled with negative weather conditions
(hurricanes) resulted in a weak quarter in North America. This impact is expected to continue
in the short term .
Results in Israel were negatively impacted by the continued local shortage of ammonia.
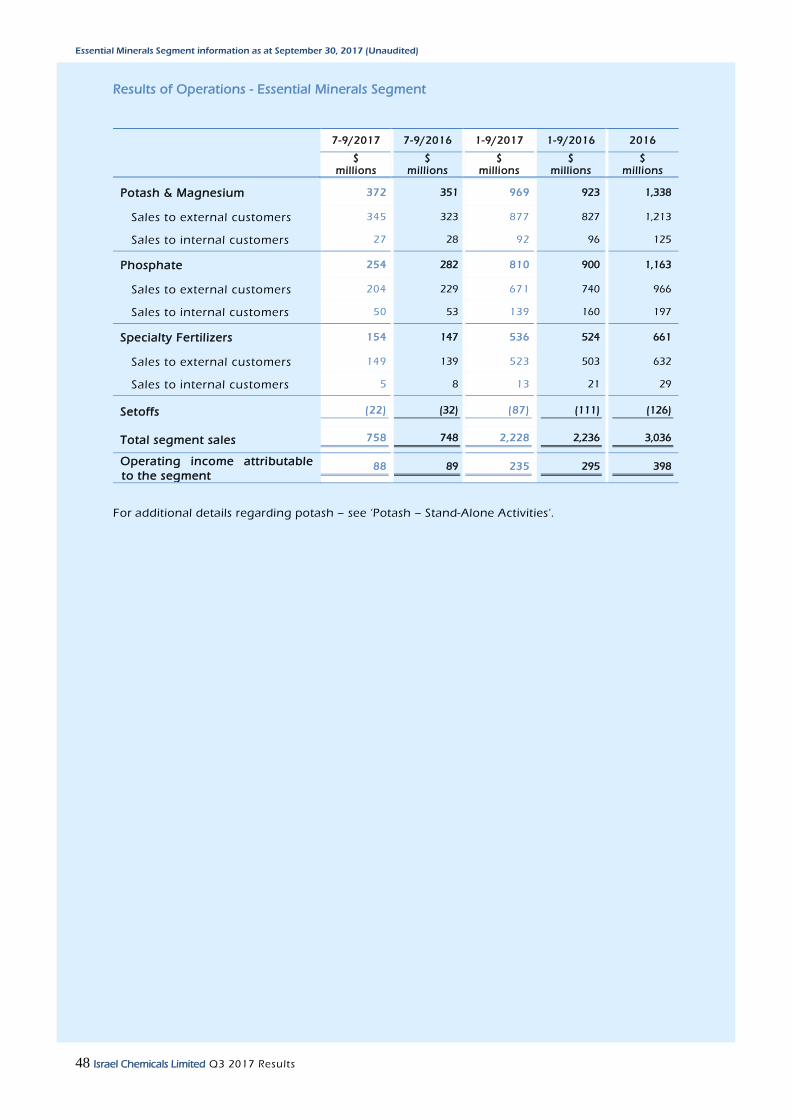
Essential Minerals Segment information as at September 30, 2017 (Unaudited)
48 Israel Chemicals Limited Q3 2017 Results
Results of Operations - Essential Minerals Segment
7-9/2017 7-9/2016 1-9/2017 1-9/2016 2016
$
millions $
millions $
millions $
millions $
millions
Potash & Magnesium 372 351 969 923 1,338
Sales to external customers 345 323 877 827 1,213
Sales to internal customers 27 28 92 96 125
Phosphate 254 282 810 900 1,163
Sales to external customers 204 229 671 740 966
Sales to internal customers 50 53 139 160 197
Specialty Fertilizers 154 147 536 524 661
Sales to external customers 149 139 523 503 632
Sales to internal customers 5 8 13 21 29
Setoffs (22) (32) (87) (111) (126)
Total segment sales 758 748 2,228 2,236 3,036
Operating income attributable
to the segment 88 89 235 295 398
For additional details regarding potash – see ‘Potash – Stand-Alone Activities'.
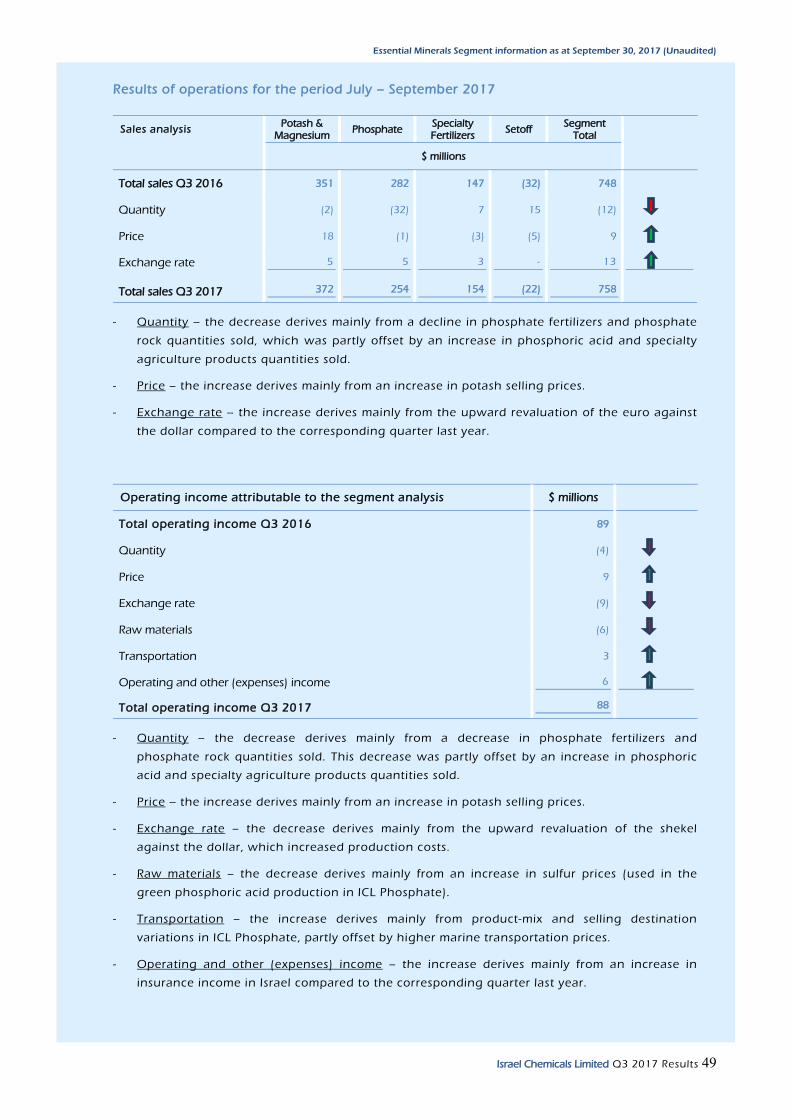
Essential Minerals Segment information as at September 30, 2017 (Unaudited)
49 Israel Chemicals Limited Q3 2017 Results
Results of operations for the period July – September 2017
Sales analysis Potash &
Magnesium Phosphate
Specialty Fertilizers
Setoff Segment
Total
$ millions
Total sales Q3 2016 351 282 147 (32) 748
Quantity (2) (32) 7 15 (12)
Price 18 (1) (3) (5) 9
Exchange rate 5 5 3 - 13
Total sales Q3 2017 372 254 154 (22) 758
- Quantity – the decrease derives mainly from a decline in phosphate fertilizers and phosphate
rock quantities sold, which was partly offset by an increase in phosphoric acid and specialty
agriculture products quantities sold.
- Price – the increase derives mainly from an increase in potash selling prices.
- Exchange rate – the increase derives mainly from the upward revaluation of the euro against
the dollar compared to the corresponding quarter last year.
Operating income attributable to the segment analysis $ millions
Total operating income Q3 2016 89
Quantity (4)
Price 9
Exchange rate (9)
Raw materials (6)
Transportation 3
Operating and other (expenses) income 6
Total operating income Q3 2017 88
- Quantity – the decrease derives mainly from a decrease in phosphate fertilizers and
phosphate rock quantities sold. This decrease was partly offset by an increase in phosphoric
acid and specialty agriculture products quantities sold.
- Price – the increase derives mainly from an increase in potash selling prices.
- Exchange rate – the decrease derives mainly from the upward revaluation of the shekel
against the dollar, which increased production costs.
- Raw materials – the decrease derives mainly from an increase in sulfur prices (used in the
green phosphoric acid production in ICL Phosphate).
- Transportation – the increase derives mainly from product-mix and selling destination
variations in ICL Phosphate, partly offset by higher marine transportation prices.
- Operating and other (expenses) income – the increase derives mainly from an increase in
insurance income in Israel compared to the corresponding quarter last year.
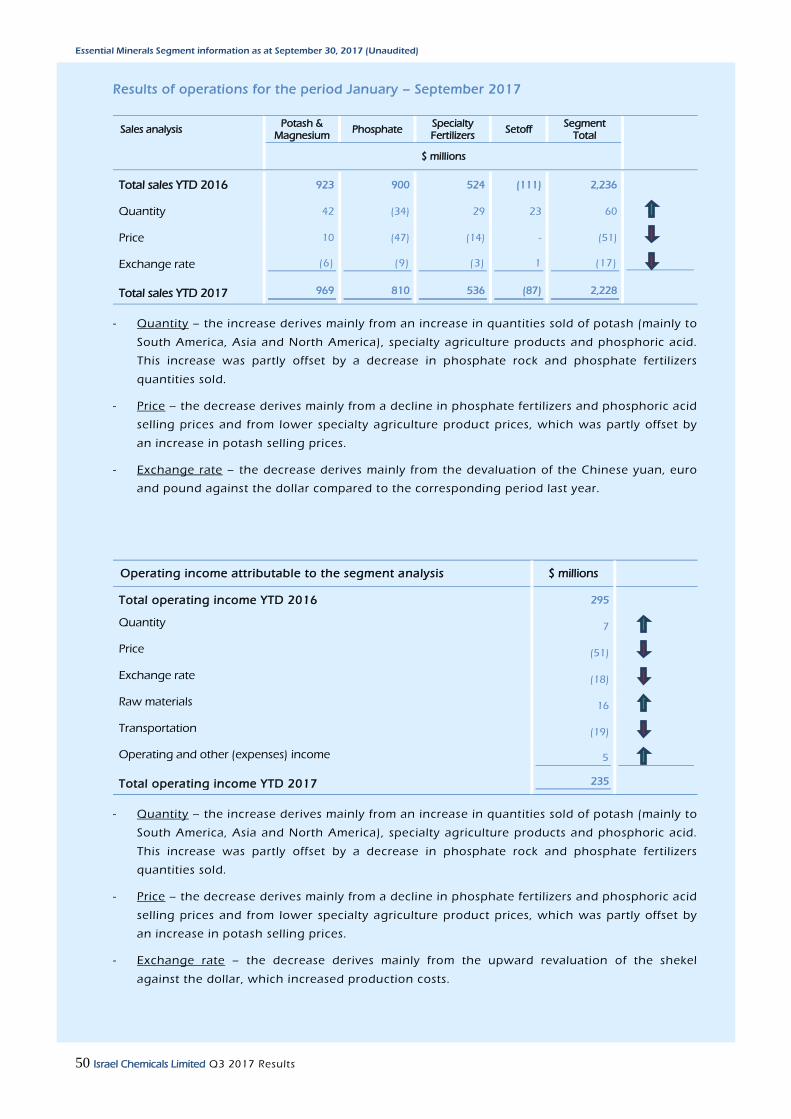
Essential Minerals Segment information as at September 30, 2017 (Unaudited)
50 Israel Chemicals Limited Q3 2017 Results
Results of operations for the period January – September 2017
Sales analysis Potash &
Magnesium Phosphate
Specialty Fertilizers
Setoff Segment
Total
$ millions
Total sales YTD 2016 923 900 524 (111) 2,236
Quantity 42 (34) 29 23 60
Price 10 (47) (14) - (51)
Exchange rate (6) (9) (3) 1 (17)
Total sales YTD 2017 969 810 536 (87) 2,228
- Quantity – the increase derives mainly from an increase in quantities sold of potash (mainly to
South America, Asia and North America), specialty agriculture products and phosphoric acid.
This increase was partly offset by a decrease in phosphate rock and phosphate fertilizers
quantities sold.
- Price – the decrease derives mainly from a decline in phosphate fertilizers and phosphoric acid
selling prices and from lower specialty agriculture product prices, which was partly offset by
an increase in potash selling prices.
- Exchange rate – the decrease derives mainly from the devaluation of the Chinese yuan, euro
and pound against the dollar compared to the corresponding period last year.
Operating income attributable to the segment analysis $ millions
Total operating income YTD 2016 295
Quantity 7
Price (51)
Exchange rate (18)
Raw materials 16
Transportation (19)
Operating and other (expenses) income 5
Total operating income YTD 2017 235
- Quantity – the increase derives mainly from an increase in quantities sold of potash (mainly to
South America, Asia and North America), specialty agriculture products and phosphoric acid.
This increase was partly offset by a decrease in phosphate rock and phosphate fertilizers
quantities sold.
- Price – the decrease derives mainly from a decline in phosphate fertilizers and phosphoric acid
selling prices and from lower specialty agriculture product prices, which was partly offset by
an increase in potash selling prices.
- Exchange rate – the decrease derives mainly from the upward revaluation of the shekel
against the dollar, which increased production costs.

Essential Minerals Segment information as at September 30, 2017 (Unaudited)
51 Israel Chemicals Limited Q3 2017 Results
- Raw materials – the increase derives mainly from a decline in commodity fertilizers prices
(used for products of ICL Specialty Fertilizers) and a decline in sulfur prices (used in the green
phosphoric acid production in ICL Phosphate).
- Transportation – the decrease derives mainly from an increase in marine transportation prices.
- Operating and other (expenses) income – the increase derives mainly from a provision
recorded in the corresponding period last year resulting from extension of the employment
agreement in ICL Dead Sea and a capital gain due to the sale of an office building. This
increase was partly offset by a decrease in insurance income in Israel compared to the
corresponding period last year.
Phosphate – Stand-Alone Activities
Phosphate – Production and Sales
Thousands of Tonnes 7-9/2017 7-9/2016 1-9/2017 1-9/2016 2016
Phosphate rock
Production of rock 1,096 1,549 3,779 4,443 5,744
Sales * 116 318 358 875 1,032
Phosphate rock used for internal purposes 1,085 1,178 3,269 3,045 4,099
Phosphate fertilizers
Production 490 876 1,539 2,034 2,725
Sales * 564 677 1,790 1,895 2,645
* To external customers.
Production and Sales
7-9/2017
- Production of phosphate rock – in the third quarter of 2017, production of phosphate rock
was lower by 453 thousand tonnes than in the corresponding quarter last year. The decrease
derives mainly from adjusting production volumes to the business environment at ICL Rotem,
which included a shutdown of the Zin plant during the third quarter of 2017. The plant is
expected to return to activity during the fourth quarter of 2017.
- Sales of phosphate rock – the quantity of phosphate rock sold in the third quarter of 2017 was
202 thousand tonnes lower than in the corresponding quarter last year, due to challenging
market environment and unattractive prices.
- Production of phosphate fertilizers – in the third quarter of 2017, production of phosphate
fertilizers was lower by 386 thousand tonnes than in the corresponding quarter last year,
mainly due to decreased production in YPH as a result of the shift to specialty products.
- Sales of phosphate fertilizers – the quantity of phosphate fertilizers sold in the third quarter of
2017 was 113 thousand tonnes lower than in the corresponding quarter last year, mainly due
to a decrease in sales to Asia.
Essential Minerals Segment information as at September 30, 2017 (Unaudited)
52 Israel Chemicals Limited Q3 2017 Results
1-9/2017
- Production of phosphate rock – in the nine months ended on September 30, 2017, production
of phosphate rock was lower by 664 thousand tonnes than in the corresponding period last
year, mainly due to adjusting production volumes to the business environment at ICL Rotem,
which included a shutdown of the Zin plant during the third quarter of 2017. The plant is
expected to return to activity during the fourth quarter of 2017. In addition, the production of
phosphate rock decreased due to a production optimization process in YPH.
- Sales of phosphate rock – the quantity of phosphate rock sold in the nine months ended on
September 30, 2017 was 517 thousand tonnes lower than in the corresponding period last
year, due to challenging market environment and unattractive prices.
- Production of phosphate fertilizers – in the nine months ended on September 30, 2017,
production of phosphate fertilizers was lower by 495 thousand tonnes than in the
corresponding period last year, mainly due to decreased production in YPH as a result of the
shift to specialty products.
- Sales of phosphate fertilizers – the quantity of phosphate fertilizers sold in the nine months
ended on September 30, 2017 was 105 thousand tonnes lower than in the corresponding
period last year, mainly due to a decrease in sales to Asia.

Essential Minerals Segment information as at September 30, 2017 (Unaudited)
53 Israel Chemicals Limited Q3 2017 Results
Potash – Stand-Alone Activities
Key Figures – Additional Information
Millions of dollars 7-9/2017 7-9/2016 1-9/2017 1-9/2016 2016
Sales to external customers 328 302 820 765 1,134
Sales to internal customers * 32 34 109 117 151
Total Sales 360 336 929 882 1,285
Gross Profit 148 146 357 346 513
Operating income attributable to
potash business 73 81 179 197 291
CAPEX 40 74 142 239 305
Depreciation and amortization 29 35 86 92 119
Average potash selling price per tonne
- FOB (in $) 217 199 216 215 211
* Sales to other business lines of ICL including the Magnesium business.
The potash stand-alone activities include, among others, polysulphate produced in a mine in the
UK and salt produced in underground mines in UK and Spain.
Results of operations for the period July – September 2017
Sales analysis $ millions
Total sales Q3 2016 336
Quantity 1
Price 17
Exchange rate 6
Total sales Q3 2017 360
Operating income attributable to potash business analysis $ millions
Total operating income Q3 2016 81
Quantity (4)
Price 17
Exchange rate (4)
Transportation (8)
Operating and other (expenses) income (9)
Total operating income Q3 2017 73
- Quantity – the decrease derives mainly from higher sales of potash manufactured at sites having
lower profitability rates.
- Price – the increase derives mainly from an increase in potash selling prices.
- Transportation – the decrease derives mainly from an increase in marine transportation prices.
- Operating and other (expenses) income –the decrease derives mainly from higher energy
costs.
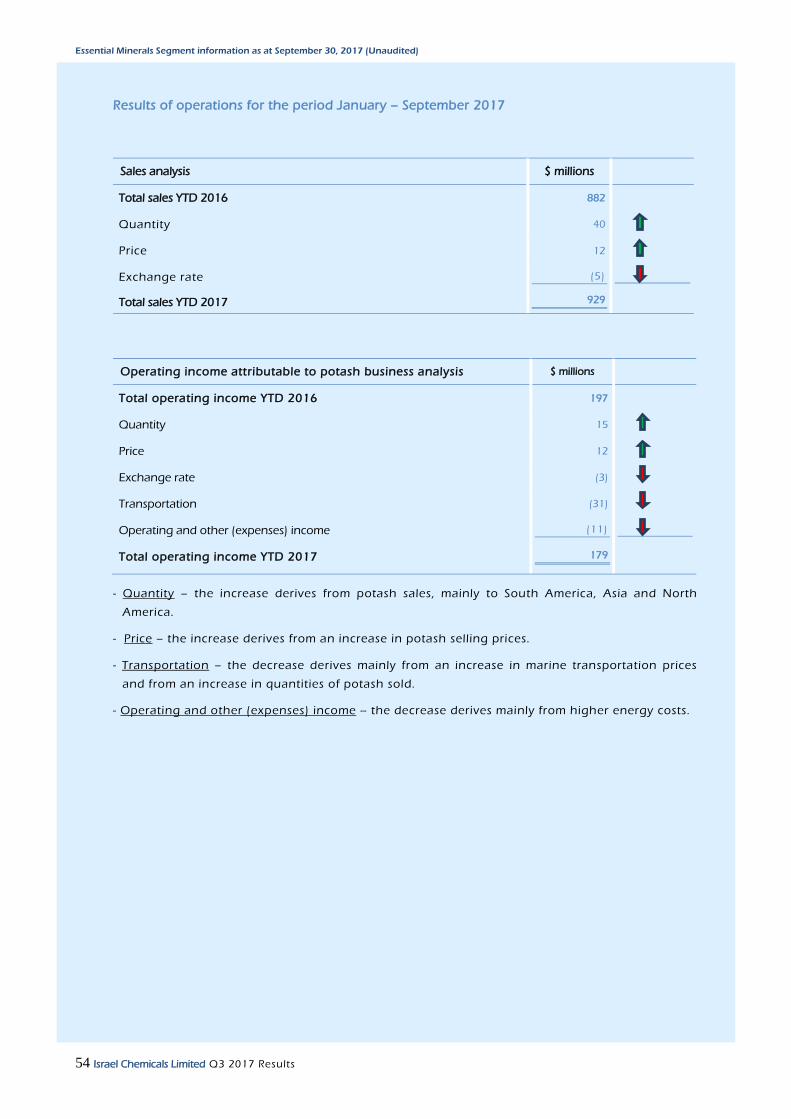
Essential Minerals Segment information as at September 30, 2017 (Unaudited)
54 Israel Chemicals Limited Q3 2017 Results
Results of operations for the period January – September 2017
Sales analysis $ millions
Total sales YTD 2016 882
Quantity 40
Price 12
Exchange rate (5)
Total sales YTD 2017 929
Operating income attributable to potash business analysis $ millions
Total operating income YTD 2016 197
Quantity 15
Price 12
Exchange rate (3)
Transportation (31)
Operating and other (expenses) income (11)
Total operating income YTD 2017 179
- Quantity – the increase derives from potash sales, mainly to South America, Asia and North
America.
- Price – the increase derives from an increase in potash selling prices.
- Transportation – the decrease derives mainly from an increase in marine transportation prices
and from an increase in quantities of potash sold.
- Operating and other (expenses) income – the decrease derives mainly from higher energy costs.
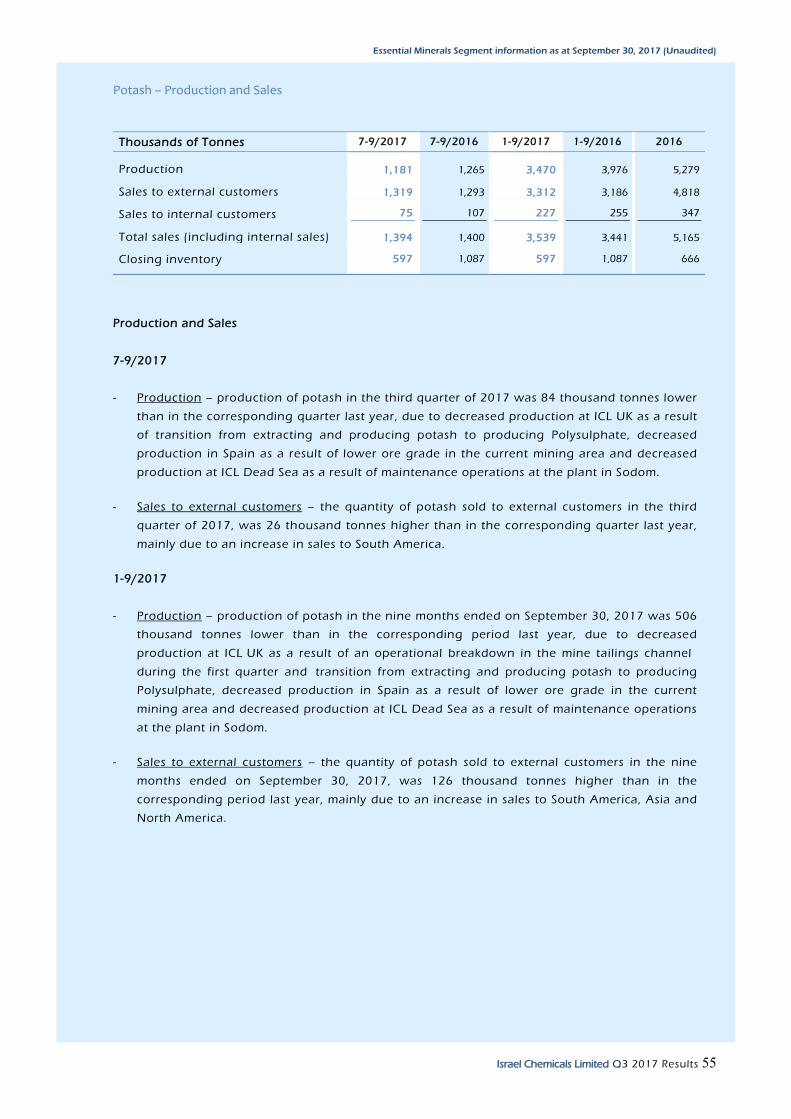
Essential Minerals Segment information as at September 30, 2017 (Unaudited)
55 Israel Chemicals Limited Q3 2017 Results
Potash – Production and Sales
Thousands of Tonnes 7-9/2017 7-9/2016 1-9/2017 1-9/2016 2016
Production 1,181 1,265 3,470 3,976 5,279
Sales to external customers 1,319 1,293 3,312 3,186 4,818
Sales to internal customers 75 107 227 255 347
Total sales (including internal sales) 1,394 1,400 3,539 3,441 5,165
Closing inventory 597 1,087 597 1,087 666
Production and Sales
7-9/2017
- Production – production of potash in the third quarter of 2017 was 84 thousand tonnes lower
than in the corresponding quarter last year, due to decreased production at ICL UK as a result
of transition from extracting and producing potash to producing Polysulphate, decreased
production in Spain as a result of lower ore grade in the current mining area and decreased
production at ICL Dead Sea as a result of maintenance operations at the plant in Sodom.
- Sales to external customers – the quantity of potash sold to external customers in the third
quarter of 2017, was 26 thousand tonnes higher than in the corresponding quarter last year,
mainly due to an increase in sales to South America.
1-9/2017
- Production – production of potash in the nine months ended on September 30, 2017 was 506
thousand tonnes lower than in the corresponding period last year, due to decreased
production at ICL UK as a result of an operational breakdown in the mine tailings channel
during the first quarter and transition from extracting and producing potash to producing
Polysulphate, decreased production in Spain as a result of lower ore grade in the current
mining area and decreased production at ICL Dead Sea as a result of maintenance operations
at the plant in Sodom.
- Sales to external customers – the quantity of potash sold to external customers in the nine
months ended on September 30, 2017, was 126 thousand tonnes higher than in the
corresponding period last year, mainly due to an increase in sales to South America, Asia and
North America.
56 Israel Chemicals Limited Q3 2017 Results
Liquidity and Capital Resources
Source and uses of cash
Set forth below are the highlights of the changes in the cash flows in the third quarter of 2017, compared with the corresponding quarter last year:
Net cash provided by operating activities:
In the third quarter of 2017, the cash flows provided by operating activities decreased by $73
million compared with the corresponding quarter last year. This decrease derives from a lower
decrease in the working capital, mainly from an increase in sales in ICL Industrial Products and in
the fire safety sub-business line in ICL Advanced Additives , along with cash payments made due to
retirement of employees in the current quarter.
Net cash used in investing activities :
In the third quarter of 2017, the cash flows used in investing activities decreased compared with
the corresponding quarter last year, by $4 million. This decrease derives mainly from a decrease in
the cash flows used for investments in property, plant and equipment, and other assets, in the
amount of $55 million. The decrease was mostly offset by an increase in deposits.
Net cash used in financing activities :
In the third quarter of 2017, there was a decrease of $101 million in the cash flows used in
financing activities compared with the corresponding quarter last year. This decrease derives
mainly from repayment of long term loans net of long term loans received, in the amount of $8
million, compared to the amount of $47 million, in the corresponding quarter last ye ar and receipt
of short-term credit from banks and others, net, in the amount of $13 million compared to
repayment of short-term credit from banks and others, net in the amount of $19 million in the
corresponding quarter last year and a decrease in dividen d payment in the amount of $28 million,
compared with the corresponding quarter last year.
Debt Movement
As at September 30, 2017, the net financial liabilities of ICL amounted to $3,264 million, a
decrease of $4 million compared with the balance at the end of 2016. The decrease of the net
financial liabilities derives mostly from the operating cash flow generated during the first nine
months of 2017, which was partially offset by the dividend payments in the amount of $181
million and from the exchange rate impact.
The total amount of the securitization framework and credit facility deriving therefrom amounts to
$350 million. As at September 30, 2017, ICL had used $340 million of the securitization facility.
ICL also has long-term credit facilities of $2,026 million and €60 million, of which $1,297 million
was unutilized as at September 30, 2017.
On November 1, 2017, Standard & Poor’s Global Ratings (“S&P”) has reaffirmed the company’s
international corporate credit rating at BBB- with a stable outlook. The local rating by S&P Maalot
was also reaffirmed at ilAA with a stable outlook. The above-mentioned ratings also apply to the
Company’s debentures.
As the date of the report, the Company is in compliance with the financial covenants stipulated in
its financing agreements.

57 Israel Chemicals Limited Q3 2017 Results
Critical Accounting Estimates
There were no material changes in our critical accounting estimates during the nine-month period
ended September 30, 2017.
Board of Directors and Senior Management Updates
On November 7, 2017, the Company’s Board of Directors approved the appointment of Mr. Lior
Reitblatt as a member of the Company’s Board of Directors. Mr. Reitblatt's service will be valid up
to the next General Meeting of the Company’s shareholders.
Risk Factors
In the nine-month period ended September 30, 2017, there were no material changes in the risk
factors previously disclosed in our Annual Report on Form 20-F for the year ended December 31,
2016.
Quantitative and Qualitative Exposures stemming from Market Risks
Reference is made to “Item 11 – Quantitative and Qualitative Disclosures about Market Risks” in
our Annual Report on Form 20-F for the year ended December 31, 2016.
Legal Proceedings
Derivative Actions
Pursuant to the resolution of ICL's Board dated December 15, 2016, the Company appointed a special
independent external committee (the “Special Committee”) to examine all aspects arising from the
application for certification of a derivative action regarding the annual bonuses paid to office holders
for the years 2014-2015 (the “Certification Application”). The Hon. Judge (ret.) Oded Mudrick was
appointed to head the Special Committee and the Special Committees’ other members are:
Prof. Sharon Hannes and Prof. Haim Assayag, CPA. For purposes of its operations, the Special
Committee appointed a legal advisor to accompany its work – Dr. Asaf Eckstein.
On April 18, 2017 the Special Committee submitted its report to the Board of Directors, wherein it
determined, among other things, that in its opinion the adjustments to the net profit as approved by
the Company’s Compensation Committee for the years 2014 and 2015 were duly made and in
accordance with the Company’s compensation policy. Therefore, the Company does not have a cause
of action against the directors who approved the bonus adjustments for the years 2014 and 2015, or
against the officers who received the bonuses due to the said adjustments. In light of the foregoing, it
would be improper for the Company to demand any restitution or reparation due to the events
specified in the Certification Application filed by the Applicant. Accordingly, the Committee
recommended that the Company oppose the Application filed with the Court by the Applicant.
58 Israel Chemicals Limited Q3 2017 Results
On April 26, 2017 the Company’s Board resolved to fully adopt the Special Committee's report and the
recommendation therein to deny the Applicant’s demand in the Certification Application and to
instruct the Company to file an objection to the Certification Application.
On May 11, 2017 the Applicant applied to Court, arguing that the Company is not permitted to attach
the Special Committee's report to its response. On June 6, 2017 the Company and the remaining
respondents submitted its response to the Certification Application. For cautionary purposes the
Special Committee's report was not attached to the Company’s response; however as part of the
Company’s response the Court was requested to allow submission of the Special Committee's report.
Investment treaty claim against Ethiopia
Further to Note 13 to the annual financial statements, and according to the announcement issued by
the Company on May 10, 2017, ICL Europe Coöperatief U.A. (“ICL Europe”), a subsidiary of the
Company, filed a claim under the Bilateral Investment Treaty (BIT) against the Federal Democratic
Republic of Ethiopia (“Ethiopia”) in relation to State violations of the Agreement on Encouragement
and Reciprocal Protection of Investments between the Ethiopia and the Netherlands. The violations
relate to, inter alia, the State's imposition of an illegal tax assessment against, and its failure to provide
infrastructure support to, Allana Potash Afar Plc, a second-tier subsidiary of ICL Europe .ICL Europe
filed the claim under the Arbitration Rules of the United Nations Commission on International Trade
Law (UNCITRAL), and requested the Permanent Court of Arbitration at The Hague to administer the
arbitration proceedings. On June 12, 2017, Ethiopia filed its response to the notice of arbitration. On
September 28, 2017, the process of appointing the three arbitrators that will administer the arbitration
proceedings was completed.
For further information regarding legal proceedings and other contingencies, see Note 6 to the
Company’s condensed consolidated interim financial statements as at September 30, 2017.
Other Information
Enhancement of resources availability for growth initiatives and/or debt leverage reduction
On June 22, 2017, the Company announced that as part of its plan for generating available
sources for financing additional investments, as well as to reduce its current leverage level, it is
exploring, among other things, various opportunities to divest subsidiaries and/or assets that have
a low synergy profile with ICL’s mineral chain and/or portfolio , in the amount of about $500
million or more. In the framework of the said plan, the Company signed an agreement for sale of
its holdings in IDE Technologies Ltd., constituting 50% of IDE’s share capital, in exchange for a
consideration of about $178 million subject to possible price adjustments deriving fr om the
occurrence of certain events prior to the closing of the transaction. In addition, the Company is
presently carrying on preliminary proceedings regarding the possibility of selling certain assets,
among other: Fire-Safety and Oil Additives, which are part of the Advanced Additives Business
Unit of the Specialty Solutions Division, as well as its holdings in the affiliated company
“Novetide”. At this stage, there is no certainty that the sale processes will proceed and there is no
certainty that the Company will enter into transactions for sale of the said assets, in whole or in
part, and/or for sale of its holdings in Novetide. For additional details – see Note 6 to the
Company’s condensed consolidated interim financial statements as at September 30, 2017 and the
Company’s Immediate Report dated October 19, 2017.
59 Israel Chemicals Limited Q3 2017 Results
Negotiations for Purchase of Natural Gas
On August 8, 2017, the Company gave notice that it signed a non-binding memorandum of
understanding (hereinafter – “the MOU”) with Energean Israel Limited (hereinafter – “Energean”),
a holder of interests in the Karish and Tanin gas fields (hereinafter – the “Gas Field”), further to
which the parties will conduct negotiations in contemplation of signing a detailed and binding
agreement for supply of natural gas (if signed), under which the Company will purchase natural
gas in the quantities and for the periods as will be agreed upon therein, for purposes of running
the power plant in Sodom and the Company’s other facilities in Israel. The MOU includes, among
others, the following provisions:
(A) the total quantity of gas the Company is anticipated to purchase from Energean is about
13 BCM with respect to the entire expected supply period (hereinafter – “the Total Contractual
Quantity”); (B) the supply period will commence on the date on which Energean commences
operation of the Gas Field, and is expected to end on the earlier of the date on which the Total
Contractual Quantity is consumed or after the passage of 15 years from the commencement date
of supply of the natural gas to the Company; if the Contractual Quantity is not fully consumed, the
parties may extend the period of the supply agreement (to the extent signed) for an additional
period, subject to compliance with the terms and targets as will be defined in the supply
agreement; (C) a “take or pay” payment mechanism for a minimum annual quantity of natural gas
in the amount and according to the mechanism that will be determined (D) the price of the
natural gas will be linked to the electricity generation component and will include a minimum
price; (E) the total financial scope of the purchase of gas from Energean by the Company, if and to
the extent the negotiations are successfully concluded and a detailed supply agreement is sig ned
in accordance with the MOU, may reach about $2 billion and depends, among other things, on
the changes in the electricity price to which the gas price is linked, and the total quantities
purchased by the Company in actuality during the period of the binding agreement; and (F) the
parties to the MOU have agreed that for a period of 180 days after signing the MOU Energean
will not engage in negotiations for the sale of gas which would hinder its ability to supply the gas
which is the subject of the MOU, while the Company has undertaken not to engage in
negotiations which would prevent it from being able to purchase the aforesaid quantity of gas
from Energean.
The negotiations with Energean were conducted jointly by the Company, Oil Refineries Ltd. (a
public company controlled by Israel Corporation Ltd. and OPC Energy Ltd. (a public company that
is controlled indirectly by one of the Company’s controlling shareholders) (h ereinafter – “the
Purchasers”), however each of the Purchasers signed a separate memorandum of understanding
with Energean. Only a non-binding memorandum of understanding is involved, and signing of an
agreement for supply of the gas and the actual supply of the gas in accordance therewith are
subject to, among other things, completion of the negotiations, signing a binding agreement,
receipt of all the required approvals, and meeting various milestones and preconditions, including
arrangement and supply of natural gas to the Company in a case where the Gas Field is ultimately
not developed. A binding agreement, if and to the extent signed, will require proper approval by
the Company’s authorized organs. As at the present time, there is no certainty regarding the
Company’s undertaking in a binding agreement or the terms of such binding agreemen t, to the
extent signed.
60 Israel Chemicals Limited Q3 2017 Results
Merger of PotashCorp And Agrium
Further to the Company’s report on September 8, 2017 regarding the proposed merger of Potash
Corporation of Saskatchewan Inc., (hereinafter – “PotashCorp”) (which holds shares of ICL), and
Agrium Inc. (hereinafter – “Agrium”), during the third quarter the above -mentioned companies
issued a press release wherein they announced that India has approved their proposed merger
transaction. The press release further stated that the approval will be condit ioned on the parties’
commitment to divest PotashCorp’s minority shareholdings in a number of companies, including
ICL, within a period of 18 months from October 18, 2017. In addition, the press release indicated
that the companies are permitted to consummate the merger prior to the divestments and that
they have already received unconditional clearance for the merger in Canada, Brazil and Russia,
and while the regulatory review and approval process is continuing in the U.S. and China the
parties expect to close the transaction by the end of the fourth quarter of 2017.