consolidated income statement - cki · consolidated income statement for the year ended 31st...
TRANSCRIPT

CONSOLIDATED INCOME STATEMENTfor the year ended 31st December
52 CHEUNG KONG INFRASTRUCTURE HOLDINGS LIMITED
HK$ million Notes 2009 2008
Group turnover 6 2,184 2,445
Share of turnover of jointly controlled entities 6 1,870 5,041
4,054 7,486
Group turnover 6 2,184 2,445
Other income 7 385 840
Operating costs 8 (2,078) (2,253)
Finance costs 9 (423) (481)
Exchange gain / (loss) 337 (631)
Gain on disposal of a subsidiary 10 1,314 108
Impairment losses 11 – (427)
Share of results of associates 3,398 3,864
Share of results of jointly controlled entities 455 978
Profit before taxation 12 5,572 4,443
Taxation 13 (2) (13)
Profit for the year 14 5,570 4,430
Attributable to:
Shareholders of the Company 5,568 4,423
Minority interests 2 7
5,570 4,430
Earnings per share 15 HK$2.47 HK$1.96

CONSOLIDATED STATEMENT OF COMPREHENSIVE INCOMEfor the year ended 31st December
53ANNUAL REPORT 2009
HK$ million 2009 2008
Profit for the year 5,570 4,430
Other comprehensive income
Surplus on revaluation of properties upon transfer to investment properties – 9
Gain / (Loss) from fair value changes of available-for-sale financial assets 387 (702)
(Loss) / Gain from fair value changes of derivatives designated as effective cash flow hedges (37) 286
(Loss) / Gain from fair value changes of derivatives designated as effective net investment hedges (740) 705
Actuarial losses of defined benefit retirement schemes (4) (36)
Exchange differences on translation of financial statements of foreign operations 1,609 (2,694)
Share of reserve movements of associates 1,681 (3,325)
Reserve released upon disposal of a subsidiary (12) (6)
Reserve released upon recognition of impairment losses against investments in securities – 427
Income tax relating to components of other comprehensive income (284) 720
Other comprehensive income for the year 2,600 (4,616)
Total comprehensive income for the year 8,170 (186)
Attributable to:
Shareholders of the Company 8,153 (193)
Minority interests 17 7
8,170 (186)
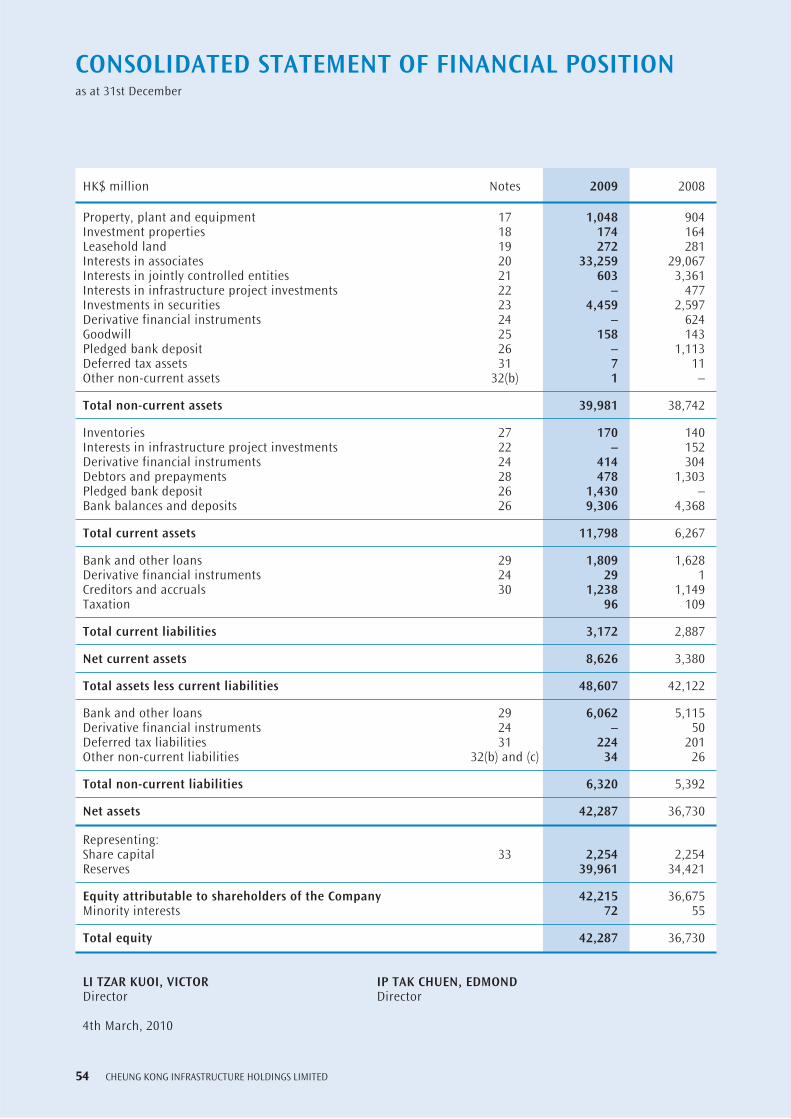
CONSOLIDATED STATEMENT OF FINANCIAL POSITIONas at 31st December
54 CHEUNG KONG INFRASTRUCTURE HOLDINGS LIMITED
HK$ million Notes 2009 2008
Property, plant and equipment 17 1,048 904Investment properties 18 174 164Leasehold land 19 272 281Interests in associates 20 33,259 29,067Interests in jointly controlled entities 21 603 3,361Interests in infrastructure project investments 22 – 477Investments in securities 23 4,459 2,597Derivative financial instruments 24 – 624Goodwill 25 158 143Pledged bank deposit 26 – 1,113Deferred tax assets 31 7 11Other non-current assets 32(b) 1 –
Total non-current assets 39,981 38,742
Inventories 27 170 140Interests in infrastructure project investments 22 – 152Derivative financial instruments 24 414 304Debtors and prepayments 28 478 1,303Pledged bank deposit 26 1,430 –Bank balances and deposits 26 9,306 4,368
Total current assets 11,798 6,267
Bank and other loans 29 1,809 1,628Derivative financial instruments 24 29 1Creditors and accruals 30 1,238 1,149Taxation 96 109
Total current liabilities 3,172 2,887
Net current assets 8,626 3,380
Total assets less current liabilities 48,607 42,122
Bank and other loans 29 6,062 5,115Derivative financial instruments 24 – 50Deferred tax liabilities 31 224 201Other non-current liabilities 32(b) and (c) 34 26
Total non-current liabilities 6,320 5,392
Net assets 42,287 36,730
Representing:Share capital 33 2,254 2,254Reserves 39,961 34,421
Equity attributable to shareholders of the Company 42,215 36,675Minority interests 72 55
Total equity 42,287 36,730
LI TZAR KUOI, VICTOR IP TAK CHUEN, EDMONDDirector Director
4th March, 2010

CONSOLIDATED STATEMENT OF CHANGES IN EQUITYfor the year ended 31st December
55ANNUAL REPORT 2009
Attributable to shareholders of the Company Property Investment Exchange Share Share Contributed revaluation revaluation Hedging translation Retained MinorityHK$ million capital premium surplus reserve reserve reserve reserve profits Sub-total interests Total
At 1st January, 2008 2,254 3,836 6,062 59 144 191 1,596 25,267 39,409 48 39,457
Profit for the year – – – – – – – 4,423 4,423 7 4,430Surplus on revaluation of properties upon transfer to investment properties – – – 9 – – – – 9 – 9Loss from fair value changes of available-for-sale financial assets – – – – (702) – – – (702) – (702)Gain from fair value changes of derivatives designated as effective cash flow hedges – – – – – 286 – – 286 – 286Gain from fair value changes of derivatives designated as effective net investment hedges – – – – – – 705 – 705 – 705Actuarial losses of defined benefit retirement schemes – – – – – – – (36) (36) – (36)Exchange differences on translation of financial statements of foreign operations – – – – – – (2,694) – (2,694) – (2,694)Share of reserve movements of associates – – – – – (1,313) (491) (1,521) (3,325) – (3,325)Reserves released upon disposal of a subsidiary – – – – – – (6) – (6) – (6)Reserve released upon recognition of impairment losses against available-for-sale financial assets – – – – 427 – – – 427 – 427Income tax relating to components of other comprehensive income – – – – 87 409 – 224 720 – 720
Total comprehensive income for the year – – – 9 (188) (618) (2,486) 3,090 (193) 7 (186)
Final dividend for the year 2007 paid – – – – – – – (1,871) (1,871) – (1,871)Interim dividend paid – – – – – – – (670) (670) – (670)
At 31st December, 2008 2,254 3,836 6,062 68 (44) (427) (890) 25,816 36,675 55 36,730Profit for the year – – – – – – – 5,568 5,568 2 5,570Gain from fair value changes of available-for-sale financial assets – – – – 387 – – – 387 – 387Loss from fair value changes of derivatives designated as effective cash flow hedges – – – – – (37) – – (37) – (37)Loss from fair value changes of derivatives designated as effective net investment hedges – – – – – – (740) – (740) – (740)Actuarial losses of defined benefit retirement schemes – – – – – – – (4) (4) – (4)Exchange differences on translation of financial statements of foreign operations – – – – – – 1,594 – 1,594 15 1,609Share of reserve movements of associates – – – – – 634 452 595 1,681 – 1,681Reserve released upon disposal of a subsidiary – – – – – – (12) – (12) – (12)Income tax relating to components of other comprehensive income – – – – (33) (200) – (51) (284) – (284)
Total comprehensive income for the year – – – – 354 397 1,294 6,108 8,153 17 8,170
Final dividend for the year 2008 paid – – – – – – – (1,889) (1,889) – (1,889)Interim dividend paid – – – – – – – (724) (724) – (724)
At 31st December, 2009 2,254 3,836 6,062 68 310 (30) 404 29,311 42,215 72 42,287

CONSOLIDATED STATEMENT OF CASH FLOWSfor the year ended 31st December
56 CHEUNG KONG INFRASTRUCTURE HOLDINGS LIMITED
HK$ million Notes 2009 2008
OPERATING ACTIVITIESCash from / (utilised in) operations 35(a) 1,626 (1,434)
Income taxes (paid) / recovered (8) 3
Net cash from / (utilised in) operating activities 1,618 (1,431)
INVESTING ACTIVITIESPurchases of property, plant and equipment (139) (91)
Disposals of property, plant and equipment 1 1
Acquisitions of associates (525) (833)
Return of capital from an associate 150 125
Disposal of a subsidiary 35(b) 5,467 106
Disposals of interests in an associate – 279
Advances to associates (8) (9)
Advances to jointly controlled entities (15) (47)
Repayment from a jointly controlled entity 4 –
Disposals of infrastructure project investments – 112
Purchases of securities (1,600) (623)
Disposals of securities 386 6
Loan note repayments of stapled securities 23 98
Dividends received from associates 2,271 2,187
Interest received 237 415
Net cash from investing activities 6,252 1,726
Net cash before financing activities 7,870 295
FINANCING ACTIVITIESNew bank and other loans 2,064 2,583
Repayments of bank and other loans (1,972) (2,589)
Bank deposit pledged – (1,113)
Finance costs paid (411) (484)
Dividends paid (2,613) (2,541)
Net cash utilised in financing activities (2,932) (4,144)
Net increase / (decrease) in cash and cash equivalents 4,938 (3,849)
Cash and cash equivalents at 1st January 4,368 8,217
Cash and cash equivalents at 31st December 26 9,306 4,368

NOTES TO THE CONSOLIDATED FINANCIAL STATEMENTS
57ANNUAL REPORT 2009
1. GENERAL
The Company is a limited liability company incorporated in Bermuda and its shares are listed on The Stock Exchange of Hong Kong Limited (“Hong Kong Stock Exchange”). The addresses of its registered office and principal place of business are disclosed in the section headed “Corporate Information” of the Group’s Annual Report. The Directors consider that the Company’s ultimate holding company is Hutchison Whampoa Limited, a company incorporated in Hong Kong with limited liability, the shares of which are listed on Hong Kong Stock Exchange.
The consolidated financial statements are presented in Hong Kong dollars, which is the same as the functional currency of the Company.
The Group’s principal activities are the development, investment and operation of infrastructure businesses in Hong Kong, Mainland China, Australia, the United Kingdom, Canada, New Zealand and the Philippines.
2. CHANGES IN ACCOUNTING POLICIES
In the current year, the Group has adopted a number of new and revised Hong Kong Financial Reporting Standards (“HKFRSs”) issued by the Hong Kong Institute of Certified Public Accountants (“HKICPA”) that are effective to the Group for accounting periods beginning on or after 1st January, 2009. The adoption of those HKFRSs has no material impact on the Group’s results and financial position for the current or prior years, and does not result in any significant changes in the accounting policies of the Group. Nevertheless, certain changes in presentation and disclosures have been adopted by the Group in compliance with the following new and revised HKFRSs:
(a) HKAS 1 (Revised) “Presentation of Financial Statements” – Certain terminology changes (including revised titles for the consolidated financial statements) and changes in presentation and disclosure are introduced without any impact on the Group’s results and financial position.
(b) HKFRS 7 (Amendment) “Improving Disclosures about Financial Instruments” – Disclosures required in respect of fair value measurements and liquidity risk (note 5) are expanded without any impact on the Group’s results and financial position. The Group has elected not to provide comparative information for these expanded disclosures in the current year in accordance with the transitional reliefs offered in the amendment.
(c) HKFRS 8 “Operating Segments” – A redesignation of certain reportable segments of the Group (note 14) is resulted without any impact on the Group’s results and financial position.

NOTES TO THE CONSOLIDATED FINANCIAL STATEMENTS
58 CHEUNG KONG INFRASTRUCTURE HOLDINGS LIMITED
2. CHANGES IN ACCOUNTING POLICIES (CONT’D)
The Group has not early adopted the following new and revised HKFRSs issued by HKICPA that are effective to the Group for the accounting periods beginning on or after 1st January, 2010. The Directors anticipate that the adoption of these HKFRSs will have no material impact on the results and financial position of the Group.
HKFRSs (Amendments) Amendment to HKFRS 5 as part of Improvements to HKFRSs issued in 2008
HKFRSs (Amendments) Improvements to HKFRSs issued in 2009HKAS 24 (Revised) Related Party DisclosuresHKAS 27 (Revised) Consolidated and Separate Financial StatementsHKAS 32 (Amendment) Classification of Rights IssuesHKAS 39 (Amendment) Eligible Hedged ItemsHKFRS 1 (Amendment) Additional Exemptions for First-time AdoptersHKFRS 1 (Amendment) Limited Exemption from Comparative HKFRS 7
Disclosures for First-time AdoptersHKFRS 2 (Amendment) Group Cash-settled Share-based Payment TransactionsHKFRS 3 (Revised) Business CombinationsHKFRS 9 Financial InstrumentsHK (IFRIC) – Int 14 (Amendment) Prepayments of a Minimum Funding RequirementHK (IFRIC) – Int 17 Distributions of Non-cash Assets to OwnersHK (IFRIC) – Int 19 Extinguishing Financial Liabilities with Equity Instruments

59ANNUAL REPORT 2009
3. PRINCIPAL ACCOUNTING POLICIES
The consolidated financial statements have been prepared in accordance with HKFRSs issued by HKICPA. In addition, the consolidated financial statements include applicable disclosures required by the Rules Governing the Listing of Securities on Hong Kong Stock Exchange and by the Hong Kong Companies Ordinance.
The consolidated financial statements have been prepared on the historical cost basis except for certain properties and financial instruments, which are measured at fair values, as explained in the principal accounting policies set out below.
(a) Basis of Consolidation
The consolidated financial statements include the financial statements of the Company and its subsidiaries made up to the year together with the Group’s interests in associates and jointly controlled entities on the basis set out in (d) below.
The results of subsidiaries, associates and jointly controlled entities acquired or disposed of during the year are included in the consolidated income statement from the effective dates of acquisitions or up to the effective dates of disposals, as appropriate.
(b) Goodwill
Goodwill represents the excess of costs of acquisition over the net fair value of the Group’s share of the identifiable assets, liabilities and contingent liabilities of the subsidiaries, associates and jointly controlled entities acquired. Goodwill is recognised as an asset less any identified impairment loss.
The Group has applied the relevant transitional provisions in HKFRS 3 “Business Combination”. Goodwill recognised in reserves prior to 1st January, 2001 continues to be held in the reserves and are transferred to retained profits when the business to which the goodwill relates is disposed of or becomes impaired.
For the purpose of impairment testing, goodwill is allocated to each of the Group’s cash-generating units expected to benefit from the synergies of the business acquisition. Cash-generating units to which goodwill has been allocated are tested for impairment annually, or more frequently when there is an indication that the unit may be impaired. If the recoverable amount of the cash-generating unit is less than the carrying amount of the unit, the impairment loss is allocated first to reduce the carrying amount of any goodwill allocated to the unit and then to the other assets of the unit pro-rata on the basis of the carrying amount of each asset in the unit. An impairment loss recognised for goodwill is not reversed in subsequent periods.
On disposal of a subsidiary, associate, jointly controlled entity or relevant cash-generating unit, the attributable amount of goodwill is included in the determination of the gain or loss on disposal.
NOTES TO THE CONSOLIDATED FINANCIAL STATEMENTS
60 CHEUNG KONG INFRASTRUCTURE HOLDINGS LIMITED
3. PRINCIPAL ACCOUNTING POLICIES (CONT’D)
(c) Subsidiaries
A subsidiary is an entity that is controlled by the Company. Control is achieved where the Company has the power to govern the financial and operating policies of such entity so as to obtain benefits from its activities.
The acquisition of a subsidiary is accounted for using the purchase method. The cost of the acquisition is measured at the aggregate of the fair values, at the date of exchange, of assets given, liabilities incurred or assumed, and equity instruments issued by the Group in exchange for control of the acquiree, plus any costs directly attributable to the business combination. The acquiree’s identifiable assets, liabilities and contingent liabilities, where appropriate, are recognised at their fair values at the acquisition date.
(d) Associates and Jointly Controlled Entities
An associate is a company, other than a subsidiary or jointly controlled entity, in which the Group has a long-term equity interest and over which the Group is in a position to exercise significant influence over its management, including participation in the financial and operating policy decisions.
A joint venture is a contractual arrangement whereby the venturers undertake an economic activity which is subject to joint control and over which none of the participating parties has unilateral control. A jointly controlled entity is the joint venture which involves the establishment of a separate entity.
The results and assets and liabilities of associates/jointly controlled entities are incorporated in the Group’s financial statements using the equity method of accounting. Under the equity method, investments in associates/jointly controlled entities are carried in the consolidated statement of financial position at cost as adjusted for post-acquisition changes in the Group’s share of the net assets of the associates/jointly controlled entities, less impairment in the values of individual investments.
Losses of an associate/jointly controlled entity in excess of the Group’s interest in that associate/jointly controlled entity (which includes any long-term interests that, in substance, form part of the Group’s investment in the associate/jointly controlled entity) are not recognised.

61ANNUAL REPORT 2009
3. PRINCIPAL ACCOUNTING POLICIES (CONT’D)
(e) Property, Plant and Equipment
Property, plant and equipment are stated at cost less accumulated depreciation and any impairment losses. The cost of an asset comprises its purchase price and any directly attributable costs of bringing the asset to its working condition and location for its intended use.
Depreciation of property, plant and equipment is provided to write off their depreciable amounts over their estimated useful lives using the straight-line method, at the following rates per annum:
Buildings 11/4% to 31/3% or over the unexpired lease terms of the land, whichever is the higher
Mains, pipes, other 31/3% to 331/3% plant and machinery
Furniture, fixtures and others 5% to 331/3%
When an asset is disposed of or retired, any gain or loss, representing the difference between the carrying value and the sales proceeds, if any, is included in the consolidated income statement.
(f) Investment Property
Investment property, which is property held to earn rentals and/or for capital appreciation, is stated at its fair value at the end of the reporting period. Gains or losses arising from changes in the fair values of investment properties are recognised in the consolidated income statement for the period in which they arise.
(g) Leasehold Land
Leasehold land is classified as prepaid operating leases and is amortised and recognised in the consolidated income statement over the unexpired lease terms using the straight-line method.
(h) Inventories
Inventories are stated at the lower of cost, computed on a weighted-average or a first-in first-out basis as appropriate, and net realisable value. Cost includes cost of purchase and where applicable, cost of conversion and other costs that have been incurred in bringing the inventories to their present location and condition. Net realisable value is determined on the basis of anticipated sales proceeds less estimated costs to completion and selling expenses.

NOTES TO THE CONSOLIDATED FINANCIAL STATEMENTS
62 CHEUNG KONG INFRASTRUCTURE HOLDINGS LIMITED
3. PRINCIPAL ACCOUNTING POLICIES (CONT’D)
(i) Contract Work
When the outcome of a contract can be estimated reliably, revenue and costs associated with the contract are recognised as revenue and expenses respectively by reference to the stage of completion of the contract activity at the end of the reporting period, that is the proportion that contract costs incurred for work performed to date bears to the estimated total contract costs.
When the outcome of a contract cannot be estimated reliably, contract revenue is recognised only to the extent of contract costs incurred that will probably be recoverable.
When it is probable that total contract costs will exceed total contract revenue, the expected loss is recognised as an expense immediately.
(j) Financial Instruments
Interests in infrastructure project investments
Investments in joint ventures are classified as infrastructure project investments, where the Group’s return is predetermined in accordance with the provisions of the relevant agreements and the venturers’ share of net assets are not in proportion to their capital contribution ratios but are as defined in the contracts and in respect of which the Group is not entitled to share the assets at the end of the investment periods.
The Group’s interests in the infrastructure project investments, classified as loans and receivables in accordance with HKAS 39, are stated at amortised cost using effective interest method. The carrying amount of such interests is reduced to recognise any identified impairment losses of individual investments.
Investments in securities
The Group’s investments in securities are classified as either available-for-sale financial assets, which are measured at fair value or at cost when the fair value cannot be measured reliably, or financial assets at fair value through profit or loss which are measured at fair value.
The Group designates the securities intended to be held for long term strategic purposes as available-for-sale financial assets. Gains and losses arising from changes in fair values of these assets are dealt with as movements in investment revaluation reserve, until the assets are disposed of or are determined to be impaired, at which time the cumulative gains or losses previously recognised in the reserve is included in the consolidated income statement for the period. When a significant or prolonged decline in the fair value of an available-for-sale financial asset has been identified, the cumulative loss that had been recognised directly in equity shall be removed from equity and recognised in the consolidated income statement even though the financial asset has not been disposed of. Impairment losses recognised in the consolidated income statement for equity or stapled securities classified as available-for-sale financial assets are not subsequently reversed in the consolidated income statement.

63ANNUAL REPORT 2009
3. PRINCIPAL ACCOUNTING POLICIES (CONT’D)
(j) Financial Instruments (Cont’d)
Investments in securities (Cont’d)
Securities which are managed and their performances are evaluated based on a fair value basis are designated as financial assets at fair value through profit or loss. The management considers that such designation is appropriate given that the basis of internal risk assessments and performance evaluations on these assets is different from other investments and assets of the Group. Gains and losses arising from changes in fair values of these assets are dealt with in the consolidated income statement. The relevant dividend or interest accrued on the financial assets are also recognised in the consolidated income statement.
Derivative financial instruments and hedge accounting
Derivative financial instruments are initially measured at fair values on the dates at which the contracts are entered into, and are remeasured to their fair values at subsequent reporting dates.
Changes in the fair values of derivative financial instruments that are designated as effective in hedging future cash flows are recognised directly in hedging reserve. Amount deferred in the equity are recycled in profit or loss in the periods when the hedged item is recognised in profit or loss. Any ineffective portion is recognised immediately in the consolidated income statement.
Changes in fair values of derivative financial instruments that are designated and qualify as net investment hedges are recognised directly in exchange translation reserve. Any ineffective portion is recognised immediately in the consolidated income statement.
Changes in the fair values of derivative financial instruments that do not qualify for hedge accounting are recognised in the consolidated income statement.
Hedge accounting is discontinued when the hedging instrument expires or is sold, terminated, or exercised, or the hedge no longer qualifies for hedge accounting. Any cumulative gain or loss deferred in equity at that time remains in equity and is recognised when the hedged risk associated with the hedged item is ultimately recognised in profit or loss. The cumulative gain or loss that was deferred in equity is recognised immediately in profit or loss when a forecast transaction is no longer expected to occur in relation to hedging of a forecast transaction.
Debtors
Debtors are classified as loans and receivables in accordance with HKAS 39, and are initially measured at fair value and subsequently measured at amortised cost using the effective interest method. Appropriate allowances for estimated irrecoverable amounts are recognised in the consolidated income statement when there is objective evidence that the assets are impaired.
NOTES TO THE CONSOLIDATED FINANCIAL STATEMENTS
64 CHEUNG KONG INFRASTRUCTURE HOLDINGS LIMITED
3. PRINCIPAL ACCOUNTING POLICIES (CONT’D)
(j) Financial Instruments (Cont’d)
Cash and cash equivalents
Cash and cash equivalents are classified as loans and receivables in accordance with HKAS 39, and comprise cash on hand and demand deposits, and other short-term highly liquid investments that are readily convertible to a known amount of cash and are subject to an insignificant risk of changes in value.
Bank and other loans
Interest-bearing bank and other loans are initially measured at fair values, and are subsequently measured at amortised cost, using the effective interest method.
Creditors
Creditors are initially measured at fair value and subsequently measured at amortised cost, using the effective interest method.
Equity instruments
Equity instruments issued by the Company are recorded at the proceeds received, net of direct issue costs.
Financial guarantee contracts
A financial guarantee contract is a contract that requires the issuer to make specified payments to reimburse the holder for a loss it incurs because a specified debtor fails to make payment when due in accordance with the original or modified terms of a debt instrument. A financial guarantee contract issued by the Group, which is not designated as a fair value through profit or loss, is recognised initially at its fair value less transaction costs directly attributable to the issue of the financial guarantee contract.
Fair value
Fair value of financial assets and financial liabilities with standard terms and conditions and traded on active liquid markets are determined with reference to quoted market prices. Fair value of derivative financial instruments and certain available-for-sale financial assets not traded on active liquid markets are determined with reference to fair value estimated by independent professionals or the present value of the estimated future cash flows discounted at the effective interest rate.

65ANNUAL REPORT 2009
3. PRINCIPAL ACCOUNTING POLICIES (CONT’D)
(k) Revenue Recognition
Sales of goods
Revenue from sales of goods is recognised at the time when the goods are delivered or title to the goods passes to the customers. Revenue is measured at the fair value of the consideration received or receivable and is arrived at after deduction of any sales returns and discounts and taxes.
Return from infrastructure project investments
Return from infrastructure project investments is accrued on a time basis, by reference to the carrying amount and at the effective interest rate applicable, which is the rate that exactly discounts estimated future cash receipts through the expected life of the infrastructure project to that project’s net carrying amount at initial recognition.
Interest income
Interest income from a financial asset excluding financial assets at fair value through profit or loss is accrued on a time basis, by reference to the principal outstanding and at the effective interest rate applicable, which is the rate that exactly discounts estimated future cash receipts through the expected life of the financial asset to that asset’s net carrying amount.
Income from investments in securities
Dividend and interest income from investments in securities are recognised when the Group’s right to receive payment is established.
Contract revenue
Income from contracts is recognised according to the stage of completion.
(l) Foreign Currencies
The individual financial statements of each group entity is prepared and presented in the currency of the primary economic environment in which the entity operates (“functional currency”). For the purpose of the consolidated financial statements, the result and financial position of each entity are presented in Hong Kong dollars, which is the functional currency of the Company and the presentation currency for the consolidated financial statements.

NOTES TO THE CONSOLIDATED FINANCIAL STATEMENTS
66 CHEUNG KONG INFRASTRUCTURE HOLDINGS LIMITED
3. PRINCIPAL ACCOUNTING POLICIES (CONT’D)
(l) Foreign Currencies (Cont’d)
In preparing the financial statements of the individual entities, transactions in currencies other than the entity’s functional currency (“foreign currencies”) are recorded at the rates of exchange prevailing on the dates of the transactions. At the end of the reporting period, monetary items denominated in foreign currencies are retranslated at the rates prevailing at that date. Non-monetary items carried at fair value that are denominated in foreign currencies are retranslated at the rates prevailing on the date when the fair value was determined. Non-monetary items that are measured in terms of historical cost in a foreign currency are not retranslated.
Exchange differences arising on the settlement of monetary items, and on the retranslation of monetary items, are included in the consolidated income statement for the year, except for exchange differences arising on a monetary item that forms part of the Group’s net investment in a foreign operation, in which case, such exchange differences are recognised directly in equity. Exchange differences arising on the retranslation of non-monetary items carried at fair values are included in the consolidated income statement for the year except for differences arising on the retranslation of non-monetary items in respect of which gains and losses are recognised directly in equity. For such non-monetary items, any exchange component of that gain or loss is also recognised directly in other comprehensive income and accumulated in equity.
For the purpose of presenting consolidated financial statements, the assets and liabilities of the Group’s foreign operations are translated into Hong Kong dollars using exchange rates prevailing at the end of the reporting period. Income and expense items are translated at the average exchange rates for the year, unless exchange rates fluctuated significantly during that year, in which case the exchange rates at the dates of the transactions are used. Exchange differences arising, if any, are classified as equity and transferred to the Group’s exchange translation reserve. Such translation differences are recognised in the consolidated income statement in the year in which the foreign operation is disposed of.
Goodwill and fair value adjustments arising on the acquisition of a foreign operation are treated as assets and liabilities of the foreign operation and translated at the rate of exchange prevailing at the end of the reporting period. Exchange differences arising are recognised in the exchange translation reserve.

67ANNUAL REPORT 2009
3. PRINCIPAL ACCOUNTING POLICIES (CONT’D)
(m) Taxation
Hong Kong Profits Tax is provided for at the prevailing rate on the estimated assessable profits less available tax relief for losses brought forward of each individual company comprising the Group. Overseas tax is provided for at the applicable local rates on the estimated assessable profits less available tax losses of the individual company concerned.
Deferred tax is provided using balance sheet liability method, on all temporary differences arising between the carrying amounts of assets and liabilities in the financial statements and the corresponding tax bases used in the computation of taxable profit of the corresponding year. Deferred tax liabilities are generally recognised for all taxable temporary differences, and deferred tax assets are recognised to the extent that it is probable that taxable profits will be available against which deductible temporary differences can be utilised. Such assets and liabilities are not recognised if the temporary difference arises from goodwill or from the initial recognition (other than in a business combination) of other assets and liabilities in a transaction that affects neither the taxable profit nor the accounting profit.
Deferred tax liabilities are recognised for taxable temporary differences arising on investments in subsidiaries, associates and joint ventures, except where the Group is able to control the reversal of the temporary difference and it is probable that the temporary difference will not reverse in the foreseeable future.
The carrying amount of deferred tax assets is reviewed at the end of the reporting period and reduced to the extent that it is no longer probable that sufficient taxable profits will be available to allow all or part of the assets to be recovered.
Deferred tax is calculated at the tax rates that are expected to apply in the year when the liability is settled or the asset is realised. Deferred tax is charged or credited in the income statement, except when it relates to items charged or credited directly to equity, in which case the deferred tax is also dealt with in equity.
(n) Operating Leases
Leases where substantially all the risks and rewards of ownership of assets remain with the lessors are accounted for as operating leases. Rentals payable under operating leases are recorded in the consolidated income statement on a straight-line basis over the respective lease terms.
NOTES TO THE CONSOLIDATED FINANCIAL STATEMENTS
68 CHEUNG KONG INFRASTRUCTURE HOLDINGS LIMITED
3. PRINCIPAL ACCOUNTING POLICIES (CONT’D)
(o) Finance Leases
Leases that transfer substantially all the risks and rewards of ownership of the leased assets to the lessees are accounted for as finance leases.
The amounts due from the lessees under finance lease contracts are recorded as finance lease debtors. The finance lease debtors comprise the gross investment in leases less unearned finance lease income allocated to future accounting periods. The unearned finance lease income is allocated to future accounting periods so as to reflect constant periodic rates of return on the Group’s net investments outstanding in respect of the leases.
Assets held under finance leases are recognised as assets at their fair values or, if lower, at the present value of the minimum lease payment at the dates of inception. The corresponding liabilities to the lessor are shown within bank and other loans in the consolidated statement of financial position as obligations under finance leases. Finance costs are charged to the consolidated income statement over the terms of the relevant leases so as to produce a constant periodic rate of charge on the remaining balance of the obligations for each accounting period.
(p) Employee Retirement Benefits
The Group operates defined contribution and defined benefit retirement plans for its employees.
The costs of defined contribution plans are charged to the consolidated income statement as and when employees have rendered service entitling them to the contributions.
The cost of providing retirement benefits under the Group’s defined benefit retirement plans is determined using the projected unit credit method, with actuarial valuations being carried out annually. Actuarial gains and losses of defined benefit retirement plans are recognised immediately in full in the period in which they occur, outside profit or loss, in equity. Past service cost is recognised immediately to the extent that the benefits are already vested, and otherwise is amortised on a straight-line basis over the average period until the amended benefits become vested. The amount recognised in the consolidated statement of financial position represents the present value of the defined benefit obligation as adjusted for unrecognised past service cost and as reduced by the fair value of plan assets. Any assets resulting from this calculation are limited to past service cost plus the present value of available refunds and reductions in future contributions to the plans.

69ANNUAL REPORT 2009
3. PRINCIPAL ACCOUNTING POLICIES (CONT’D)
(q) Borrowing Costs
Borrowing costs are expensed in the consolidated income statement in the year in which they are incurred, except to the extent that they are capitalised as being directly attributable to the financing of certain infrastructure projects considered as qualified assets up to the commencement of revenue contribution or upon commencement of operation of the projects, whichever is the earlier.
4. KEY SOURCES OF ESTIMATION UNCERTAINTY
The key assumption concerning the future, and other key sources of estimation uncertainty at 31st December, 2009, that have a significant risk of causing a material adjustment to the carrying amounts of assets and liabilities within the next financial year, is impairment of property, plant and equipment. Property, plant and equipment are tested for impairment if there is any indication that the carrying value of these assets may not be recoverable and the assets are subject to an impairment loss. The recoverable amount is the higher of an asset’s fair value less costs to sell and value in use. The value in use calculation requires the Group to estimate the future cash flows expected to arise from the relevant cash-generating unit and a suitable discount rate is used in order to calculate the present value. The carrying value of property, plant and equipment as at 31st December, 2009 is HK$1,048 million (2008: HK$904 million).
5. FINANCIAL RISK MANAGEMENT OBJECTIVES AND POLICIES
The Group’s major financial instruments include interests in infrastructure project investments, investments in securities, derivative financial instruments, bank balances and deposits, bank and other loans, and debtors and creditors. Details of these financial instruments are disclosed in the respective notes. The risks associated with these financial instruments and the policies on how to mitigate these risks are set out below. The management manages and monitors these exposures to ensure appropriate measures are implemented on a timely and effective manner.
(a) Currency Risk
The Group is exposed to currency risk primarily arising from foreign investments and borrowings denominated in currencies other than the functional currency of individual subsidiaries, which accounted for 34 per cent of the Group’s borrowings (2008: 37 per cent). The Group generally hedges those investments with the appropriate level of borrowings denominated in the local currencies of relevant countries. The Group also entered into currency swaps to hedge most foreign investments financed by internal resources. Given this, the management considers that the net exposure to currency risk is kept to an appropriate level. Details of the currency swaps entered into by the Group at the end of the reporting period are set out in note 24.
The Group is also exposed to currency risk arising from bank deposits denominated in foreign currencies, which accounted for 96 per cent of the Group’s bank balances and deposits at the end of the reporting period (2008: 84 per cent). Those bank balances and deposits are mainly denominated in United States dollars, Australian dollars, Pounds sterling, Canadian dollars and New Zealand dollars. The management maintains the portfolio of bank deposits denominated in different currencies and the exposure to currency risk is kept to an appropriate level.

NOTES TO THE CONSOLIDATED FINANCIAL STATEMENTS
70 CHEUNG KONG INFRASTRUCTURE HOLDINGS LIMITED
5. FINANCIAL RISK MANAGEMENT OBJECTIVES AND POLICIES (CONT’D)
(a) Currency Risk (Cont’d)
Sensitivity analysis
The following table indicates the approximate change in the Group’s profit for the year and other comprehensive income in response to a 10 per cent strengthening in foreign currencies (except for United States dollars) against Hong Kong dollars to which the Group has significant exposure related to monetary items and derivative financial instruments in existence at the end of the reporting period:
2009 2008 Effect on other Effect on other Effect on profit comprehensive Effect on profit comprehensive for the year income for the year income increase/ increase/ increase/ increase/HK$ million (decrease) (decrease) (decrease) (decrease)
Australian dollars 242 123 143 55
Pounds sterling 3 (43) 31 (40)
Japanese yen (266) – (253) –
Canadian dollars 21 (1) 7 –
New Zealand dollars 8 80 4 65
A 10 per cent weakening in the above foreign currencies against Hong Kong dollars would have had an equal but opposite effect on the Group’s profit for the year and other comprehensive income.
The sensitivity analysis has been determined assuming that the change in foreign exchange rates had occurred at the end of the reporting period and had been applied to each of the Group’s entities exposure to currency risk for both monetary items and derivative financial instruments in existence at that date, and that all other variables, in particular interest rates, remain constant.
The stated changes represent management’s assessment of reasonably possible changes in foreign exchange rates over the period until the end of the next reporting period. In this respect, the management does not expect any significant movements in the pegged rate of 7.8 between the United States dollars and Hong Kong dollars. It is also assumed that such pegged rate would be materially unaffected by any changes in movement in value of the United States dollars against other currencies. The analysis was performed on the same basis for 2008.

71ANNUAL REPORT 2009
5. FINANCIAL RISK MANAGEMENT OBJECTIVES AND POLICIES (CONT’D)
(b) Interest Rate Risk
The Group’s interest rate risk relates primarily to floating rate borrowings and deposits. In relation to these floating rate borrowings, the management aims at keeping borrowings at fixed rates at appropriate level by entering into interest rate swaps. In order to achieve this result, the Group entered into interest rate swaps to hedge against certain exposures to changes in interest rates of the borrowings. The management adopts a policy of ensuring that all the material net borrowings of the Group are effectively on a fixed rate basis, either through the contractual terms of the loan facilities agreements or through the use of interest rate swaps. For this purpose, the “net borrowings” represent interest-bearing borrowings less cash deposits (if any) financed by the aforesaid borrowings.
Details of the Group’s interest rate swaps and borrowings entered into by the Group at the end of the reporting period are set out in notes 24 and 29, respectively.
Sensitivity analysis
At 31st December, 2009, it is estimated that a general increase of 100 basis points in interest rates, with all other variables held constant, would increase the Group’s profit for the year by HK$96 million (2008: HK$44 million). Other comprehensive income would increase by HK$3 million (2008: HK$14 million) in response to the general increase in interest rates. A decrease of 100 basis points in interest rate would have had an equal but opposite effect on the Group’s profit for the year and other comprehensive income.
The sensitivity analysis above has been determined assuming that the change in interest rates had occurred at the end of the reporting period and had been applied to the exposure to interest rate risk for both derivative and non-derivative financial instruments in existence at that date. The 100 basis point increase represents management’s assessment of a reasonably possible change in interest rates over the period until the end of the next reporting period. The analysis was performed on the same basis for 2008.

NOTES TO THE CONSOLIDATED FINANCIAL STATEMENTS
72 CHEUNG KONG INFRASTRUCTURE HOLDINGS LIMITED
5. FINANCIAL RISK MANAGEMENT OBJECTIVES AND POLICIES (CONT’D)
(c) Credit Risk
The Group’s credit risk is primarily attributable to interests in infrastructure project investments, debt securities investments, derivative financial instruments entered into for hedging purposes, bank balances and deposits, trade debtors and other receivables.
In respect of interests in infrastructure project investments, trade debtors and other receivables, local management teams of subsidiaries are responsible for monitoring the procedures to ensure that follow-up actions are taken to recover overdue debts of the subsidiaries. In addition, the teams review the recoverable amount of each individual debt at the end of the reporting period to ensure that adequate impairment losses are made for irrecoverable amounts. Normally, the Group does not obtain collateral covering the outstanding balances.
Debt securities investments are normally in liquid securities quoted on a recognised stock exchange or financial institutions with high credit standing, except where entered into for long term strategic purposes. Transactions involving derivative financial instruments and liquid funds are also with banks or financial institutions of high credit standing.
The Group’s maximum exposure to credit risk in the event of the counterparties’ failure to perform their obligations at the end of the reporting period in relation to each class of recognised financial assets is the carrying amount of those assets as stated in the consolidated statement of financial position. Except for the guarantees given by the Group as set out in note 38, the Group does not provide any other guarantees which would expose the Group to credit risk. The maximum exposure to credit risk in respect of these guarantees at the end of the reporting period is disclosed in note 38.
Further quantitative disclosures in respect of the Group’s exposure to credit risk arising from trade debtors and other receivables are set out in note 28.
The Group has no significant concentration of credit risk, with exposure spread over a number of counterparties and customers.
(d) Liquidity Risk
The Group’s treasury activities are centralised to achieve better risk control and minimise the cost of funds. Cash is generally placed in short-term deposits mostly denominated in United States dollars, Hong Kong dollars, Australian dollars, Pounds sterling, Canadian dollars and New Zealand dollars. The management aims to maintain a balance between continuity of adequate funding and the flexibility through the use of bank and other borrowings. The Group’s liquidity and financing requirements are reviewed regularly to mitigate the effects of fluctuations in cash flows. The management will consider new financing while maintaining appropriate gearing for new investments and refinancing of existing debts.

73ANNUAL REPORT 2009
5. FINANCIAL RISK MANAGEMENT OBJECTIVES AND POLICIES (CONT’D)
(d) Liquidity Risk (Cont’d)
The following table details the remaining contractual maturities at the end of the reporting period of the Group’s non-derivative financial liabilities and derivative financial liabilities, which are based on contractual undiscounted cash flows (including interest payments computed using contractual rates or, if floating, based on rates current at the end of the reporting period) and the earliest date the Group can be required to pay:
2009 2008 Total More than More than Total More than More than contractual Within 1 1 year but 2 years but More contractual Within 1 1 year but 2 years but More Carrying undiscounted year or on less than less than than Carrying undiscounted year or on less than less than than HK$ million amount cash flows demand 2 years 5 years 5 years amount cash flows demand 2 years 5 years 5 years
Unsecured bank loans 3,649 3,969 495 1,357 2,106 11 3,069 3,289 1,727 376 1,176 10
Secured bank loan 1,463 1,509 1,460 3 9 37 1,145 1,227 85 1,142 – –
Obligations under finance leases 113 132 27 25 66 14 31 36 8 7 16 5
Unsecured notes 2,646 4,704 93 93 278 4,240 2,498 4,526 87 87 262 4,090
Trade creditors 143 143 143 – – – 139 139 139 – – –
Other payables and accruals 240 240 240 – – – 432 432 432 – – –
8,254 10,697 2,458 1,478 2,459 4,302 7,314 9,649 2,478 1,612 1,454 4,105
Derivatives settled gross:
Forward foreign exchange contracts held as cash flow or net investment hedging instruments (note 24):
– outflow 7,009 6,960 6,960 – – – 5,704 5,813 3,351 2,462 – –
– inflow (7,413) (7,416) (7,416) – – – (6,631) (6,666) (3,621) (3,045) – –
(404) (456) (456) – – – (927) (853) (270) (583) – –
NOTES TO THE CONSOLIDATED FINANCIAL STATEMENTS
74 CHEUNG KONG INFRASTRUCTURE HOLDINGS LIMITED
5. FINANCIAL RISK MANAGEMENT OBJECTIVES AND POLICIES (CONT’D)
(e) Other Price Risk
The Group is exposed to other price risk through its investments in securities as set out in note 23. The management manages this exposure by maintaining a portfolio of investments with different risks. For strategic purposes, the Group holds primarily equity or debt instruments operating in energy or transportation sectors.
Sensitivity analysis
At 31st December, 2009, it is estimated that a 5 per cent decrease in the prices of the respective instruments, with all other variables held constant, would decrease the Group’s profit for the year by HK$97 million (2008: HK$46 million). Other comprehensive income would decrease by HK$91 million (2008: HK$58 million) in response to the decrease in the prices. A 5 per cent increase in prices would have had an equal but opposite effect on the Group’s profit for the year and other comprehensive income.
The sensitivity analysis above has been determined assuming that the change in prices had occurred at the end of the reporting period and had been applied to the exposure to price risk for the Group’s investments in securities in existence at that date (as set out in note 23). The 5 per cent decrease in prices represents management’s assessment of a reasonably possible change in the prices of those instruments over the period until the end of the next reporting period. The analysis is performed on the same basis for 2008.
(f) Fair Value
Except for certain investments in securities which are stated at cost, the carrying values of all financial assets and financial liabilities approximate to their fair values.
Effective from 1st January, 2009, the Group has adopted HKFRS 7 (Amendment) “Improving Disclosures about Financial Instruments” for the financial instruments that are measured in the consolidated statement of financial position at fair value. These financial instruments are grouped into level 1 to 3 based on the degree to which the fair value is observable:
– Level 1: Quoted prices (unadjusted) in active markets for identical assets or liabilities.
– Level 2: Inputs other than quoted prices included within level 1 that are observable for asset or liability, either directly (i.e. as prices) or indirectly (i.e. derived from prices).
– Level 3: Inputs for the asset or liability that are not based on observable market data (unobservable inputs).

75ANNUAL REPORT 2009
5. FINANCIAL RISK MANAGEMENT OBJECTIVES AND POLICIES (CONT’D)
(f) Fair Value (Cont’d)
The following table provides an analysis of the Group’s financial instruments that are measured at fair value at the end of the reporting period:
Assets measured at fair value
HK$ million Level 1 Level 2 Level 3 Total
Financial assets at fair value through profit or loss (note 23)
Notes, listed overseas 1,341 – – 1,341
Notes, unlisted – 15 – 15
Equity securities, unlisted – 174 – 174
Others, unlisted – 416 – 416
Available-for-sale financial assets (note 23)
Stapled securities, listed overseas 830 – – 830
Equity securities, listed overseas 872 – – 872
Debt securities, unlisted – 213 – 213
Equity securities, unlisted – 32 – 32
Derivative financial instruments (note 24)
Forward foreign exchange contracts – 414 – 414
Total 3,043 1,264 – 4,307
Liabilities measured at fair value
HK$ million Level 1 Level 2 Level 3 Total
Derivative financial instruments (note 24)
Forward foreign exchange contacts – 10 – 10
Interest rate swaps – 19 – 19
Total – 29 – 29
There were no transfers between level 1 and 2 during the year.

76 CHEUNG KONG INFRASTRUCTURE HOLDINGS LIMITED
NOTES TO THE CONSOLIDATED FINANCIAL STATEMENTS
6. GROUP TURNOVER AND SHARE OF TURNOVER OF JOINTLY CONTROLLED ENTITIES
Group turnover represents net sales of infrastructure materials, income from the supply of water, return from infrastructure project investments, interest income from loans granted to associates, and distribution from investments in securities classified as infrastructure investments.
In addition, the Group presents its proportionate share of turnover of jointly controlled entities. Turnover of associates is not included.
The Group turnover and share of turnover of jointly controlled entities for the current year is analysed as follows:
HK$ million 2009 2008
Sales of infrastructure materials 1,132 1,132
Income from the supply of water 251 278
Return from infrastructure project investments 27 344
Interest income from loans granted to associates 614 522
Distribution from investments in securities 160 169
Group turnover 2,184 2,445
Share of turnover of jointly controlled entities 1,870 5,041
4,054 7,486
7. OTHER INCOME
Other income includes the following:
HK$ million 2009 2008
Bank and other interest income 268 429
Gain on disposals of infrastructure project investments – 112
Change in fair values of investment properties 10 –
(Loss) / Gain on disposals of securities (6) 3
77ANNUAL REPORT 2009
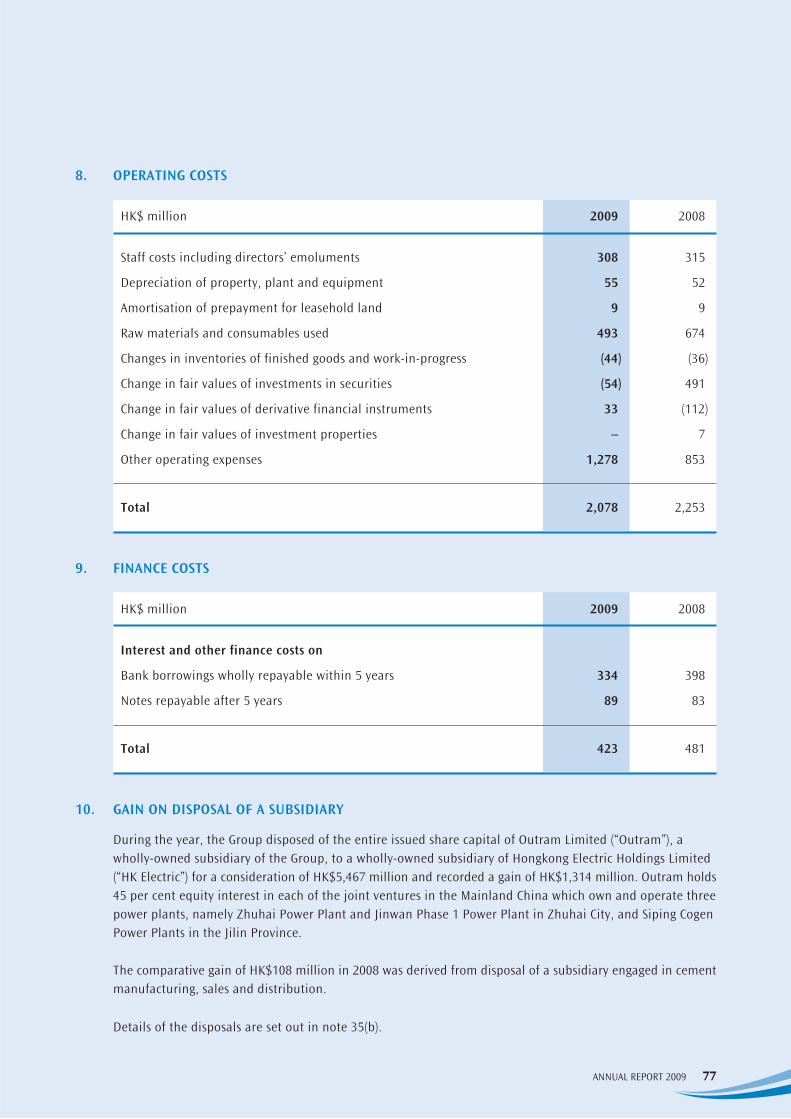
8. OPERATING COSTS
HK$ million 2009 2008
Staff costs including directors’ emoluments 308 315
Depreciation of property, plant and equipment 55 52
Amortisation of prepayment for leasehold land 9 9
Raw materials and consumables used 493 674
Changes in inventories of finished goods and work-in-progress (44) (36)
Change in fair values of investments in securities (54) 491
Change in fair values of derivative financial instruments 33 (112)
Change in fair values of investment properties – 7
Other operating expenses 1,278 853
Total 2,078 2,253
9. FINANCE COSTS
HK$ million 2009 2008
Interest and other finance costs on
Bank borrowings wholly repayable within 5 years 334 398
Notes repayable after 5 years 89 83
Total 423 481
10. GAIN ON DISPOSAL OF A SUBSIDIARY
During the year, the Group disposed of the entire issued share capital of Outram Limited (“Outram”), a wholly-owned subsidiary of the Group, to a wholly-owned subsidiary of Hongkong Electric Holdings Limited (“HK Electric”) for a consideration of HK$5,467 million and recorded a gain of HK$1,314 million. Outram holds 45 per cent equity interest in each of the joint ventures in the Mainland China which own and operate three power plants, namely Zhuhai Power Plant and Jinwan Phase 1 Power Plant in Zhuhai City, and Siping Cogen Power Plants in the Jilin Province.
The comparative gain of HK$108 million in 2008 was derived from disposal of a subsidiary engaged in cement manufacturing, sales and distribution.
Details of the disposals are set out in note 35(b).

78 CHEUNG KONG INFRASTRUCTURE HOLDINGS LIMITED
NOTES TO THE CONSOLIDATED FINANCIAL STATEMENTS
11. IMPAIRMENT LOSSES
In 2008, the Group recognised impairment losses of the following assets:
HK$ million 2009 2008
Investments in securities (note 23) – 427
12. PROFIT BEFORE TAXATION
HK$ million 2009 2008
Profit before taxation is arrived at after (crediting) / charging:
Contract revenue (98) (106)
Operating lease rental for land and buildings 17 12
Directors’ emoluments (note 36) 40 37
Auditor’s remuneration 6 6
Share of tax of associates 655 693
Share of tax of jointly controlled entities 86 145
79ANNUAL REPORT 2009
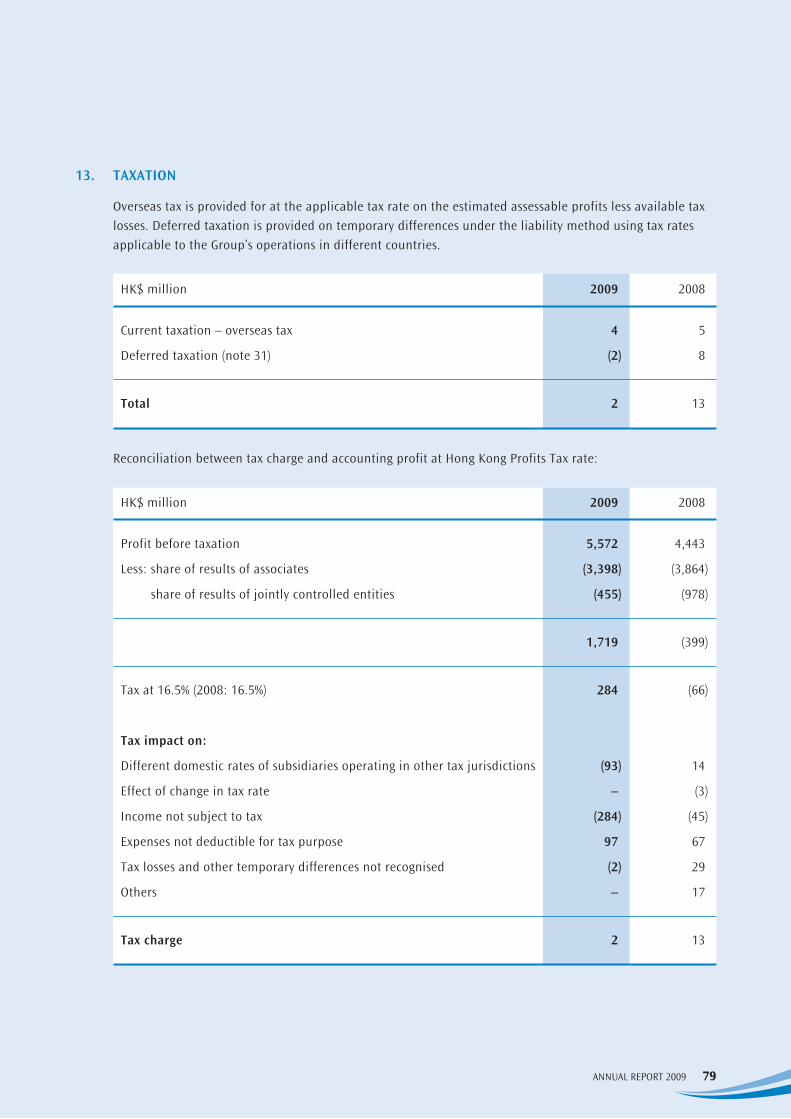
13. TAXATION
Overseas tax is provided for at the applicable tax rate on the estimated assessable profits less available tax losses. Deferred taxation is provided on temporary differences under the liability method using tax rates applicable to the Group’s operations in different countries.
HK$ million 2009 2008
Current taxation – overseas tax 4 5
Deferred taxation (note 31) (2) 8
Total 2 13
Reconciliation between tax charge and accounting profit at Hong Kong Profits Tax rate:
HK$ million 2009 2008
Profit before taxation 5,572 4,443
Less: share of results of associates (3,398) (3,864)
share of results of jointly controlled entities (455) (978)
1,719 (399)
Tax at 16.5% (2008: 16.5%) 284 (66)
Tax impact on:
Different domestic rates of subsidiaries operating in other tax jurisdictions (93) 14
Effect of change in tax rate – (3)
Income not subject to tax (284) (45)
Expenses not deductible for tax purpose 97 67
Tax losses and other temporary differences not recognised (2) 29
Others – 17
Tax charge 2 13

80 CHEUNG KONG INFRASTRUCTURE HOLDINGS LIMITED
NOTES TO THE CONSOLIDATED FINANCIAL STATEMENTS
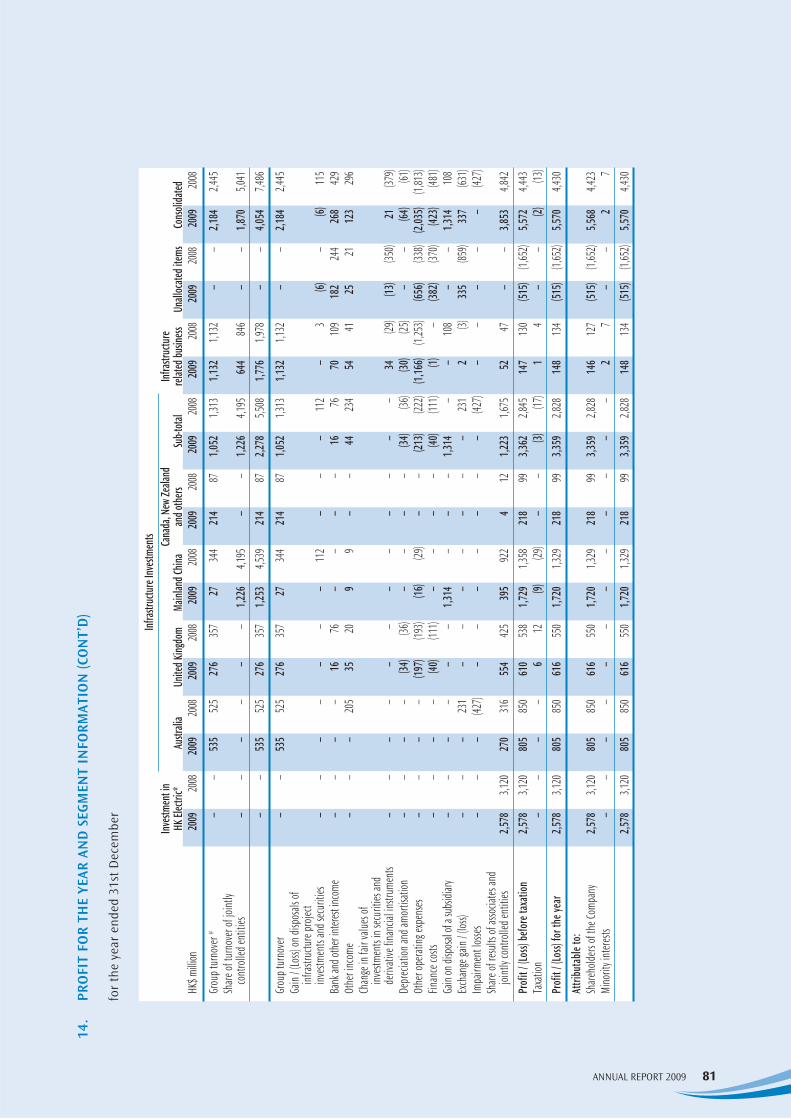
14. PROFIT FOR THE YEAR AND SEGMENT INFORMATION
The Group has adopted HKFRS 8 “Operating Segments” with effect from 1st January, 2009. HKFRS 8 requires operating segments to be identified on the basis of internal reports about components of an entity that are regularly reviewed by the chief operating decision maker in order to allocate resources to the segment and to assess its performance. In contrast, the predecessor standard (HKAS 14 “Segment Reporting”) required an entity to identify two sets of segments (business and geographical), using a risks and rewards approach, with the entity’s “system of internal financial reporting to key management personnel” serving only as the starting point for the identification of such segments. As a result, the Group has redesignated certain reportable segments as detailed below since adoption of HKFRS 8.
The Group’s reportable segments under HKFRS 8 do not differ materially from those previously disclosed under HKAS 14. In prior years, segment information reported externally was analysed by the types of the Group’s core activities which consisted of Investment in HK Electric, Infrastructure Investments and Infrastructure Related Business. As information of Infrastructure Investments reported internally to the Group’s Executive Directors for the purposes of resource allocation and assessment of performance is more specifically focused on individual projects in similar jurisdictions, the Group’s information of Infrastructure Investments is further segregated and disclosed under the following reportable segments as required by HKFRS 8:
• Australia
• United Kingdom
• Mainland China
• Canada, New Zealand and others
Information regarding the Group’s reportable segments is presented below. Amounts reported for the prior period have been restated to conform to the requirement of HKFRS 8.
81ANNUAL REPORT 2009
14.
PRO
FIT
FOR
THE
YEAR
AN
D S
EGM
ENT
INFO
RMAT
ION
(CO
NT’
D)
for
the
year
end
ed 3
1st D
ecem
ber
Infras
tructu
re Inv
estme
nts
Inv
estme
nt in
Cana
da, N
ew Ze
aland
Infras
tructu
re
HK El
ectri
c*
Austr
alia
Unite
d King
dom
Mainl
and C
hina
and o
thers
Su
b-tota
l rel
ated b
usine
ss Un
alloc
ated i
tems
Cons
olida
tedHK
$ milli
on
2009
20
08
2009
20
08
2009
20
08
2009
20
08
2009
20
08
2009
20
08
2009
20
08
2009
20
08
2009
20
08
Grou
p tur
nove
r # –
– 53
5 52
5 27
6 35
7 27
34
4 21
4 87
1,0
52
1,313
1,1
32
1,132
–
– 2,1
84
2,445
Share
of tu
rnov
er of
joint
ly
cont
rolle
d ent
ities
–
– –
– –
– 1,2
26
4,195
–
– 1,2
26
4,195
64
4 84
6 –
– 1,8
70
5,041
–
– 53
5 52
5 27
6 35
7 1,2
53
4,539
21
4 87
2,2
78
5,508
1,7
76
1,978
–
– 4,0
54
7,486
Grou
p tur
nove
r –
– 53
5 52
5 27
6 35
7 27
34
4 21
4 87
1,0
52
1,313
1,1
32
1,132
–
– 2,1
84
2,445
Gain
/ (Lo
ss) on
disp
osals
of
infras
tructu
re pr
oject
inv
estm
ents
and s
ecur
ities
–
– –
– –
– –
112
– –
– 11
2 –
3 (6)
–
(6)
115
Bank
and o
ther in
terest
inco
me
– –
– –
16
76
– –
– –
16
76
70
109
182
244
268
429
Othe
r inc
ome
– –
– 20
5 35
20
9
9 –
– 44
23
4 54
41
25
21
12
3 29
6Ch
ange
in fa
ir va
lues o
f
inves
tmen
ts in
secu
rities
and
de
rivati
ve fin
ancia
l instr
umen
ts –
– –
– –
– –
– –
– –
– 34
(29
) (13
) (35
0) 21
(37
9)De
prec
iation
and a
morti
satio
n –
– –
– (34
) (36
) –
– –
– (34
) (36
) (30
) (25
) –
– (64
) (61
)Ot
her o
perat
ing ex
pens
es
– –
– –
(197)
(193)
(16)
(29)
– –
(213)
(222)
(1,16
6) (1,
253)
(656)
(338)
(2,03
5) (1,
813)
Finan
ce co
sts
– –
– –
(40)
(111)
– –
– –
(40)
(111)
(1)
– (38
2) (37
0) (42
3) (48
1)Ga
in on
disp
osal
of a s
ubsid
iary
– –
– –
– –
1,314
–
– –
1,314
–
– 10
8 –
– 1,3
14
108
Exch
ange
gain
/ (los
s) –
– –
231
– –
– –
– –
– 23
1 2
(3)
335
(859)
337
(631)
Impa
irmen
t los
ses
– –
– (42
7) –
– –
– –
– –
(427)
– –
– –
– (42
7)Sh
are of
resu
lts of
asso
ciates
and
joi
ntly
cont
rolle
d ent
ities
2,5
78
3,120
27
0 31
6 55
4 42
5 39
5 92
2 4
12
1,223
1,6
75
52
47
– –
3,853
4,8
42Pr
ofit
/ (Lo
ss) be
fore
taxa
tion
2,578
3,1
20
805
850
610
538
1,729
1,3
58
218
99
3,362
2,8
45
147
130
(515)
(1,65
2) 5,5
72
4,443
Taxa
tion
– –
– –
6 12
(9)
(29
) –
– (3)
(17
) 1
4 –
– (2)
(13
)Pr
ofit
/ (Lo
ss) fo
r the
year
2,5
78
3,120
80
5 85
0 61
6 55
0 1,7
20
1,329
21
8 99
3,3
59
2,828
14
8 13
4 (51
5) (1,
652)
5,570
4,4
30
Attri
buta
ble to
:Sh
areho
lders
of th
e Com
pany
2,5
78
3,120
80
5 85
0 61
6 55
0 1,7
20
1,329
21
8 99
3,3
59
2,828
14
6 12
7 (51
5) (1,
652)
5,568
4,4
23Mi
norit
y int
erests
–
– –
– –
– –
– –
– –
– 2
7 –
– 2
7
2,578
3,1
20
805
850
616
550
1,720
1,3
29
218
99
3,359
2,8
28
148
134
(515)
(1,65
2) 5,5
70
4,430

82 CHEUNG KONG INFRASTRUCTURE HOLDINGS LIMITED
NOTES TO THE CONSOLIDATED FINANCIAL STATEMENTS14
. PR
OFI
T FO
R TH
E YE
AR A
ND
SEG
MEN
T IN
FORM
ATIO
N (C
ON
T’D
)
for
the
year
end
ed 3
1st D
ecem
ber
Infras
tructu
re Inv
estme
nts
Inv
estme
nt in
Cana
da, N
ew Ze
aland
Infras
tructu
re
HK El
ectri
c*
Austr
alia
Unite
d King
dom
Mainl
and C
hina
and o
thers
Su
b-tota
l rel
ated b
usine
ss Un
alloc
ated i
tems
Cons
olida
tedHK
$ milli
on
2009
20
08
2009
20
08
2009
20
08
2009
20
08
2009
20
08
2009
20
08
2009
20
08
2009
20
08
2009
20
08
Othe
r inf
orma
tion
Expe
nditu
re for
segm
ent
no
n-cu
rrent
asse
ts:
– Add
ition
to pr
opert
y,
pla
nt an
d equ
ipmen
t –
– –
– 24
65
–
– –
– 24
65
11
5 26
–
– 13
9 91
– A
cquis
ition
s of a
ssocia
tes
– –
– –
525
– –
– –
833
525
833
– –
– –
525
833
as at
31st
Dece
mber
Asse
tsInt
erests
in as
socia
tes an
d
joint
ly co
ntro
lled e
ntiti
es
20,54
4 19
,541
6,315
4,9
30
3,457
2,1
68
403
3,158
2,9
43
2,428
13
,118
12,68
4 20
0 20
3 –
– 33
,862
32,42
8Pr
opert
y, pla
nt an
d equ
ipmen
t,
inves
tmen
t pro
perti
es an
d
lease
hold
land §
– –
– –
836
787
– –
– –
836
787
658
562
– –
1,494
1,3
49Ot
her s
egme
nt as
sets
– –
1,709
93
4 2,3
23
2,130
6
597
2 3
4,040
3,6
64
1,481
1,3
32
– –
5,521
4,9
96Un
alloc
ated c
orpo
rate a
ssets
– –
– –
– –
– –
– –
– –
– –
10,90
2 6,2
36
10,90
2 6,2
36
Tota
l asse
ts 20
,544
19,54
1 8,0
24
5,864
6,6
16
5,085
40
9 3,7
55
2,945
2,4
31
17,99
4 17
,135
2,339
2,0
97
10,90
2 6,2
36
51,77
9 45
,009
Liabil
ities
Segm
ent l
iabilit
ies
– –
33
– 1,9
31
1,783
18
33
12
13
1,9
94
1,829
54
5 46
9 –
– 2,5
39
2,298
Unall
ocate
d cor
porat
e liab
ilities
–
– –
– –
– –
– –
– –
– –
– 6,9
53
5,981
6,9
53
5,981
Tota
l liab
ilitie
s –
– 33
–
1,931
1,7
83
18
33
12
13
1,994
1,8
29
545
469
6,953
5,9
81
9,492
8,2
79
Not
es:
#
Sale
s of
infr
astr
uctu
re m
ater
ials
com
pris
e of
sal
es in
Hon
g Ko
ng o
f HK$
810
mill
ion
(200
8: H
K$77
1 m
illio
n), s
ales
in M
ainl
and
Chin
a of
HK$
320
mill
ion
(200
8:
HK$
342
mill
ion)
and
sal
es in
oth
er r
egio
n of
HK$
2 m
illio
n (2
008:
HK$
19 m
illio
n).
§ Th
e ca
rryi
ng v
alue
of H
K$48
8 m
illio
n (2
008:
HK$
481
mill
ion)
and
HK$
170
mill
ion
(200
8: H
K$81
mill
ion)
of t
he p
rope
rty,
pla
nt a
nd e
quip
men
t, in
vest
men
t pr
oper
ties
and
leas
ehol
d la
nd o
f inf
rast
ruct
ure
rela
ted
busi
ness
are
loca
ted
in H
ong
Kong
and
Mai
nlan
d Ch
ina
resp
ecti
vely
.
* D
urin
g th
e ye
ar, t
he G
roup
has
a 3
8.87
per
cen
t equ
ity
inte
rest
in H
K El
ectr
ic, w
hich
is li
sted
on
Hon
g Ko
ng S
tock
Exc
hang
e.
83ANNUAL REPORT 2009
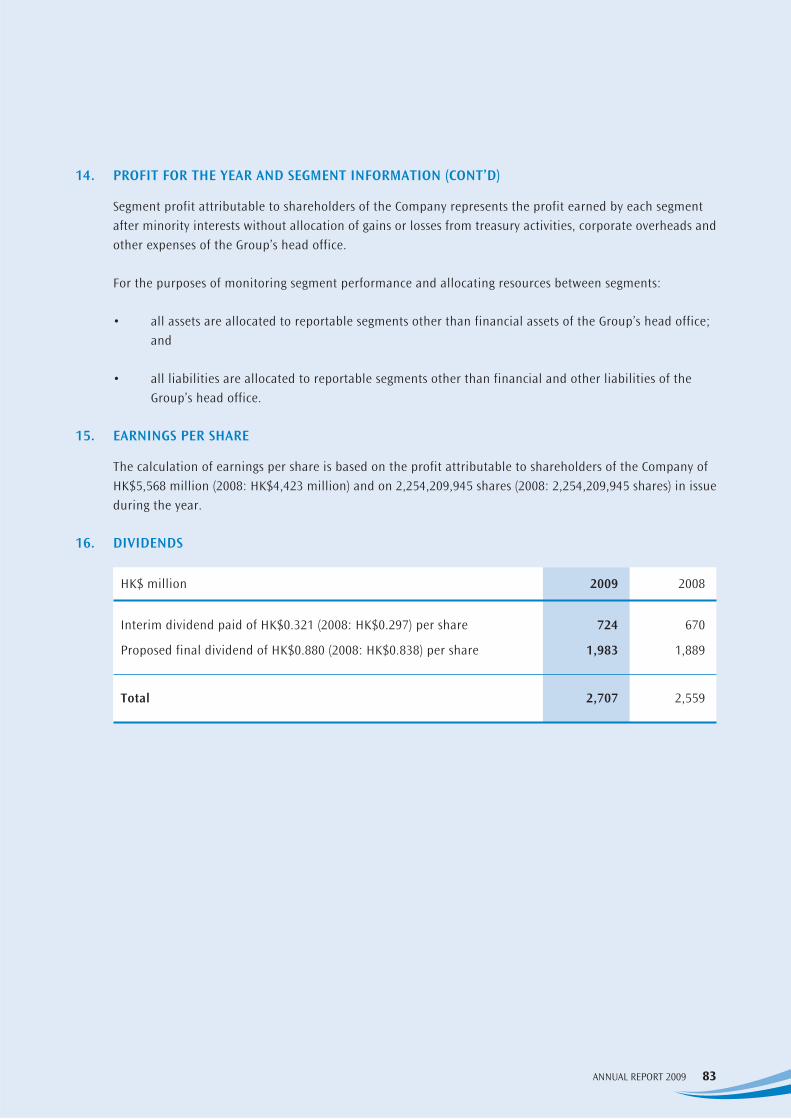
14. PROFIT FOR THE YEAR AND SEGMENT INFORMATION (CONT’D)
Segment profit attributable to shareholders of the Company represents the profit earned by each segment after minority interests without allocation of gains or losses from treasury activities, corporate overheads and other expenses of the Group’s head office.
For the purposes of monitoring segment performance and allocating resources between segments:
• all assets are allocated to reportable segments other than financial assets of the Group’s head office; and
• all liabilities are allocated to reportable segments other than financial and other liabilities of the Group’s head office.
15. EARNINGS PER SHARE
The calculation of earnings per share is based on the profit attributable to shareholders of the Company of HK$5,568 million (2008: HK$4,423 million) and on 2,254,209,945 shares (2008: 2,254,209,945 shares) in issue during the year.
16. DIVIDENDS
HK$ million 2009 2008
Interim dividend paid of HK$0.321 (2008: HK$0.297) per share 724 670
Proposed final dividend of HK$0.880 (2008: HK$0.838) per share 1,983 1,889
Total 2,707 2,559

84 CHEUNG KONG INFRASTRUCTURE HOLDINGS LIMITED
NOTES TO THE CONSOLIDATED FINANCIAL STATEMENTS
17. PROPERTY, PLANT AND EQUIPMENT
Mains, Freehold land pipes, other Furniture, outside plant and fixturesHK$ million Hong Kong Buildings machinery and others Total
Cost
At 1st January, 2008 3 736 2,847 38 3,624
Additions – 2 86 3 91
Disposals – – (109) (8) (117)
Disposal of a subsidiary – (137) (112) – (249)
Exchange translation differences (1) 22 (309) 2 (286)
Transfers * – (1) – – (1)
At 31st December, 2008 2 622 2,403 35 3,062
Additions – – 135 4 139
Disposals – – (29) (4) (33)
Exchange translation differences – 3 87 – 90
At 31st December, 2009 2 625 2,596 35 3,258
Accumulated depreciation
and impairment loss
At 1st January, 2008 – 690 1,780 33 2,503
Charge for the year – 4 46 2 52
Disposals – – (108) (8) (116)
Disposal of a subsidiary – (129) (111) – (240)
Exchange translation differences – 20 (63) 2 (41)
At 31st December, 2008 – 585 1,544 29 2,158
Charge for the year – 4 49 2 55
Disposals – – (28) (4) (32)
Exchange translation differences – 2 27 – 29
At 31st December, 2009 – 591 1,592 27 2,210
Carrying value
At 31st December, 2009 2 34 1,004 8 1,048
At 31st December, 2008 2 37 859 6 904
* During the year, no properties of the Group were transferred to investment properties (2008: certain properties
transferred to investment properties with revaluation gain of HK$4 million).

85ANNUAL REPORT 2009
17. PROPERTY, PLANT AND EQUIPMENT (CONT’D)
The carrying value of the Group’s mains, pipes, other plant and machinery includes an amount of HK$267 million (2008: HK$193 million) in respect of assets held under finance leases, and another amount of HK$54 million (2008: HK$50 million) in respect of assets pledged as security for certain bank loans of the Group.
The Directors reviewed the Group’s property, plant and equipment based on value in use calculation. The discount rate used was 8.5 per cent (2008: 8.5 per cent) per annum. No impairment loss has been recognised for the property, plant and equipment during the year.
18. INVESTMENT PROPERTIES
HK$ million
Medium term leases in Hong Kong, at fair value
At 1st January, 2008 160
Transfer from property, plant and equipment and leasehold land 11
Change in fair values (7)
At 31st December, 2008 164
Change in fair values 10
At 31st December, 2009 174
The fair values of the Group’s investment properties at 31st December, 2009 are determined based on a valuation carried out by Mr. K. B. Wong for and on behalf of DTZ Debenham Tie Leung Limited, independent qualified professional valuers not connected with the Group. Mr. K. B. Wong is a member of the Hong Kong Institute of Surveyors with appropriate qualifications and recent experiences in the valuation of similar locations. The valuation was arrived at by reference to market evidence of transaction prices for similar properties in the same locations and conditions.

86 CHEUNG KONG INFRASTRUCTURE HOLDINGS LIMITED
NOTES TO THE CONSOLIDATED FINANCIAL STATEMENTS
19. LEASEHOLD LAND
Medium term Medium term leasehold leasehold land land outsideHK$ million in Hong Kong Hong Kong Total
Operating lease prepayment
At 1st January, 2008 402 51 453
Transfers* (2) – (2)
Disposal of a subsidiary – (7) (7)
Exchange translation differences – 2 2
At 31st December, 2008 400 46 446
Exchange translation differences – 1 1
At 31st December, 2009 400 47 447
Accumulated amortisation and impairment loss
At 1st January, 2008 124 37 161
Charge for the year 8 1 9
Transfers* (1) – (1)
Disposal of a subsidiary – (6) (6)
Exchange translation differences – 2 2
At 31st December, 2008 131 34 165
Charge for the year 9 – 9
Exchange translation differences – 1 1
At 31st December, 2009 140 35 175
Carrying value
At 31st December, 2009 260 12 272
At 31st December, 2008 269 12 281
* During the year, no leasehold land of the Group was transferred to investment properties (2008: certain leasehold land transferred to investment properties with revaluation gain of HK$5 million).
The Directors reviewed the Group’s leasehold land based on value in use calculation. The discount rate used was 8.5 per cent (2008: 8.5 per cent) per annum. No impairment loss has been recognised for the leasehold land during the year.

87ANNUAL REPORT 2009
20. INTERESTS IN ASSOCIATES
HK$ million 2009 2008
Investment costs – Listed in Hong Kong 8,687 8,687 – Unlisted 5,655 6,592Share of post-acquisition reserves 12,604 9,357
26,946 24,636Impairment losses – (857)
26,946 23,779Amounts due by unlisted associates 6,313 5,288
At 31st December 33,259 29,067
Market value of investment in a listed associate 35,009 36,046
Included in the amounts due by unlisted associates are subordinated loans of HK$4,840 million (2008: HK$3,800 million). The rights in respect of these loans are subordinated to the rights of any other lenders to the associates.
The Directors reviewed certain associates’ operations and financial positions as at 31st December, 2009 based on value in use calculation.
Summarised financial information in respect of the Group’s associates is set out below:
HK$ million 2009 2008
Total assets 183,338 150,526Total liabilities (115,592) (91,804)
Net assets 67,746 58,722
Total turnover 29,024 32,712Total profit for the year 8,405 9,315
Shared by the Group:Net assets of the associates 26,946 24,640Profit of the associates for the year 3,398 3,864Reserve movements of the associates for the year 1,430 (2,692)
Particulars of the principal associates are set out in Appendix 2 on pages 116 and 117.

88 CHEUNG KONG INFRASTRUCTURE HOLDINGS LIMITED
NOTES TO THE CONSOLIDATED FINANCIAL STATEMENTS
21. INTERESTS IN JOINTLY CONTROLLED ENTITIES
HK$ million 2009 2008
Investment costs 877 2,999
Share of post-acquisition reserves (483) 164
394 3,163
Impairment losses (245) (245)
149 2,918
Shareholders’ loans to jointly controlled entities 454 443
At 31st December 603 3,361
The Group did not pledge any interests in jointly controlled entities as at 31st December, 2009. As at 31st December, 2008, the Group’s interests in a jointly controlled entity with carrying value of HK$1,902 million were pledged as part of the security to secure certain bank borrowings granted to the jointly controlled entity.
The Directors reviewed certain jointly controlled entities’ operations and financial positions as at 31st December, 2009 based on value in use calculation. A discount rate 9 per cent (2008: 9 per cent) per annum was applied on projected cash flows for value in use calculation.
Summarised financial information in respect of the Group’s jointly controlled entities is set out below:
HK$ million 2009 2008
Total assets 4,771 19,726
Total liabilities (3,921) (11,792)
Net assets 850 7,934
Total turnover 4,367 11,481
Total profit for the year 875 1,863
Shared by the Group:
Net assets of the jointly controlled entities 394 3,163
Profit of jointly controlled entities for the year 455 978
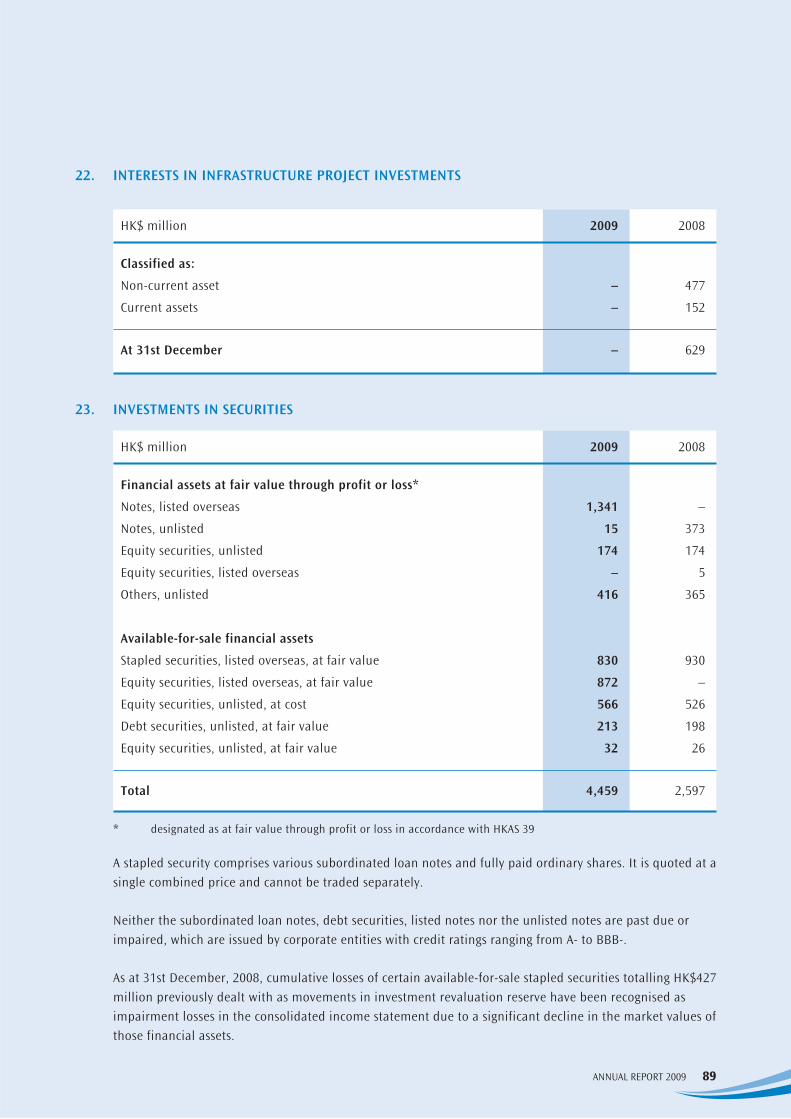
89ANNUAL REPORT 2009
22. INTERESTS IN INFRASTRUCTURE PROJECT INVESTMENTS
HK$ million 2009 2008
Classified as:
Non-current asset – 477
Current assets – 152
At 31st December – 629
23. INVESTMENTS IN SECURITIES
HK$ million 2009 2008
Financial assets at fair value through profit or loss*
Notes, listed overseas 1,341 –
Notes, unlisted 15 373
Equity securities, unlisted 174 174
Equity securities, listed overseas – 5
Others, unlisted 416 365
Available-for-sale financial assets
Stapled securities, listed overseas, at fair value 830 930
Equity securities, listed overseas, at fair value 872 –
Equity securities, unlisted, at cost 566 526
Debt securities, unlisted, at fair value 213 198
Equity securities, unlisted, at fair value 32 26
Total 4,459 2,597
* designated as at fair value through profit or loss in accordance with HKAS 39
A stapled security comprises various subordinated loan notes and fully paid ordinary shares. It is quoted at a single combined price and cannot be traded separately.
Neither the subordinated loan notes, debt securities, listed notes nor the unlisted notes are past due or impaired, which are issued by corporate entities with credit ratings ranging from A- to BBB-.
As at 31st December, 2008, cumulative losses of certain available-for-sale stapled securities totalling HK$427 million previously dealt with as movements in investment revaluation reserve have been recognised as impairment losses in the consolidated income statement due to a significant decline in the market values of those financial assets.
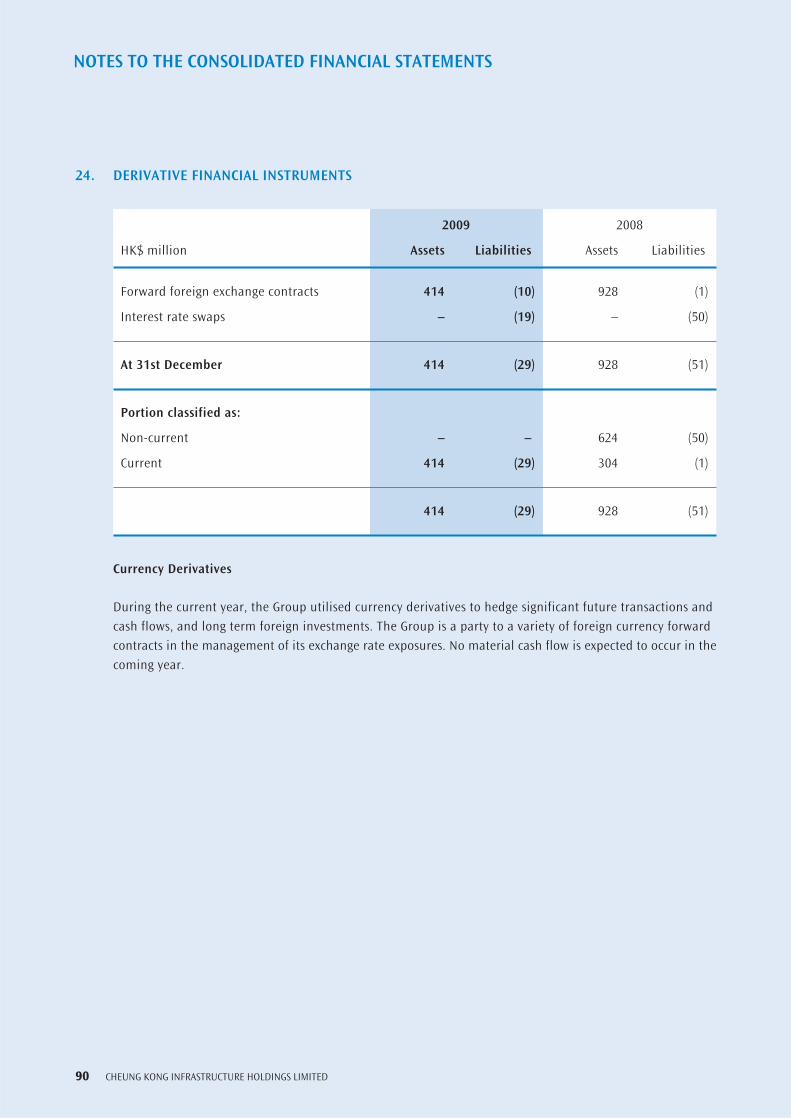
90 CHEUNG KONG INFRASTRUCTURE HOLDINGS LIMITED
NOTES TO THE CONSOLIDATED FINANCIAL STATEMENTS
24. DERIVATIVE FINANCIAL INSTRUMENTS
2009 2008
HK$ million Assets Liabilities Assets Liabilities
Forward foreign exchange contracts 414 (10) 928 (1)
Interest rate swaps – (19) – (50)
At 31st December 414 (29) 928 (51)
Portion classified as:
Non-current – – 624 (50)
Current 414 (29) 304 (1)
414 (29) 928 (51)
Currency Derivatives
During the current year, the Group utilised currency derivatives to hedge significant future transactions and cash flows, and long term foreign investments. The Group is a party to a variety of foreign currency forward contracts in the management of its exchange rate exposures. No material cash flow is expected to occur in the coming year.
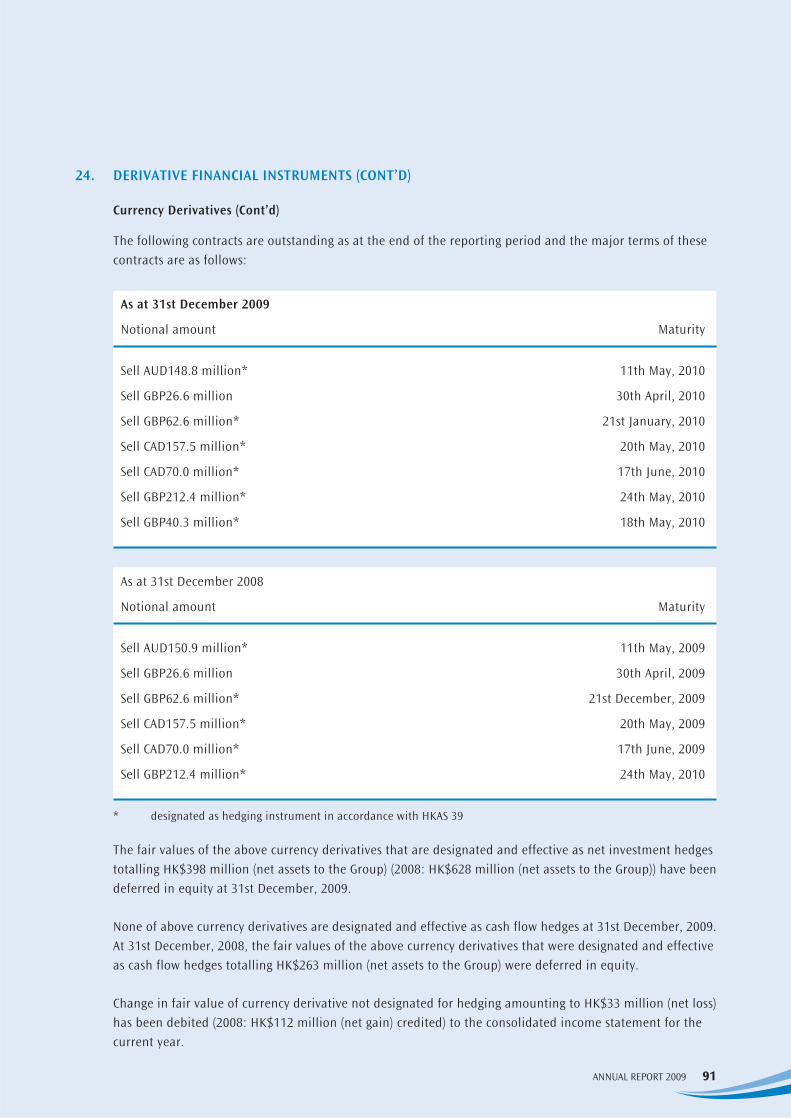
91ANNUAL REPORT 2009
24. DERIVATIVE FINANCIAL INSTRUMENTS (CONT’D)
Currency Derivatives (Cont’d)
The following contracts are outstanding as at the end of the reporting period and the major terms of these contracts are as follows:
As at 31st December 2009
Notional amount Maturity
Sell AUD148.8 million* 11th May, 2010
Sell GBP26.6 million 30th April, 2010
Sell GBP62.6 million* 21st January, 2010
Sell CAD157.5 million* 20th May, 2010
Sell CAD70.0 million* 17th June, 2010
Sell GBP212.4 million* 24th May, 2010
Sell GBP40.3 million* 18th May, 2010
As at 31st December 2008
Notional amount Maturity
Sell AUD150.9 million* 11th May, 2009
Sell GBP26.6 million 30th April, 2009
Sell GBP62.6 million* 21st December, 2009
Sell CAD157.5 million* 20th May, 2009
Sell CAD70.0 million* 17th June, 2009
Sell GBP212.4 million* 24th May, 2010
* designated as hedging instrument in accordance with HKAS 39
The fair values of the above currency derivatives that are designated and effective as net investment hedges totalling HK$398 million (net assets to the Group) (2008: HK$628 million (net assets to the Group)) have been deferred in equity at 31st December, 2009.
None of above currency derivatives are designated and effective as cash flow hedges at 31st December, 2009. At 31st December, 2008, the fair values of the above currency derivatives that were designated and effective as cash flow hedges totalling HK$263 million (net assets to the Group) were deferred in equity.
Change in fair value of currency derivative not designated for hedging amounting to HK$33 million (net loss) has been debited (2008: HK$112 million (net gain) credited) to the consolidated income statement for the current year.
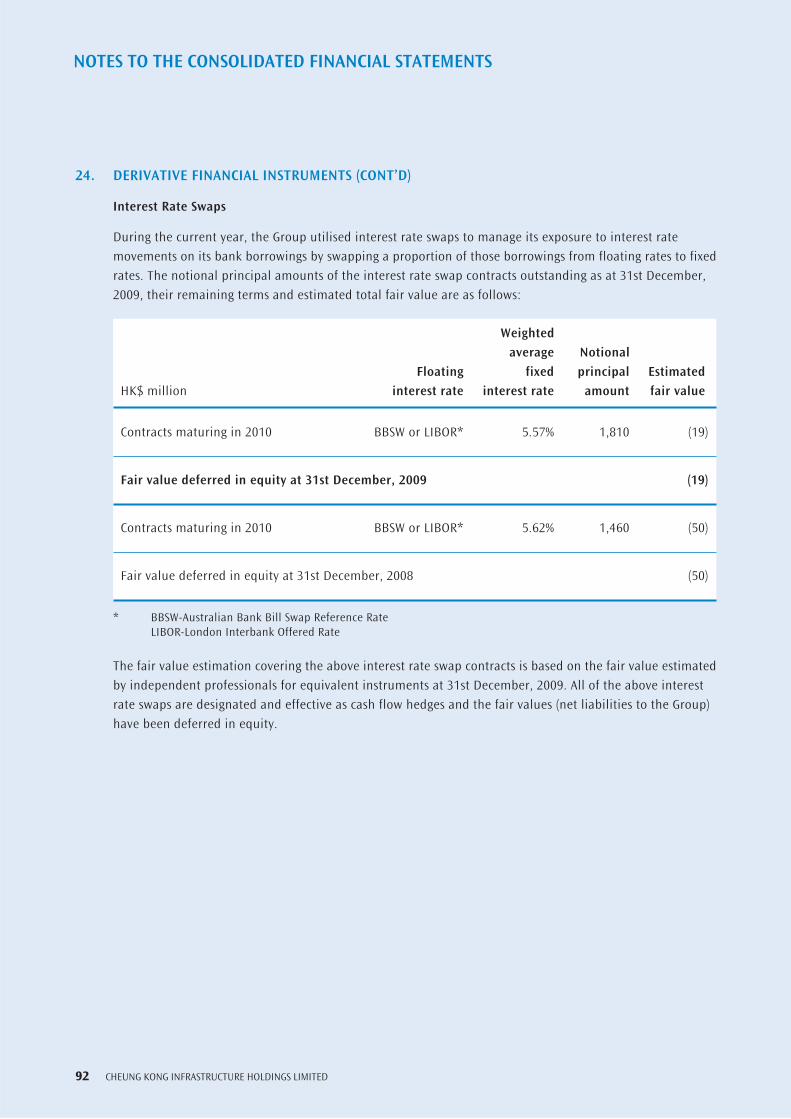
92 CHEUNG KONG INFRASTRUCTURE HOLDINGS LIMITED
NOTES TO THE CONSOLIDATED FINANCIAL STATEMENTS
24. DERIVATIVE FINANCIAL INSTRUMENTS (CONT’D)
Interest Rate Swaps
During the current year, the Group utilised interest rate swaps to manage its exposure to interest rate movements on its bank borrowings by swapping a proportion of those borrowings from floating rates to fixed rates. The notional principal amounts of the interest rate swap contracts outstanding as at 31st December, 2009, their remaining terms and estimated total fair value are as follows:
Weighted average Notional Floating fixed principal EstimatedHK$ million interest rate interest rate amount fair value
Contracts maturing in 2010 BBSW or LIBOR* 5.57% 1,810 (19)
Fair value deferred in equity at 31st December, 2009 (19)
Contracts maturing in 2010 BBSW or LIBOR* 5.62% 1,460 (50)
Fair value deferred in equity at 31st December, 2008 (50)
* BBSW-Australian Bank Bill Swap Reference Rate LIBOR-London Interbank Offered Rate
The fair value estimation covering the above interest rate swap contracts is based on the fair value estimated by independent professionals for equivalent instruments at 31st December, 2009. All of the above interest rate swaps are designated and effective as cash flow hedges and the fair values (net liabilities to the Group) have been deferred in equity.

93ANNUAL REPORT 2009
25. GOODWILL
HK$ million 2009 2008
At 1st January 143 209
Exchange difference 15 (66)
At 31st December 158 143
The goodwill was recognised on acquisition of 100 per cent interest in Cambridge Water PLC (“Cambridge Water”), the water supplier in South Cambridgeshire of the United Kingdom.
The Group tests goodwill annually for impairment, or more frequently if there are indications that the goodwill might be impaired.
The recoverable amount of Cambridge Water, which covers the above goodwill, is determined from a value in use calculation. The key assumptions for the value in use calculation are those regarding the discount rate, growth rates, and expected changes to selling prices and direct costs during the period. The Group estimates discount rate using the rate that reflects current market assessments of the time value of money and the risks specific to Cambridge Water. The growth rates are based on industry growth forecasts. Changes in selling prices and direct costs are based on past practices and expectations of future changes in the relevant markets.
The Group prepares cash flow forecasts derived from Cambridge Water’s approved budget for 2010 to 2014 and extrapolates cash flows for the subsequent 10 years using the same cashflows as that in 2014. The rate used to discount the forecast cash flows is 8 per cent (2008: 8 per cent) per annum.
As Cambridge Water’s principal operation is supply of water which is regulated in nature, the Group considers that cash flow projection for 15 years and low growth rates are appropriate for the impairment test review.
The results of the reviews undertaken as at 31st December, 2009 indicated that no further impairment charge was necessary for current year.

94 CHEUNG KONG INFRASTRUCTURE HOLDINGS LIMITED
NOTES TO THE CONSOLIDATED FINANCIAL STATEMENTS
26. BANK BALANCES AND DEPOSITS
Bank balances and deposits carry effective interest rate at 1.67 per cent (2008: 4.86 per cent) per annum.
Analysis of the bank balances and deposits is as follows:
HK$ million 2009 2008
Pledged bank deposit 1,430 1,113
Cash and cash equivalents 9,306 4,368
Total 10,736 5,481
The pledged bank deposit represents a deposit pledged to a bank to secure a bank loan repayable in 2010. The pledged bank deposit which is classified as current asset (2008: non-current asset) will be released upon repayment of the bank loan.
27. INVENTORIES
HK$ million 2009 2008
Raw materials 44 62
Work-in-progress 33 30
Stores, spare parts and supplies 22 18
Finished goods 71 30
Total 170 140
The cost of inventories charged to the consolidated income statement during the year was HK$1,175 million (2008: HK$1,124 million).

95ANNUAL REPORT 2009
28. DEBTORS AND PREPAYMENTS
HK$ million 2009 2008
Trade debtors 293 243Prepayments, deposits and other receivables 185 1,060
Total 478 1,303
The aging analysis of the Group’s trade debtors is as follows:
HK$ million 2009 2008
Current 187 139
Less than 1 month past due 63 521 to 3 months past due 29 38More than 3 months but less than 12 months past due 22 25More than 12 months past due 52 58
Amount past due 166 173
Allowance for doubtful debts (60) (69)
Total after allowance 293 243
Trade with customers for infrastructure materials is carried out largely on credit, except for new customers and customers with unsatisfactory payment records, where payment in advance is normally required. Trade with metered customers for water supply is carried out largely on credit and with unmetered customers largely by payment in advance. Invoices are normally due within 1 month of issuance, except for certain well-established customers, where the terms are extended to 2 months, and certain customers with disputed items, where the terms are negotiated individually. Each customer has a maximum credit limit, which was granted and approved by senior management in accordance with the laid-down credit review policy and procedures.
The movement in the allowance for doubtful debts during the year is as follows:
HK$ million 2009 2008
At 1st January 69 83Impairment loss recognised 11 4Impairment loss written back (19) (15)Uncollective amounts written off (2) (5)Exchange translation differences 1 2
At 31st December 60 69
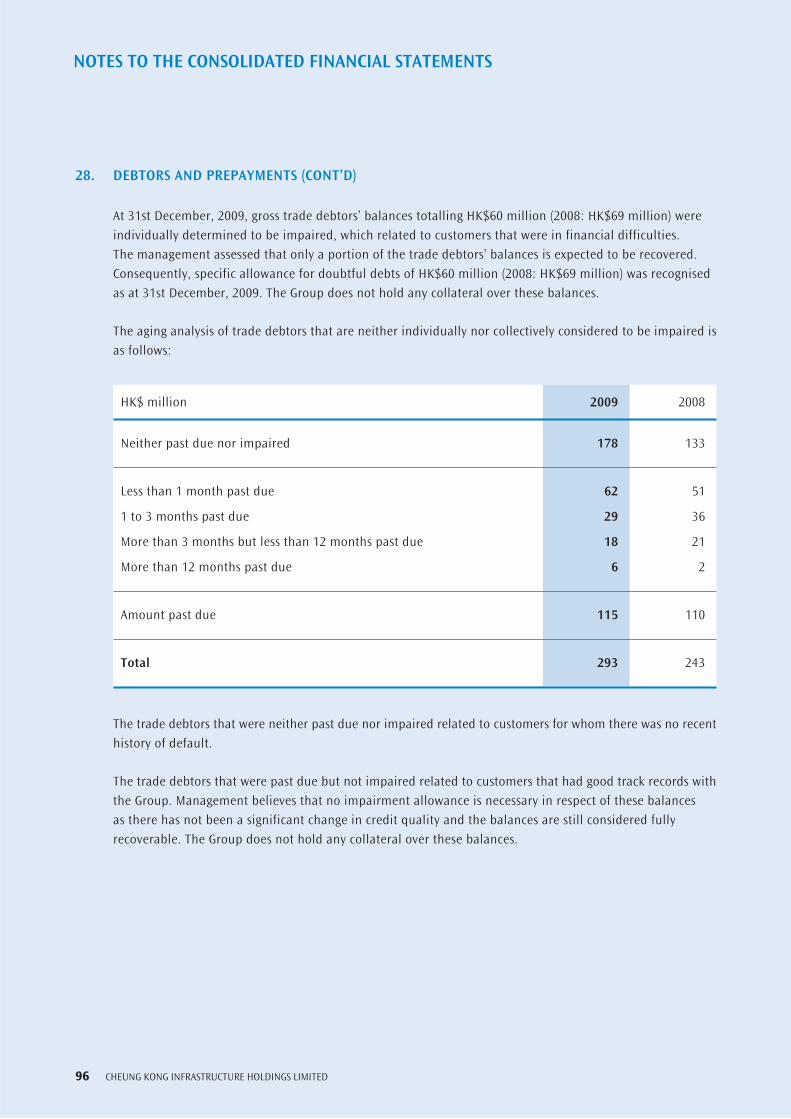
96 CHEUNG KONG INFRASTRUCTURE HOLDINGS LIMITED
NOTES TO THE CONSOLIDATED FINANCIAL STATEMENTS
28. DEBTORS AND PREPAYMENTS (CONT’D)
At 31st December, 2009, gross trade debtors’ balances totalling HK$60 million (2008: HK$69 million) were individually determined to be impaired, which related to customers that were in financial difficulties. The management assessed that only a portion of the trade debtors’ balances is expected to be recovered. Consequently, specific allowance for doubtful debts of HK$60 million (2008: HK$69 million) was recognised as at 31st December, 2009. The Group does not hold any collateral over these balances.
The aging analysis of trade debtors that are neither individually nor collectively considered to be impaired is as follows:
HK$ million 2009 2008
Neither past due nor impaired 178 133
Less than 1 month past due 62 51
1 to 3 months past due 29 36
More than 3 months but less than 12 months past due 18 21
More than 12 months past due 6 2
Amount past due 115 110
Total 293 243
The trade debtors that were neither past due nor impaired related to customers for whom there was no recent history of default.
The trade debtors that were past due but not impaired related to customers that had good track records with the Group. Management believes that no impairment allowance is necessary in respect of these balances as there has not been a significant change in credit quality and the balances are still considered fully recoverable. The Group does not hold any collateral over these balances.
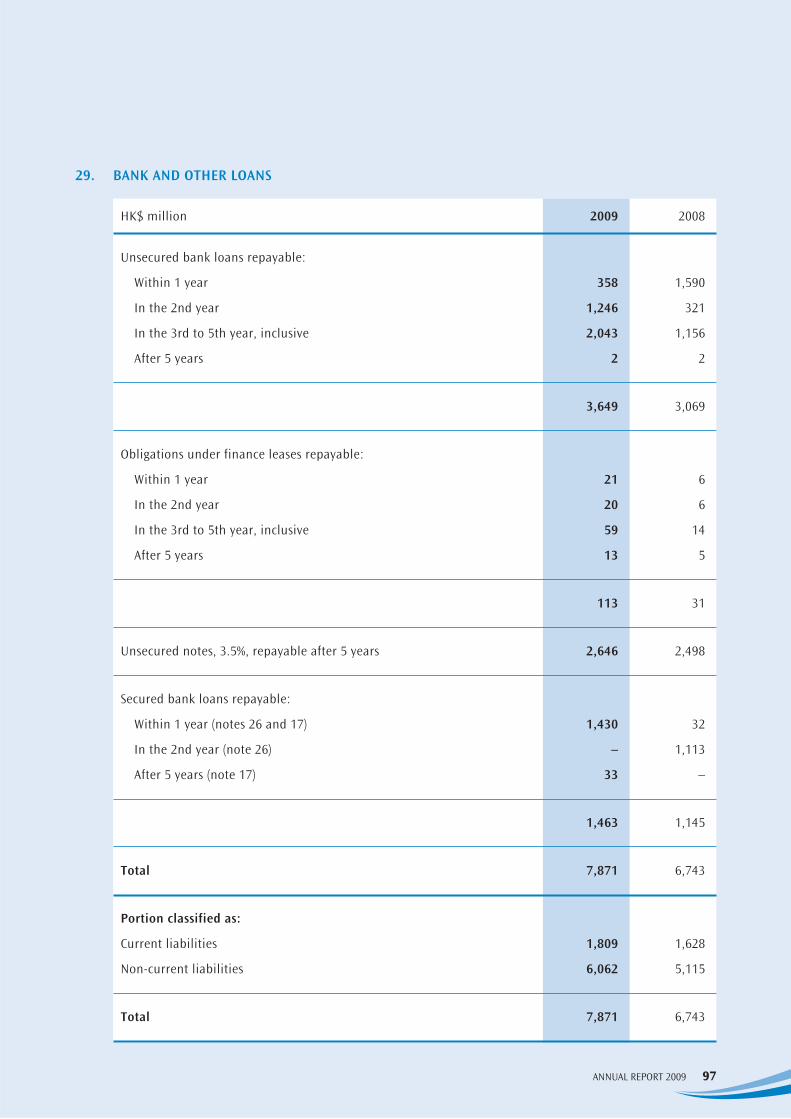
97ANNUAL REPORT 2009
29. BANK AND OTHER LOANS
HK$ million 2009 2008
Unsecured bank loans repayable:
Within 1 year 358 1,590
In the 2nd year 1,246 321
In the 3rd to 5th year, inclusive 2,043 1,156
After 5 years 2 2
3,649 3,069
Obligations under finance leases repayable:
Within 1 year 21 6
In the 2nd year 20 6
In the 3rd to 5th year, inclusive 59 14
After 5 years 13 5
113 31
Unsecured notes, 3.5%, repayable after 5 years 2,646 2,498
Secured bank loans repayable:
Within 1 year (notes 26 and 17) 1,430 32
In the 2nd year (note 26) – 1,113
After 5 years (note 17) 33 –
1,463 1,145
Total 7,871 6,743
Portion classified as:
Current liabilities 1,809 1,628
Non-current liabilities 6,062 5,115
Total 7,871 6,743

98 CHEUNG KONG INFRASTRUCTURE HOLDINGS LIMITED
NOTES TO THE CONSOLIDATED FINANCIAL STATEMENTS
29. BANK AND OTHER LOANS (CONT’D)
The carrying amounts of the Group’s borrowings are denominated in the following currencies:
AU$ GBP JPY RMB Total
HK$ million 2009 2008 2009 2008 2009 2008 2009 2008 2009 2008
Bank loans 3,473 2,703 1,639 1,511 – – – – 5,112 4,214
Finance leases – – 28 31 – – 85 – 113 31
Notes – – – – 2,646 2,498 – – 2,646 2,498
Total 3,473 2,703 1,667 1,542 2,646 2,498 85 – 7,871 6,743
The average effective interest rates of the Group’s bank loans and finance leases are 4.20 per cent (2008: 6.19 per cent) per annum and 5.85 per cent (2008: 8.86 per cent) per annum, respectively.
The Group’s notes of HK$2,646 million (2008: HK$2,498 million) and an unsecured bank loan of HK$2 million (2008: HK$2 million) were arranged at fixed interest rate and exposed the Group to fair value interest rate risk. Other borrowings were arranged at floating rates, thus exposed the Group to cash flow interest rate risk.
Bank loans (except for the fixed rate notes) carried interest at floating rate, which was determined with reference to Australian Bank Bill Swap Reference Rate or London Interbank Offered Rate plus an average margin less than one per cent.
Fixed rate notes, other loans and finance leases carried interest at 3.5 per cent to 13.3 per cent (2008: 3.5 per cent to 13.3 per cent) per annum.
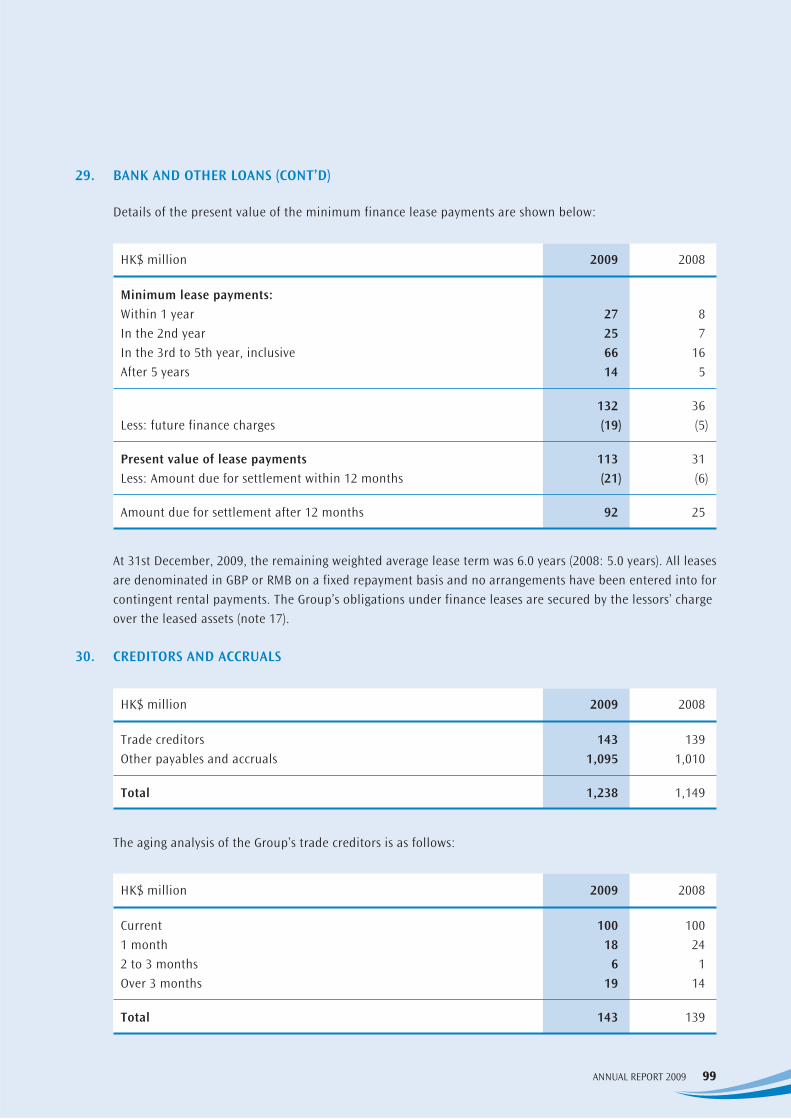
99ANNUAL REPORT 2009
29. BANK AND OTHER LOANS (CONT’D)
Details of the present value of the minimum finance lease payments are shown below:
HK$ million 2009 2008
Minimum lease payments:Within 1 year 27 8In the 2nd year 25 7In the 3rd to 5th year, inclusive 66 16After 5 years 14 5
132 36Less: future finance charges (19) (5)
Present value of lease payments 113 31Less: Amount due for settlement within 12 months (21) (6)
Amount due for settlement after 12 months 92 25
At 31st December, 2009, the remaining weighted average lease term was 6.0 years (2008: 5.0 years). All leases are denominated in GBP or RMB on a fixed repayment basis and no arrangements have been entered into for contingent rental payments. The Group’s obligations under finance leases are secured by the lessors’ charge over the leased assets (note 17).
30. CREDITORS AND ACCRUALS
HK$ million 2009 2008
Trade creditors 143 139Other payables and accruals 1,095 1,010
Total 1,238 1,149
The aging analysis of the Group’s trade creditors is as follows:
HK$ million 2009 2008
Current 100 1001 month 18 242 to 3 months 6 1Over 3 months 19 14
Total 143 139
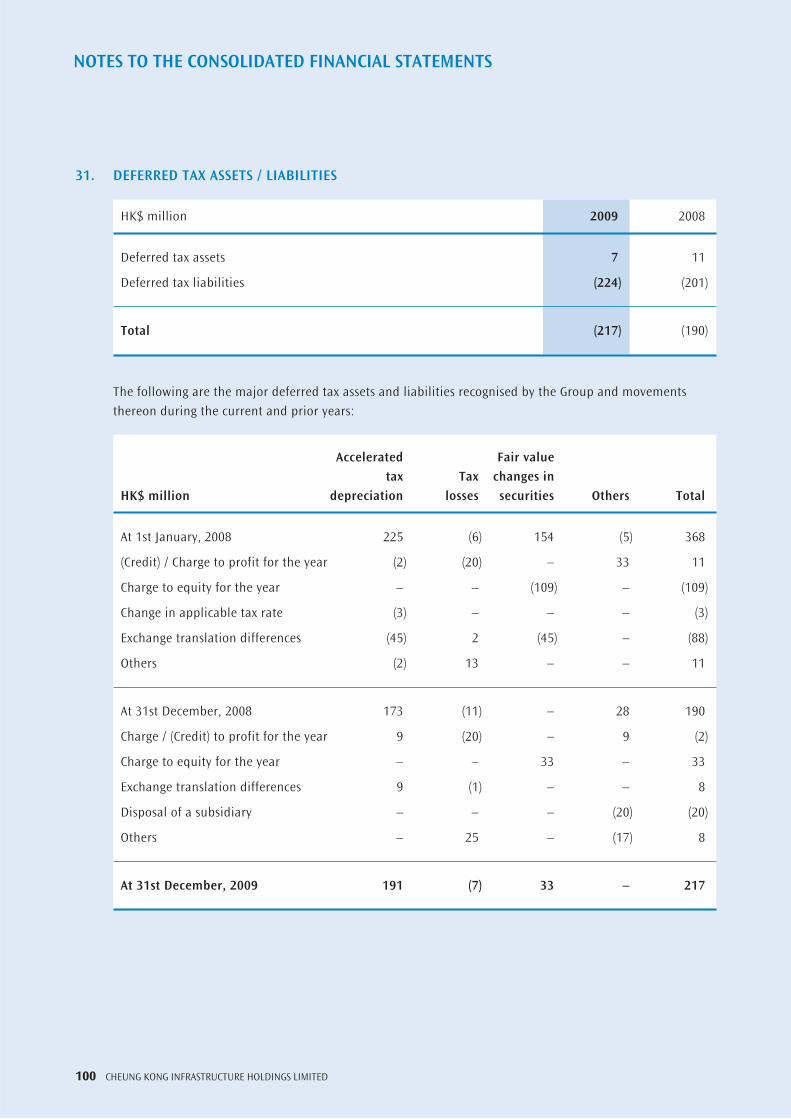
100 CHEUNG KONG INFRASTRUCTURE HOLDINGS LIMITED
NOTES TO THE CONSOLIDATED FINANCIAL STATEMENTS
31. DEFERRED TAX ASSETS / LIABILITIES
HK$ million 2009 2008
Deferred tax assets 7 11
Deferred tax liabilities (224) (201)
Total (217) (190)
The following are the major deferred tax assets and liabilities recognised by the Group and movements thereon during the current and prior years:
Accelerated Fair value tax Tax changes inHK$ million depreciation losses securities Others Total
At 1st January, 2008 225 (6) 154 (5) 368
(Credit) / Charge to profit for the year (2) (20) – 33 11
Charge to equity for the year – – (109) – (109)
Change in applicable tax rate (3) – – – (3)
Exchange translation differences (45) 2 (45) – (88)
Others (2) 13 – – 11
At 31st December, 2008 173 (11) – 28 190
Charge / (Credit) to profit for the year 9 (20) – 9 (2)
Charge to equity for the year – – 33 – 33
Exchange translation differences 9 (1) – – 8
Disposal of a subsidiary – – – (20) (20)
Others – 25 – (17) 8
At 31st December, 2009 191 (7) 33 – 217

101ANNUAL REPORT 2009
31. DEFERRED TAX ASSETS / LIABILITIES (CONT’D)
Apart from the unused tax losses of which the deferred tax assets were recognised as presented above, the Group had unused tax losses and other unused tax credits totalling HK$1,550 million (2008: HK$1,779 million) at 31st December, 2009. No deferred tax asset has been recognised in respect of these tax losses and tax credits due to the unpredictability of future profit streams to utilise the available tax losses and tax credits. An analysis of the expiry dates of the tax losses and tax credits is as follows:
HK$ million 2009 2008
Within 1 year 13 21In the 2nd year 3 13In the 3rd to 5th year, inclusive 53 62No expiry date 1,481 1,683
Total 1,550 1,779
32. RETIREMENT PLANS
(a) Defined Contribution Retirement Plans
The Group provides defined contribution retirement plans for its eligible employees except for 2 defined benefit plans for the employees of certain subsidiaries as detailed in (b) and (c) below.
Contributions to the defined contribution plans in Hong Kong are made by either the employer only at 10 per cent of the employees’ monthly basic salaries or by both the employer and the employees each at 10 or 15 per cent of the employees’ monthly basic salaries. The Company and its Hong Kong subsidiaries also participate in master trust Mandatory Provident Fund (“MPF”) schemes operated by independent service providers. Mandatory contributions to these MPF schemes are made by both the employers and employees at 5 per cent of the employees’ monthly relevant income each capped at HK$20,000.
Contribution to the defined contribution plans in the United Kingdom are made by either the employer only at 10 per cent of the employees’ monthly basic salaries or by both the employer and employees each at 6 to 12 per cent of the employees’ monthly basic salaries.
As the Group’s retirement plans in Hong Kong, including the defined benefit plan mentioned in (b) below, are all MPF-exempted recognised occupational retirement schemes (“ORSO schemes”), except for certain subsidiaries of which the new Hong Kong employees have to join the MPF schemes, the Group offers an option to its new Hong Kong employees to elect between the ORSO schemes and the MPF schemes.
The Group’s costs in respect of defined contribution plans for the year amounted to HK$11 million (2008: HK$12 million). No forfeited contributions and earnings for the year under the defined contribution plans were used to reduce the existing level of contributions (2008: nil). At 31st December, 2009, there were no forfeited contributions and earnings available to the Group to reduce its contributions to the defined contribution plans in future years (2008: nil).
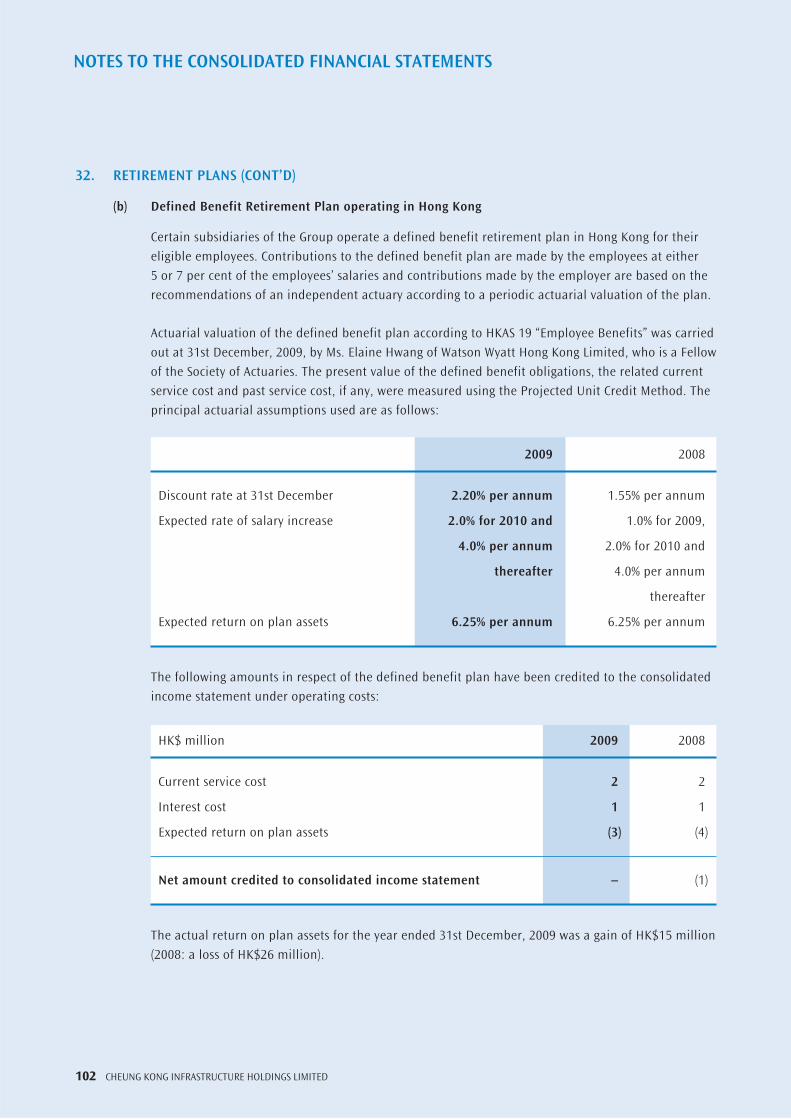
102 CHEUNG KONG INFRASTRUCTURE HOLDINGS LIMITED
NOTES TO THE CONSOLIDATED FINANCIAL STATEMENTS
32. RETIREMENT PLANS (CONT’D)
(b) Defined Benefit Retirement Plan operating in Hong Kong
Certain subsidiaries of the Group operate a defined benefit retirement plan in Hong Kong for their eligible employees. Contributions to the defined benefit plan are made by the employees at either 5 or 7 per cent of the employees’ salaries and contributions made by the employer are based on the recommendations of an independent actuary according to a periodic actuarial valuation of the plan.
Actuarial valuation of the defined benefit plan according to HKAS 19 “Employee Benefits” was carried out at 31st December, 2009, by Ms. Elaine Hwang of Watson Wyatt Hong Kong Limited, who is a Fellow of the Society of Actuaries. The present value of the defined benefit obligations, the related current service cost and past service cost, if any, were measured using the Projected Unit Credit Method. The principal actuarial assumptions used are as follows:
2009 2008
Discount rate at 31st December 2.20% per annum 1.55% per annum
Expected rate of salary increase 2.0% for 2010 and 1.0% for 2009,
4.0% per annum 2.0% for 2010 and
thereafter 4.0% per annum
thereafter
Expected return on plan assets 6.25% per annum 6.25% per annum
The following amounts in respect of the defined benefit plan have been credited to the consolidated income statement under operating costs:
HK$ million 2009 2008
Current service cost 2 2
Interest cost 1 1
Expected return on plan assets (3) (4)
Net amount credited to consolidated income statement – (1)
The actual return on plan assets for the year ended 31st December, 2009 was a gain of HK$15 million (2008: a loss of HK$26 million).
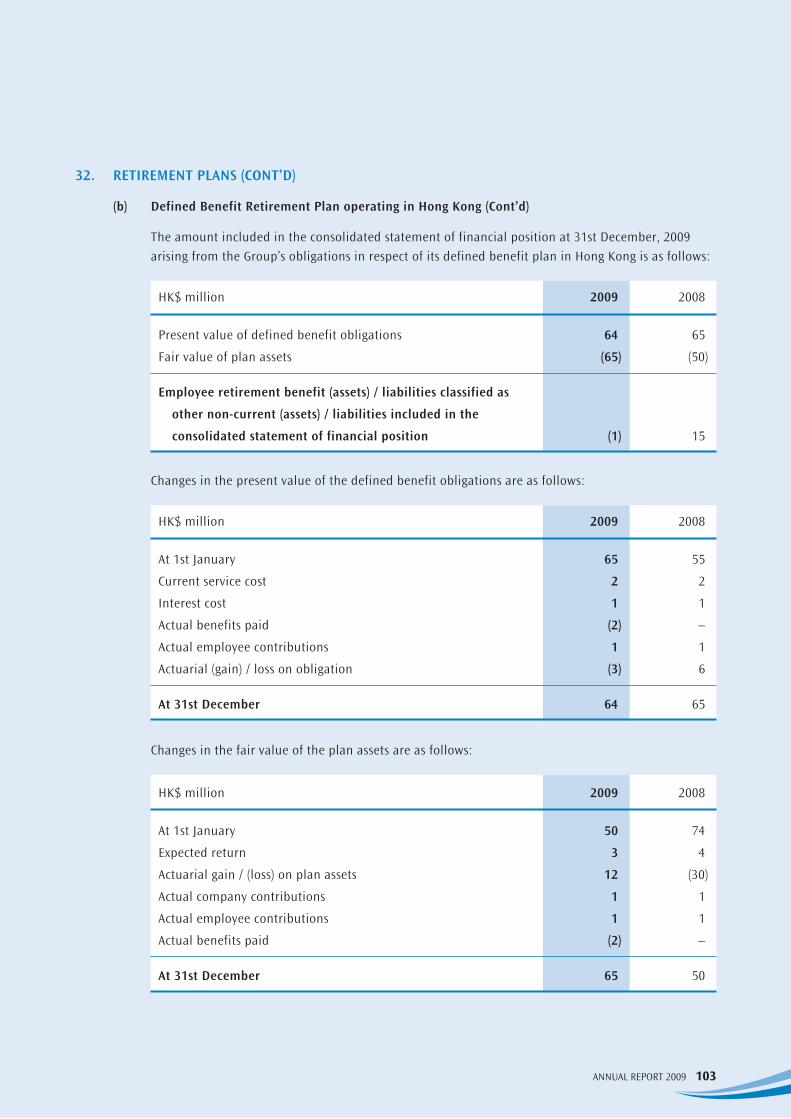
103ANNUAL REPORT 2009
32. RETIREMENT PLANS (CONT’D)
(b) Defined Benefit Retirement Plan operating in Hong Kong (Cont’d)
The amount included in the consolidated statement of financial position at 31st December, 2009 arising from the Group’s obligations in respect of its defined benefit plan in Hong Kong is as follows:
HK$ million 2009 2008
Present value of defined benefit obligations 64 65
Fair value of plan assets (65) (50)
Employee retirement benefit (assets) / liabilities classified as
other non-current (assets) / liabilities included in the
consolidated statement of financial position (1) 15
Changes in the present value of the defined benefit obligations are as follows:
HK$ million 2009 2008
At 1st January 65 55
Current service cost 2 2
Interest cost 1 1
Actual benefits paid (2) –
Actual employee contributions 1 1
Actuarial (gain) / loss on obligation (3) 6
At 31st December 64 65
Changes in the fair value of the plan assets are as follows:
HK$ million 2009 2008
At 1st January 50 74
Expected return 3 4
Actuarial gain / (loss) on plan assets 12 (30)
Actual company contributions 1 1
Actual employee contributions 1 1
Actual benefits paid (2) –
At 31st December 65 50
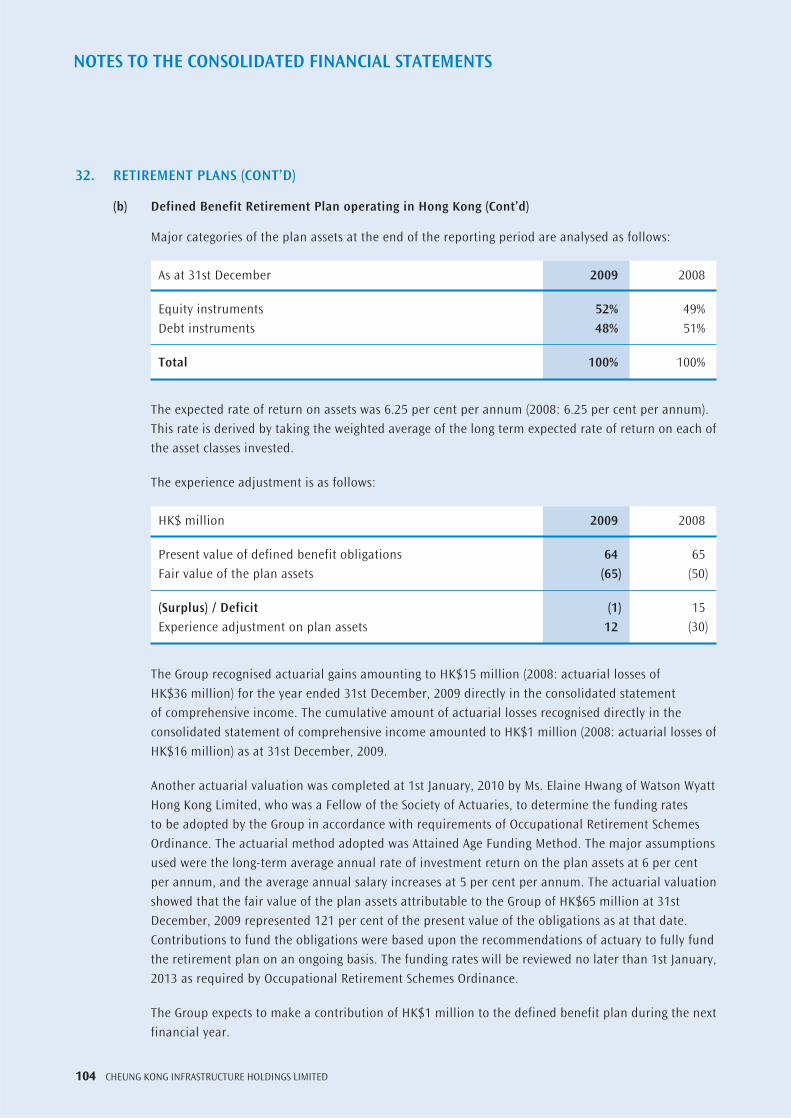
104 CHEUNG KONG INFRASTRUCTURE HOLDINGS LIMITED
NOTES TO THE CONSOLIDATED FINANCIAL STATEMENTS
32. RETIREMENT PLANS (CONT’D)
(b) Defined Benefit Retirement Plan operating in Hong Kong (Cont’d)
Major categories of the plan assets at the end of the reporting period are analysed as follows:
As at 31st December 2009 2008
Equity instruments 52% 49%Debt instruments 48% 51%
Total 100% 100%
The expected rate of return on assets was 6.25 per cent per annum (2008: 6.25 per cent per annum). This rate is derived by taking the weighted average of the long term expected rate of return on each of the asset classes invested.
The experience adjustment is as follows:
HK$ million 2009 2008
Present value of defined benefit obligations 64 65Fair value of the plan assets (65) (50)
(Surplus) / Deficit (1) 15Experience adjustment on plan assets 12 (30)
The Group recognised actuarial gains amounting to HK$15 million (2008: actuarial losses of HK$36 million) for the year ended 31st December, 2009 directly in the consolidated statement of comprehensive income. The cumulative amount of actuarial losses recognised directly in the consolidated statement of comprehensive income amounted to HK$1 million (2008: actuarial losses of HK$16 million) as at 31st December, 2009.
Another actuarial valuation was completed at 1st January, 2010 by Ms. Elaine Hwang of Watson Wyatt Hong Kong Limited, who was a Fellow of the Society of Actuaries, to determine the funding rates to be adopted by the Group in accordance with requirements of Occupational Retirement Schemes Ordinance. The actuarial method adopted was Attained Age Funding Method. The major assumptions used were the long-term average annual rate of investment return on the plan assets at 6 per cent per annum, and the average annual salary increases at 5 per cent per annum. The actuarial valuation showed that the fair value of the plan assets attributable to the Group of HK$65 million at 31st December, 2009 represented 121 per cent of the present value of the obligations as at that date. Contributions to fund the obligations were based upon the recommendations of actuary to fully fund the retirement plan on an ongoing basis. The funding rates will be reviewed no later than 1st January, 2013 as required by Occupational Retirement Schemes Ordinance.
The Group expects to make a contribution of HK$1 million to the defined benefit plan during the next financial year.

105ANNUAL REPORT 2009
32. RETIREMENT PLANS (CONT’D)
(c) Defined Benefit Retirement Plan operating in the United Kingdom
Cambridge Water PLC, a wholly-owned subsidiary of the Group, operates a defined benefit retirement plan in the United Kingdom. The retirement plan is covered under the Water Companies Pension Scheme of which the Company is a member. Contributions to the defined benefit plan are made by the employees at 6 per cent of the employees’ salaries and contributions made by the employer are based on the recommendations of an independent actuary according to a periodic actuarial valuation of the plan.
Actuarial valuation of the defined benefit plan was updated to 31st December, 2009, by Mr. Paul Metcalf of Lane Clark & Peacock LLP, who is a Fellow of the Institute of Actuaries. The principal actuarial assumptions used are as follows:
2009 2008
Discount rate at 31st December 5.6% per annum 6.4% per annum
Expected rate of pension increase 3.8% per annum 3.1% per annum
Expected rate of salary increase 4.3% per annum 4.6% per annum
The following amounts in respect of the defined benefit plan have been charged to the consolidated income statement under operating costs:
HK$ million 2009 2008
Current service cost 6 8
Interest cost 22 20
Expected return on plan assets (18) (21)
Net amount charged to consolidated income statement 10 7
The actual return on plan assets for the year ended 31st December, 2009 was a gain of HK$44 million (2008: a loss of HK$36 million).

106 CHEUNG KONG INFRASTRUCTURE HOLDINGS LIMITED
NOTES TO THE CONSOLIDATED FINANCIAL STATEMENTS
32. RETIREMENT PLANS (CONT’D)
(c) Defined Benefit Retirement Plan operating in the United Kingdom (Cont’d)
The amount included in the consolidated statement of financial position at 31st December, 2009 arising from the Group’s obligations in respect of its defined benefit plan in the United Kingdom is as follows:
HK$ million 2009 2008
Present value of defined benefit obligations 437 348Fair value of plan assets (403) (337)
Employee retirement benefit liabilities classified as other non-current liabilities included in the consolidated statement of financial position 34 11
Changes in the present value of the defined benefit obligations are as follows:
HK$ million 2009 2008
At 1st January 348 513Current service cost 6 8Interest cost 22 20Employee contributions 2 2Actuarial loss / (gain) 64 (48)Benefits paid (13) (11)Exchange translation differences 8 (136)
At 31st December 437 348
Changes in the fair value of the plan assets are as follows:
HK$ million 2009 2008
At 1st January 337 497Expected return 18 21Actuarial gain / (loss) 26 (57)Employer contributions 7 6Employee contributions 2 2Benefits paid (13) (11)Exchange translation differences 26 (121)
At 31st December 403 337

107ANNUAL REPORT 2009
32. RETIREMENT PLANS (CONT’D)
(c) Defined Benefit Retirement Plan operating in the United Kingdom (Cont’d)
Major categories of the plan assets at the end of the reporting period are analysed as follows:
As at 31st December 2009 2008
Equity instruments 41% 39%
Debt instruments 59% 61%
Total 100% 100%
The expected rate of return on assets is 5.3 per cent per annum (2008: 5.9 per cent per annum). This rate is derived by taking the weighted average of the long term expected rate of return on each of the asset classes invested.
The experience adjustments are as follows:
HK$ million 2009 2008
Present value of the defined benefit obligations 437 348
Fair value of the plan assets (403) (337)
Deficit 34 11
Experience adjustment on plan liabilities (7) (12)
Experience adjustment on plan assets (26) 57
The above actuarial valuation showed that the fair value of the plan assets attributable to the Group of HK$403 million (2008: HK$337 million) at 31st December, 2009 represents 92 per cent (2008: 97 per cent) of the present value of the obligations as at that day. The Group’s future annual contribution is designed to fund the shortfall over a period of time and the employer funding rates have been increased since 1st April, 2005. The funding rates are subject to annual review.
The Group recognised actuarial losses amounting to HK$19 million (2008: nil) for the year ended 31st December, 2009 directly in the consolidated statement of comprehensive income. The cumulative amount of actuarial losses recognised directly in the consolidated statement of comprehensive income amounted to HK$19 million (2008: nil) as at 31st December, 2009.
The Group expects to make a contribution of HK$8 million to the defined benefit plan during the next financial year.

108 CHEUNG KONG INFRASTRUCTURE HOLDINGS LIMITED
NOTES TO THE CONSOLIDATED FINANCIAL STATEMENTS
33. SHARE CAPITAL
HK$ million 2009 2008
Authorised:4,000,000,000 shares of HK$1 each 4,000 4,000
Issued and fully paid:2,254,209,945 shares of HK$1 each 2,254 2,254
34. CAPITAL MANAGEMENT
The Group’s primary objectives when managing capital are to safeguard the Group’s ability to continue as a going concern, so that it can expand and generate attractive and predictable returns for shareholders and benefits for other stakeholders, by establishing and maintaining a quality investment portfolio with stable earnings and appropriate level of risks that the management are comfortable with.
The capital structure of the Group consists of debts, which includes bank borrowings, notes and obligations under finance leases as detailed in note 29, bank balances and deposits, and equity attributable to shareholders of the Company, comprising issued share capital and reserves as detailed in consolidated statement of changes in equity.
The management actively and regularly reviews and manages the Group’s capital structure to maintain a balance between high shareholders’ returns and strong capital position, and makes adjustments to the capital structure in light of changes in the global market conditions.
The Group maintained a low net debt to shareholders’ equity ratio of 3 per cent as at 31st December, 2008 and has turned into net cash position as at 31st December, 2009. The management targets to maintain a solid capital position to pursue more new investment opportunities. The Group’s overall strategy remains unchanged from 2008.
The net debt to shareholders’ equity ratio at 31st December, 2009 and 2008 was as follows:
HK$ million 2009 2008
Total debts 7,871 6,743Bank balances and deposits (10,736) (5,481)
Net (cash) / debt (2,865) 1,262
Shareholders’ equity 42,215 36,675
Net debt to shareholders’ equity ratio N/A 3%
During the current year, the Company acted as the guarantor in respect of certain loan facilities granted to its subsidiaries and an associate, and fully complied with the capital requirements under the loan facility agreements.

109ANNUAL REPORT 2009
35. NOTES TO CONSOLIDATED STATEMENT OF CASH FLOWS
(a) Cash from / (utilised in) Operations
HK$ million 2009 2008
Profit before taxation 5,572 4,443
Impairment losses – 427
Share of results of associates (3,398) (3,864)
Share of results of jointly controlled entities (455) (978)
Interest income from loans granted to associates (614) (522)
Interest income from banks (268) (429)
Interest income from investments in securities (97) (120)
Return from infrastructure project investments (27) (344)
Finance costs 423 481
Depreciation of property, plant and equipment 55 52
Amortisation of prepayment for leasehold land 9 9
Change in fair values of investment properties (10) 7
Gain on disposal of a subsidiary (1,314) (108)
Gain on disposals of infrastructure project investments – (112)
Loss / (Gain) on disposals of securities 6 (3)
Change in fair values of investments in securities (54) 491
Change in fair values of derivative financial instruments 33 (112)
Dividend from investments in securities (63) (49)
Pension costs of defined benefit retirement plans 10 (1)
Unrealised exchange gain (79) (177)
Returns received from jointly controlled entities 504 760
Returns received from infrastructure project investments 55 217
Distribution received from investment in securities 135 148
Advances to associates – (1,796)
Repayments from associates 1 108
Interest received from associates 501 648
Contributions to defined benefit retirement plans (8) (1)
Net cash (paid) / received at close of derivative financial instruments (318) 314
Operating cash flows before changes in working capital 599 (511)
Increase in inventories (30) (65)
Decrease / (Increase) in debtors and prepayments 995 (766)
Increase / (Decrease) in creditors and accruals 60 (140)
Exchange translation differences 2 48
Cash from / (utilised in) operations 1,626 (1,434)

110 CHEUNG KONG INFRASTRUCTURE HOLDINGS LIMITED
NOTES TO THE CONSOLIDATED FINANCIAL STATEMENTS
35. NOTES TO CONSOLIDATED STATEMENT OF CASH FLOWS (CONT’D)
(b) Disposal of a Subsidiary
HK$ million 2009 2008
Net assets disposed of:
Property, plant and equipment – 9
Leasehold land – 1
Bank balances and deposits – 1
Creditors and accruals – (6)
Interests in jointly controlled entities 2,727 –
Interests in infrastructure project investments 601 –
Deferred tax liabilities (20) –
3,308 5
Release of exchange translation reserve (12) (6)
3,296 (1)
Gain on disposal of a subsidiary 1,314 108
Adjustment for unrealised gain on disposal 844 –
Provision for consideration adjustment 12 –
Provision for transaction costs 1 –
Total consideration 5,467 107
Satisfied by:
Cash 5,467 107
Analysis of the net cash flow arising on the disposal:
HK$ million 2009 2008
Cash consideration 5,467 107
Bank balances and deposits disposed of – (1)
Net cash inflow arising on disposal 5,467 106

111ANNUAL REPORT 2009
36. EMOLUMENTS OF DIRECTORS AND FIVE HIGHEST PAID INDIVIDUALS
Directors’ emoluments comprise payments to the Company’s directors by the Group in connection with the management of the affairs of the Group. The independent non-executive directors (“INED”) receive an annual director’s fee of HK$75,000 each; and for those acting as the audit committee members (“ACM”) and remuneration committee members (“RCM”), additional annual fee of HK$80,000 each is paid for the former and HK$25,000 each is paid for the latter. The emoluments of each of the Company’s directors for the current year, excluding emoluments received from the Group’s associates, are as follows:
Basic Salaries, Provident Inducement or Total Total Allowances and Fund Compensation Emoluments EmolumentsHK$ million Fees Other Benefits Bonuses Contributions Fees 2009 2008
Li Tzar Kuoi, Victor (1) 0.075 – 11.110 – – 11.185 9.975
Kam Hing Lam (1) 0.075 4.200 4.853 – – 9.128 8.595
Ip Tak Chuen, Edmond 0.075 1.800 5.555 – – 7.430 6.825
Fok Kin Ning, Canning (1) 0.075 – – – – 0.075 0.075
Andrew John Hunter (1) 0.075 6.642 3.669 0.663 – 11.049 10.700
Chow Woo Mo Fong, Susan (1) 0.075 – – – – 0.075 0.075
Frank John Sixt (1) 0.075 – – – – 0.075 0.075
Tso Kai Sum (1) 0.075 – – – – 0.075 0.075
Cheong Ying Chew, Henry (2) 0.180 – – – – 0.180 0.180
Kwok Eva Lee (2) 0.155 – – – – 0.155 0.155
Sng Sow-Mei (2) 0.155 – – – – 0.155 0.155
Colin Stevens Russel (2) 0.180 – – – – 0.180 0.180
Lan Hong Tsung, David (2) 0.155 – – – – 0.155 0.155
Lee Pui Ling, Angelina 0.075 – – – – 0.075 0.075
Barrie Cook 0.075 – – – – 0.075 0.075
George Colin Magnus (1) 0.075 – – – – 0.075 0.075
Total for the year 2009 1.650 12.642 25.187 0.663 – 40.142
Total for the year 2008 1.650 12.627 22.505 0.663 – 37.445
Notes:
(1) During the current year, Mr. Li Tzar Kuoi, Victor, Mr. Kam Hing Lam, Mr. Andrew John Hunter, Mrs. Chow Woo Mo Fong, Susan, Mr. Frank John Sixt, Mr. Tso Kai Sum and Mr. George Colin Magnus each received directors’ fees of HK$70,000 (2008: HK$70,000), Mr. Fok Kin Ning, Canning received director’s fees of HK$120,000 (2008: HK$120,000) from Hongkong Electric. Except for HK$70,000 (2008: HK$70,000) received by Mr. George Colin Magnus, the directors’ fees totalling HK$540,000 (2008: HK$540,000) were then paid back to the Company.
(2) INED, ACM and RCM – During the year, Mr. Cheong Ying Chew, Henry, Ms. Kwok Eva Lee, Mr. Lan Hong Tsung, David, Mr. Colin Stevens Russel and Ms. Sng Sow-Mei have acted as INED and ACM of the Company. Mr. Cheong Ying Chew, Henry and Mr. Colin Stevens Russel have acted as RCM of the Company during the year. The total emoluments paid to these INED, ACM and RCM during the current year are HK$825,000 (2008: HK$825,000).
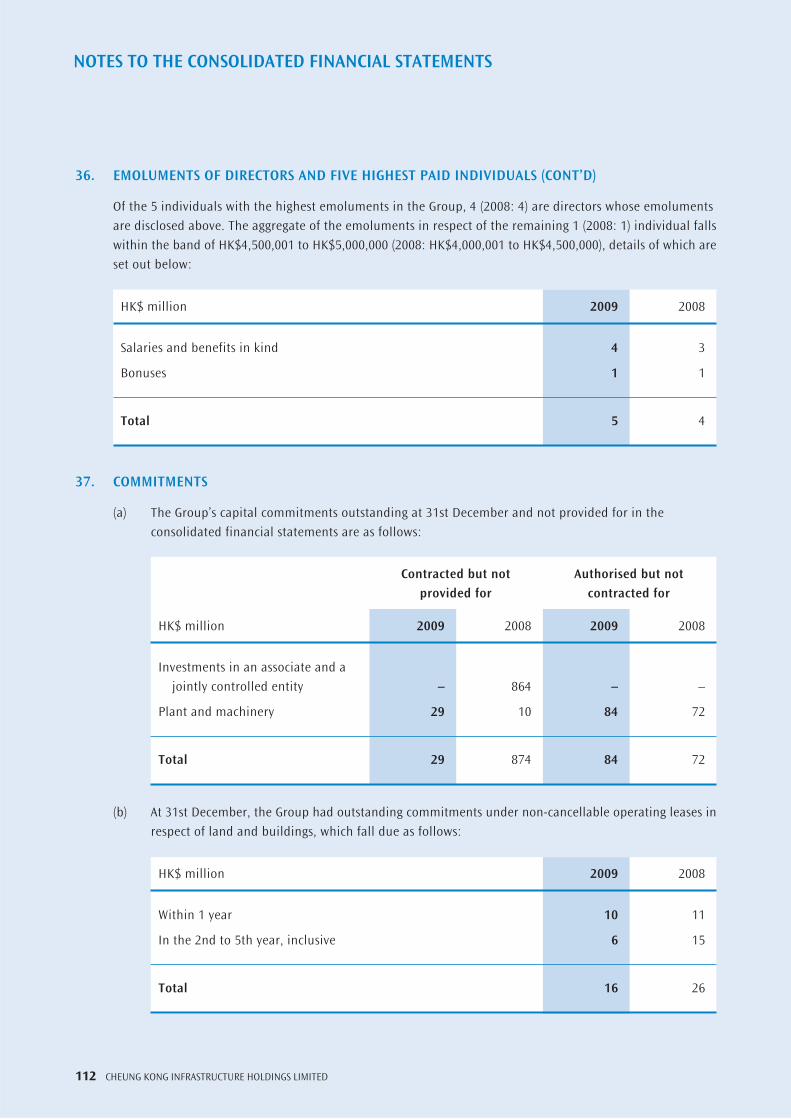
112 CHEUNG KONG INFRASTRUCTURE HOLDINGS LIMITED
NOTES TO THE CONSOLIDATED FINANCIAL STATEMENTS
36. EMOLUMENTS OF DIRECTORS AND FIVE HIGHEST PAID INDIVIDUALS (CONT’D)
Of the 5 individuals with the highest emoluments in the Group, 4 (2008: 4) are directors whose emoluments are disclosed above. The aggregate of the emoluments in respect of the remaining 1 (2008: 1) individual falls within the band of HK$4,500,001 to HK$5,000,000 (2008: HK$4,000,001 to HK$4,500,000), details of which are set out below:
HK$ million 2009 2008
Salaries and benefits in kind 4 3
Bonuses 1 1
Total 5 4
37. COMMITMENTS
(a) The Group’s capital commitments outstanding at 31st December and not provided for in the consolidated financial statements are as follows:
Contracted but not Authorised but not provided for contracted for
HK$ million 2009 2008 2009 2008
Investments in an associate and a jointly controlled entity – 864 – –
Plant and machinery 29 10 84 72
Total 29 874 84 72
(b) At 31st December, the Group had outstanding commitments under non-cancellable operating leases in respect of land and buildings, which fall due as follows:
HK$ million 2009 2008
Within 1 year 10 11
In the 2nd to 5th year, inclusive 6 15
Total 16 26

113ANNUAL REPORT 2009
38. CONTINGENT LIABILITIES
HK$ million 2009 2008
Guarantee in respect of bank loan drawn by an associate 1,147 871
39. MATERIAL RELATED PARTY TRANSACTIONS
During the year, the Group advanced HK$8 million (2008: HK$1,805 million) to its unlisted associates. The Group received repayments totalling HK$1 million (2008: HK$108 million) from unlisted associates. The total outstanding loan balances as at 31st December, 2009 amounted to HK$6,313 million (2008: HK$5,288 million), of which HK$28 million (2008: HK$23 million) bore interest with reference to Australian Bank Bill Swap Reference Rate and HK$5,948 million (2008: HK$4,857 million) at fixed rates ranging from 10.85 per cent to 12.25 per cent (2008: from 10.85 per cent to 12.25 per cent) per annum and HK$337 million (2008: HK$404 million) was interest-free. The average effective interest rate of the loan granted to associates is 10.07 per cent (2008: 13.51 per cent) per annum. As stated in note 6, interest from loans granted to associates during the year amounted to HK$614 million (2008: HK$522 million). Except for a loan of HK$94 million (2008: HK$94 million) which was repayable within twelve years (2008: thirteen years), the loans had no fixed terms of repayment.
During the year, the Group advanced HK$15 million (2008: HK$47 million) to and received loan repayments totalling HK$4 million (2008: nil) from its jointly controlled entities. The total outstanding loan balances as at 31st December, 2009 amounted to HK$454 million (2008: HK$443 million), of which HK$251 million (2008: HK$251 million) bore interest with reference to Hong Kong dollar prime rate, and HK$203 million (2008: HK$192 million) was interest-free. The loans had no fixed terms of repayment.
Moreover, the Group’s sales and purchases of infrastructure materials to / from a jointly controlled entity for the current year amounted to HK$241 million (2008: HK$207 million) and HK$13 million (2008: HK$13 million), respectively.
During the year the Group acquired notional HK$1,349 million notes in the secondary markets issued by Hutchison Whampoa International (03/33) Limited at a cost of HK$1,423 million, which is wholly-owned subsidiary of Hutchison Whampoa Limited, the ultimate holding company of the Company.
The details of the disposal of a subsidiary to HK Electric during the year have been presented in notes 10 and 35(b).
The emoluments of key management have been presented in note 36 above.

114 CHEUNG KONG INFRASTRUCTURE HOLDINGS LIMITED
NOTES TO THE CONSOLIDATED FINANCIAL STATEMENTS
40. STATEMENT OF FINANCIAL POSITION OF THE COMPANY
as at 31st December
HK$ million 2009 2008
Total assets 30,598 30,585
Total liabilities (45) (43)
Net assets 30,553 30,542
Representing:
Share capital 2,254 2,254
Reserves 28,299 28,288
Total equity 30,553 30,542
Of the Group’s profit attributable to shareholders of the Company for the current year, HK$2,625 million (2008: HK$2,553 million) has been dealt with in the financial statements of the Company.
Total distributable reserves of the Company amounted to HK$24,463 million as at 31st December, 2009 (2008: HK$24,452 million).
41. COMPARATIVE FIGURES
Certain comparative figures have been restated to conform to the current year’s presentation.
42. APPROVAL OF CONSOLIDATED FINANCIAL STATEMENTS
The consolidated financial statements set out on pages 52 to 117 were approved by the Board of Directors on 4th March, 2010.

PRINCIPAL SUBSIDIARIES
115ANNUAL REPORT 2009
APPENDIX 1
The table below shows the subsidiaries as at 31st December, 2009 which, in the opinion of the Directors, principally affected the results or assets of the Group. To give details of all the subsidiaries would, in the opinion of the Directors, result in particulars of excessive length.
Proportion of nominal value Issued share of issued capital capital held Par value by the GroupName Number per share (per cent) Principal activities
Incorporated and operating in Hong KongAnderson Asia (Holdings) Limited 2 ordinary HK$0.5 100 Investment holding 65,780,000 HK$0.5 – non-voting deferred
Anderson Asphalt Limited 36,000 HK$100 100 Production and ordinary laying of asphalt and investment holding
China Cement Company (International) Limited 1,000,000 HK$1 70 Investment holding ordinary
Green Island Cement Company, Limited 76,032,000 HK$2 100 Manufacturing, sale and ordinary distribution of cement and property investment
Green Island Cement (Holdings) Limited 101,549,457 HK$2 100 Investment holding ordinary
Incorporated in British Virgin Islands and operating in Hong KongCheung Kong Infrastructure Finance (BVI) Limited 1 ordinary US$1 100 Financing
Daredon Assets Limited 1 ordinary US$1 100 Treasury
Green Island International (BVI) Limited 1 ordinary US$1 100 Investment holding
Incorporated and operating in AustraliaCheung Kong Infrastructure Finance (Australia) Pty Ltd 1 ordinary A$1 100 Financing
Incorporated and operating in the United KingdomCambridge Water PLC 14,621,152 £0.05 100 Water supply ordinary
Note: The shares of all the above subsidiaries are indirectly held by the Company.
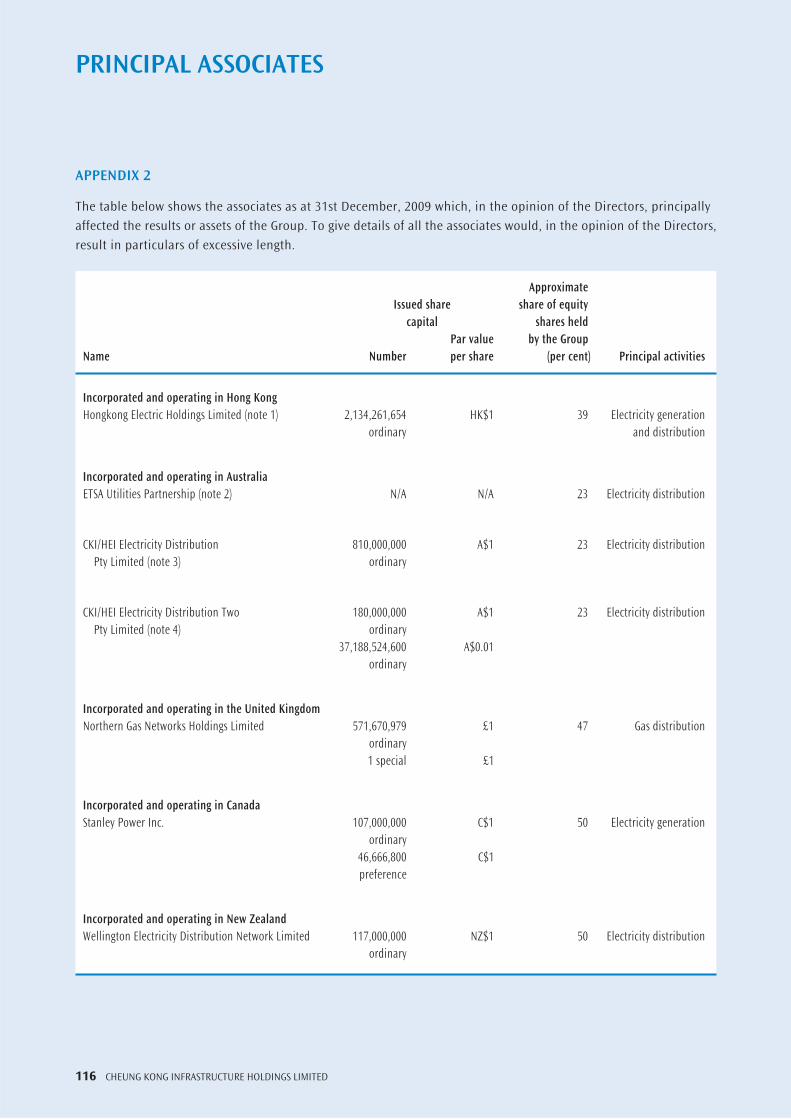
PRINCIPAL ASSOCIATES
116 CHEUNG KONG INFRASTRUCTURE HOLDINGS LIMITED
APPENDIX 2
The table below shows the associates as at 31st December, 2009 which, in the opinion of the Directors, principally affected the results or assets of the Group. To give details of all the associates would, in the opinion of the Directors, result in particulars of excessive length.
Approximate Issued share share of equity capital shares held Par value by the GroupName Number per share (per cent) Principal activities
Incorporated and operating in Hong KongHongkong Electric Holdings Limited (note 1) 2,134,261,654 HK$1 39 Electricity generation ordinary and distribution
Incorporated and operating in AustraliaETSA Utilities Partnership (note 2) N/A N/A 23 Electricity distribution
CKI/HEI Electricity Distribution 810,000,000 A$1 23 Electricity distribution Pty Limited (note 3) ordinary
CKI/HEI Electricity Distribution Two 180,000,000 A$1 23 Electricity distribution Pty Limited (note 4) ordinary 37,188,524,600 A$0.01 ordinary
Incorporated and operating in the United KingdomNorthern Gas Networks Holdings Limited 571,670,979 £1 47 Gas distribution ordinary 1 special £1
Incorporated and operating in CanadaStanley Power Inc. 107,000,000 C$1 50 Electricity generation ordinary 46,666,800 C$1 preference
Incorporated and operating in New ZealandWellington Electricity Distribution Network Limited 117,000,000 NZ$1 50 Electricity distribution ordinary
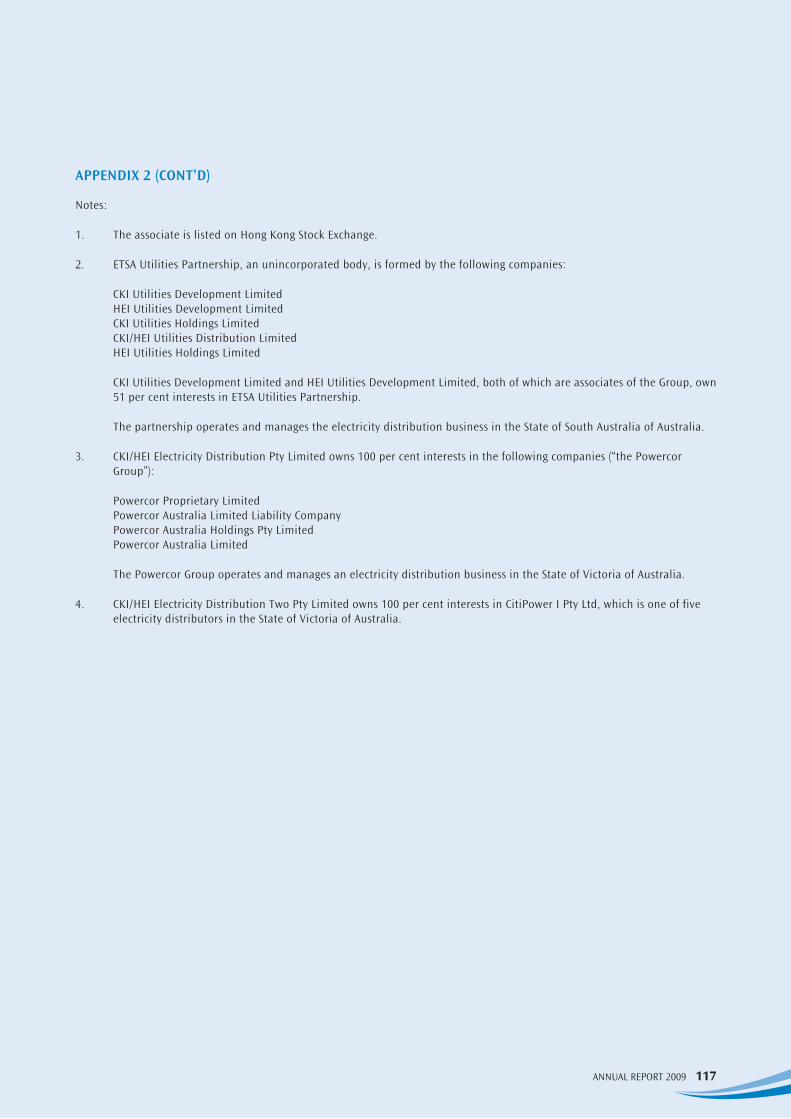
117ANNUAL REPORT 2009
APPENDIX 2 (CONT’D)
Notes:
1. The associate is listed on Hong Kong Stock Exchange.
2. ETSA Utilities Partnership, an unincorporated body, is formed by the following companies:
CKI Utilities Development LimitedHEI Utilities Development LimitedCKI Utilities Holdings LimitedCKI/HEI Utilities Distribution LimitedHEI Utilities Holdings Limited
CKI Utilities Development Limited and HEI Utilities Development Limited, both of which are associates of the Group, own 51 per cent interests in ETSA Utilities Partnership.
The partnership operates and manages the electricity distribution business in the State of South Australia of Australia.
3. CKI/HEI Electricity Distribution Pty Limited owns 100 per cent interests in the following companies (“the Powercor Group”):
Powercor Proprietary LimitedPowercor Australia Limited Liability CompanyPowercor Australia Holdings Pty LimitedPowercor Australia Limited
The Powercor Group operates and manages an electricity distribution business in the State of Victoria of Australia.
4. CKI/HEI Electricity Distribution Two Pty Limited owns 100 per cent interests in CitiPower I Pty Ltd, which is one of five electricity distributors in the State of Victoria of Australia.

SCHEDULE OF MAJOR PROPERTIES
118 CHEUNG KONG INFRASTRUCTURE HOLDINGS LIMITED
APPENDIX 3
Approximate floor / site area Group‘s attributable Lot Interest to the Group Existing LeaseLocation Number (per cent) (sq. m.) Usage Term
14-18 Tsing Tim Street, Tsing Yi TYTL 98 100 3,355 I Medium
TMTL 201 Tap Shek Kok TMTL 201 100 152,855 I Medium
Certain units of Harbour Centre Tower 2, 8 Hok Cheung Street, Hunghom KML113 100 5,528 C Medium
I: Industrial C: Commercial