consolidated interim financial results for fy ending …...smart labo rakuten ichiba merged into sl...
TRANSCRIPT

1
November 17, 2015
TSE 3738
Disclaimer
*This material contains statements about the future performance of T-
Gaia, which are based on management’s assumptions and beliefs
taking information currently available into consideration. Therefore,
please be advised that T-Gaia’s actual results could differ materially
from those described in these forward-looking statements as a result of
numerous factors, including general economic conditions in T-Gaia’s
principal markets as well as other factors detailed from time to time.
Consolidated Interim Financial Results for FY ending March 2016

Outline of Consolidated Interim Financial Results for FY ending March 2016
2

Summary of Consolidated Interim Financial Results
(Unit : 0 .1 billion yen)15/3 1HResulsts
16/3 1HResults
y/y Change16/3 Full-year
ForecastsAchievment Ratio
Net Sales 2,873.4 2,849.9 99.2% 6,550.0 43.5%
Gross Margin 293.6 298.1 101.5% 635.0 47.0%
(to Net Sales) 10.2% 10.5% +0.3 p 9.7% -
SGA Expsnse 234.9 233.0 99.2% 485.0 48.0%
Operating Income 58.6 65.1 111.0% 150.0 43.4%
(to Net Sales) 2.0% 2.3% +0.3 p 2.3% -
Ordinary Income 58.3 65.1 111.6% 149.0 43.7%
(to Net Sales) 2.0% 2.3% +0.3 p 2.3% -
Net Income Attributableto Shareholders of theParent Company
31.8 38.0 119.5% 90.0 42.3%
(to Net Sales) 1.1% 1.3% +0.2 p 1.4% -
3
2,645 2,313 2,344
144
132 135
543
427 370
41.2 43.3 44.3
14.3 12.8 13.7
5.8 2.5
6.9
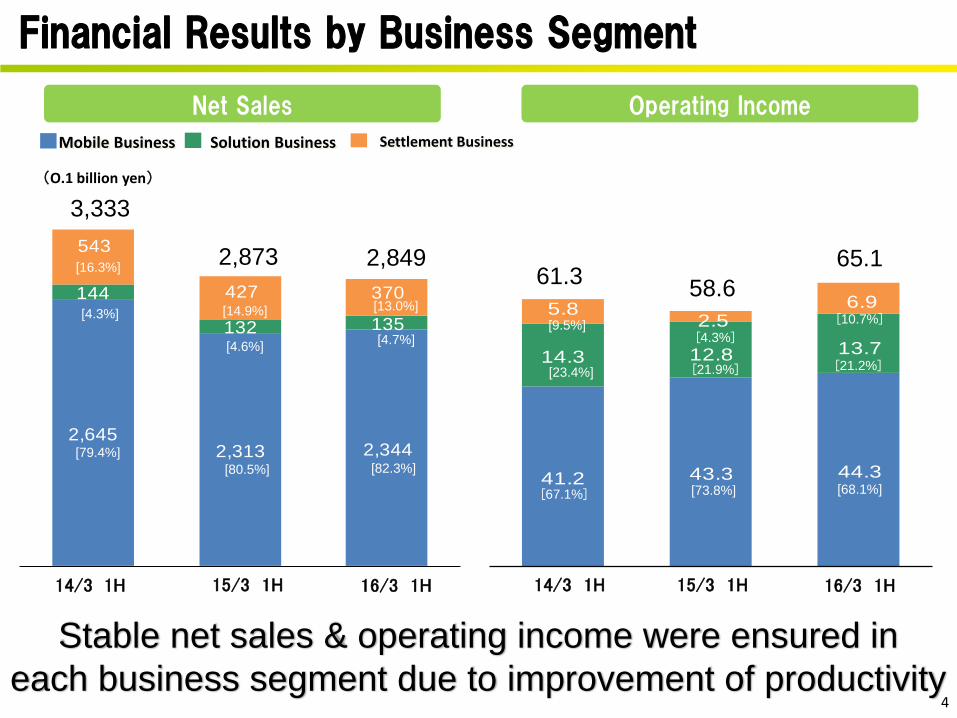
Financial Results by Business Segment
[82.3%]
[4.7%]
[13.0%]
[68.1%]
15/3 1H 16/3 1H
[10.7%]
[21.2%]
Mobile Business Solution Business Settlement Business
(O.1 billion yen)
4
[80.5%]
[4.6%]
[14.9%]
[6.1%]
[4.3%]
[73.8%]
Net Sales Operating Income
2,873
58.6
65.1
14/3 1H
3,333
61.3
[79.4%]
[4.3%]
[16.3%]
[9.5%]
[67.1%]
2,849
[23.4%]
15/3 1H 16/3 1H 14/3 1H
[21.9%]
Stable net sales & operating income were ensured in
each business segment due to improvement of productivity

Smart-phone & Tablets
15/3期
1Q
15/3期
2Q
15/3期
3Q
15/3期
4Q
16/3期
1Q
16/3期
2Q
101
129140 140
103112
Company-wide Unit Sales
Smart Device Ratio
67.8%
15/3 1H 16/3 1H
Smart Device Ratio
75.0%
5
Unit Sales on Quarterly Basis
(10 thousand units)
231 216
Mobile-phone & Tablet Unit Sales
Smart Device Ratio Increased due to
Strengthening of Sales Activities
※ Including Wi-Fi models
Feature phones, etc.
65.0%
70.1% 77.8% 77.2%
74.0% 75.9% Increase by
7.2points

Tablet Unit Sales & Net Sales of Related Products
15/3 1H 16/3 1H
6
Tablet Unit Sales
Increased by approx. 25%
on a year-on-year basis
Net Sales of Related Products Related Products …Accessory for Smart Device, etc.
15/3 1H 16/3 1H
※ Including Wi-Fi models
Increased by
Approx. 25% Increased by
Approx.41%
Increased by approx. 41%
on a year-on-year basis
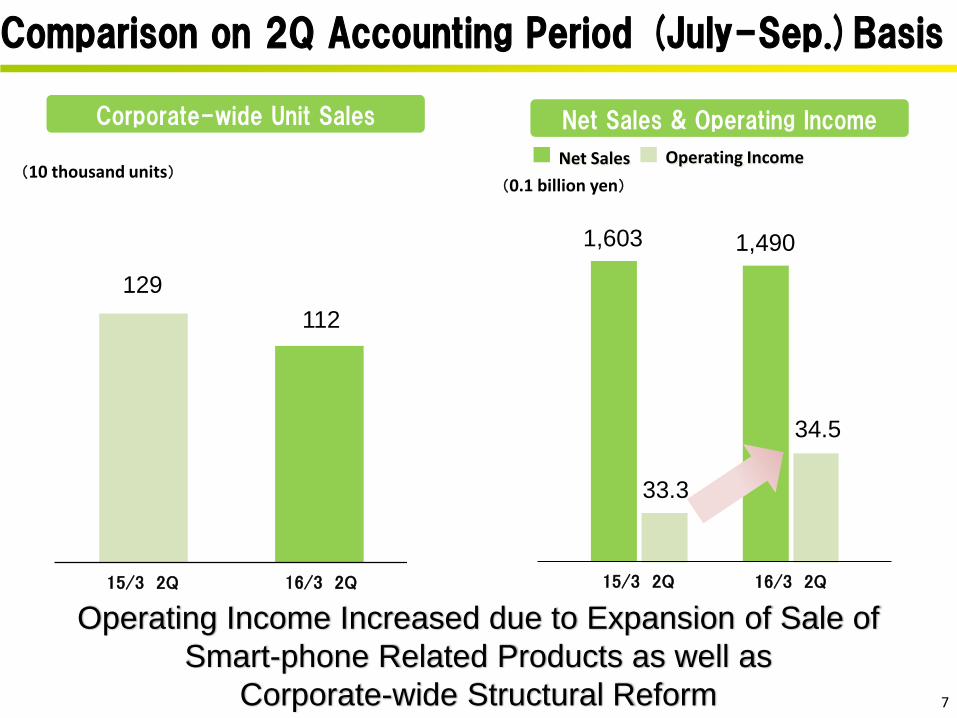
Comparison on 2Q Accounting Period (July-Sep.)Basis
7
Corporate-wide Unit Sales
Operating Income Increased due to Expansion of Sale of
Smart-phone Related Products as well as
Corporate-wide Structural Reform
33.3
1,603
34.5
1,490
Net Sales
Net Sales & Operating Income
Operating Income
15/3 2Q 16/3 2Q
129
112
(0.1 billion yen) (10 thousand units)
15/3 2Q 16/3 2Q
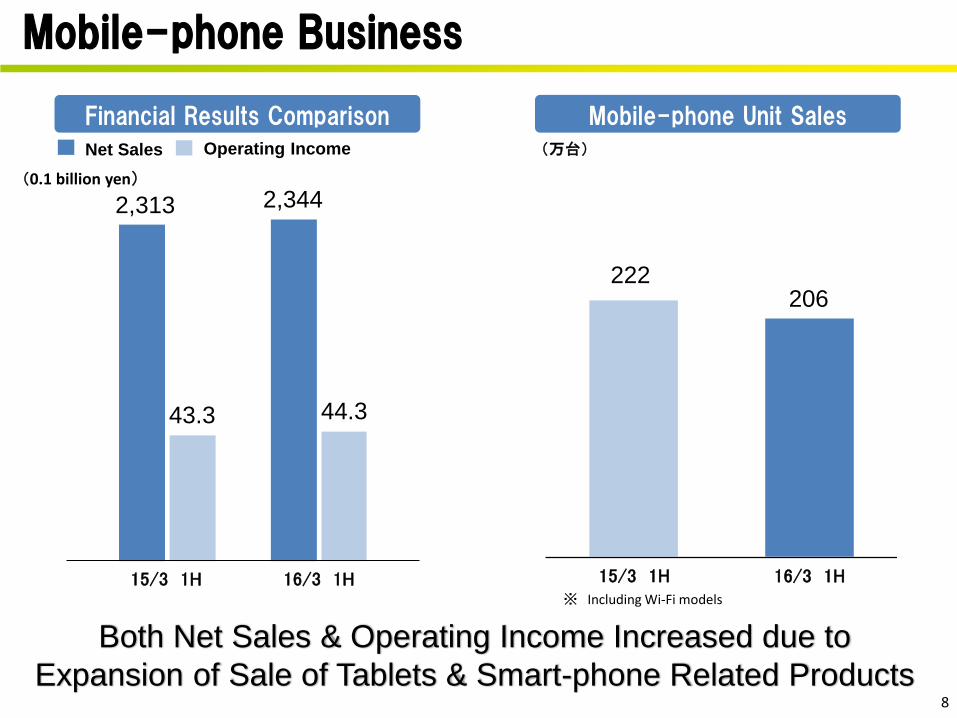
Mobile-phone Business
15/3 1H 16/3 1H 15/3 1H 16/3 1H
8
222 206
Financial Results Comparison Mobile-phone Unit Sales
(万台)
43.3 44.3
2,313 2,344 (0.1 billion yen)
Net Sales Operating Income
Both Net Sales & Operating Income Increased due to
Expansion of Sale of Tablets & Smart-phone Related Products
※ Including Wi-Fi models

255 250 224
782 712 672
1,192 1,194 1,237
80 80
0
1,000
2,000
3,000
14/9末 15/3末 15/9末
併売店等 量販店
3,370 3,102.72
1,192 1,194 1,237
255 250 224
782 712 672
15 14 14
10 8 8
14/9末 15/3末 15/9末
2,254 2,178 2,155
Total No. of Sales Bases for Mobile-phone Business
9
Change of Total No. of Sales Bases
Carrier Shop Multi-carrier Shop
Large Retail Store & GMS Accessory Shop (incl. EC site)
China Unicom Shop (in Settlement Service & Other Business Segment)
Sep. 2014 Sep. 2015 March 2015

10
Accessory Shops ①
“Smart Labo Kobe Sannomiya”
opened on July 24 in Kobe
“Smart Labo Namba Ebisubashi”
opened on July 3 in Osaka
Newly-opened Shops

Accessory Shops ②
11
Net Sales
15/3 1H 16/3 1H
No. of Accessory Shops
Sep. 2014 Sep. 2015
15 14
※ Including EC site
Increased by 40%
Net Sales Increased by 40% on a year-on-year basis
due to Expansion of Sale of Accessory
July 2015 Smart Labo Namba Ebisubashi opened Smart Labo Kobe Sannomiya opened
Smart Labo AEON Mall Natori closed Smart Labo Rakuten Ichiba merged into SL Online AppBank Store Harajuku closed
March 2015 June 2015 Sep.2015
Shop Information
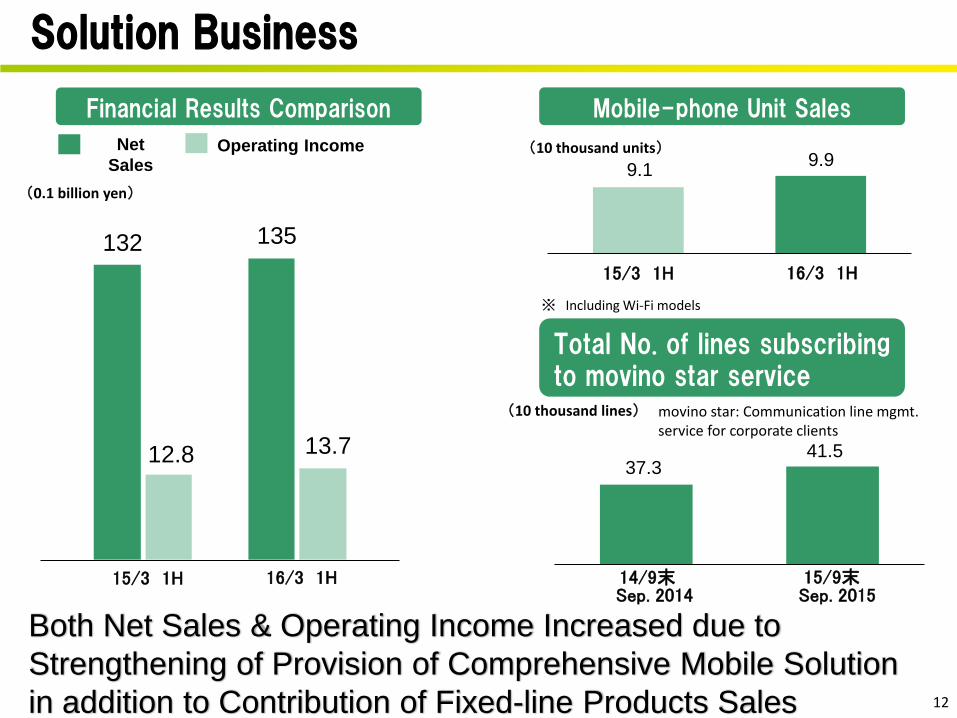
Solution Business
15/3 1H 16/3 1H
12
15/9末
16/3 1H 15/3 1H
Financial Results Comparison Mobile-phone Unit Sales
Total No. of lines subscribing to movino star service
9.1 9.9
(10 thousand units)
(10 thousand lines)
41.5 37.3
132 135
12.8 13.7
(0.1 billion yen)
Net
Sales Operating Income
14/9末
Both Net Sales & Operating Income Increased due to
Strengthening of Provision of Comprehensive Mobile Solution
in addition to Contribution of Fixed-line Products Sales
movino star: Communication line mgmt. service for corporate clients
※ Including Wi-Fi models
Sep. 2014 Sep. 2015
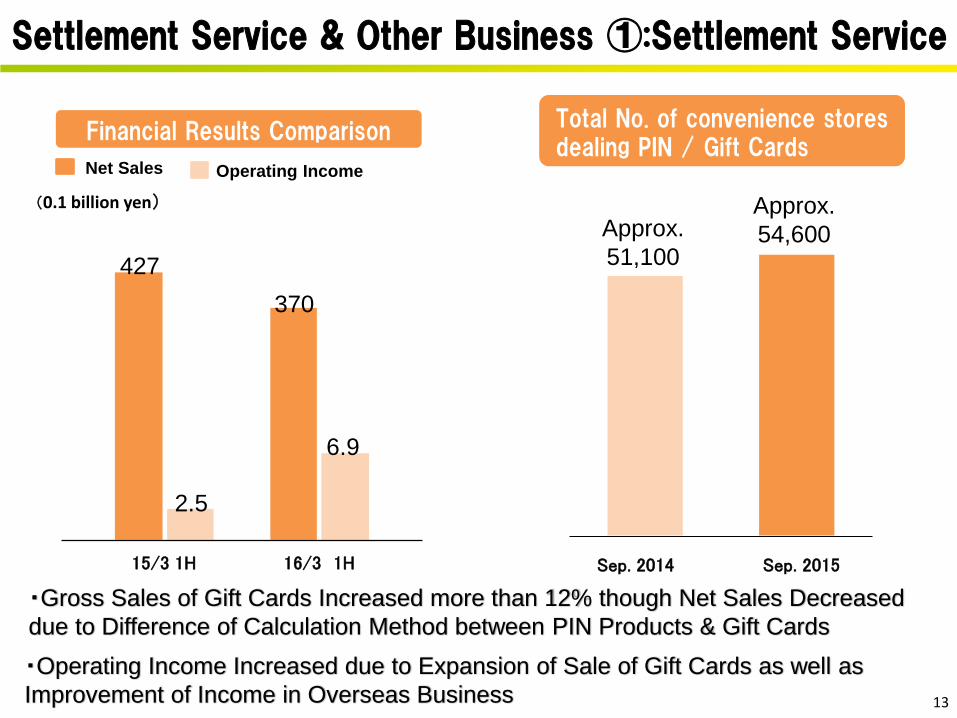
Total No. of convenience stores dealing PIN / Gift Cards
Settlement Service & Other Business ①:Settlement Service
15/3 1H 16/3 1H Sep. 2014 Sep. 2015
13
Approx.
51,100
Approx.
54,600
Financial Results Comparison
427
370
2.5
6.9
(0.1 billion yen)
Net Sales Operating Income
・Operating Income Increased due to Expansion of Sale of Gift Cards as well as
Improvement of Income in Overseas Business
・Gross Sales of Gift Cards Increased more than 12% though Net Sales Decreased
due to Difference of Calculation Method between PIN Products & Gift Cards

14
● Operating Eight China Unicom Shops in Shanghai (As of Sep. 30, 2015)
Singapore
China: Shanghai
Settlement Service & Other Business ②:Overseas Business
● Promoted Expansion of Both Product Lineups & Sales Channels
● Distributing Gift Cards at approx. 600 Convenience Stores in Singapore (as of Sep. 30, 2015)
● Income Improved due to Strengthening of Sale in Shops and Reduction of SGA Expenses

15
Forecasts for Consolidated Financial Results for FY ending March 2016 & Future Development

16
Corporate Philosophy
TG Vision – Corporate Vision of T-Gaia
Lead the Way toward the Future & Take a Leap for Tomorrow
TG Action – Our Code of Conduct -
TG Mission – Corporate Mission of T-Gaia -
● T-Gaia will propose new ways of communication to provide
our customers with excitement, delight, and safety.
●T-Gaia will thank its employees as well as their families and
provide them with equal opportunities and rewards to challenge
something new.
●T-Gaia will develop strong relationships with all the business
partners and seek for mutual benefit under the fair and healthy
conditions of business transaction.
●T-Gaia will contribute to all societies and regional communities
through our global business activities.
●T-Gaia will thank all the stakeholders including our
shareholders for their trust and confidence in our practice, and
keep enhancing our corporate value.
● As a leading company in the industry, T-Gaia will go ahead of
change of the times to develop new markets in addition to
expanding our existing businesses.
● We always act with a customer-driven attitude.
● We provide the highest-quality service to be appreciated by
everyone.
● We keep moving ourselves higher as professionals.
● We respect and compete with each other to develop our
infinite potentials.
● We seek for open & constructive communication.
● We value teamwork to achieve the best performance.
● We always act on high ethical standards and strengthen our
compliance structure.
● We are not satisfied with our current situation; we keep
challenging something new aggressively with our passion and a sense of speed.

Consolidated Forecasts for FY ending March 2016 ①
17
(Unit:0.1 billion yen)15/3 Full-
year Results
16/3 Full-year
Forecasts
Change ofAmount
Year-on-Year Basis
(%)
AchievmentRatio
Net Sales 6,420.9 6,550.0 129.1 102.0% 43.5%
Gross Margin 619.8 635.0 15.2 102.4% 47.0%
SGA Expenses 476.7 485.0 8.3 101.7% 48.0%
Operating Income 143.0 150.0 7.0 104.8% 43.4%
Ordinary Income 141.9 149.0 7.1 105.0% 43.7%
Net Income Attributable toShareholders of the Parent Company
77.4 90.0 12.6 116.2% 42.3%
Net Income / share(yen) 112.68 130.86 18.18 116.1% -
Dividend / share(yen) 37.50 41.00 3.50 109.3% -
Total No. of Mobile-phones to Sell 512 530 18 103.5% 40.8%

15/3 Results 16/3 Forecasts
18
Net Sales Operating
Income
(0.1 billion yen)
Company-wide Mobile-phone Unit Sales Forecasts
(10 thousand units)
※ Including Wi-Fi models
512 530
Consolidated Full-year Forecasts
Consolidated Forecasts for FY ending March 2016 ②
6,550
150.0
15/3 Results 16/3 Forecasts
6,420
143.0

15/3 Results 16/3 Forecasts
19
Net Sales Operating Income
5,500
107.0
15/3 Results 16/3 Forecasts
(0.1 billion yen)
5,335
111.2
Unit Sales Forecasts
(10 thousand units)
Full-year Forecasts
Full-year Forecasts & Action Plan : Mobile-phone Business Segment
※ Including Wi-Fi models
494 510
Future Action Plan
● Provide “One-stop Service” including optical fibers, tablets and products related to smart devices
● Share know-how on sales & education with agency distributors to strengthen sales force of TG Group
● Continue strategic investment in career shops as well as & sales staff
● Carry on structural reform focusing on productivity & operational efficiency
20
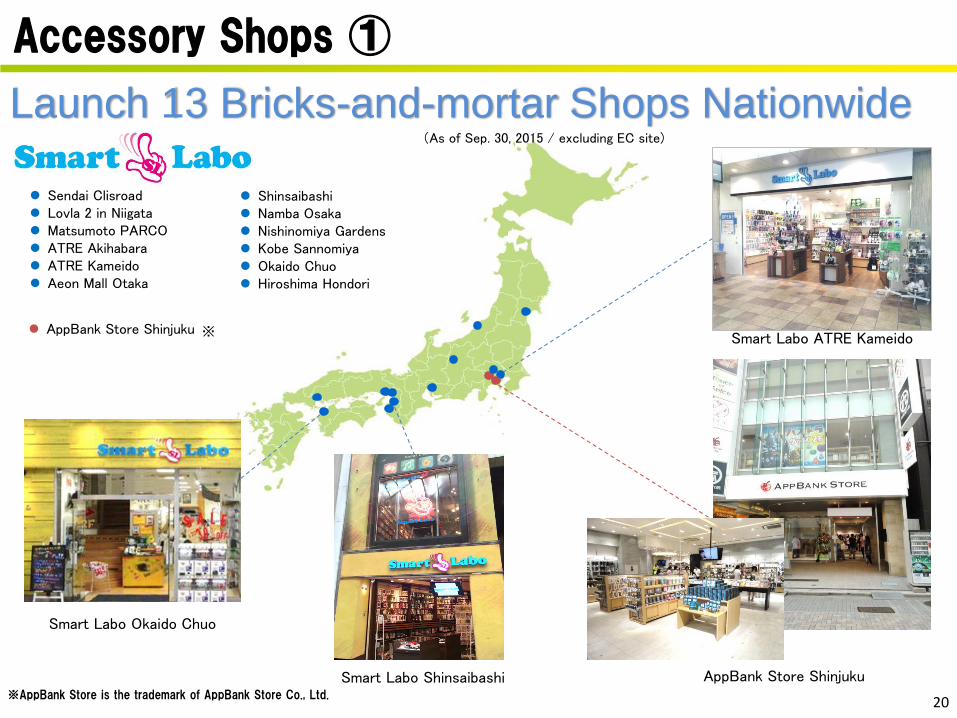
Smart Labo Shinsaibashi
Smart Labo ATRE Kameido
Launch 13 Bricks-and-mortar Shops Nationwide (As of Sep. 30, 2015 / excluding EC site)
Sendai Clisroad Lovla 2 in Niigata Matsumoto PARCO ATRE Akihabara ATRE Kameido Aeon Mall Otaka
Shinsaibashi Namba Osaka Nishinomiya Gardens Kobe Sannomiya Okaido Chuo Hiroshima Hondori
AppBank Store Shinjuku
Smart Labo Okaido Chuo
AppBank Store Shinjuku ※AppBank Store is the trademark of AppBank Store Co., Ltd.
Accessory Shops ①
※
21
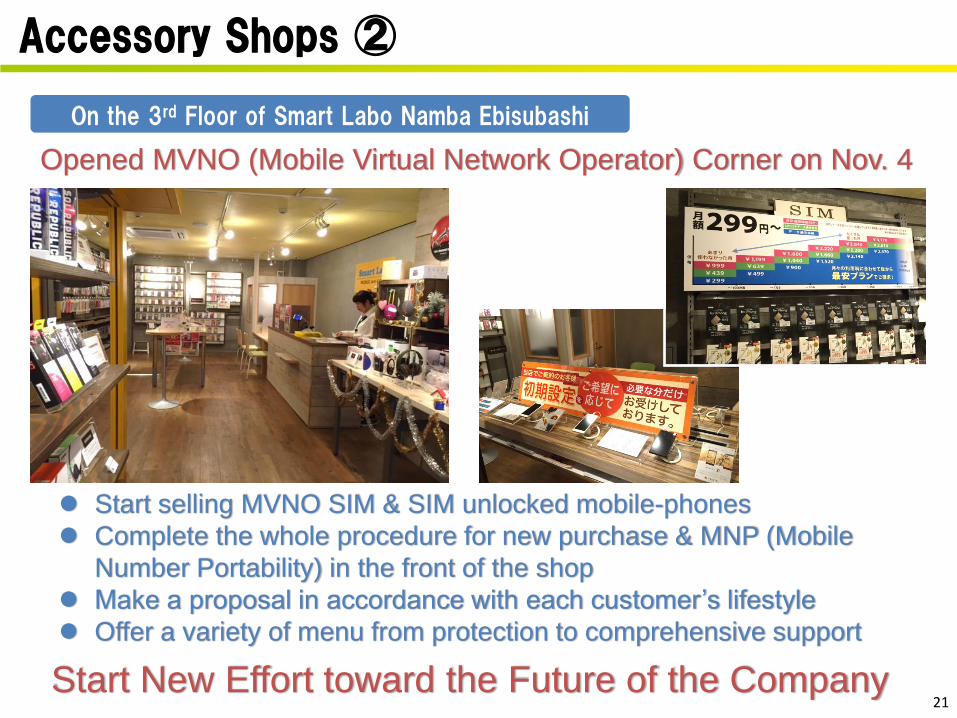
On the 3rd Floor of Smart Labo Namba Ebisubashi
Accessory Shops ②
Start New Effort toward the Future of the Company
Start selling MVNO SIM & SIM unlocked mobile-phones
Complete the whole procedure for new purchase & MNP (Mobile
Number Portability) in the front of the shop
Make a proposal in accordance with each customer’s lifestyle
Offer a variety of menu from protection to comprehensive support
Opened MVNO (Mobile Virtual Network Operator) Corner on Nov. 4

22
Staff Education &Training ①
Intensive training for newly hired staff (at Tokyo Head Office)
Continue Proactive Investment in Human Resources
Educational Staff Organization
Cultivation of Supervisors as Education/Training specialist
Provision education/training for Trainers in our corporate/regional headquarters
& branch offices
Provision education/training in each shop Deployed one trainer at every directly-
managed shop
8 Instructors
58 Supervisors
290
Trainers
Training Program Provided by Carrier Design Academy
Purpose Category Name of Program
Improve-ment of Basic
Customer Service Level
Basic training
Intensive training for newly hired staff (at Tokyo Head Office)
Mid-carrier staff training
Customer service training
Service quality improvement training
Stratified training
Training for sub-shop managers, leaders and chiefs
Training for shop managers
Response capabilities
Readiness improvement training
Preparation for qualifying test
Training for passing qualifying test conducted by telecom carriers
Improve-ment of Sales Skills
Floor management
Floor management training
Sales skills improvement
Sales skills improvement training
※As of Sep. 30, 2015
<7>
1 Staff Education &Training ②
23
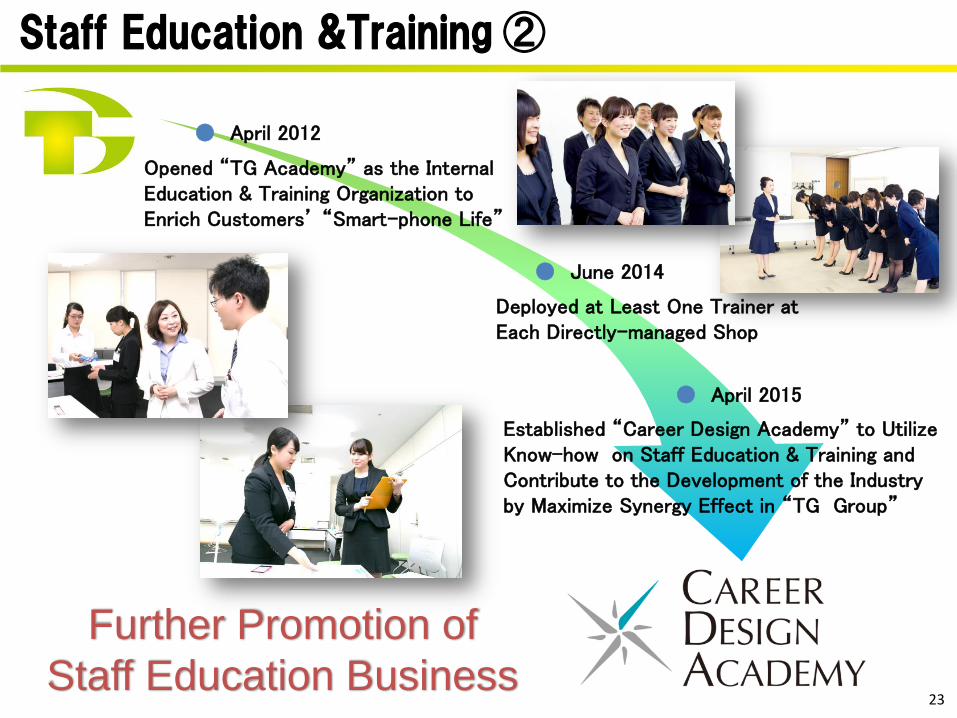
Opened “TG Academy” as the Internal Education & Training Organization to Enrich Customers’ “Smart-phone Life”
● June 2014
Deployed at Least One Trainer at Each Directly-managed Shop
● April 2015
● April 2012
Established “Career Design Academy” to Utilize Know-how on Staff Education & Training and Contribute to the Development of the Industry by Maximize Synergy Effect in “TG Group”
Further Promotion of
Staff Education Business

通期計画
Fixed-line Business
● Offer a comprehensive solution service optimized to corporate clients’ needs to support them in introducing & utilizing smart devices
24
Full-year Forecasts
Net Sales Operating Income
15/3 Results
16/3 Forecasts
(0.1 billion yen)
Future Action Plan
Unit Sales Forecasts
15/3 Results
16/3 Forecasts
(10 thousand units)
18.4 20.0
※ Including Wi-Fi models
● Extend customer base by improving convenience & CS among corporate clients through upgraded movino star (※) ※ movino star: telecommunication line mgmt. service
for corporate clients
Mobile Solution Business for Corporate Clients
● Expand sale of services with TG brand such as TG Hikari, TG Wi-Fi and TG. NET
262
24.9
270
28.5
Full-year Forecasts & Action Plan : Solution Business Segment

25
Renewal of movino star ( ※Telecommunication line mgmt. service for corporate clients )
①Expansion of Range of Line Mgmt. Service
Upgraded movino star in Nov. 2015 to Enhance the Convenience
②Advanced Function for Analysis
③Enhanced Function for Purchase ④Change of Interface to Improve Operability
Accessory can be purchased with terminals
Terminals without telecom lines such as Wi‐Fi models, etc.
+ Terminals with telecom lines
※1
Target : 415 thousand ID as of Sep. 2015 → 500 thousand ID as of Sep. 2016

Operating Income Net Sales
● Explore new sales channels
● Broaden both product lineup & sales channel based on the growing demand for Gift Cards to expand sales
26
Full-year Forecasts Future Action Plan
Overseas Business
● Mobile-phone Distribution Business in Shanghai
● Expand the product lineup of Gift Cards and move into the black at the early stage
● Instill Japanese style high-quality service and realize operational efficiency
1,020
1,200
11.5
7.7
15/3 Results
16/3 Forecasts
(0.1 billion yen)
Settlement Service Business
780
14.5
822
6.8
● Settlement Service Business in Singapore
Full-year Forecasts & Action Plan : Settlement Service & Other Business Segment
● Implement aggressive sales activities based on the needs of users

124
151145 148
118127
143150
28.6%
28.5%
22.7%
28.3%
23.4%
26.4%
29.4%27.9%
Transition of ROE & Operating Income
10/3 11/3
Operating Income
(0.1 billion yen)
27
Transition of ROE & Operating Income
13/3 09/3 12/3
ROE: Return on Equity
14/3 15/3 16/3 (Forecasts)
Selected as issue consists of “JPX Nikkei Index”
three consecutive times in August 2015 based on
high level of ROE & Operating Income
※

18.7522.50
25.0027.50
30.0027.50
32.5035.00 35.00
37.50
06/3期 07/3期 08/3期 09/3期 10/3期 11/3期 12/3期 13/3期 14/3期 15/3期 16/3期
(予想)
Net Income per share
記念配当
Return to Shareholders: Dividend Policy
53.52
62.54 61.14
77.11 79.3973.71
92.76
82.7786.74
112.68
06/3期 07/3期 08/3期 09/3期 10/3期 11/3期 12/3期 13/3期 14/3期 15/3期 16/3期
(予想)
130.86
Dividend per share & payout ratio
Targeting & Maintaining Dividend Payout Ratio over 30% Level
(Forecast)
28
41.0 yen/share (Interim:20.5 yen/share & Year-end:20.5 yen /share)
Dividend per share for FY ending March 2016 (Forecast)
Basic Dividend Policy
Forecast Dividend Increase of 3.5 yen / share on a year-on-year basis
(yen)
35.0%
36.0%
40.9%
35.7%
37.8% 37.3%
35.0%
42.3%40.3%
33.3%
31.3%
一株当たり配当額
41.00
配当性向
(yen)
(Forecast)
Memorial dividend Dividend per share
Payout ratio (%)

29
Medium-term Goal
Toward the FY 2020 (FY ending March 2021), T-Gaia set a medium-term goal to realize sustainable growth and to respond to the expectations of all stakeholders including shareholders and employees by achieving the following objectives based on the Corporate Philosophy released April 2014. ● Firmly maintain the position as the leading company in the core business of mobile-phone distribution
● Grow solution business for corporate clients, settlement service and overseas business as the strong core business ● Create & explore new business opportunities in the mobile & Internet industries ● Maintain the dividend payout ratio over 30% In order to realize the objectives noted above, T-Gaia are taking concrete measures every day setting the following points as the company-wide strategy ● Cultivate, recruit, utilize and retain human resources to realize maximization & optimization of achievement of respective employees ● Conduct strategic & continuous cost management to transform the cost structure into one that can respond to change of the market environment ● Maximize the corporate-wide achievement by optimizing the organization as well as the corporate system Based on the above medium-term goal & company-wide strategy, develop the business strategy for each business line and make every effort to realize them through the concrete action plan in each business dept.
Lead the Way toward the Future & & Take a Leap for Tomorrow

30
National Association of Mobile-phone Distributors
Name : National Association of Mobile-phone Distributors Date of Establishment : December 15, 2014 Location : 4-4-7, Ebisu, Shibuya-ku, Tokyo
(Logo Mark)
National Association of Mobile-phone Distributors (NAMD)
Contribute to Sound Development of Telecom Industry
T-Gaia’s current chairman Mr. Takeoka made a speech as the chairman of NAMD at the first Annual meeting
(As of Sep. 30, 2015)
No. of Full Member :
69 companies
Participating Member : One