consolidated results (u.s. gaap) for fy march 2020 ......consolidated results for fiscal 2020, the...
TRANSCRIPT

TDK Corporation
Contact;TDK Corporation (Tokyo)
Kazushige Atsumi +81(3)6778-1055
Consolidated results (U.S. GAAP) for FY March 2020
Summary (April 1, 2019 - March 31, 2020)Term
Item % %
Net sales
Operating income
Net income attributable to TDK
Per common share :
Net incomeattributable to TDK / Basic
Net incomeattributable to TDK / Diluted
Capital expendituresDepreciation and amortizationResearch and developmentResult of financial income (loss)Ratio of overseas productionNumber of employees
Note:U.S.$1=Yen 109, for convenience only.
85.4% -104,781 - 107,138 - -
84.4% - -- 3,591 - 6,495 - 59,587 2,904
17.2
115,155 8.3 117,489 8.6 1,077,881 2,334 2.0
-0.1
106,631 7.7 124,984 9.2 1,146,642 18,353173,592 - 173,429 - 1,591,092 (163)
82,205 5.9
Yen 649.45 Yen 456.44 U.S.$ 4.19
Yen 651.02 Yen 457.47 U.S.$ 4.20
57,780 4.2 530,092 (24,425)
(19,678) -17.0
-29.7
Income before income taxes 115,554 8.4 95,876 7.0 879,596
(18,769) -1.4
107,823 7.8 97,870 7.2 897,890 (9,953) -9.2
(Yen millions) (Yen millions) (U.S.$ thousands) (Yen millions) Change(%)
1,381,806 100.0 1,363,037 100.0 12,504,927
May 15, 2020
FY2019 FY2020Change
(Apr. 1, 2018 - Mar. 31, 2019) (April 1, 2019 - March 31, 2020)
Corporate Communications Group

TDK Corporation (6762) Consolidated FY March 2020 (U.S. GAAP)
1
[Contents]
1. Business Results (1) Summary Information Regarding Consolidated Business Results ・・・・ P.2
(2) Summary Information Regarding Consolidated Financial Position ・・・・ P.9
(3) Fundamental Policy for Distribution of Earnings, and Fiscal 2020 and
Fiscal 2021 Dividends
・・・・ P.12
2. Management Policies
(1) Fundamental Management Policy ・・・・ P.13
(2) Targeted Management Indicators ・・・・ P.13
(3) Medium- and Long-Term Management Strategy ・・・・ P.13
(4) Pressing Issues ・・・・ P.14
3. Basic Rationale for Selection of Accounting Standards ・・・・ P.15
4. Consolidated Financial Statements
(1) Balance Sheets ・・・・ P.16
(2) Statements of Income and
Statements of Comprehensive Income (Loss)
・・・・ P.17
(3) Statements of Stockholders’ Equity ・・・・ P.18
(4) Statements of Cash Flows ・・・・ P.20
(5) Note Relating to the Going Concern Assumption ・・・・ P.21
(6) Summary of Significant Accounting Policies ・・・・ P.21
(7) Segment Information ・・・・ P.23
(8) Fair Value of Derivatives ・・・・ P.24
(9) Net Income per Share ・・・・ P.25
(10) Significant Subsequent Events ・・・・ P.25
(11) Consolidated Supplementary Information ・・・・ P.26

TDK Corporation (6762) Consolidated FY March 2020 (U.S. GAAP)
2
[Summary Information and Financial Statements] 1. Business Results (1) Summary Information Regarding Consolidated Business Results
Consolidated results for fiscal 2020, the year ended March 31, 2020, were as follows.
In fiscal 2020, the global economy saw clear signs of deceleration in the Chinese economy due to
factors such as the materialization of trade friction between the U.S. and China. The impacts of this
economic downturn also rippled out to the European, U.S. and Japanese economies, which had been
relatively firm. Moreover, in the fourth quarter, the global spread of coronavirus disease 2019
(COVID-19) caused governments to implement massive policy measures to prevent the spread of
outbreaks. Notably, governments imposed lockdowns on cities in a variety of countries, such as
China. These policy measures had a substantial impact on the real economy.
Looking at the electronics market, which has a large bearing on the consolidated performance of
TDK, trade friction between the U.S. and China and the spread of COVID-19 led to conditions such
as a downturn in demand and restrictions on production activities. In the automotive market, global
automobile sales volume decreased year on year, including in China, the world’s largest market,
although the number of components installed per vehicle increased in step with advances in the
electrification of automobiles. The Information and Communications Technology (ICT) market saw
a rise in demand for products related to the fifth-generation mobile communication system (5G), but
smartphone production volume decreased year on year. In addition, production of Hard Disk Drives
(HDDs) for data center applications increased, while production of HDDs as a whole decreased
year on year.
In this business environment, the TDK’s consolidated operating results for fiscal 2020 were as
follows.
Summary (April 1, 2019 - March 31, 2020)Term
Item % %
Net sales
Operating income
Net income attributable to TDK
Per common share : Net income
attributable to TDK / Basic Net income
attributable to TDK / DilutedNote:
U.S.$1=Yen 109, for convenience only.
FY2019 FY2020Change
(Apr. 1, 2018 - Mar. 31, 2019) (April 1, 2019 - March 31, 2020)(Yen millions) (Yen millions) (U.S.$ thousands) (Yen millions) Change(%)
1,381,806 100.0 1,363,037 100.0 12,504,927 (18,769) -1.4
107,823 7.8 97,870 7.2 897,890 (9,953) -9.2
Income before income taxes 115,554 8.4 95,876 7.0 879,596
57,780 4.2 530,092 (24,425)
(19,678) -17.0
-29.7
Yen 651.02 Yen 457.47 U.S.$ 4.20
82,205 5.9
Yen 649.45 Yen 456.44 U.S.$ 4.19

TDK Corporation (6762) Consolidated FY March 2020 (U.S. GAAP)
3
Average yen exchange rates for the U.S. dollar and the euro during fiscal 2020 were ¥108.82 and
¥120.92, respectively, as the yen appreciated 1.9% against the U.S. dollar and 5.9% against the euro.
This decreased net sales by approximately ¥40.7 billion and decreased operating income by
approximately ¥3.1 billion.
TDK Corporation (6762) Consolidated FY March 2020 (U.S. GAAP)
4
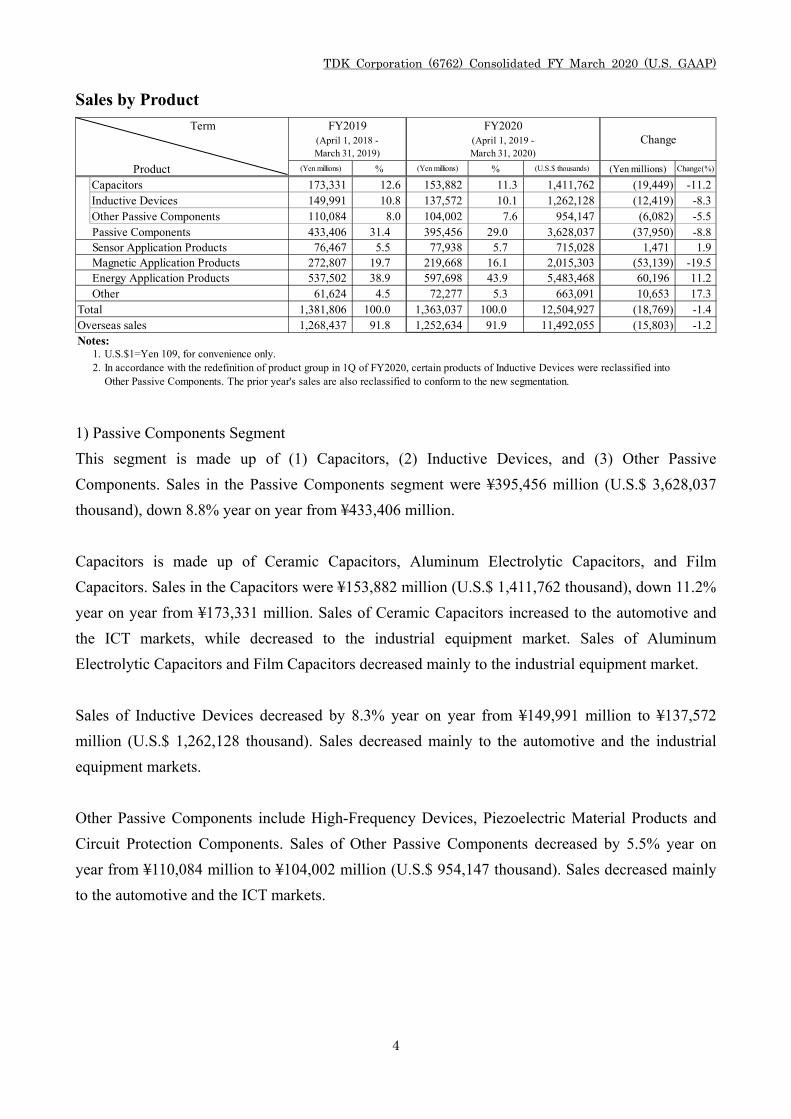
Sales by Product
1) Passive Components Segment
This segment is made up of (1) Capacitors, (2) Inductive Devices, and (3) Other Passive
Components. Sales in the Passive Components segment were ¥395,456 million (U.S.$ 3,628,037
thousand), down 8.8% year on year from ¥433,406 million.
Capacitors is made up of Ceramic Capacitors, Aluminum Electrolytic Capacitors, and Film
Capacitors. Sales in the Capacitors were ¥153,882 million (U.S.$ 1,411,762 thousand), down 11.2%
year on year from ¥173,331 million. Sales of Ceramic Capacitors increased to the automotive and
the ICT markets, while decreased to the industrial equipment market. Sales of Aluminum
Electrolytic Capacitors and Film Capacitors decreased mainly to the industrial equipment market.
Sales of Inductive Devices decreased by 8.3% year on year from ¥149,991 million to ¥137,572
million (U.S.$ 1,262,128 thousand). Sales decreased mainly to the automotive and the industrial
equipment markets.
Other Passive Components include High-Frequency Devices, Piezoelectric Material Products and
Circuit Protection Components. Sales of Other Passive Components decreased by 5.5% year on
year from ¥110,084 million to ¥104,002 million (U.S.$ 954,147 thousand). Sales decreased mainly
to the automotive and the ICT markets.
Term
Notes:1. U.S.$1=Yen 109, for convenience only.2. In accordance with the redefinition of product group in 1Q of FY2020, certain products of Inductive Devices were reclassified into
Other Passive Components. The prior year's sales are also reclassified to conform to the new segmentation.
77,938 5.7 715,028 1,471 1.9
%
-8.8
137,572 10.1 1,262,128Capacitors 173,331
Product (Yen millions)
Other Passive Components 110,084433,406
Sensor Application Products31.4
Inductive Devices 149,991
Passive Components76,467 5.5
Other 61,624
Magnetic Application Products
4.5
272,807 Energy Application Products 537,502
19.7
-11.2 -8.3 -5.5
(U.S.$ thousands)
12.610.88.0
(37,950)
153,882 11.3 1,411,762 (19,449)(12,419)(6,082)104,002 7.6 954,147
(April 1, 2018 -March 31, 2019)
(April 1, 2019 -March 31, 2020)
(Yen millions) %
FY2019 FY2020
663,091
-19.5
17.3 -1.4
(53,139)
10,653(18,769)
395,456 3,628,037
(Yen millions) Change(%)
Change
29.0
219,668 2,015,303
72,277
(15,803)1,363,037 12,504,927
11,492,055
16.1
100.0100.0Total 1,381,8061,268,437 1,252,634Overseas sales 91.8 -1.2 91.9
5,483,468 11.2 60,19638.9 597,698 43.95.3

TDK Corporation (6762) Consolidated FY March 2020 (U.S. GAAP)
5
2) Sensor Application Products Segment
This segment is made up of Temperature and Pressure Sensors, Magnetic Sensors and MEMS
Sensors. Segment sales increased by 1.9% year on year from ¥76,467 million to ¥77,938 million
(U.S.$ 715,028 thousand). Sales increased to the ICT and the industrial equipment markets, while
decreased to the automotive market.
3) Magnetic Application Products Segment
This segment is made up of HDD Heads, HDD Suspension Assemblies, and Magnets. Segment
sales decreased by 19.5% year on year from ¥272,807 million to ¥219,668 million (U.S.$ 2,015,303
thousand). Sales of HDD Heads and HDD Suspension Assemblies decreased to the ICT market.
Sales of Magnets decreased mainly to the industrial equipment market.
4) Energy Application Products Segment
This segment is made up of Energy Devices (Rechargeable Batteries) and Power Supplies. Segment
sales increased by 11.2% from ¥537,502 million to ¥597,698 million (U.S.$ 5,483,468 thousand).
Sales of Energy Devices increased significantly mainly to the ICT market.
5) Other
Other includes Mechatronics (Production Equipment) and Others. Segment sales increased by
17.3% year on year from ¥61,624 million to ¥72,277 million (U.S.$ 663,091 thousand).

TDK Corporation (6762) Consolidated FY March 2020 (U.S. GAAP)
6
The main businesses making up the four reporting segments and Other, which includes products not
included in these reporting segments, are as follows:
Classification Constituent Main Business
Passive Components
Ceramic Capacitors, Aluminum Electrolytic Capacitors, Film Capacitors,
Inductive Devices (Coils/Ferrite Cores/Transformers),
High-Frequency Devices, Piezoelectric Material Products,
Circuit Protection Components
Sensor Application Products Temperature and Pressure Sensors, Magnetic Sensors, MEMS Sensors
Magnetic Application Products HDD Heads, HDD Suspension Assemblies, Magnets
Energy Application Products Energy Devices (Rechargeable Batteries), Power Supplies
Other Mechatronics (Production Equipment), Others
[Sales by Region]
Overseas sales decreased by 1.2% year on year from ¥1,268,437 million to ¥1,252,634 million
(U.S.$ 11,492,055 thousand). Overseas sales accounted for 91.9% of consolidated net sales, a 0.1
percentage point increase from 91.8% one year earlier. Detailed information on sales by region can
be found in the consolidated supplementary information on page 26.

TDK Corporation (6762) Consolidated FY March 2020 (U.S. GAAP)
7
[Fiscal 2021 Consolidated Projections]
In fiscal 2021, the year ending March 31, 2021, TDK foresees that the stagnation in global
economic activity caused by the spread of COVID-19 will have a large impact on the electronics
market. With production volume of automobiles and smartphones projected to decrease year on year,
TDK predicts that a downturn in demand for electronic components cannot be avoided. However,
from the second half of fiscal 2021, TDK expects demand to recover to a certain extent. In addition,
TDK assumes that there will be no further disruptions to its future production activities and supply
chains, including the procurement of raw materials, due to factors such as the impact of a second
wave of the spread of COVID-19. Based on these assumptions, TDK has set the following
projections for consolidated operating results, capital expenditures, depreciation and amortization,
and research and development expenses for fiscal 2021.
(Exchange Rate Forecast)
Average yen exchange rates against the U.S. dollar and the euro of ¥105 and ¥117 respectively will
be assumed for fiscal 2021.
Term
Item
Research and development 120,000 117,489 2,511 2.1
Depreciation and amortization 140,000 124,984 15,016 12.0
Capital expenditures 180,000 173,429 6,571 3.8
Net income attributable to TDK 48,000 57,780 (9,780) -16.9
Income before income taxes 70,000 95,876 (25,876) -27.0
-5.4
Operating income 70,000 97,870 (27,870) -28.5
(Yen millions) (Yen millions) (Yen millions) %
Net sales 1,290,000 1,363,037 (73,037)
FY2021 FY2020
vs FY2020Changes
(April 1, 2020 -March 31, 2021)
(April 1, 2019 -March 31, 2020)
Projection inMay '20
Actual

TDK Corporation (6762) Consolidated FY March 2020 (U.S. GAAP)
8
Cautionary Statements with Respect to Forward-Looking Statements
This material contains forward-looking statements, including projections, plans, policies,
management strategies, targets, schedules, understandings, and evaluations about TDK Corporation
and/or its group companies (“TDK”). These forward-looking statements are based on the current
forecasts, estimates, assumptions, plans, beliefs, and evaluations of TDK in light of information
currently available to it, and contain known and unknown risks, uncertainties and other factors.
TDK therefore wishes to caution readers that, being subject to risks, uncertainties and other factors,
TDK’s actual results, performance, achievements or financial positions could be materially different
from any future results, performance, achievements or financial positions expressed or implied by
these forward-looking statements, and TDK undertakes no obligation to publicly update or revise
any forward-looking statements after the issue of this material except as provided for in applicable
laws and ordinances.
The electronics markets in which TDK operates are highly susceptible to rapid changes. Risks,
uncertainties and other factors that can have significant effects on TDK include, but are not limited
to, shifts in technology, fluctuations in demand, prices, interest and foreign exchange rates, and
changes in economic environments, conditions of competition, laws, and regulations.

TDK Corporation (6762) Consolidated FY March 2020 (U.S. GAAP)
9
(2) Summary Information Regarding Consolidated Financial Position
1) The following table summarizes TDK’s consolidated balance sheet as of March 31, 2020.
Total assets ¥1,943,379 million ( 2.5% decrease)
Total TDK stockholders’ equity ¥843,957 million ( 3.8% decrease)
Stockholders’ equity ratio 43.4% ( 0.6 point decrease)
As of March 31, 2020 total assets decreased by ¥49,101 million compared with March 31, 2019.
Net liquidity (cash and cash equivalent, short-term investments, marketable securities) increased by
¥35,530 million. While right-of-use assets of operating leases (adopted new accounting principle)
and net property, plant and equipment increased by ¥39,215 million and ¥8,040 million respectively,
investments in securities decreased by ¥122,077 million.
Total liabilities decreased by ¥13,909 million from March 31, 2019. While long-term debt
(including current installments of long-term debt) decreased by ¥90,869 million, long-term
operating lease obligations (including current portion of operating lease obligations), retirement and
severance benefits, and trade payable increased by ¥36,076 million, ¥13,908 million, and ¥11,933
million respectively.
Total TDK stockholders’ equity, which is included in total equity, decreased by ¥33,333 million
from March 31, 2019. While accumulated other comprehensive income (loss) decreased by ¥65,620
million, retained earnings increased by ¥35,491 million.
TDK Corporation (6762) Consolidated FY March 2020 (U.S. GAAP)
10
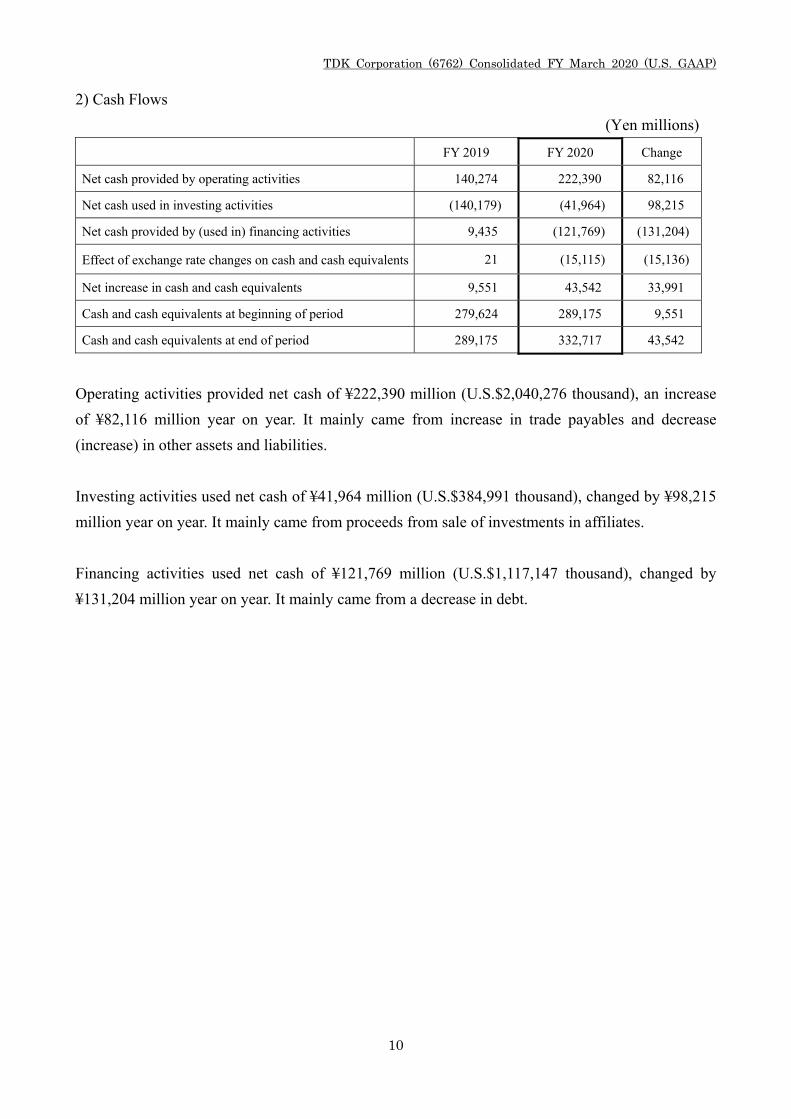
2) Cash Flows
(Yen millions)
FY 2019 FY 2020 Change
Net cash provided by operating activities 140,274 222,390 82,116
Net cash used in investing activities (140,179) (41,964) 98,215
Net cash provided by (used in) financing activities 9,435 (121,769) (131,204)
Effect of exchange rate changes on cash and cash equivalents 21 (15,115) (15,136)
Net increase in cash and cash equivalents 9,551 43,542 33,991
Cash and cash equivalents at beginning of period 279,624 289,175 9,551
Cash and cash equivalents at end of period 289,175 332,717 43,542
Operating activities provided net cash of ¥222,390 million (U.S.$2,040,276 thousand), an increase
of ¥82,116 million year on year. It mainly came from increase in trade payables and decrease
(increase) in other assets and liabilities.
Investing activities used net cash of ¥41,964 million (U.S.$384,991 thousand), changed by ¥98,215
million year on year. It mainly came from proceeds from sale of investments in affiliates.
Financing activities used net cash of ¥121,769 million (U.S.$1,117,147 thousand), changed by
¥131,204 million year on year. It mainly came from a decrease in debt.

TDK Corporation (6762) Consolidated FY March 2020 (U.S. GAAP)
11
3) Trends in Cash Flow Indicators
FY2017 FY2018 FY2019 FY2020
1) Stockholders’ equity ratio (%) 47.7 43.3 44.0 43.4
2) Stockholders’ equity ratio on a market value basis (%)
53.5 63.5 55.0 54.5
3) No. of years to redeem debt 2.09 5.29 3.71 1.91
4) Interest coverage ratio (times) 46.7 20.5 33.8 60.6
[Notes]
1) Stockholders’ equity ratio = Total stockholders’ equity/Total assets
2) Stockholders’ equity ratio on a market value basis = Market capitalization (*1)/Total assets
(*1) Market capitalization = Closing price of TDK’s common shares on the Tokyo Stock Exchange at fiscal year-end x
Shares issued and outstanding at fiscal year-end after deducting treasury shares
3) No. of years to redeem debt = Interest-bearing liabilities (*2)/Cash flows from operating activities
(*3)
(*2) Interest-bearing liabilities: “Short-term debt,” “current installments of long-term debt,” and “long-term debt,
excluding current installments” on the consolidated balance sheets.
(*3) Cash flows from operating activities: “Net cash provided by operating activities” on the consolidated statements of
cash flows.
4) Interest coverage ratio = Cash flows from operating activities/Interest payments (*4)
(*4) Interest payments: “Interest expense” on the consolidated statements of income

TDK Corporation (6762) Consolidated FY March 2020 (U.S. GAAP)
12
(3) Fundamental Policy for Distribution of Earnings, and Fiscal 2020 and Fiscal 2021
Dividends
TDK recognizes that achieving increase in corporate value over the medium- and long-term
ultimately translates into higher shareholder value. In line with this understanding, TDK’s
fundamental policy is to work to consistently increase dividends through growth in earnings per
share. By actively investing for growth, mainly in the development of new products and
technologies in key fields so as to respond precisely to rapid technological innovation in the
electronics industry, TDK is aiming to increase a medium- and long-term corporate value.
Accordingly, TDK actively reinvests its earning in business activities and determines its dividends
taking into consideration comprehensive factors, including return on equity (ROE) and dividends on
equity (DOE) on a consolidated basis, as well as changes in the business environment, among other
factors.
TDK plans to pay a year-end dividend of ¥90 per common share, subject to approval at the ordinary
general meeting of shareholders scheduled for June 23, 2020. Combined with the interim dividend
of ¥90 per common share paid in December 2019, the planned dividend per common share
applicable to the year will be ¥180.
TDK plans to pay an interim dividend of ¥80 per common share and a year-end dividend of ¥80 per
common share respectively in Fiscal 2021.
(Yen)
FY 2021
Forecast
FY 2020
Interim dividend 80.00 (Actual) 90.00
Year-end dividend 80.00 (Forecast) 90.00
Annual dividend 160.00 (Forecast) 180.00

TDK Corporation (6762) Consolidated FY March 2020 (U.S. GAAP)
13
2.Management Policies (1) Fundamental Management Policy
TDK was founded as a venture enterprise in 1935 for the purpose of industrializing a magnetic
material called ferrite, which was invented at the Tokyo Institute of Technology. TDK’s corporate
motto is “Contribute to culture and industry through creativity,” a message that embodies the
company’s founding spirit. Guided by this spirit, in the ensuing years TDK has sought to refine its
materials and process technologies, as it develops new products that satisfy market needs.
Concurrently, TDK has advanced globalization and diversification of its business operations while
actively pursuing M&As, collaboration with external partners and other initiatives. As a result, TDK
today is engaged in four main businesses: Passive Components, Sensor Application Products,
Magnetic Application Products, and Energy Application Products.
Looking ahead, TDK would like to remain a dynamic company that continues to deliver even
higher value to all stakeholders, including shareholders, customers, suppliers, employees and local
communities, by bringing together the entire Group’s strengths while taking full advantage of the
strengths of each Group company, and constantly drawing on innovative thinking and a willingness
to tackle new challenges.
(2) Targeted Management Indicators
To realize this fundamental management policy, TDK conducts its business activities with reference
to the following indicators.
(Important Fundamental Management Indicator)
* TVA (TDK Value Added)
TVA measures the added value newly created by the company’s business activities and is an
important decision-making tool for management.
TVA is a TDK proprietary value-added yardstick that measures the extent of earnings commensurate with invested
capital. This indicator compares earnings after taxes but without deducting interest expenses with the cost of capital
(stockholders’ equity + interest-bearing liabilities).
(Indicator for Managing Environmental Performance)
* CO2 Emissions Reductions
As part of its environmental action plan to promote business activities in harmony with the natural
environment, TDK has set a target for CO2 emissions reductions.
(3) Medium- and Long-Term Management Strategy
The business environment revolving around electronics is now standing on the threshold of a period
of major upheaval. Transformation has begun in earnest, with an energy transformation (EX) driven
by the shift from fossil fuels to renewable energy and a digital transformation (DX) driven by the

TDK Corporation (6762) Consolidated FY March 2020 (U.S. GAAP)
14
permeation of digital technologies, such as the Internet of Things (IoT; technology for connecting a
variety of things to the Internet) and Artificial Intelligence (AI), to every aspect of society.
Under its medium- and long-term management strategy, the TDK Group is pursuing two core
priorities: (1) “contribute to the solution of energy and environmental issues” and (2) “contribute to
making society more efficient through the use of data.”
The aforementioned trends of EX and DX will dramatically increase the demand for electronic
components. With this in mind, TDK will strive to expand its four main businesses: Passive
Components, Sensor Application Products, Magnetic Application Products, and Energy Application
Products. TDK aims to achieve sustainable growth and increase corporate value by refining the
materials and process technologies it has cultivated, and strengthening provision of solutions that
respond to market needs. In addition, TDK will pursue a zero-defect quality strategy based on
advanced technological capabilities, along with working to further globalize its business operations
through speed-focused management.
In the three-year medium-term plan running through fiscal 2021, the TDK Group is targeting a
return on equity (ROE) of over 14%. The Group will work to enhance its overall profitability and
capital efficiency, while effectively investing in new product development and new businesses, in
addition to investing in its main businesses.
The TDK Group will continuously strive to contribute to the solution of various social issues on a
global scale by implementing its corporate motto, “Contribute to culture and industry through
creativity.”
(4) Pressing Issues
The global economy is expected to suffer a substantial downturn that will likely persist over an
extended period of time due to the global spread of coronavirus disease 2019 (COVID-19). As a
result, the COVID-19 pandemic could have a lasting negative impact on the international
community after it has ended, drastically reshaping the social and industrial landscape. The business
environment surrounding the TDK Group could also be altered tremendously.
However, even amid these changes in the social and industrial landscape, the trends of EX and DX
should continue to grow in the electronics market. These trends are expected to bring about the
creation of new markets in the TDK Group’s business fields. Significant growth opportunities will
be presented to the TDK Group by trends that include the widespread adoption of renewable energy
and electric vehicles in EX, the growing use of the fifth-generation mobile communications system
(5G) and the practical use of Advanced Driving Assistance Systems (ADAS) in automobiles in DX.
There will also be growing adoption of IoT, wearable products, and cloud services. It is imperative
for TDK to steadily capture these growth opportunities without falling behind these major changes.
To this end, TDK will actively conduct research and technological development, with a view to
launching competitive new products in a timely fashion and expanding production capacity in line

TDK Corporation (6762) Consolidated FY March 2020 (U.S. GAAP)
15
with demand.
TDK also recognizes that acquiring and appropriately allocating management resources is a
pressing issue for realizing growth. Accordingly, TDK will revise the Group’s entire business
portfolio as necessary. Human resources are one of TDK’s most important management resources.
With non-Japanese employees accounting for more than 90% of the TDK Group’s workforce, TDK
believes that diverse and abundant human resources are a key source of its competitiveness. To
enhance its human resources further, TDK identify talented human resources from across the entire
TDK Group, and work to train and make the most of these individuals.
The current medium-term plan positions improving the value the TDK Group imparts to society as
one of its high-priority issues. The Sustainability Promotion HQ established in April 2019 is taking
the lead in bolstering initiatives toward this goal. TDK aims to drive further growth by bolstering its
business initiatives using the SDGs—the international development goals listed in “The 2030
Agenda for Sustainable Development” adopted at a UN Summit in September 2015—as a
framework, and contributes to society through sustainable business activities.
In line with the Group’s globalization, TDK is working to strengthen Group governance by
redeveloping rules that clearly delineate the responsibilities and authorities of each Group company
and by continuously striving to make its corporate philosophy more widely and better known
throughout the Group.
3.Basic Rationale for Selection of Accounting Standards
TDK started to prepare its consolidated financial statements using U.S. GAAP when it issued an
American Depositary Receipt (“ADR”) in July 1974. In April 2009, TDK delisted its shares on the
New York Stock Exchange but maintained its ADR program in the U.S., and continues to use U.S.
GAAP when it prepares consolidated financial statements. This was done from the viewpoint of
protecting shareholders or investors and enabling them to make comparisons with past disclosures
of information.
As for the application of International Financial Reporting Standards (“IFRS”), TDK’s policy is to
respond appropriately after taking into consideration the circumstances unfolding both in Japan and
overseas.

TDK Corporation (6762) Consolidated FY March 2020 (U.S. GAAP)
16
4. Consolidated Financial Statements (1) Balance Sheets
Term
Item
Current assets
Cash and cash equivalents
Short-term investments
Marketable securities
Net trade receivables
Inventories
Other current assets
Noncurrent assets
Investments in securities
Net property, plant and equipment
Right-of-use assets of operating leases
Goodwill
Other assets
Term
Item
Current liabilities
Short-term debt
Current installments of long-term debt
Current portion of operating lease obligations
Trade payables
Accrued expenses
Other current liabilities
Noncurrent liabilities
Long-term debt,excluding current installments
Long-term operating lease obligations
Retirement and severance benefits
Other noncurrent liabilities
Common stock
Additional paid-in capital
Legal reserve
Retained earnings
Accumulatedother comprehensive income (loss)
Treasury stock
Noncontrolling interests
Note:
U.S.$1=Yen 109, for convenience only.
236,453 2,169,293 9,561
17,829,165
6,466 0.4 4,607
LIABILITIES AND EQUITY
TOTAL
7,784,991 (35,192)
(49,101)
7,742,725
1,992,480 100.0 1,943,379 100.0
Total equity 883,756 44.4 848,564 43.7
35,491
0.3 42,266 (1,859)
Total TDK stockholders' equity 877,290 44.0 843,957 43.4
818
(33,333)
935,649
(16,959) (16,806) (154,183) 153
971,140 8,909,541
5,958 1,783 16,358 (4,175)
44,436 45,254 415,174
10,044,174 (13,909)
32,641 32,641 299,459 -
57,672 64,067 587,771 6,395
129,050 142,958 1,311,541 13,908
Total liabilities 1,108,724 55.6 1,094,815 56.3
1,284,963 (67,621)
394,404 19.8 375,910 19.3 3,448,715 (18,494)
19,042 23,608 216,587 4,566
189,892 201,825 1,851,606 11,933
91,276 68,028 624,110 (23,248)
221,310 216,601 1,987,165 (4,709)
714,320 35.8 718,905 37.0 6,595,459 4,585
As of March 31, 2019 As of March 31, 2020 Change
(Yenmillions)
%(Yen
millions)%
(U.S.$thousands)
17,829,165
(Yenmillions)
(49,101)
(3,849)
TOTAL 1,992,480 100.0 1,943,379 100.0
146,785 132,358 1,214,294 (14,427)
603,110 611,150
164,794 160,945 1,476,559
155,306 33,229 304,853 (122,077)
5,606,881 8,040
1,069,995 53.7 976,897 50.3 8,962,358 (93,098)
57,702 54,620 501,101 (3,082)
308,154 310,142
226,892
40,505 32,494 298,110 (8,011)
2,845,339 1,988
57 56
(U.S.$thousands)
289,175 332,717 3,052,450 43,542
922,485 46.3 966,482
(1)
As of March 31, 2019 As of March 31, 2020 Change
(Yenmillions)
%(Yen
millions)%
ASSETS
(Yenmillions)
- 7,252 66,532 7,252
49.7 8,866,807 43,997
514
(124,435) (190,055) (1,743,624) (65,620)
192,800 201,591 1,849,459 8,791
207,682 140,061
- 39,215 359,771 39,215
- 28,824 264,440 28,824

TDK Corporation (6762) Consolidated FY March 2020 (U.S. GAAP)
17
(2) Statements of Income and Statements of Comprehensive Income (Loss)
Statements of Income
Statements of Comprehensive Income (Loss)
Term
Item
Net salesCost of sales
Gross profitSelling, general and administrative expensesOther operating expense (income)
Operating income
Other income (deductions):Interest and dividend incomeInterest expenseForeign exchange gain (loss)Other-net
Total other income (deductions)
Income taxes
Net income
Net income attributable to TDKNote:
U.S.$1=Yen 109, for convenience only.
-30.857,157 4.2
4.2 530,092 (24,425) -29.7 82,205 5.9 57,780
524,376 (25,393)
5,715 17.3
(19,678) -17.0
33,004
115,554 8.4 95,876 7.0
38,719 2.8 355,220
- -0.2 (18,294) (9,725)
70.4
7,731 0.6 (1,994)8,552 (4,469)
(4,412) (4,020)(3,671)
287,561
-2.68,804,716 (25,607)1,381,806 100.0 12,504,927 (18,769)
985,321 71.3 959,714
(April 1, 2019 -March 31, 2020)
-1.41,363,037 100.0
FY2019 FY2020
(Yenmillions)
%(Yen
millions)% (U.S.$ thousands)
(Yenmillions)
Change(%)
Change(April 1, 2018 -March 31, 2019)
20.8 289,771 21.3 0.8396,485 28.7 403,323 29.6 3,700,211
2,658,449 2,210
-9.27.8143,872
1.76,838
0.1 15,682 1.1 - 14,58197,870 7.2 897,890
1,101
(33,679) 4847,746 10,166
(9,953)107,823
(41,000) (13,021)(36,881) 392
93,266 2,420(4,155)
879,596Income before income taxes
2.5
Less: Net income (loss) attributable to noncontrolling interests 345 (623)0.0
82,550 5.9
-0.0 (5,716) (968) -
Term
Item
Net income
Foreign currencies translation adjustments
Pension liability adjustments
Net unrealized gains (losses) on securities
Total other comprehensive income (loss)Comprehensive income (loss)
Comprehensive income (loss) attributable to TDKNote:
U.S.$1=Yen 109, for convenience only.
FY2019 FY2020Change(April 1, 2018 -
March 31, 2019)(April 1, 2019 -March 31, 2020)
Other comprehensive income (loss), net of taxes:
Comprehensive income (loss) attributable to noncontrolling interests
(Yen millions)
82,550
4,457
(55)
80,595
57,157
(Yen millions)(Yen millions) (U.S.$ thousands)
(25,393)524,376
(50,141)(45,684)
(6,357) (184,083) (13,708)(20,065)
(419,119)
(858)
(32)(87)
(1,955) (604,000) (63,881)(65,836)
(798)
80,335 (71,752) (88,156)(7,821)
(79,624) (89,274)(8,679)
260 (7,872) (1,118)

TDK Corporation (6762) Consolidated FY March 2020 (U.S. GAAP)
18
(3) Statements of Stockholders’ Equity
(Yen millions)
Balance as of March 31, 2018
Cumulative effect of adoption of ASU2014-09
Cumulative effect of adoption of ASU2016-01
Cumulative effect of adoption of ASU2016-16
Equity transaction of consolidated subsidiaries and other
Cash dividends
Transferred to legal reserve
Transferred to retained earnings
Comprehensive income
Net income
Other comprehensive income (loss)
Total comprehensive income (loss)
Acquisition of treasury stock
Sale of treasury stock
Balance as of March 31, 2019
(Yen millions)
Balance as of March 31, 2019
Equity transaction of consolidated subsidiaries and other
Cash dividends
Transferred to legal reserve
Transferred to retained earnings
Comprehensive income
Net income
Other comprehensive income (loss)
Total comprehensive income (loss)
Acquisition of treasury stock
Sale of treasury stock
Balance as of March 31, 2020
-
-
-
(2,297) 2,297
Treasury stockTotal TDK
stockholders'equity
32,641
FY2020(April 1, 2019 - March 31, 2020)
Common stockAdditional
paid-in capitalLegal reserve
Retainedearnings
Accumulatedother
comprehensiveincome (loss)
5,958 44,436 935,649 (124,435) (16,959) 877,290
(21,471)
(4,175) (19) 158
818 (818)
(4,036)
(21,471)
-
57,780 57,780
(65,601) (65,601)
(5) (5)
(7,821)
-
32,641 1,783 45,254 971,140 (190,055) (16,806) 843,957
FY2020(April 1, 2019 - March 31, 2020)
Noncontrollinginterests
Total equity
6,466 883,756
(896) (4,932)
(105) (21,576)
-
(623) 57,157
-
(235) (65,836)
(858) (8,679)
(5)
-
4,607 848,564
Treasury stockTotal TDK
stockholders'equity
FY2019(April 1, 2018 - March 31, 2019)
Common stockAdditional
paid-in capitalLegal reserve
Retainedearnings
Accumulatedother
comprehensiveincome (loss)
45,366 874,563 (119,492) (17,182) 824,634
(2,780) 10 225 (2,545)
32,641 8,738
-
(18,939)
82,205
(18,939)
1,367 (1,367)
82,205
(1,870) (1,870)
80,335
(2)
(124,435) (16,959)
(2)
0 0
877,290
FY2019(April 1, 2018 - March 31, 2019)
Noncontrollinginterests
Total equity
6,598 831,232
32,641 5,958 44,436 935,649
(371) (2,916)
(21) (18,960)
-
345 82,550
(85) (1,955)
260 80,595
(2)
0
6,466 883,756
-
181
(6,374)
181
3,083 (3,083)
(6,374)
181
-
(6,374)

TDK Corporation (6762) Consolidated FY March 2020 (U.S. GAAP)
19
(U.S.$ thousands)
Balance as of March 31, 2019
Equity transaction of consolidated subsidiaries and other
Cash dividends
Transferred to legal reserve
Transferred to retained earnings
Comprehensive income
Net income
Other comprehensive income (loss)
Total comprehensive income (loss)
Acquisition of treasury stock
Sale of treasury stock
Balance as of March 31, 2020
Balance as of March 31, 2019
Equity transaction of consolidated subsidiaries and other
Cash dividends
Transferred to legal reserve
Transferred to retained earnings
Comprehensive income
Net income
Other comprehensive income (loss)
Total comprehensive income (loss)
Acquisition of treasury stock
Sale of treasury stock
Balance as of March 31, 2020Note:
U.S.$1=Yen 109, for convenience only.
-
-
FY2020(April 1, 2019 - March 31, 2020)
Common stockAdditional
paid-in capitalLegal reserve
Retainedearnings
Accumulatedother
comprehensiveincome (loss)
Treasury stockTotal TDK
stockholders'equity
299,459 54,661 407,670 8,583,935 (1,141,606) (155,587) 8,048,532
(38,303) (174) 1,450 (37,027)
-
(196,982)
530,092
(196,982)
7,504 (7,504)
530,092
(601,844) (601,844)
(71,752)
(46)
(1,743,624) (154,183)
(46)
-
7,742,725
FY2020(April 1, 2019 - March 31, 2020)
Noncontrollinginterests
Total equity
59,321 8,107,853
299,459 16,358 415,174 8,909,541
(8,220) (45,247)
(963) (197,945)
-
(5,716) 524,376
(2,156) (604,000)
(7,872) (79,624)
(46)
-
42,266 7,784,991

TDK Corporation (6762) Consolidated FY March 2020 (U.S. GAAP)
20
(4) Statements of Cash Flows Term
Item
Cash flows from operating activities:
Net income
Adjustments to reconcile net income tonet cash provided by operating activities:
Depreciation and amortization
Deferred income taxes
Impairment of long-lived assets
Gain on sale of business
Equity in earnings of affiliates, net of dividends received
Changes in assets and liabilities:
Decrease (increase) in trade receivables
Decrease (increase) in inventories
Increase (decrease) in trade payables
Increase (decrease) in accrued expenses
Decrease (increase) in other assets and liabilities, net
Other-net
Net cash provided by operating activities
Cash flows from investing activities:
Capital expenditures
Proceeds from sales of tangible and intangible assets
Proceeds from sale and maturity of short-term investments
Payment for purchase of short-term investments
Proceeds from sale and maturity of securities
Payment for purchase of securities
Proceeds from sale of business, net of cash transferred
Acquisition of subsidiaries, net of cash acquired
Proceeds from sale of investments in affiliates
Acquisition of investments in affiliates
Other-net
Net cash used in investing activities
Cash flows from financing activities:
Proceeds from debt with maturities longer than three months
Repayment of debt with maturities longer than three months
Net increase (decrease) in debt with maturities of three months or less
Dividends paid
Acquisition of noncontrolling interests
Other-net
Net cash provided by (used in) financing activities
Effect of exchange rate changes on cash and cash equivalents
Net increase in cash and cash equivalents
Cash and cash equivalents at beginning of period
Cash and cash equivalents at end of period
Note:
U.S.$1=Yen 109, for convenience only.
- -
6,667
140,274 222,390
(1,591,092)
(15,404)
3,921
124,484
- 11,462 -
22,064
(4,890)
(2,548)
(140,179) (41,964) (384,991)
(844)
92,197 80,328 736,954
2,945 27,019
(173,592) (173,429)
61,165
2,040,276
1,125 13,686
(13,198)
(4,011) (2,910) (26,697)
23,090 211,835
8,541
23,422
(22,952)
(3,388)
(April 1, 2018 -March 31, 2019)
(April 1, 2019 - March 31, 2020)
5,458
106,631 124,984 1,146,642
(Yen millions) (Yen millions)
(40,706)
5,112 18,592 170,569
(U.S.$ thousands)
82,550 57,157 524,376
(4,437)
(11,147) 2,553
1,608 14,752
(803)
(121,083)
151,954
(12,241)
(2,147)
(20,357) (186,761)
16,563
(685,000)
125,560
(87,581) (74,665)
(2,380) (21,835)
435
(234)
(18,948) (21,469) (196,963)
1,142,055
(621) (5,697)
(3,590) (4,991) (45,789)
(87) (16) (147)
289,175 332,717 3,052,450
9,551 43,542 399,468
279,624 289,175 2,652,982
9,435 (121,769) (1,117,147)
21 (15,115) (138,670)
FY2019 FY2020
196,394
(872,358)
(198,284)
5,166
(68,930)
95,824
21,407
(95,087)
(21,613)

TDK Corporation (6762) Consolidated FY March 2020 (U.S. GAAP)
21
(5) Note Relating to the Going Concern Assumption Nothing to report. (6) Summary of Significant Accounting Policies
1) The consolidated financial statements are prepared in conformity with the U.S. GAAP. Inventories are valued at the lower of cost or market as in the past, with cost mainly determined by the periodic average method.
2) As of March 31, 2020, TDK Corporation had 141 subsidiaries (13 in Japan and 128 overseas).
TDK Corporation also had 5 affiliates (3 in Japan and 2 overseas) whose financial statements are accounted for by the equity method.
3) In February 2016, the Financial Accounting Standards Board (“FASB”) issued Accounting Standards
Update (“ASU”) 2016-02 “Leases (Topic 842)”. This ASU requires lessees to recognize most leases on their consolidated balance sheets but recognize expenses on their consolidated statements of income in a manner similar to the previous guidance. Additionally, this ASU expands qualitative and quantitative disclosures related to leases. TDK adopted this ASU from April 1, 2019. TDK applied the package of practical expedients that allows us not to reassess whether any existing contracts at or expired contracts prior to the adoption date are or contain leases, lease classification and whether any initial direct costs qualify for capitalization, to use hindsight in determining the lease term and in assessing impairment of the right-of-use assets, in addition to applying the short term lease exception. TDK also adopted the transition method which no restatement of comparative periods and no reassessment of land easements not previously accounted for as a lease that exist at or expired prior to the adoption date are required. The right-of-use assets of operating leases and operating lease obligations recognized at April 1, 2019 was ¥38,016 million and ¥35,690 million, respectively and are included in Noncurrent assets and liabilities in the accompanying consolidated balance sheets. The adoption of this ASU did not have a material impact on TDK’s results of operations.
4) In August 2017, FASB issued ASU 2017-12 “Derivatives and Hedging (Topic 815): Targeted
Improvements to Accounting for Hedging Activities”. This ASU amends existing guidance to simplify the application of hedge accounting in certain situations and enables an entity to better portray the economic results of an entity’s risk management activities in its financial statements. This ASU eliminates the requirement to separately measure and report hedge ineffectiveness, and requires an entity to present the earnings effect of the hedging instrument in the same line item of the consolidated statements of income in which the earnings effect of the hedged item is reported. TDK adopted this ASU from April 1, 2019. The adoption of this ASU did not have a material impact on TDK’s results of operations and financial position.

TDK Corporation (6762) Consolidated FY March 2020 (U.S. GAAP)
22
5) The following items have been omitted from this earnings release because they are not deemed to be that necessary for disclosure.
Notes Concerning Consolidated Financial Statements ・Lease transactions ・Related-party transactions ・Tax-effect accounting ・Financial instruments ・Retirement benefits ・Stock options, etc. ・Business combinations, etc. ・Real estate for leasing ・Asset retirement obligations ・Hedge accounting ・Fair value of securities

TDK Corporation (6762) Consolidated FY March 2020 (U.S. GAAP)
23
(7) Segment Information
TDK has four reporting segments: Passive Components, Sensor Application Products, Magnetic
Application Products and Energy Application Products, as well as Other, which includes products
not included in these four reporting segments.
Sales by industry segment
% %
Note:U.S.$1=Yen 109, for convenience only.
Segment profit (loss) by industry segment
% %
Note:U.S.$1=Yen 109, for convenience only.
FY2019 FY2020
FY2019 FY2020
2.0
1.989
Sensor Application Products (22,125) -28.9 (25,024) -32.1 (229,578)
Total 76,593 78,153
(2,899) -
70.61,972717,000 1,560
715,028 1,471Sensor Application Products
External customers 76,467 5.5 77,938 5.7Intersegment 126 215
240,092903,183
43.9 5,483,468
1,381,806
274,645
(34,026)
72,27726,17028,435
1,838
5.3
98,447
597,698
4.5
16.1
31.4
19.7
-17.9
17.3663,091
60,196225,398
2,015,303
-20.2
-19.5
-8.9
5,730
433,4063,617
437,023
272,807
29.0
219,668
(38,681)
395,4562,886
398,342
3,628,03726,477
3,654,514
8,388(2,265)10,653
3,892(49,247)
-8.09.3
-8.8
211.8
12,504,927 -1.4
Change
(35,004)Total (18,769)
Intersegment eliminations (978)100.0100.0 1,363,037
(321,138)
OtherExternal customers
IntersegmentTotal
61,624
90,059
Magnetic Application ProductsExternal customers (53,139)
Total
TotalIntersegment 52,569
2,067,872
(April 1, 2018 -March 31, 2019)
(Yen millions)
Passive ComponentsExternal customers (37,950)
(Yen millions)
Intersegment (731)
Change
(Yen millions) Change(%)(U.S.$ thousands)
(April 1, 2019 -March 31, 2020)
(Yen millions) Change(%)
9.9 358,459 (19,366) -33.1
(U.S.$ thousands)
(April 1, 2018 -March 31, 2019)
(April 1, 2019 -March 31, 2020)
Passive Components 58,438 13.5 39,072
(Yen millions) (Yen millions)
0.2 3,899 (16,597) -97.5 Magnetic Application Products 17,022 6.2 425
-11.9 (78,808) (1,863) - Other (6,727) -10.9 (8,590)
9.5 1,192,954 (7,612) -5.5Sub total 137,644 10.0 130,032
(295,064) (2,341)Corporate and Eliminations (29,821) (32,162)
7.8 97,870 7.2 897,890 (9,953) -9.2107,823
Energy Application Products 91,036 16.9 124,149 20.8 1,138,982 33,113 36.4
Operating income
Energy Application ProductsExternal customers 537,502 38.9
Total 537,512Intersegment 10 3 28
11.2597,701 5,483,496 60,189
11.2(7) -70.0

TDK Corporation (6762) Consolidated FY March 2020 (U.S. GAAP)
24
(8) Fair Value of Derivatives
(Yen millions)
Contract Carrying Estimated
Amount Amount Fair Value
As of March 31, 2019Forward foreign exchange contracts
Currency swap contracts
Interest rate swap contracts
Commodity forward contracts
As of March 31, 2020Forward foreign exchange contracts
Currency swap contracts
(U.S.$ thousands)
Contract Carrying Estimated
(U.S.$ thousands) Amount Amount Fair Value
As of March 31, 2020Forward foreign exchange contracts
Currency swap contractsNote:
U.S.$1=Yen 109, for convenience only.
192,902 (18) (18)
19,701 1,323 1,323
252 150 150
33,297 124 124
118,414 (1,235) (1,235)
13,051 1,102 1,102
1,086,367 (11,330) (11,330)
119,734 10,110 10,110
TDK Corporation (6762) Consolidated FY March 2020 (U.S. GAAP)
25
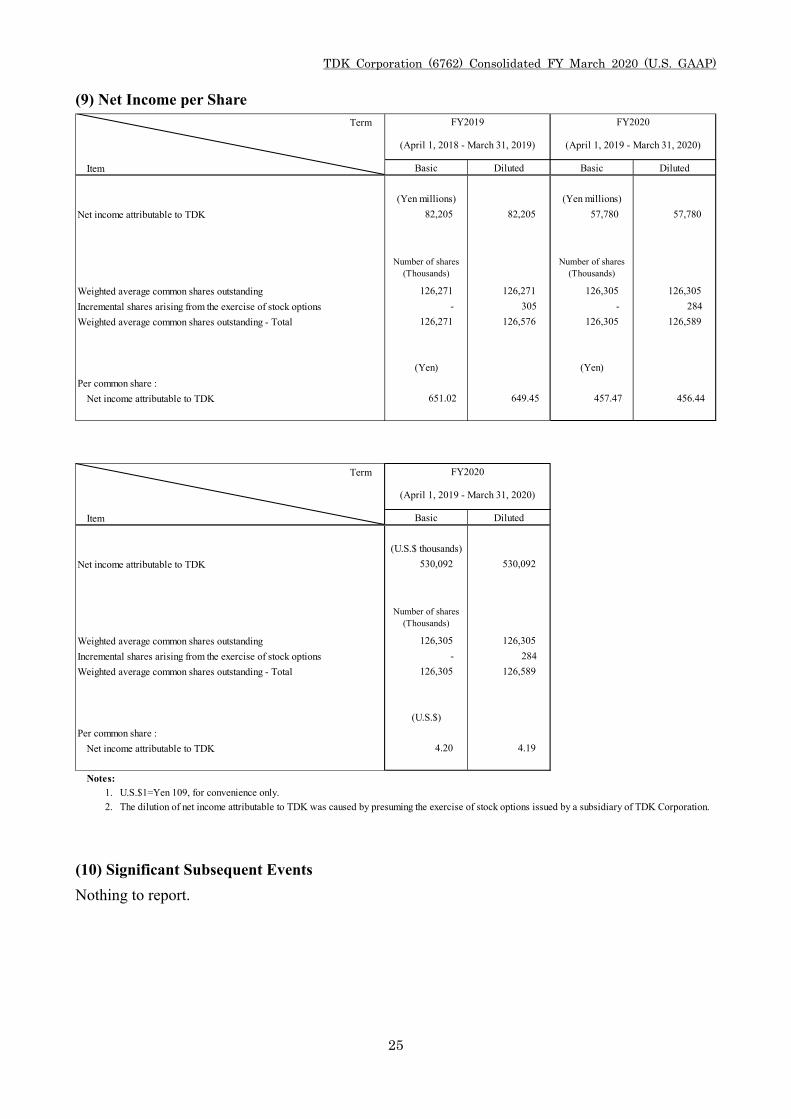
(9) Net Income per Share
(10) Significant Subsequent Events
Nothing to report.
Term
Item
Net income attributable to TDK
Weighted average common shares outstanding
Incremental shares arising from the exercise of stock options
Weighted average common shares outstanding - Total
Per common share :
Net income attributable to TDK
Term
Item
Net income attributable to TDK
Weighted average common shares outstanding
Incremental shares arising from the exercise of stock options
Weighted average common shares outstanding - Total
Per common share :
Net income attributable to TDK
Notes:1. U.S.$1=Yen 109, for convenience only.
2.
FY2019 FY2020
(April 1, 2018 - March 31, 2019) (April 1, 2019 - March 31, 2020)
Basic Diluted Basic Diluted
(Yen millions) (Yen millions)
82,205 82,205 57,780 57,780
Number of shares(Thousands)
Number of shares(Thousands)
126,271 126,271 126,305 126,305
- 305 - 284
126,271 126,576 126,305 126,589
(Yen) (Yen)
651.02 649.45 457.47 456.44
FY2020
(April 1, 2019 - March 31, 2020)
Basic Diluted
(U.S.$ thousands)
530,092 530,092
Number of shares(Thousands)
126,305 126,305
- 284
126,305 126,589
(U.S.$)
The dilution of net income attributable to TDK was caused by presuming the exercise of stock options issued by a subsidiary of TDK Corporation.
4.20 4.19

TDK Corporation (6762) Consolidated FY March 2020 (U.S. GAAP)
26
(11) Consolidated Supplementary Information
1) Exchange rates used for conversion
2) Sales by region
3) Overview of sales by product
Term As of March 31, 2019 As of March 31, 2020
Item
The end of the period 108.83 119.55
US$=Yen
110.99 124.56
Euro=Yen US$=Yen Euro=Yen
Term
Region % %
Americas
Europe
Asia and others
Overseas sales total
Japan
Net salesNotes:
1. U.S.$1=Yen 109, for convenience only.
2. Overseas sales are based on the location of the customers.
1,381,806 100.0 1,363,037 100.0 12,504,927 (18,769) -1.4
-1.2
113,369 8.2 110,403 8.1 1,012,872 (2,966) -2.6
1,268,437 91.8 1,252,634 91.9 11,492,055 (15,803)
990,983 71.7 1,008,245 74.0 9,249,954 17,262 1.7
-12.7
FY2020
167,285 12.1 148,254 10.9 1,360,128 (19,031) -11.4
110,169 8.0 96,135 7.0 881,973 (14,034)
(April 1, 2018 -March 31, 2019)
(April 1, 2019 -March 31, 2020)
(Yen millions) (Yen millions) (U.S.$ thousands) (Yen millions)
Change
Change(%)
FY2019
Term
Term
Notes:
1. U.S.$1=Yen 109, for convenience only.2. In accordance with the redefinition of product group in 1Q of FY2020, certain products of Inductive Devices were reclassified into Other Passive Components.
The prior year's sales are also reclassified to conform to the new segmentation.
19,437 5.3
370,214 100.0
20,777 5.6
%
39,643 10.7
35,662 9.6
26,566 7.2
101,871 27.5
300,374 100.0 2,755,725
1Q of FY2020
(April 1, 2019 -June 30, 2019)
51,815 17.3 475,367
4.8 133,367
8.8 241,606
32.3 889,606
6.2 171,661
(U.S.$ thousands)
37,674 12.5 345,633
32,958 11.0 302,367
26,335
36.6
96,967
18,869 5.5 20,608 5.4 19,701
125,587
5.6
Sensor Application Products 18,142 5.4
98,269 29.2
24,841
20.570,476
4.5
118,344 39.4 1,085,724
336,815 100.0
144,513 42.9
20,362 6.0 14,537
55,529 16.5 54,465 14.7173,664 46.9
18,711
39,279 11.7
34,149 10.1
7.4
42,266
106,702
12.2
37,301
(January 1, 2019 -March 31, 2019)
34,274
25,342
101,882 32.9
11.0
8.2
17,289 5.6
29.6 30.4
26,680
10.638,938
112,722
29,323
112,100
7.6
32.9
Passive Components
Magnetic Application Products
Total
Other 15,414
Other
75,390
4.2
40.9
Product
100.0
154,761
(Yen millions) %
343,068
2Q of FY2020
(July 1, 2019 -September 30, 2019)
(Yen millions)
4Q of FY2020
(January 1, 2020 -March 31, 2020)
(Yen millions) %
8.5
39,478
28,739
19.9
43,88313.0
10.411.4
(Yen millions)
44,461
(Yen millions) %
13.7
7.6
42,72111.6
% (Yen millions) (Yen millions)
Sensor Application Products
4Q of FY20191Q of FY2019 2Q of FY2019 3Q of FY2019
%%
(April 1, 2018 -June 30, 2018)
(July 1, 2018 -September 30, 2018)
(October 1, 2018 -December 31, 2018)
100.0
145,372
Product
Passive Components
Magnetic Application
Other
Inductive Devices
Capacitors
36.2
12,618 3.6 17,579
18.9 19.6
5.7
Total
Other
Energy Application Products
100.0 100.0350,803 309,063378,872
Inductive Devices
Capacitors
60,531111,782
66,41041.5
16,013
Energy Application Products
3Q of FY2020
(October 1, 2019 -December 31, 2019)
(Yen millions) %
37,286 10.5
34,803 9.8
26,260 7.4
98,349 27.7
20,308 5.7
355,634 100.0
57,859 16.3161,177 45.3
17,941 5.0