constructing a 3d structural block diagram of the...
TRANSCRIPT

ORIGINAL RESEARCH PAPER
Constructing a 3D structural block diagram of the Central Basinin Marmara Sea by means of bathymetric and seismic data
Emin Demirbag Æ Hulya Kurt Æ Doga Dusunur ÆKerim Sarıkavak Æ Suna Cetin
Received: 27 July 2006 / Accepted: 20 November 2007
� Springer Science+Business Media B.V. 2007
Abstract In this study we made a comparative interpre-
tation of multibeam bathymetric and seismic reflection data
with different resolutions and penetration properties col-
lected in the Central Basin of the Marmara Sea. Our main
objectives were (i) to investigate and compare the active
tectonic deformation observed on the sea bottom and
within the uppermost sedimentary layers to that of the
deep-seated deformation within the limits of resolution and
penetration of the available geophysical data and (ii) to
build a three-dimensional (3D) block diagram of the active
tectonic and buried features by means of a sliced mapping
technique. In this approach, we produced slice maps of the
active and buried structural features at selected depths and
then combined them to form a 3D structural block diagram.
Motivation for our work was to produce a 3D structural
diagram to derive a more detailed image of the structural
features in the Central Basin where there is no available
3D seismic data. The observations from the bathymetry
and seismic data and developed 3D diagram support the
presence of a through-going strike-slip fault that forms a
rotational depression zone against a right-stepping strike-
slip faulting causing a pull-apart basin in the Central
Depression zone.
Keywords Marmara Sea � Central Basin � Active
tectonism � Seismic reflection � Multibeam bathymetry
Introduction
Investigation of active faulting in the Marmara Sea has
been an important research area since the last devastating
earthquake of size Mw = 7.4 located at Golcuk-_Izmit
(western Turkey) along the dextral North Anatolian Fault
(NAF) zone (Fig. 1a and b) occurred on 17.08.1999 (Barka
1999). This recent earthquake as well as historical ones in
and around the Marmara Sea introduced a possibility of a
future destructive earthquake, which is most likely to occur
in the northern Marmara Sea (Parsons et al. 2000).
Therefore, it is important to study the NAF zone in the
Marmara Sea and to evaluate the possible extent of a future
earthquake because the northern shores of the Marmara Sea
are densely populated and the most industrialized prov-
inces of Turkey (Fig. 1b). It is well known that there is a
high possibility of occurrence of a damaging earthquake
in the Marmara Sea from a probabilistic point of view
(Parsons et al. 2000). This high possibility is based on
historical seismicity (Ambraseys and Finkel 1990, 1991,
1995; Ambraseys and Jackson 2000), observed seismicity
(Gurbuz et al. 2000; Sato et al. 2004), and recent mapping
of submarine active tectonic features (Okay et al. 1999,
2000; Parke et al. 1999; Aksu et al. 2000; Imren et al.
2001; Le Pichon et al. 2001; Armijo et al. 2002; Yaltırak
2002; Demirbag et al. 2003; Carton 2005).
Multibeam bathymetric and seismic reflection methods
are the most suitable methods for investigating the active
tectonic features in submarine environments. Therefore,
extensive multibeam and seismic reflection surveys were
carried out by different research groups, particularly in the
E. Demirbag (&) � H. Kurt � D. Dusunur
Jeofizik Muhendisligi Bolumu, Maden Fakultesi, _Istanbul
Teknik Universitesi, Maslak, 34469 Istanbul, Turkey
e-mail: [email protected]
K. Sarıkavak
Mineral Research and Exploration Directorate, Ankara, Turkey
S. Cetin
Turkish Scientific and Technological Research
Council - Marmara Research Center, Kocaeli, Turkey
123
Mar Geophys Res
DOI 10.1007/s11001-007-9036-3

northern Marmara Sea by means of research vessel (R/V)
of Mineral Research and Exploration Directorate (MTA)
R/V MTA Sismik-1 in 1997, 1999 and 2000, by R/V Le
Suroıt in 2000 and by R/V Le Nadir of French IFREMER in
2001. These data sets were studied by independent research
groups during the last decade and results were published in
the literature (Okay et al. 1999, 2000; Parke et al. 1999;
Imren et al. 2001; Le Pichon et al. 2001; Armijo et al.
2002; Demirbag et al. 2003; Carton 2005). According to
these studies, the dominant fault zone enters the Marmara
Sea from _Izmit Gulf in the east and follows the northern
flank of the Cınarcık Basin. It extends westward and cuts
the Central High to reach the Central Basin where it splays
over a central deformation zone, before continuing west-
wards to cross the Tekirdag Basin along the southern
slopes and finally joins the Ganos Fault on land in the
westernmost.
Two major but controversial interpretations are given
for the recent evolution of the Central Depression zone in
the Central Basin: according to Le Pichon et al. (2001) the
Central Depression is formed by a single thoroughgoing
strike-slip fault seated at seismogenic depths (shallower
than 15 km in the Marmara Sea as discussed by Gurbuz
et al. (2000) and causing a principal deformation zone in
the uppermost sediments. Armijo et al. (2002) interpreted
the same deformation zone as a pull-apart depression by
right-stepping of the main fault branches. It is important to
note that the depression zone in the Central Basin is
between the 17.08.1999 earthquake fault (Golcuk-_Izmit) in
the east and the 09.08.1912 earthquake fault (Ganos) in the
west. Therefore, the Central Depression zone is important
in the sense that it is a key area for clarifying the style of
deformation.
The recent studies summarized above are mostly based
on one type of seismic reflection data in terms of resolution
and penetration and the structural features are simply
mapped on the bathymetry. In this study, we put together
all available seismic data with different resolution and
penetration to construct a three-dimensional (3D) structural
block diagram. We used a sliced mapping technique in the
Central Basin where 3D seismic data are not available. Our
main objectives are to investigate the active tectonic
deformation observed on the sea floor and within the
uppermost sedimentary layers and compare to that of the
mid to deep seated faults within the limits of resolution and
penetration of available geophysical data. The motivation
for our work is to put forward a 3D diagram of the struc-
tural features to derive a detailed model of the structural
Fig. 1 Location map of the study area: (a) The North Anatolian and
East Anatolian faults are the most important fault zones in the
Anatolia. (b) Eastern Marmara Sea area is one of the most populated
and industrially invested provinces of Turkey. (c) The Central Basin
is one of the major basins in the Marmara Sea. An east–west oriented
depression zone in the middle part of the Central Basin is noticed in
the bathymetry
Mar Geophys Res
123

features of the Central Basin, in particular the Central
Depression zone.
Multibeam bathymetric data acquisition and mapping
In this study we used the multibeam bathymetric data
collected by R/V Le Suroıt in 2000. This data set is the most
complete bathymetric data covering the northern Marmara
Sea (Fig. 1c). It was collected using a Simrad EM300
multibeam echo-sounder with sonar frequency of 30 kHz.
Processing of the raw data was carried out by the French
institute IFREMER. Gridding and mapping of the data
were obtained by means of Generic Mapping Tools (GMT)
(Wessel and Smith 1995) and in-house developed software
(Figs. 1c and 2). The multibeam data are adequate to make
a bathymetric map of 1:50,000 scale (Rangin et al. 2001).
The average water depth of the Central Basin plain is
1150–1200 m. The basin plain is severely cut in the middle
where the bathymetry deepens to about 1,250 m, forming
the Central Depression zone. The northern slopes of the
Central Basin are more pronounced with deep-cut, straight
channels, whereas the southern slopes are gentle with wide,
long valleys. Traces of the active faults are clearly obser-
vable in the bathymetric image maps generated by GMT
mapping software. We generated gray scale shadow maps
of the bathymetry by illuminating the gridded data from the
main geographical directions. This approach allowed us to
trace the active faults across the sea floor (Fig. 2). Note that
the northern margin of the Central Depression zone con-
sists of a series of bathymetric steps due to en echelon
faults, whereas the southern margin shows more continu-
ous fault traces with horse-tail splays.
Acquisition, compilation and processing of the seismic
reflection data
In this study, we used three sets of seismic reflection data
with different resolution and penetration (Tables 1–3). The
first data set is the R/V Le Suroıt surface-towed and deep-
towed seismic data, which was used to map the active
tectonic features within the uppermost sedimentary layers.
This data set was collected by a bilateral cooperation
Fig. 2 Bathymetric image of the Central Basin. This map also
constitutes the first slice in constructing the 3D block diagram. Note
that the northern slopes are steep and cut by deep channels while the
southern slope is gentler with longer valleys. The basin plain is
located approximately at 1,200 m depth and sharply cut by 50 m or so
deep scarps indicating active faults. (a) Illumination is from northeast.
(b) Illumination is from southwest
Mar Geophys Res
123

Table 1 Seismic data
collection parameters
N/A, Not applicable
Channels Multi-channel Single-channel
Research vessel MTA Sismik 1 Le Nadir Le Suroit
Survey and year DMS 1997 M2S 2000 SeisMarmara
2001
Surface towed
2000
PASISAR
2000
Record length 6 s 6 s 12 s chopped 2 or 3 s 2 or 3 s
Sampling rate 2 ms 2 ms 4 ms 0.5 ms 0.5 ms
Number of channels 72 48 360 1 1
Source Airgun Airgun Airgun Sparker Sparker
Shot interval 50 m 50 m 50 or 150 m 5 or 13 m 5 m
Offset 125 m 150 m 75 m N/A N/A
Station interval 12.5 m 12.5 m 12.5 m N/A N/A
Common depth point
interval
6.25 m 6.25 m 6.25 m N/A N/A
Fold 9 6 45 or 15 N/A N/A
Table 2 Seismic data
processing steps
N/A, Not applicable
Channels Multi-channel Single-channel
Research vessel MTA Sismik 1 Le Nadir Le Suroit
Survey/year DMS
1997
M2S
2000
Seismarmara
2001
Surface
2000
PASISAR 2000
Data transcribing Yes Yes Yes Yes A special data processing
flow is applied for this
data set. Please refer to
Savoye et al. (1995) and
Demirbag et al. (2003)
for more explanations.
Datuming to sea
level
Yes Yes Yes Yes
Geometry def. In-line In-line In-line N/A
Gain correction Yes Yes Yes Yes
Filtering Bandpass Bandpass Bandpass Bandpass
F-K filtering No No Yes N/A
Sorting Yes Yes Yes N/A
Velocity analysis Yes Yes Yes N/A
NMO correction Yes Yes Yes N/A
Muting Yes Yes Yes N/A
Stacking Yes Yes Yes N/A
Migration Yes Yes Yes N/A
Table 3 Comparative analysis
of the seismic data setsResearch vessel, type of seismic
data and penetration versus
resolution.
*Dominant frequencies
(Hz) observed from the
amplitude spectrum of the
raw shot data and seismic
source types
Calculated resolutions from Yılmaz
(1987) for a sea bottom at 1,200 m
depth and 1,500 m/s wave velocity
*Lateral
(m)
*Vertical
(m)
Resolution
Le Suroıt single-channel, shallow
penetration versus high resolution
(PASISAR)
500 (3 kJ sparker) \47 \1 High
Le Suroıt single-channel, shallow
penetration versus high resolution
(surface-towed)
400 (3 kJ sparker) 47 1 High
MTA Sismik-1 multi-channel,
moderate penetration and
resolution
30 (10 or 9 airguns) 173 13 Moderate
Le Nadir multi-channel, deep
penetration versus low
resolution
10 (12 airguns) 300 36 Low
Mar Geophys Res
123
between French and Turkish scientific institutions in 2000.
A second set of seismic reflection data was collected by R/
V MTA Sismik-1 in 1997 and 2000. The R/V MTA Sismik-1
data set collected in 2000 is introduced for the first time
during this study (Dusunur 2004). All of the data collected
by R/V MTA Sismik-1 provide a good look at the active
structural features in moderate resolution and penetration
in the Central Basin, particularly in the Central Depression.
Using this data set, we are able to follow the active and
buried structural features within the basin deposits and at
the margins of the Central Basin. A third seismic data set is
the deep penetration but low resolution data collected by R/
V Le Nadir by bilateral cooperation between French and
Turkish scientific institutes in 2001. This survey provides a
deep image of the Central Basin.
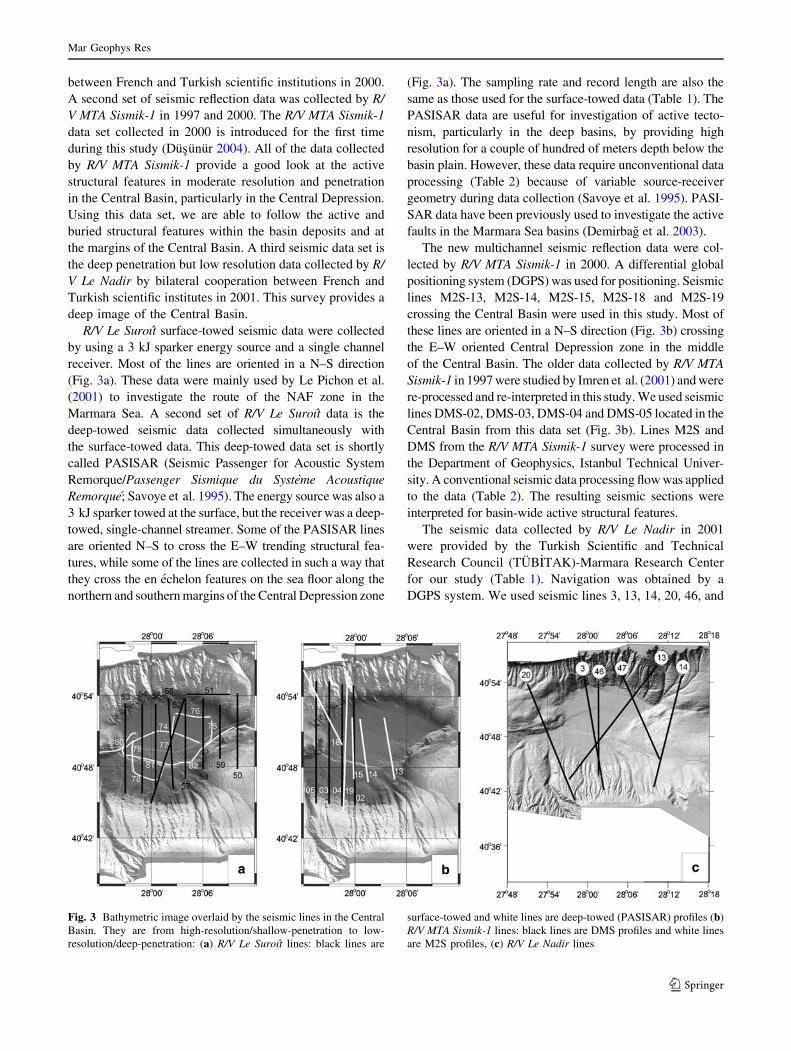
R/V Le Suroıt surface-towed seismic data were collected
by using a 3 kJ sparker energy source and a single channel
receiver. Most of the lines are oriented in a N–S direction
(Fig. 3a). These data were mainly used by Le Pichon et al.
(2001) to investigate the route of the NAF zone in the
Marmara Sea. A second set of R/V Le Suroıt data is the
deep-towed seismic data collected simultaneously with
the surface-towed data. This deep-towed data set is shortly
called PASISAR (Seismic Passenger for Acoustic System
Remorque/Passenger Sismique du Systeme Acoustique
Remorque; Savoye et al. 1995). The energy source was also a
3 kJ sparker towed at the surface, but the receiver was a deep-
towed, single-channel streamer. Some of the PASISAR lines
are oriented N–S to cross the E–W trending structural fea-
tures, while some of the lines are collected in such a way that
they cross the en echelon features on the sea floor along the
northern and southern margins of the Central Depression zone
(Fig. 3a). The sampling rate and record length are also the
same as those used for the surface-towed data (Table 1). The
PASISAR data are useful for investigation of active tecto-
nism, particularly in the deep basins, by providing high
resolution for a couple of hundred of meters depth below the
basin plain. However, these data require unconventional data
processing (Table 2) because of variable source-receiver
geometry during data collection (Savoye et al. 1995). PASI-
SAR data have been previously used to investigate the active
faults in the Marmara Sea basins (Demirbag et al. 2003).
The new multichannel seismic reflection data were col-
lected by R/V MTA Sismik-1 in 2000. A differential global
positioning system (DGPS) was used for positioning. Seismic
lines M2S-13, M2S-14, M2S-15, M2S-18 and M2S-19
crossing the Central Basin were used in this study. Most of
these lines are oriented in a N–S direction (Fig. 3b) crossing
the E–W oriented Central Depression zone in the middle
of the Central Basin. The older data collected by R/V MTA
Sismik-1 in 1997 were studied by Imren et al. (2001) and were
re-processed and re-interpreted in this study. We used seismic
lines DMS-02, DMS-03, DMS-04 and DMS-05 located in the
Central Basin from this data set (Fig. 3b). Lines M2S and
DMS from the R/V MTA Sismik-1 survey were processed in
the Department of Geophysics, Istanbul Technical Univer-
sity. A conventional seismic data processing flow was applied
to the data (Table 2). The resulting seismic sections were
interpreted for basin-wide active structural features.
The seismic data collected by R/V Le Nadir in 2001
were provided by the Turkish Scientific and Technical
Research Council (TUB_ITAK)-Marmara Research Center
for our study (Table 1). Navigation was obtained by a
DGPS system. We used seismic lines 3, 13, 14, 20, 46, and
Fig. 3 Bathymetric image overlaid by the seismic lines in the Central
Basin. They are from high-resolution/shallow-penetration to low-
resolution/deep-penetration: (a) R/V Le Suroıt lines: black lines are
surface-towed and white lines are deep-towed (PASISAR) profiles (b)
R/V MTA Sismik-1 lines: black lines are DMS profiles and white lines
are M2S profiles, (c) R/V Le Nadir lines
Mar Geophys Res
123

47 in this study (Fig. 3c). After data transcribing at
TUB_ITAK-Marmara Research Center, further data pro-
cessing were carried out in the Department of Geophysics
at Istanbul Technical University. A conventional data
processing stream was applied to the data (Table 2). Dur-
ing data processing, the record length was truncated at
12 s. Basin-wide, deep seated features were interpreted
from the processed seismic sections.
Validity of the data in terms of resolution, penetration
and geological targets
The seismic reflection data sets in this study can be classified
into three categories in terms of penetration and resolution.
Classification from ‘‘shallow penetration/high resolution’’ to
‘‘deep penetration/low resolution’’ is as follows: (i) the R/V
Le Suroıt single-channel surface-towed and PASISAR data
(Le Pichon et al. 2001; Demirbag et al. 2003) (ii) the R/V
Sismik-1 multichannel data (_Imren et al. 2001; Dusunur
2004) and (iii) the R/V Le Nadir multichannel data (Carton
2005). Table 3 provides a comparative analysis of the reso-
lution of the data presented in this article, and lists the vertical
resolution and the first Fresnel zone (lateral resolution) at
1,200 m water depth (the average depth of the Central Basin)
and for a P-wave velocity of 1,500 m/s for water. Note that
the resolution values given in the table are for the seafloor and
both the vertical and lateral resolution degraded as depth
increased.
Multichannel seismic data provide good penetration, but
are more complicated in terms of resolution. Both vertical
(1/4 of dominant wavelength) and lateral (first Fresnel
zone) arguments play a deterministic role in evaluating the
resolution (Yılmaz 1987). The R/V Le Suroıt data have the
shallowest penetration, limited to a few hundred of meters
from the sea floor, but with high vertical resolution of 1 m
and a few tens of meters of lateral resolution (Table 1).
This data set enables us to map the active tectonic features
at shallow depths, particularly faults diverging upward.
Small vertical steps are observable from the data, as well as
branching of the minor faults and compressional effects in
the sediments. Observation of small scale folds, faults and
block rotations and their correlation with bathymetry can
be carried out by means of this data set. The R/V MTA
Sismik-1 data have penetration of 3–4 km, sufficient for
observing the active tectonics in terms of basin-wide faults.
We are able to follow the active structural features within
the deposits filling the Central Basin, as well as at the
margins of the basin. However, faulting activity within the
uppermost sedimentary layers and sea floor cannot be
observed clearly from this data set due to limited resolution
(Table 1). Small vertical offsets of the active faults on the
sea bottom are smoothed out due to the Fresnel zone
(Yılmaz 1987). R/V Le Nadir data provide the deepest
penetration ([10 km), which is sufficient to observe the
basin margin faults and base of the basin in some sections.
Interpretation of the seismic sections
Here we show typical examples of seismic sections and their
interpretation for each set of the seismic data. Before we
introduce the examples, we demonstrate the application
scale, resolution and peneration differences in the data sets.
For this purpose, three close seismic sections, section 55 from
R/V Le Suroit, section M2S-14 from R/V MTA Sismik-1 and
section 3 from R/V Le Nadir, were selected (Fig. 3). We
display these three seismic sections in the same horizontal
and vertical scale to allow the reader to directly compare the
sections in terms of resolution and penetration (Fig. 4).
Fig. 4 Comparison of seismic data sets in terms of application scale,
resolution and penetration. Section 55 from R/V Le Suroit, section
M2S-14 from R/V MTA Sismik-1 and section 3 from R/V Le Nadir.Refer to Fig. 3 for locations
Mar Geophys Res
123

To show the characteristic structural features of the
study area, we take the first example from the R/V Le Suroıt
deep-towed PASISAR data, a N–S oriented section 79
located in the western part of the Central Basin (Figs. 3 and
5). As discussed above (see also Demirbag, et al. (2003),
the PASISAR data provide the best vertical resolution, but
the shallowest penetration. This section displays approxi-
mately the upper 200 m of sediments at 1,200 m water
depth. Section 79 clearly shows the active faults cutting the
sea floor as well as the uppermost sediment layers. The
sharp cuts in the sediments, particularly those at southern
half of the section correlate well with the fault scarps
observed on the bathymetry image (Fig. 2). For example,
the steep scarp in the sea floor in the south is about 50 m
high indicating that the faults are still quite active (Fig. 5).
These faults are connected to the same main fault in the
map plane (horizontal) although they appear to be different
faults in the section plane (vertical) due to horse-tail splay.
In the northern half of section 79, we observe small-scale
structural features, including a small trough between the
two sub-connecting minor faults, and compressed sedi-
ments in the uppermost levels. The small elevation of the
bathymetry is remarkable. This group of small-scale,
characterstic structural features are the surface and shal-
lowest indicators of the northern boundary of the Central
Depression zone.
We now show the N–S oriented R/V MTA Sismik-1
seismic section M2S-19 as an example of moderate reso-
lution and penetration data (Figs. 3 and 6). This section is
important in the sense that it crosses the basin deposits, the
Fig. 5 (a) An example of single-channel shallow seismic section
(Line 79) with high resolution from R/V Le Suroıt and (b) its
interpretation. Refer to Fig. 3 for line location. Very high resolution
but shallow penetration provides clear images of the active structural
features. The vertical axis is in meters. Note that the faults cut thin
sedimentary layers as well as the sea bottom. Sharp scarps in the
bathymetry and compressed young deposits are indications of active
deformation
Mar Geophys Res
123

structural features on the basin margins, and the Central
Depression zone. It is interpreted between the sea floor
reflections and the multiple reflections to avoid mis-inter-
pretation below the multiples. The sea bottom reflections
show undulated topography and a steep slope on the northern
part of the section. The sea floor is quite smooth and almost
horizontal in the basin plain, except where it is sharply cut by
structural features of the Central Depression, such as the
active faults bordering the depression. However, sharp
bathymetric scarps are not recognized as well as in the
PASISAR sections because of the limited vertical resolution.
The active faults forming the Central Depression zone are
noticable before they are masked by the sea floor multiple
reflections and they are most likely to continue to deeper
parts of the basin. It is possible to distinguish the upward
branches of the northern as well as southern fault. A few
branches of these faults are observed at shallow levels but
are connected at around 2 s depth (two-way travel time
(TWT)). The branching of the faults towards the sea floor
can be correlated to the en echelon fault scarps observed as a
lineament on the bathymetric image map (Fig. 2).
Another important observation is that the faults at the
margins of the Central Basin are not active like the ones
forming the Central Depression zone. Note that the mar-
ginal basin faults are inactive, in that they do not cut the
uppermost sedimentary layers. However, those sedimen-
tary layers at 2.0 s or deeper appear to be affected by the
basin margin faults (Fig. 6). Four other important structural
features are also observable: three of which are within the
Central Depression zone. However, these faults do not cut
the uppermost sedimentary layers. The fourth fault is
observed to the north of the Central Depression zone. This
fault also does not cut the uppermost sedimetary layers. In
the northern part of the section, there are two normal faults
providing a stepwise lowering of the basin deposits in that
region. The other seismic sections of R/V MTA Sismik-1
show similar structual features and basin fill properties.
The last example is taken from a deep-penetrating, low-
resolution seismic section of R/V Le Nadir. Section 13
provides a deep image of the Central Basin and the Central
Depression zone, but with very low resolution (Figs. 3 and
7). It is not easy to observe the active fault scarps in the
bathymetry due to very low resolution. However, it is
important to note that the base of the Central Basin is
observable on the section. This observation shows that the
sedimentary fill is about 3 s TWT thick in the Central
Basin. By using 1,500 m/s wave propagation velocity in
the water and 2,600 m/s average velocity from the velocity
analysis, the base of the Central Basin is estimated at
approximately 5,850 m depth and with a sedimentary fill of
about 4,725 m. The basins in the Marmara Sea are the
products of a superimposed evolutionary history defined by
two different aged fault systems: the early Miocene-early
Pliocene Thrace-Eskisehir Fault Zone and its branches, and
the late Pliocene-Recent North Anatolian Fault and its
branches (Yaltırak 2002). Therefore, the age of basin fill
should be Miocene-Pliocene for deep seated sediments and
Quaternary to recent for shallow sediments.
The structural features are observable both at basin
margins and at the borders of the Central Depression zone.
The faults at the basin margins, particularly the southern
one appear inactive while those forming the Central
Depression deform the basin deposits from the sea floor to
greater depths. It is possible that the northern and southern
boundry faults of the Central Depression zone are joining
at greater depths; but this is not clear from the section due
to weak reflection continuity and reduced signal-to-noise
ratios at depth.
Constructing a 3D block diagram and its evaluation
To form a 3D structural block diagram of the Central
Basin, in particular the Central Depression zone, we
developed an approach to map the structural features
observed in the bathymetric image map and in the seismic
sections. We produced ‘‘slice maps’’ of the structures at
‘‘feature sampling depths’’ from the bathymetric image
Fig. 6 (a) An example of multi-channel seismic section (Line M2S-
19) with moderate penetration and resolution from R/V MTA Sismik-1and (b) its interpretation. Refer to Fig. 3 for line location. The
penetration is well enough to observe the basin-wide structural
features in expense of high resolution. Although the bathymetric
scarps indicating active faults are not well observed in the section, the
deformation in the sedimentary fill is well exposed to distinguish
between the active and inactive basin-wide structures
Mar Geophys Res
123

map and seismic sections and then combined them to form
the 3D block diagram (Fig. 8). We selected three levels of
the ‘‘feature sampling depths’’ as follows: the sea floor is
the first sampling level for scarps of the active faults; the
second and third levels are at 2.0 and 3.0 s two-way-travel
times in the multichannel seismic data, corresponding to
2.4 and 3.9 km depths, respectively. This approximation
allowed us to determine the dip of the fault planes, and to
check the continuity of the fault scarps observed at the sea
bottom to deeper part of the sedimentary layers. In doing
so, we are able to test whether some of these scarps were
only surficial features, or if they connected to faults at
greater depths in the basin.
We prefer to include only those features about which we
are sure concerning their continuation in the seismic sec-
tions. The buried faults are shown in Fig. 8a whereas the
active ones cutting the uppermost sediments and sea floor
are shown in Fig. 8b. The sea bottom is the first level of
slice mapping. The surficial response to active tectonism is
well marked on the bathymetry and this correletes with the
near surface response obtained from the PASISAR seismic
data. The en echelon pattern and horse-tail splay of the
active faults on the bathymetry, as well as at shallow sub-
seafloor depths are clearly displayed in the diagram. The R/
V MTA Sismik-1 data provides a good check whether the
surface features were indeed faults, or they were only
surface features with no deeper extension. Extension of the
faults to greater depths were accomplished by use of R/V
Le Nadir data. These controlled and correlative interpre-
tations generated the 3D structural block diagram seen in
Fig. 8c.
The diagrams are projected to provide a view from the
southeast (Fig. 8). The eastern and western, deep, straight
main fault branches were included from Le Pichon et al.
(2001). These faults are connecting to the Central
Depression, which is delineated by en echelon faults along
the northern border while the horse-tail splays are limited
to the southern border. Both northern and southern fault
distributions are connected to the basin-wide faults at
greater depths as shown in Fig. 8. The genetic relation
between the deeper basin-wide faults and shallow en ech-
elon and horse-tail splays are obvious from the diagram.
This way of imaging the structural features provides a
better understanding of the structural model where there is
no 3D seismic data available. Conventional structural
evaluations are mostly based on faults mapped at the sur-
face, and where the deep extension and curvature of the
faults are usually omitted. However, the depth extension
and curvature of a fault plane could be an important factor
to asses the structural features. A surface map obtained
from a single type of seismic data will not provide enough
information such as slope, curvature and branching of the
fault plane. In conclusion, a 3D block diagram obtained
from a various type of seismic data with different resolu-
tions and penetrations may provide improved insight into
the evaluation of the structural features.
Evaluation of the 3D structural diagram (Fig. 8) in terms
of two major but controversial interpretations (Le Pichon
et al. 2001; Armijo et al. 2002) may be given as follows:
en echelon faulting and horse-tail splays are mainly
observed in the uppermost basin fill along the borders of
the Central Depression zone. These surface-shallow sedi-
mentary structural features join to each other and/or to
basin-wide faults cutting through the sedimentary fill at
both the northern and southern borders, thus forming the
Central Depression zone. Slight convergence of the
Fig. 7 (a) An example of multi-channel deep seismic section (Line
13) with low resolution from R/V Le Nadir and (b) its interpretation.
Refer to Fig. 3 for line location. Note that details are totally lost due
to very low resolution. However, deep penetration allows to observe
possible base reflections of the Central Basin along the section. The
basin deposits are thoroughly cut by the faults bordering the Central
Depression zone from sea bottom to greater depths
Mar Geophys Res
123

Fig
.8
3D
stru
ctu
ral
blo
ckd
iag
ram
.T
he
stru
ctu
ral
feat
ure
sar
ep
rese
nte
din
mo
red
etai
lfr
om
gre
ater
dep
ths
toth
ese
ab
ott
om
asg
ov
ern
edb
yth
ere
solu
tio
nof
the
avai
lab
lese
ism
icd
ata.
(a)
Bu
ried
stru
ctu
ral
feat
ure
s,(b
)ac
tiv
est
ruct
ura
lfe
atu
res,
(c)
shal
low
enec
hel
on
and
ho
rse
tail
stru
ctu
ral
feat
ure
sto
get
her
wit
hb
uri
edan
dac
tiv
efa
ult
s.T
he
stri
ke
slip
mai
nfa
ult
bra
nch
esar
e
fro
mL
eP
ich
on
etal
.(2
00
1).
Th
ed
iag
ram
sar
ev
iew
edfr
om
sou
thea
st.
Ver
tica
lex
agg
erat
ion
isab
ou
t2
0
Mar Geophys Res
123
northern and southern faults in section view and their
continuation from east to west in plan view make it pos-
sible that these faults join to one another and/or to a larger
fault at greater depths. Thus, the Central Depression zone
along the two main dextral branches rotates clockwise by
forming an en echelon system at the northern boundary and
horse-tail splays at the southern boundary within the
uppermost sedimentary layers.
It is well known that a depression zone is develeped in a
strike slip system where two main branches of a strike slip
fault have offset over a zone. The depression is mainly
developed by normal faults oblique to the main strike slip
branches. Unlike a pull-apart system, the Central Depres-
sion zone in the Central Basin lacks normal faulting
distributed oblique to the main strike-slip branches. These
observations from the bathymetry and seismic data, as
shown in our 3D diagram support a tectonic model of a
thoroughgoing strike-slip fault causing a rotational
depression zone (Le Pichon et al. 2001) against a right-
stepping strike slip faulting causing a pull-apart basin
(Armijo et al. 2002).
Acknowledgements This study was supported by TUB_ITAK
(Grant No: 102Y105). We thank the captains and crew members of
R/V MTA Sismik-1, R/V Le Suroıt and R/V Le Nadir for their effort
during data acquisition. We thank the scientists and staff from Turkish
institutes TUB_ITAK, MTA and SHOD, and from French institutes
CNRS, INSU and IFREMER for collaborative work. We thank Drs.
Celal Sengor, Naci Gorur, Xavier Le Pichon, Alfred Hirn and
Rolando Armijo for leading bathymetric and seismic data acquisition
in the last decade in the Marmara Sea. We thank Drs. Haluk
Eyidogan, Ruhi Saatcılar, Semih Ergintav and Yavuz Hakyemez for
their support to realize this study.
References
Aksu AA, Calon TJ, Hiscott RN, Yasar D (2000) Anatomy of the
North Anatolian Fault Zone in the Marmara Sea, western
Turkey: extensional basins above a continental transform. GSA
Today 10(6):3–7
Ambraseys NN, Finkel CF (1990) The Marmara Sea earthquake of
1509. Terra Nova 2:167–174
Ambraseys NN, Finkel CF (1991) Long-term seismicity of _Istanbul
and of the Marmara Sea. Terra Nova 3:527–539
Ambraseys NN, Finkel CF (1995) The seismicity of Turkey and
adjacent areas—A historical review. Eren, _Istanbul
Ambraseys NN, Jackson JA (2000) Seismicity of the Sea of Marmara
(Turkey) since 1500. Geophys J Int 141:F1–F6
Armijo R, Meyer B, Navarro S, King G, Barka A (2002) Asymmetric
slip partitioning in the Sea of Marmara pull-apart: a clue to
propagation processes of the North Anatolian Fault? Terra Nova
14:80–86
Barka A (1999) The 17 August 1999 _Izmit earthquake. Science
285:1858–1859
Carton H (2005) Three-dimensional seismic images of an active-pull
apart basin: the Cınarcık Basin along the North Anatolian Fault.
Lithos Sci Rep 7:63–72
Demirbag E, Rangin C, Le Pichon X, Sengor AMC (2003)
Investigation of the tectonics of the Main Marmara Fault by
means of deep towed seismic data. Tectonophysics 361:1–19
Dusunur D (2004) Investigation of the active tectonism in the Central
Marmara Basin by geophysical means. Master of Science Thesis
(in Turkish with expanded abstract in English), Institute of
Science and Technology, Istanbul Technical University
Gurbuz C, Aktar M, Eyidogan H, Cisternas A, Haessler H, Barka A,
Ergin M, Turkelli N, Polat O, Ucer SB, Kuleli S, Barıs S,
Kaypak B, Bekler T, Zor E, Bicmen F, Yoruk A (2000) The
seismotectonics of the Marmara region (Turkey): results from a
microseismic experiment. Tectonophysics 316:1–17_Imren C, Le Pichon X, Rangin C, Demirbag E, Ecevitoglu B, Gorur N
(2001) The North Anatolian Fault within the Sea of Marmara: a
new interpretation based on multi-channel seismic and multi-
beam bathymetry data. Earth Planet Sci Lett 186:143–158
Le Pichon X, Sengor AMC Demirbag E, Rangin C, _Imren C, Armijo
R, Gorur N, Cagatay N, Mercier de Lepinay B, Meyer B,
Saatcılar R, Tok B (2001) The active Main Marmara Fault. Earth
Planet Sci Lett 192:595–616
Okay AI, Demirbag E, Kurt H, Okay N, Kuscu I (1999) An active,
deep marine strike-slip basin along the North Anatolian Fault in
Turkey. Tectonics 18:129–147
Okay AI, Kaslılar-Ozcan A, _Imren C, Boztepe-Guney A, Demirbag E,
Kuscu I (2000) Active faults and evolving strike-slip basins in
the Marmara Sea, northwest Turkey: a multichannel seismic
reflection study. Tectonophysics 321:189–218
Parke JR, Minshull TA, Anderson G, White RS, McKenzie DP,
Kuscu I, Gorur N, Sengor AMC (1999) Active faults in the Sea
of Marmara, western Turkey, imaged by seismic reflection
profiles. Terra Nova 11:223–227
Parsons T, Toda S, Stein R, Barka A, Dieterich J (2000) Heightened
odds of large earthquakes near Istanbul: an interaction-based
probability calculation. Science 228:661–665
Rangin C, Demirbag E, _Imren C, Crusson A, Normand A, Le Drezen
E, Le Bot A (2001) Marine Atlas of the Sea of Marmara
(Turkey). 11 plates and 1 booklet. Special publication (ISBN 2-
84433-068-1) by IFREMER Technology Center, Brest, France
Sato T, Kasahara J, Taymaz T, Ito M, Kamimura A, Hayakawa T, Tan O
(2004) A study of microearthquake seismicity and focal mecha-
nisms within the Sea of Marmara (NW Turkey) using ocean bottom
seismometers (OBSs). Tectonophysics 391:303–314
Savoye B, Leon P, De Roeck YH, Marsset B, Lopes L, Herveou J
(1995) PASISAR: a new tool for near-bottom very high
resolution profiling in deep water. First Break 13:253–258
Wessel P, Smith WHF (1995) New version of the Generic Mapping
Tools released. EOS Trans. AGU 76:329
Yaltırak C (2002) Tectonic evolution of the Marmara Sea and its
surroundings. Mar Geol 190:493–529
Yılmaz O (1987) Seismic data processing. Investigations in Geophysics,
vol 2. Society of Exploration Geophysicists, Tulsa, Oklahoma
Mar Geophys Res
123