constructing a nutrient mass balance for post the core was cut into 2 cm increments total nutrientin...
TRANSCRIPT

CONSTRUCTING A NUTRIENT MASS
BALANCE FOR
POST‐ERUPTION SPIRIT LAKE
UW Tacoma, Environmental ScienceLaura Alskog, Danielle Dahlquist, Erika Klein, Katie Royer
Advisors: Jim Gawel, Mindy Roberts, Matt Kelley

BATHYMETRY PRE‐ERUPTION POST‐ERUPTION

INTRODUCTION
• Post‐eruption:– Elevation raised almost 60 meters
– Surface area increased
– Shallower
(Dale et al. 2005)

Surface water(Streams)
Groundwater
Tunnel
Plants
Phytoplankton
Zooplankton
Insects
Sediments
Water Column
Amphibians
Fish
WHAT ARE WE DOING?Atm Deposition
Logs
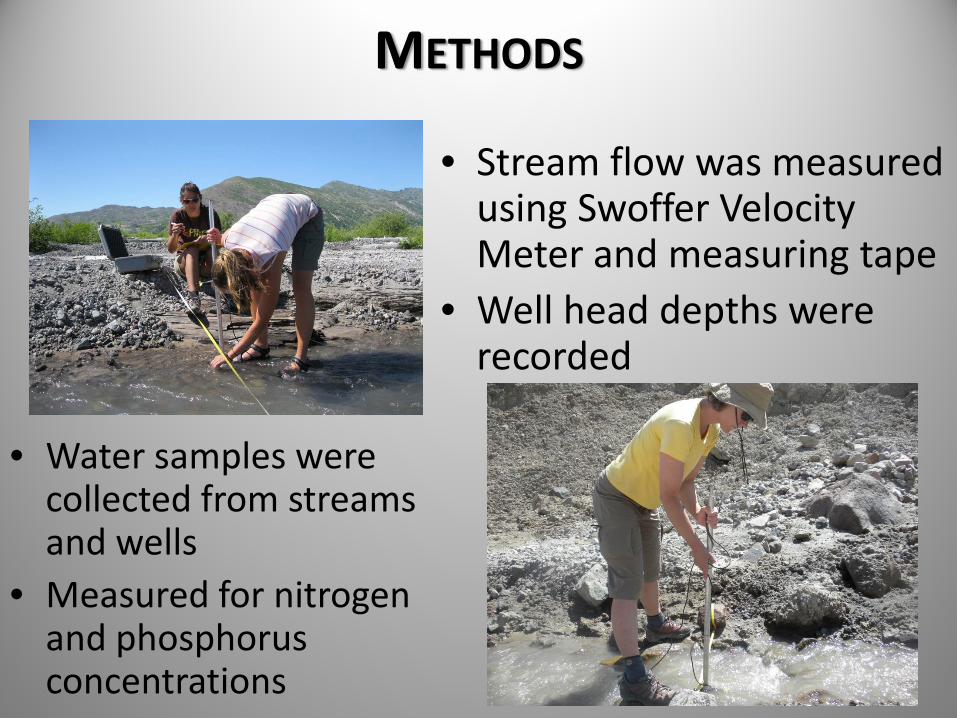
METHODS
• Stream flow was measured using Swoffer Velocity Meter and measuring tape
• Well head depths were recorded
• Water samples were collected from streams and wells
• Measured for nitrogen and phosphorus concentrations
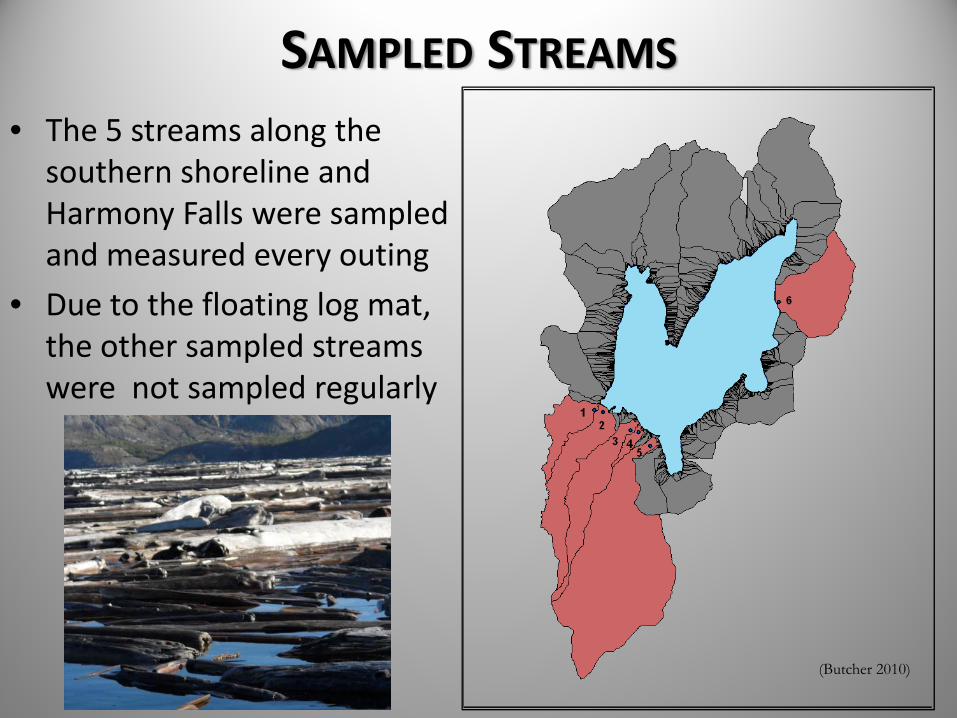
SAMPLED STREAMS
• The 5 streams along the southern shoreline and Harmony Falls were sampled and measured every outing
• Due to the floating log mat, the other sampled streams were not sampled regularly
(Butcher 2010)

CALIBRATION CURVE AND SURFACEWATER INPUT
y = 3.3523E‐08xR² = 8.2368E‐01
0.00
0.05
0.10
0.15
0.20
0.25
0.30
0.0E+00 2.0E+06 4.0E+06 6.0E+06 8.0E+06
Point D
ischarge
Rate (m
3 /s)
Drainage Area (m2)
Stream #Basin Area
(m2)Flow (m3/s)
Annual Flow Estimate (m3/yr)
1 7199654 0.2185 6891697
2 179321 0.0271 854949
3 1688218 0.1031 3252819
4 1835528 0.0871 2745956
5 919126 0.0090 284174
6 2325294 0.1016 3205122
Remaining Watershed 23560194 0.7898 24907397
Total Inflow 42142114
AVERAGE FLOW OF STREAMS VS. BASIN AREA

ALL HYDROLOGY
Tunnel Outflow
161,278,279 m3/year
Groundwater Inflow
119,136,165 m3/year
Surface Water Inflow
42,142,114 m3/year
‐
=
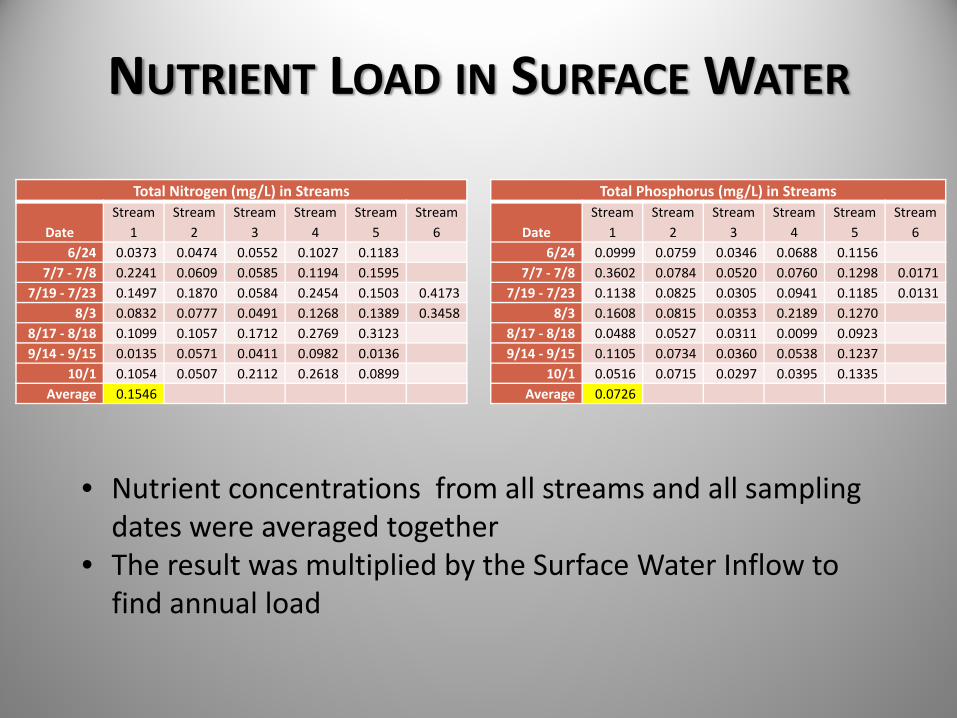
NUTRIENT LOAD IN SURFACE WATER
Total Nitrogen (mg/L) in Streams
DateStream
1Stream
2Stream
3Stream
4Stream
5Stream
66/24 0.0373 0.0474 0.0552 0.1027 0.1183
7/7 ‐ 7/8 0.2241 0.0609 0.0585 0.1194 0.15957/19 ‐ 7/23 0.1497 0.1870 0.0584 0.2454 0.1503 0.4173
8/3 0.0832 0.0777 0.0491 0.1268 0.1389 0.34588/17 ‐ 8/18 0.1099 0.1057 0.1712 0.2769 0.31239/14 ‐ 9/15 0.0135 0.0571 0.0411 0.0982 0.0136
10/1 0.1054 0.0507 0.2112 0.2618 0.0899Average 0.1546
Total Phosphorus (mg/L) in Streams
DateStream
1Stream
2Stream
3Stream
4Stream
5Stream
66/24 0.0999 0.0759 0.0346 0.0688 0.1156
7/7 ‐ 7/8 0.3602 0.0784 0.0520 0.0760 0.1298 0.01717/19 ‐ 7/23 0.1138 0.0825 0.0305 0.0941 0.1185 0.0131
8/3 0.1608 0.0815 0.0353 0.2189 0.12708/17 ‐ 8/18 0.0488 0.0527 0.0311 0.0099 0.09239/14 ‐ 9/15 0.1105 0.0734 0.0360 0.0538 0.1237
10/1 0.0516 0.0715 0.0297 0.0395 0.1335Average 0.0726
• Nutrient concentrations from all streams and all sampling dates were averaged together
• The result was multiplied by the Surface Water Inflow to find annual load

NUTRIENT LOAD IN GROUNDWATER AND TUNNEL
• Nutrient concentrations were averaged and multiplied by the Groundwater Inflow to find annual loadTotal Nitrogen (mg/L) in Wells
Date Well 1 Well 2 Well 3 Well 4 Well 5 Well 6
7/8 0.1747 0.4001 0.1274 0.2205 1.2055 0.4279
7/19 0.1167 0.2444 0.7829 0.2519 0.2650 0.2612
8/3 0.0652 0.1159 0.2689 0.1305 0.2442 1.2545
8/17 0.0749 0.1245 0.0932 0.2612 0.3189 0.1573
9/15 0.3602 0.2066 0.3028 0.2624 0.4438 0.1883
10/1 0.1091 0.1243 0.3250 0.2037 0.4943 0.1145
Average 0.2978
Total Phosphorus (mg/L) in WellsDate Well 1 Well 2 Well 3 Well 4 Well 5 Well 6
7/8 0.0000 0.0080 0.0423 0.0000 0.0277 0.0152
7/19 0.0000 0.0000 0.0643 0.1802 0.0178 0.0000
8/3 0.0181 0.0201 0.0160 0.0324 0.0897 0.0046
8/17 0.0342 0.0408 0.0194 0.2483 0.0490 0.0063
9/15 0.1882 0.0451 0.0110 0.0544 0.0372 0.0247
10/1 0.0221 0.1043 0.0100 0.0268 0.0169 0.0161Average 0.0414
• Tunnel Outflow Nutrient Load is found by multiplying epilimnion nutrient concentrations and Tunnel Outflow
Total Nitrogen (mg/L)
Epilimnetic Average 0.1095
Streams Average 0.1546
Wells Average 0.2978
Total Phosphorus (mg/L)
Epilimnetic Average 0.0041
Streams Average 0.0726
Wells Average 0.0414

StreamsTN: 6,517 kg/yearTP: 654 kg/year
GroundwaterTN: 35,483 kg/yearTP: 4,936 kg/year
TunnelTN: 17,656 kg/yearTP: 654 kg/year
Plants
Phytoplankton
Zooplankton
Insects
Sediments
Water Column
Amphibians
Fish
Atm Deposition
Logs
NUTRIENT FLUXES kg N/yr kg P/yr
Tunnel Outflow 17656.07 654.17
Surface Inflow 6517.19 3060.29
Groundwater Inflow 35483.92 4935.71
NUTRIENT MODEL

DISCUSSION• Hydrology Assumptions
– Average summer surface water flows and nutrient concentrations are a good representation of yearly flow
• Nutrient Concentration Assumptions– Measured nutrient concentrations are similar throughout the year even though they were only measured in summer

FUTURE WORK IN STREAMS AND WELLS
• Collect a more complete set of surface water flows
• Apply annualized flow rates to streams
• Insert wells in more locations
• Find source of N and P that enters into streams and wells
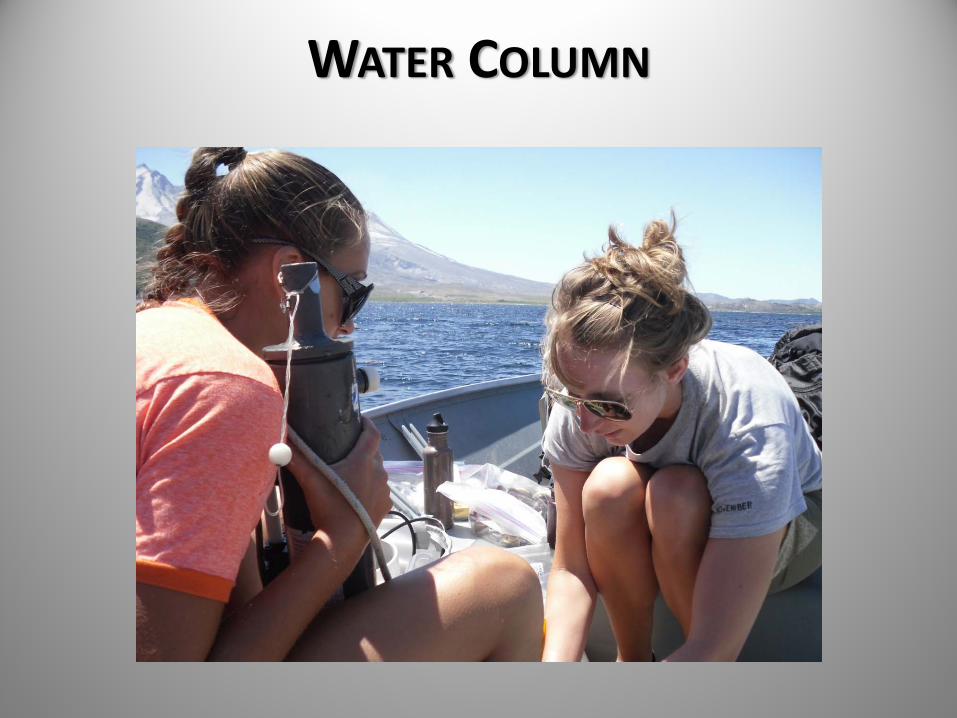
WATER COLUMN

METHODS
• Water sampling – Secchi disk, water transparency.
– Hydrolab Quanta, temperature, DO, specific conductivity, and pH at 2m depth intervals.
– Nutrients, chlorophyll, phytoplankton, zooplankton, and alkalinity were collected at depths of 5, 15, and 25 meters
– Nutrient samples• filtered for dissolved nutrients
• unfiltered for total nutrient concentrations.

METHODS
• Nutrient Analysis– Stored on ice for transport, frozen prior to analysis
– Westco SmartChem 200 Discrete Analyzer
– Filtered samples:• Ammonia SM 4500 G
• Nitrate EPA 353.2
• Orthophosphorus SM 4500 P‐E
– Digestion of unfiltered samples SM 4500 P‐J • Nitrate & orthophosphorus above methods
http://em‐1.stanford.edu/Schedule/DAnalyzer/Index.htm

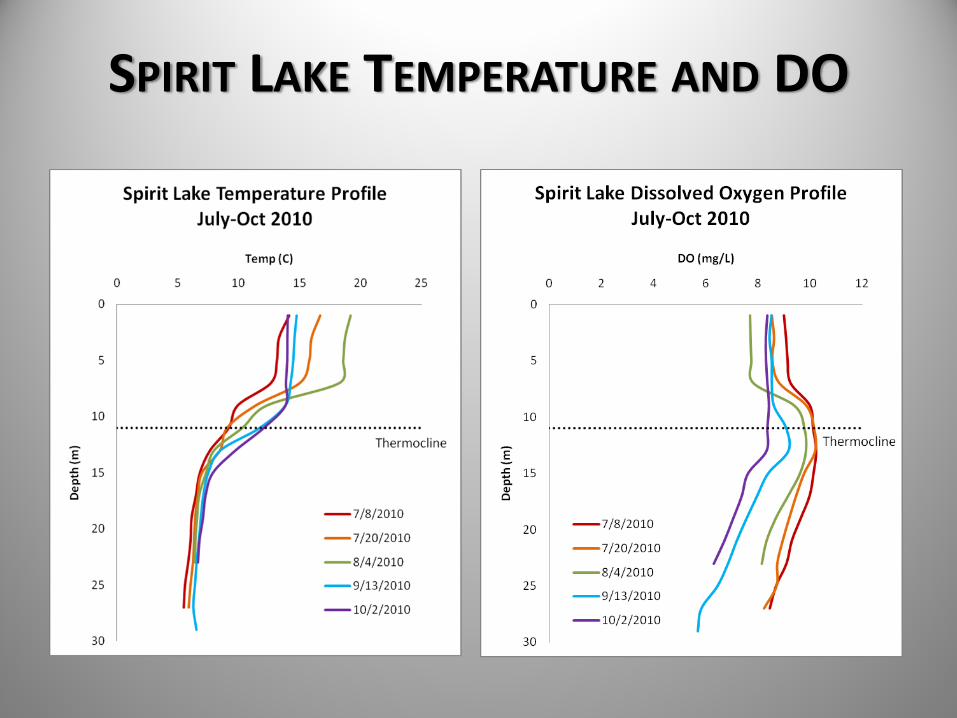
SPIRIT LAKE TEMPERATURE AND DO


SPIRIT LAKE AMMONIA FINAL CONCENTRATION
Date 7/20 8/4 8/17 10/2 Average
Epilimnion 0.1891 0.1548 0.1843 0.2063 0.1836
Hypolimnion 0.2079 0.1858 0.1969 0.2231 0.2034
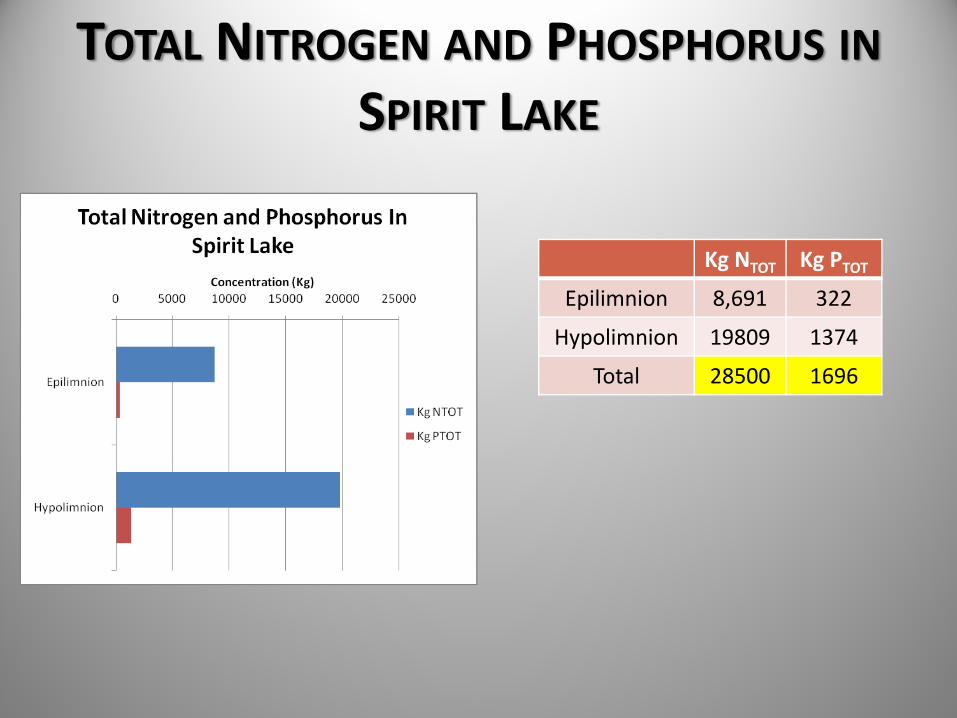
TOTAL NITROGEN AND PHOSPHORUS INSPIRIT LAKE
Kg NTOT Kg PTOTEpilimnion 8,691 322
Hypolimnion 19809 1374
Total 28500 1696

WATER COLUMN FUTURE STUDIES
• Nutrient Collection– Continue sampling into winter season
– Apply N & P to the plankton data
– Apply log mat
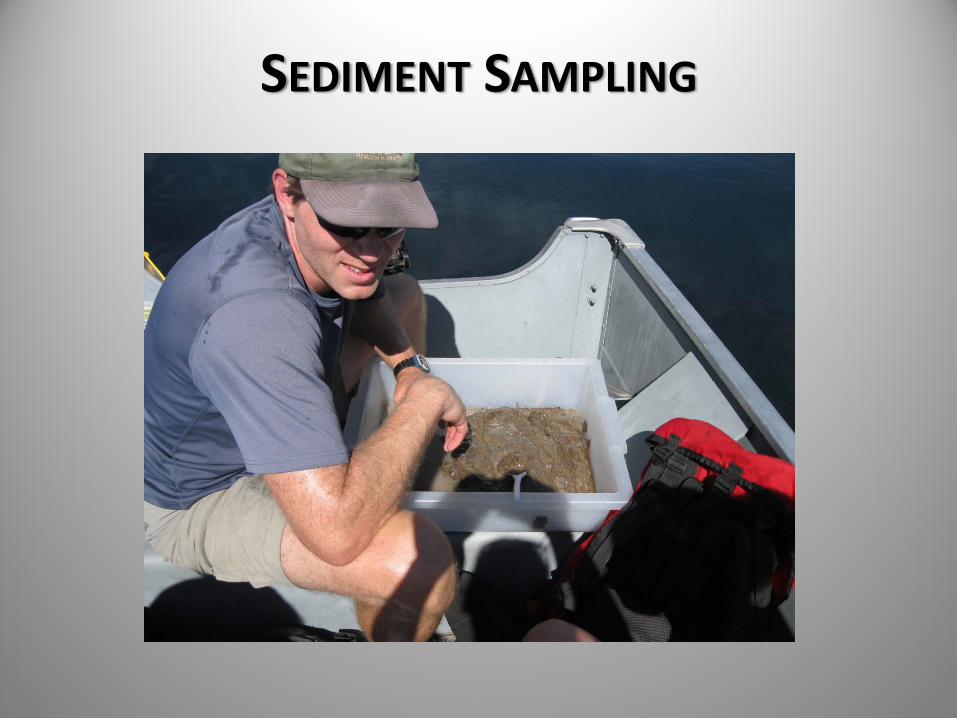
SEDIMENT SAMPLING

METHODSSediment Trap• Two traps were constructed out of PVC pipe 40 cm in length and 15 cm diameter.
• Funnels were adhered to the bottom of the pipes and 60 mL Nalgene bottles were attached to the funnels for collection of sediment.
• Traps were positioned three meters above the lake floor with buoys suspended ten feet below the lake surface to avoid log mat damage.
• Traps were placed in the East and West arms of Spirit Lake over a ten week period
Dredge• A 6” X 6” Petersons Dredge was used to collect surface sediment samples.
• Dredge collects about the top ten cm of sediment per grab
• Fourteen samples were collected
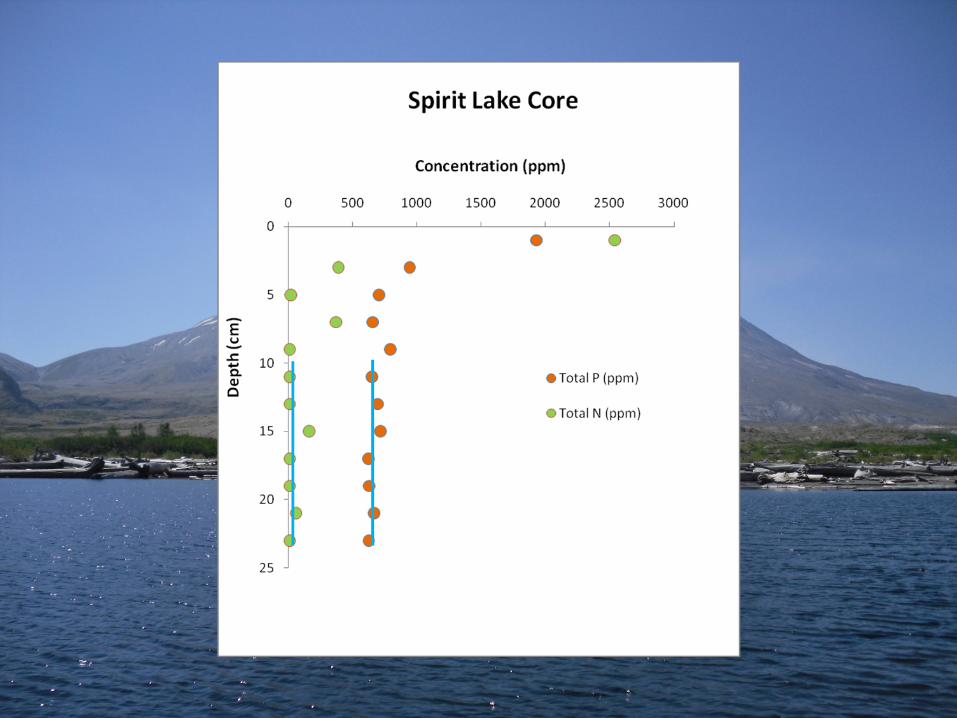
Sediment Core• A Wildco Instruments gravity corer was used to collect a short sediment core
• The core was cut into 2 cm increments

Total Nutrient in SedimentsAvg N in lake (%) Total Area (m2) Sediment Depth Grams dry sed/cm3 Grams N Total Kg N Total Kg N/year
0.0640 10331457 0.10 0.90 595290457 595290 19843
Avg P in lake mg/kg Total Area (m2) Sediment Depth Grams dry sed/cm3 Grams P Total Kg P Total Kg P/year
0.0682 10331457 0.10 0.90 633820866 633821 21127
0.0025 10331457 0.10 0.90 22921843 22922 764

About 625,000 Kg of Carbon
is deposited into the sediment per year
Avg C in Lake (%)
Total Area (m2)
Depth of Sediment (m)
Grams dry sed/cm3
Grams C Total Kg C Total Kg C/year
2.018 10331457 0.10 0.90 18761831674 18761832 625394

• Plant data collected by PSU using sonar
• Ground truthing done by Bellarmine High School
• Plant height data converted to plant mass
• Plant mass converted to nutrient biomass
Total Nutrients in Plants in Photic Zone
Nitrogen
Avg Height (m) Area (m2) Avg Plant N (mg/m3) Total N in Plants (mg) Total N (kg)
0.2377 4205794 2446 24456000012 2446
Phosphorus
Avg Height (m) Area (m2) Avg Plant P (mg/m3) Total P in Plants (mg) Total P (kg)
0.2377 4205794 364 363807981 364

SEDIMENT FUTURE WORK
• More sampling locations in the East Arm for dredge samples
• More sediment deposition data by adding more traps

INSECT SAMPLING

METHODS
• Emergence Collection– Amphibious Emergence Trap II, BugDorm
– 1 to 4 m of water, southeast corner of lake
– Insecticidal kill strip, drop into 500 mL bottles
– Stored on ice for transport, stored in freezer
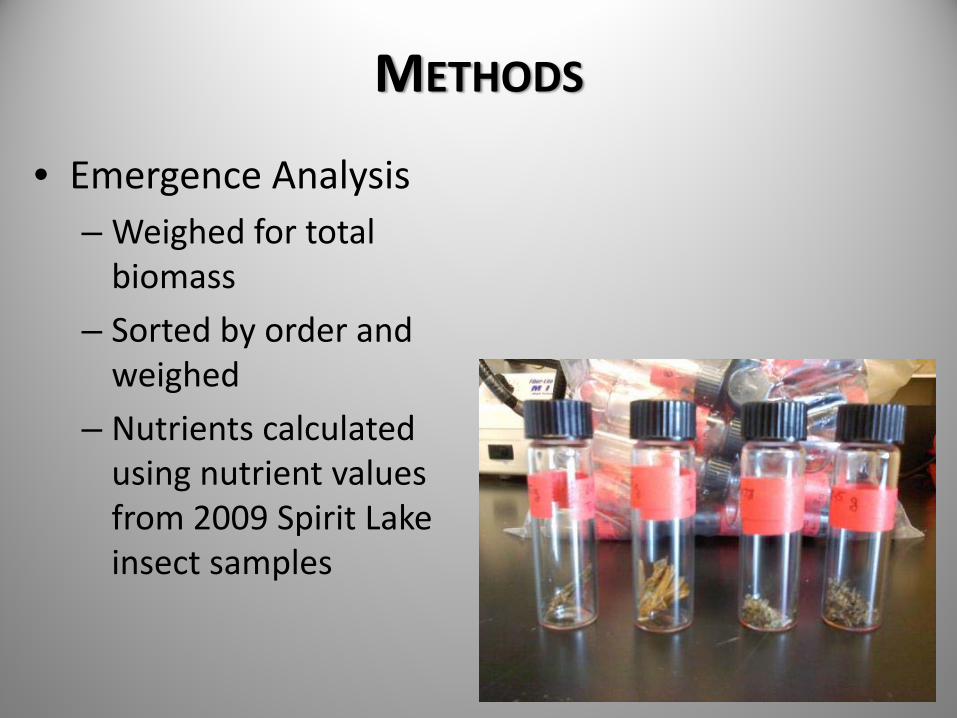
METHODS
• Emergence Analysis– Weighed for total biomass
– Sorted by order and weighed
– Nutrients calculated using nutrient values from 2009 Spirit Lake insect samples

METHODS
• Deposition Collection– Homemade traps
– Filtered, stored in 70% ethanol
• Deposition Analysis– Samples filtered, dried, and weighed
– Nutrients not calculated due to very small amount collected

0
20
40
60
80
100
120
Average kg/day
Sampling Date
Coleoptera
Diptera
Emphemeroptera
Hemiptera
Hymenoptera
Lepidoptera
Odonata
Tricoptera
AVERAGE KILOGRAMS OF INSECTS EMERGING
FROM SPIRIT LAKE DAILY BY ORDERFROM JULY TO SEPTEMBER, 2010

0%
10%
20%
30%
40%
50%
60%
70%
80%
90%
100%
% In
sect Emergence (M
ass)
Sampling Date
Tricoptera
Odonata
Lepidoptera
Hymenoptera
Hemiptera
Ephemeroptera
Diptera
Coleoptera
PERCENT BY ORDER OF INSECT EMERGENCE
TOTAL MASSFROM JULY TO SEPTEMBER 2010

0
10
20
30
40
Average kg N/day
0.00.51.01.52.02.53.03.5
Average kg P/da
y
Sampling Date
AVERAGE NUTRIENTS LEAVING SPIRIT LAKE THROUGH
INSECT EMERGENCE DAILY
Total N/year: 1,607 Kg
Total P/year: 139 Kg

INSECT FUTURE STUDIES
• Insect Emergence and Deposition– Test assumption that insects only leave lake from photic zone
– Study deposition of insects through fish gut contents
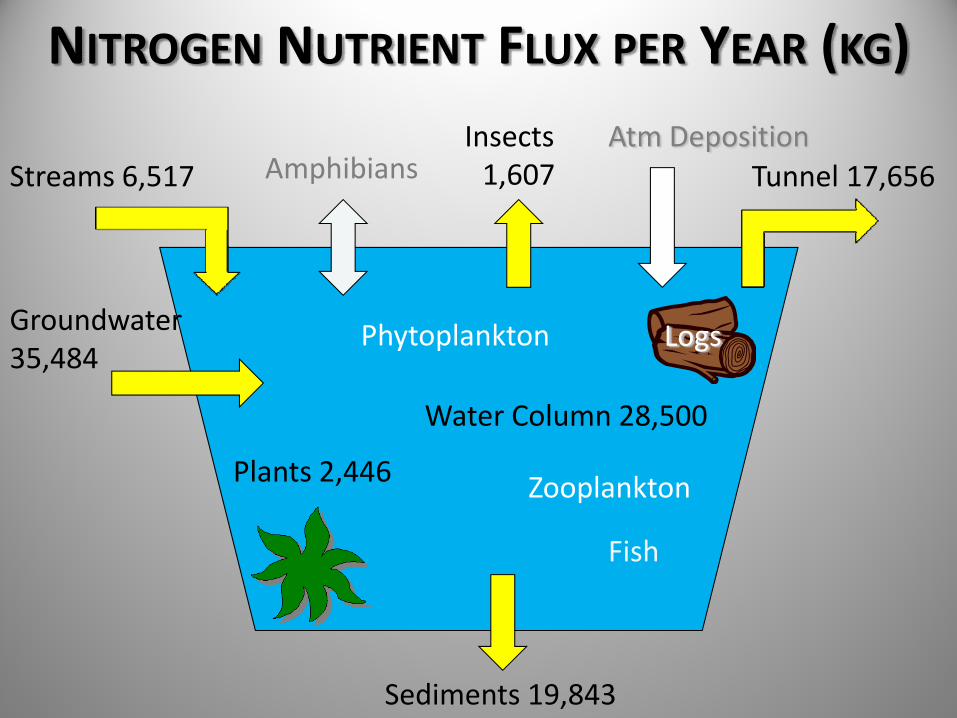
Streams 6,517
Groundwater 35,484
Tunnel 17,656
Plants 2,446
Phytoplankton
Zooplankton
Insects 1,607
Sediments 19,843
Water Column 28,500
Amphibians
Fish
NITROGEN NUTRIENT FLUX PER YEAR (KG)Atm Deposition
Logs

Streams 3,060
Groundwater 4,936
Tunnel 654
Plants 364
Phytoplankton
Zooplankton
Insects 139
Sediments 764/21,127
Water Column 1,696
Amphibians
Fish
PHOSPHORUS NUTRIENT FLUX PER YEAR (KG)Atm Deposition
Logs


THANK YOU TO JACOB ASPLUND, JESSICA ASPLUND, LIA WETZSTEIN, HEATHER JENNINGS, NICOLE BUTHER, BRIDGET MASON, MINDY ROBERTS,
TIFFANY WAX AND JIM GAWEL
THANK YOU FOR LISTENING!