constructing dynamic treatment regimes & star*d s.a. murphy icsa june 2008
Post on 19-Dec-2015
213 views
TRANSCRIPT

Constructing Dynamic Treatment Regimes &
STAR*D
S.A. Murphy
ICSA
June 2008

2
Collaborators
• Lacey Gunter
• A. John Rush
• Bibhas Chakraborty
3
Outline
• Dynamic treatment regimes
• Constructing a dynamic treatment regime
• Non-regularity & an adaptive solution
• Example/Simulation Results.

4
Dynamic treatment regimes are individually tailored treatments, with treatment type and dosage changing according to patient outcomes. Operationalize clinical practice.
k Stages for one individual
Observation available at jth stage
Action at jth stage (usually a treatment)

5
Goal: Construct decision rules that input information available at each stage and output a recommended decision; these decision rules should lead to a maximal mean Y where Y is a function of
The dynamic treatment regime is the sequence of two decision rules:
k=2 Stages

6
Data for Constructing the Dynamic Treatment Regime:
Subject data from sequential, multiple assignment, randomized trials. At each stage subjects are randomized among alternative options.
Aj is a randomized action with known randomization probability.
binary actions with P[Aj=1]=P[Aj=-1]=.5

7
Two Levels of STAR*D (Tx-resistant Depression)
Stage 1 Stage 2Preference Treatment Intermediate Treatment
Action Outcome Action
Mirtazapine
Switch R Remission Continue on Current Tx
Nortriptyline
TranylcypromineLithium
Augment R Non-remission R
ThyroidMirtazapine + Venlafaxine

8
Regression-based methods for constructing decision rules
•Q-Learning (Watkins, 1989) (a popular method from computer science)
•Optimal nested structural mean model (Murphy, 2003; Robins, 2004; I like the term A-learning)
• When using linear models, the first method is an inefficient version of the second method when each stages’ covariates include the prior stages’ covariates and the actions are centered to have conditional mean zero.

9
There is a regression for each stage.
A Simple Version of Q-Learning –
• Stage 2 regression: Regress Y on to obtain
• Stage 1 regression: Regress on to obtain

10
for patients entering stage 2:
• is the estimated probability of remission in stage 2 as a function of patient history (includes past treatment and variables affected by stage 1 treatment).
• is the estimated probability of remission assuming the “best” treatment is provided at stage 2 (note max in formula).
• is the dependent variable in the stage 1 regression for patients moving to stage 2

11
A Simple Version of Q-Learning –
• Stage 2 regression, (using Y as dependent variable) yields
• Stage 1 regression, (using as dependent variable) yields

12
Decision Rules:

13
Non-regularity

14
Non-regularity
15
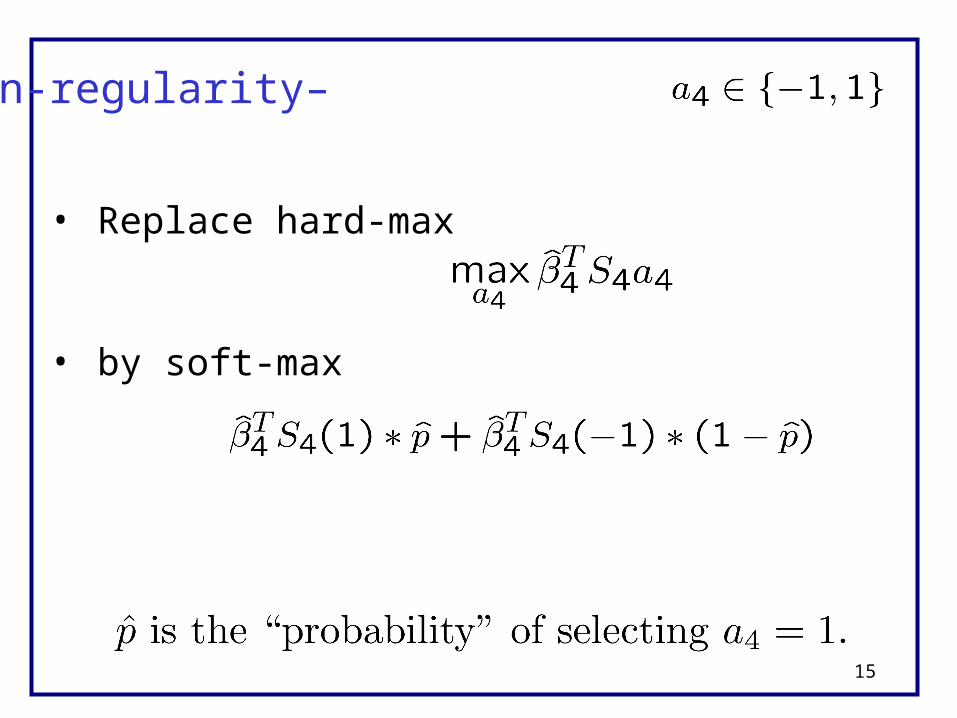
Non-regularity–
• Replace hard-max
• by soft-max

16
A Soft-Max Solution

17
Distributions for Soft-Max

18
To conduct inference concerning β1
• Set
• Stage 1 regression: Use least squares with outcome,
and covariates to obtain

19
Interpretation of λ
Future treatments are assigned with equal probability, λ=0
Optimal future treatment is assigned, λ=∞
Future treatment =1 is assigned with probability
Estimator of Stage 1 Treatment Effect when

20
Proposal

21
Proposal

22
STAR*D
• Regression at stage 1:
• S1'=(1, X1)
•S1= ((1-Aug), Aug, Aug*Qids)
•X1 is a vector of variables available at or prior to stage 1, Aug is 1 if patient preference is augment and 0 otherwise
• We are interested in the β1 coefficients as these are used to form the decision rule at stage 1.

23
STAR*D
Decision Rule at stage 1:
•If patient prefers a Switch then
•if offer Mirtazapine, otherwise offer Nortriptyline.
•If patient prefers an Augment then
•if offer Lithium, otherwise offer Thyroid Hormone.

24
Stage 1 Augment Treatments
bbb

25
Decision Rules from Soft-Max Q-Learning Y=1 if remission or sufficient response to move to follow-up, Y=0
otherwise Stage 1 Stage 2
Switch MIRT = NTP (225) QIDS < 11 LI = THY (45) Augment QIDS ≥ 11 LI < THY (88)
TCP<VEN+MIRT(104)
= means not significant in two sided test at .05 level
< means significant in two sided test at .05 level

26
Simulation

27
P[β2TS2=0]=1 β1(∞)=β1(0)=0
Test Statistic Nominal Type 1 based on Error=.05 .045
.039
.025*
(1)Nonregularity results in low Type 1 error
(2) Adaptation due to use of is useful.

28
P[β2TS2=0]=1 β1(∞)=β1(0)=.1
Test Statistic Power based on
.15
.13
.09
(1)The low Type 1 error rate translates into low power

29
Test Statistic Power based on
.05
.11
.12
(1) Averaging over the future is not a panacea
P[β2TS2=0]=0 β1(∞)=.125, β1(0)=0

30
Test Statistic Type 1 Error=.05 based on
.57
.16
.05
(1) Insufficient adaptation in “small” samples.
P[β2TS2=0]=.25 β1(∞)=0, β1(0)=-.25

31
Discussion
• We replace the test statistic based on an estimator of a non-regular parameter by an adaptive test statistic.
• This is work in progress—limited theoretical results are available.
• The use of the bootstrap does not allow to increase too fast.

32
Discussion
• Robins (2004) proposes several conservative confidence intervals for β1.
• Ideally to decide if the stage 1 treatments are equivalent, we would evaluate whether the choice of stage 1 treatment influences the mean outcome resulting from the use of the dynamic treatment regime. We did not do this here.
• Constructing “evidence-based” regimes is of great interest in clinical research and there is much to be done by statisticians.

33
This seminar can be found at:http://www.stat.lsa.umich.edu/~samurphy/
seminars/ICSA0708.ppt
Email me with questions or if you would like a copy!

34
STAR*D
• Regression at stage 2: α2TS2' + β2S2A2
• S2' =(1,X2, (1-Aug)*A1, Aug*A1, Aug*A1*Qids),
•(X2 is a vector of variables available at or prior to stage 2)
• S1 = 1
• Decision rule: Choose TCP if , otherwise offer Mirtazapine + Venlafaxine XR

35
Switch -.11(.07) -1.6
Augment .47(.25) 1.9
Augment*QIDS2 -.04(.02) -2.3
^̄(s:e:) z statistic
Stage 1 Coefficients
^̄11 =^̄12 =
^̄13 =