construction and maintenance looking forward · construction and maintenance looking forward...
TRANSCRIPT

Construction and Maintenance Looking ForwardBritish ColumbiaAs the new forecast scenario begins in 2016, construction in British Columbia will start on a growth path that will carry employment to new record high levels in 2018 and 2019. These gains will end a period of high, but mostly unchanging employment that began after 2008.
New infrastructure and resource-related projects lead investment. The coming expansion is concentrated in non-residential construction. Housing-related construction is projected to remain largely unchanged, as housing starts decline in 2017 and 2019 while renovation construction advances slowly across the scenario period.
From 2019 to 2025, activity begins a slow decline across all construction markets as major projects are completed. At the peak in 2018, total employment is up by 17,200 jobs, but then declines, leaving a small gain by the end of the scenario period.
Labour requirements for the major non-residential projects will create market challenges from 2016 to 2019 for specialized trades. Conditions ease in 2020 and 2021 as projects end, and from 2022 to 2025, markets are largely balanced. There are few market challenges in residential construction across the scenario, except for a brief period of slower growth and employment declines from 2020 to 2022. There is the risk of losing skilled workers to other markets during this period.
These market-driven conditions include important periods of recruiting challenges. Even bigger issues are tied to rising retirements and a declining number of younger residents entering construction across the 2016–2025 scenario period.
HIGHLIGHTSFollowing a period of slow growth, British Columbia’s construction employment is expected to rise over the medium term as proposed new infrastructure and resource development projects come on stream.
● From 2011 to 2015: – Housing starts were sustained at high or rising levels. – Non-residential building was more volatile, with
engineering projects adding work in 2012 and 2013. – These conditions left markets mostly balanced with
unemployment below the long-term average, but above the historical low levels of 2007 and 2008.
2016–2025Key Highlights
BUILDFORCE’S LMI SYSTEMBuildForce Canada uses a scenario-based forecasting system to assess future labour market conditions for both residential and non-residential construction. This LMI system tracks measures for 34 trades and occupations. BuildForce consults with industry, including owners, contractors and labour groups, to validate the scenario assumptions and construction project lists, and seeks input from government on related analysis.

● From 2016 to 2018, rising immigration combines with the resource-related engineering projects to increase construction employment.
● Rising labour requirements will require employers to attract workers from other industries and provinces – unemployment is already too low to meet expanding needs.
● By 2019, immigration and investment gains have run their course, and activity falls later in the scenario period.
● Requirements related to retirements create job opportunities in the industry across the full 2016–2025 scenario.
NON-RESIDENTIAL HIGHLIGHTS (2016 TO 2025)Over the medium term, as large major projects commence, recruiting the needed workforce to meet project demands will challenge overall market conditions. In addition, demographic trends limit the number of younger people entering the workforce, and ongoing retirements add to market challenges.
Labour requirementsConstruction employment is expected to rise to a new record level driven by proposed large major resource and infrastructure projects.
Across the scenario period:
● From 2016 to 2019, all non-residential employment grows by 16,800 jobs, but 80 percent of the jobs are added in the big engineering projects.
– Projects include LNG (liquefied natural gas) plants, pipelines, electricity generation and transmission, mining and transportation systems.
● Hiring is intensive in 2016 and 2017, with anticipated market pressures for heavy-equipment and crane operators, mechanics, ironworkers, truck drivers and welders.
● Most other non-residential trades face market challenges as activity increases over the medium term, peaking in 2019.
● Recruiting may be complicated by the demand for specialized skills and experience – often in remote locations.
● After 2019, more than 4,100 jobs are lost as the projects wind down, but jobs are sustained in maintenance work and other non-residential construction markets so that total non-residential employment is 12,600 jobs higher at the end of the scenario period.
The available workforceConstruction employment in British Columbia is at the start of a pronounced construction cycle, driven by major projects. Proposed projects will create recruiting challenges over the medium term requiring significant intra- and interprovincial mobility to meet rising demand requirements. In addition, replacement demands (retirements) across the scenario period add to recruiting challenges.
The BuildForce LMI system tracks supply and accounts for the change in the available labour force, including retirements, new entrants1 and net in-mobility2. Retirements measure permanent losses to the workforce, which might be offset by the entry of first-time workers aged 30 and younger from the local population.
Market demands set out above are added to replacement (retirement) demands for the non-residential supply side.
From 2016 to 2025:
● The labour force rises by 13,000 workers. ● An estimated 19,000 workers are lost to retirement
and must be replaced. ● An estimated 17,000 new entrants from the province’s
younger population are drawn into the workforce. ● To meet overall labour requirements, the industry will need
to recruit another 15,000 workers from other markets.
Labour requirements are not distributed evenly across the years or regions. The largest changes are concentrated from 2016 to 2018 and the most intense recruiting may focus on specialized crews in remote locations. In 2020, the projects wind down and a portion of this workforce leaves. Figure 1 tracks the annual changes across the scenario period.
1 New entrants are measured by applying the traditional proportion of the provincial workforce that enters the construction industry. The projected estimate across the scenario period assumes that the construction industry is able to recruit this group in competition with other industries.
2 In-mobility refers to the arrival of workers from outside the local construction industry.
2 BRITISH COLUMBIA – CONSTRUCTION AND MAINTENANCE LOOKING FORWARD

Non-residential rankings, risks and mobilityBuildForce assesses market conditions for 34 construction trades and occupations using a ranking system that combines measures of the change in employment, unemployment, net in-mobility and adjustments based on industry input. The rankings are adapted to specific non-residential market conditions unique to British Columbia based on current and proposed construction activity. In addition, assumptions on provincial economic and population growth, new entrants to the labour force and migration patterns (interprovincial and international) are built into the forecast scenario and included in the ranking assessment.
The rankings for some trades working in the non-residential sector are suppressed due to the small size of the workforce (<100 workers) and limited statistical reliability when assessing labour market conditions at the sector level. Trades may also be excluded because they typically do not work in the sector being assessed (e.g., home building and renovation managers in non-residential). For British Columbia, non-residential rankings are reported for 32 trades and occupations.
Table 1 (page 4) provides rankings for the non-residential sector. Market conditions for trades and occupations concentrated in industrial and engineer projects are more immediately affected by the rise in non-residential investment over the medium term. Demands in commercial and institutional building construction rise, but at a moderate pace.
Figure 1: Annual estimated changes in non-residential supply, British Columbia
ForecastTotal change in labour force =
New entrants + Net in-mobility – Retirements
20252024202320222021202020192018201720162015201420132012-6000-4000-2000
02000400060008000
1000012000
Source: BuildForce Canada
Net in-mobility New entrantsRetirements Change in labour force
Num
ber o
f wor
kers
-6,000
-4,000
-2,000
0
2,000
4,000
6,000
8,000
10,000
12,000
Forecast Total change in labour force = New entrants + Net in-mobility – Retirements
20252024202320222021202020192018201720162015201420132012-6000-4000-2000
02000400060008000
1000012000
Source: BuildForce Canada
Net in-mobility New entrantsRetirements Change in labour force
Number
of worke
rs
-6,000
-4,000
-2,000
0
2,000
4,000
6,000
8,000
10,000
12,000
2015–2024 Key Highlights 3

Market rankings
1Workers meeting employer qualifications are available in local markets to meet an increase in demand at the current offered rate of compensation and other current working conditions. Excess supply is apparent and there is a risk of losing workers to other markets.
2 Workers meeting employer qualifications are available in local markets to meet an increase in demand at the current offered rate of compensation and other working conditions.
3The availability of workers meeting employer qualifications in the local market may be limited by large projects, plant shutdowns or other short-term increases in demand. Employers may need to compete to attract needed workers. Established patterns of recruiting and mobility are sufficient to meet job requirements.
4Workers meeting employer qualifications are generally not available in local markets to meet any increase. Employers will need to compete to attract additional workers. Recruiting and mobility may extend beyond traditional sources and practices.
5Needed workers meeting employer qualifications are not available in local markets to meet current demand so that projects or production may be delayed or deferred. There is excess demand, competition is intense and recruiting reaches to remote markets.
N/A The labour market assessment for some trades is limited by the small size of the workforce (<100 employed). In consultation with the provincial LMI committee, the rank is suppressed because of limited statistical reliability.
Table 1: Rankings for trades and occupations in non-residential construction, British Columbia
TRADES AND OCCUPATIONS 2015 2016 2017 2018 2019 2020 2021 2022 2023 2024 2025
Boilermakers 3 3 4 4 3 3 3 3 3 3 3Bricklayers 3 3 3 3 3 3 3 3 3 3 3Carpenters 3 4 3 3 3 3 3 3 3 3 3
Concrete finishers 3 4 3 3 3 3 3 3 3 3 3
Construction estimators 3 4 3 4 4 3 3 3 3 3 3
Construction managers 4 4 4 4 4 3 2 3 3 3 3
Construction millwrights and industrial mechanics 3 3 4 4 3 3 3 3 3 3 3
Contractors and supervisors 3 4 4 4 3 2 2 3 3 3 3
Crane operators 4 3 3 4 3 3 3 3 3 3 3
Drillers and blasters 4 5 3 4 4 3 3 3 3 3 3Electrical power line and cable workers 3 3 4 4 4 3 3 3 3 3 3
Electricians 3 4 4 4 3 2 3 3 3 3 3Elevator constructors and mechanics 3 3 3 4 4 3 3 3 3 3 3
Floor covering installers 3 3 3 4 4 3 3 3 3 3 3Gasfitters 3 4 4 4 3 3 3 3 3 3 3Glaziers 3 3 3 4 3 3 3 3 3 3 3
continued on next page
4 BRITISH COLUMBIA – CONSTRUCTION AND MAINTENANCE LOOKING FORWARD
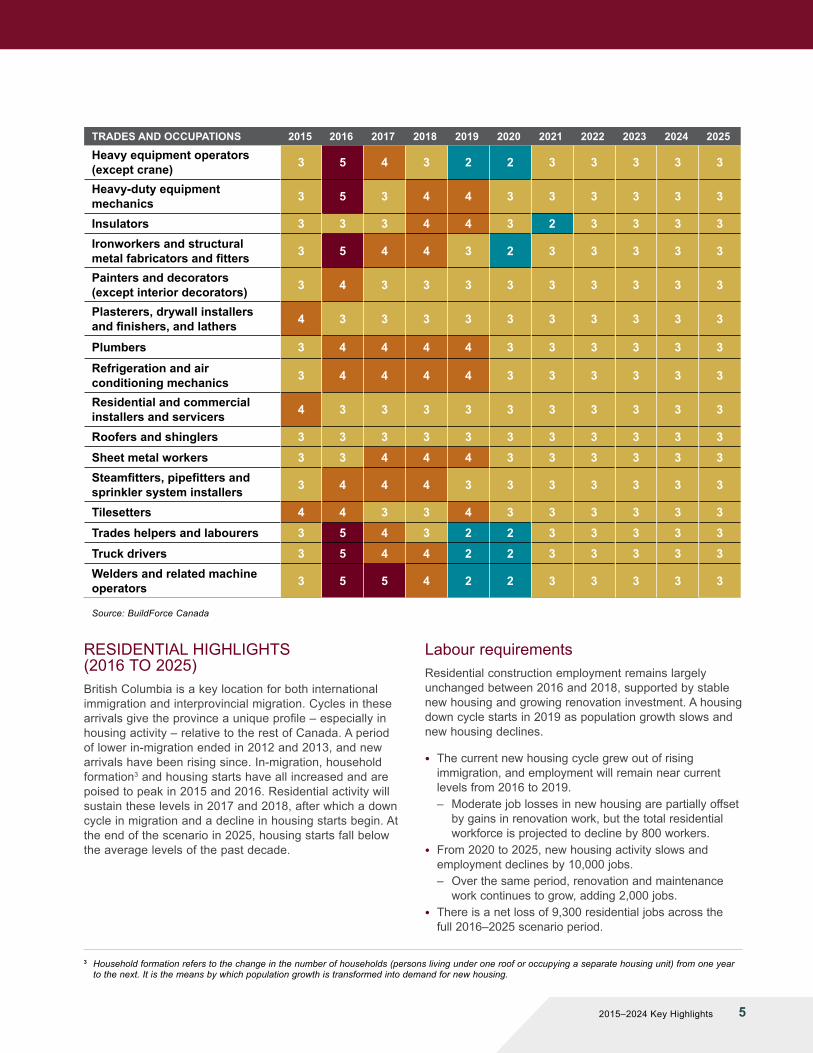
RESIDENTIAL HIGHLIGHTS (2016 TO 2025)British Columbia is a key location for both international immigration and interprovincial migration. Cycles in these arrivals give the province a unique profile – especially in housing activity – relative to the rest of Canada. A period of lower in-migration ended in 2012 and 2013, and new arrivals have been rising since. In-migration, household formation3 and housing starts have all increased and are poised to peak in 2015 and 2016. Residential activity will sustain these levels in 2017 and 2018, after which a down cycle in migration and a decline in housing starts begin. At the end of the scenario in 2025, housing starts fall below the average levels of the past decade.
Labour requirementsResidential construction employment remains largely unchanged between 2016 and 2018, supported by stable new housing and growing renovation investment. A housing down cycle starts in 2019 as population growth slows and new housing declines.
● The current new housing cycle grew out of rising immigration, and employment will remain near current levels from 2016 to 2019. – Moderate job losses in new housing are partially offset
by gains in renovation work, but the total residential workforce is projected to decline by 800 workers.
● From 2020 to 2025, new housing activity slows and employment declines by 10,000 jobs. – Over the same period, renovation and maintenance
work continues to grow, adding 2,000 jobs. ● There is a net loss of 9,300 residential jobs across the
full 2016‒2025 scenario period.
TRADES AND OCCUPATIONS 2015 2016 2017 2018 2019 2020 2021 2022 2023 2024 2025
Heavy equipment operators (except crane) 3 5 4 3 2 2 3 3 3 3 3
Heavy-duty equipment mechanics 3 5 3 4 4 3 3 3 3 3 3
Insulators 3 3 3 4 4 3 2 3 3 3 3Ironworkers and structural metal fabricators and fitters 3 5 4 4 3 2 3 3 3 3 3
Painters and decorators (except interior decorators) 3 4 3 3 3 3 3 3 3 3 3
Plasterers, drywall installers and finishers, and lathers 4 3 3 3 3 3 3 3 3 3 3
Plumbers 3 4 4 4 4 3 3 3 3 3 3
Refrigeration and air conditioning mechanics 3 4 4 4 4 3 3 3 3 3 3
Residential and commercial installers and servicers 4 3 3 3 3 3 3 3 3 3 3
Roofers and shinglers 3 3 3 3 3 3 3 3 3 3 3Sheet metal workers 3 3 4 4 4 3 3 3 3 3 3Steamfitters, pipefitters and sprinkler system installers 3 4 4 4 3 3 3 3 3 3 3
Tilesetters 4 4 3 3 4 3 3 3 3 3 3Trades helpers and labourers 3 5 4 3 2 2 3 3 3 3 3Truck drivers 3 5 4 4 2 2 3 3 3 3 3Welders and related machine operators 3 5 5 4 2 2 3 3 3 3 3
Source: BuildForce Canada
3 Household formation refers to the change in the number of households (persons living under one roof or occupying a separate housing unit) from one year to the next. It is the means by which population growth is transformed into demand for new housing.
2015–2024 Key Highlights 5

The available workforceDeclining market demands offer a misleading signal to job seekers and new entrants in the workforce. Recruiting must remain a priority for residential construction employers who will need to replace a growing number of retirements.
For the residential market:
● The labour force drops by 10,000 workers across the scenario period, following the long-term loss across the cycle.
● Over the same period, replacement demands (retirements) total an estimated 20,000 workers.
● An estimated 16,000 new entrants offset retirement demands.
● On balance, 6,000 workers are expected to leave the residential workforce as overall activity slows, but much will depend on successful recruiting of the province’s youth.
Figure 2 sets out the annual pattern of these changes, showing in-mobility from other markets as new housing increases to 2018. Demands then slow as new activity declines, and in-mobility increases again later in the period as new housing resumes moderate growth. Estimated annual retirements represent a major challenge for the coming decade.
Residential rankings, risks and mobilityThe rankings for some trades working in the residential sector are suppressed due to the small size of the workforce (<100 workers) and limited statistical reliability when assessing labour market conditions at the sector level. Trades may also be excluded because they typically do not work in the sector being assessed (e.g., boilermakers and millwrights in residential construction). For British Columbia, residential rankings are reported for 27 trades and occupations.
Rankings reflect the moderate changes in residential labour market conditions. Markets are in balance with a rank of 3 across most of the scenario period, but retreat to a 2 from 2020 to 2022 for most trades and occupations as new activity slows.
Balanced markets require a limited and normal level of workforce mobility. Weaker housing markets, with a rank of 2, face a risk that workers may leave for other markets and provinces may attract B.C. workers. Even during slower growth period, retirements and the risk of losing key specialized skills and experience remain a key industry challenge.
Figure 2: Annual estimated changes in residential supply, British Columbia
ForecastTotal change in labour force =
New entrants + Net in-mobility – Retirements
20252024202320222021202020192018201720162015201420132012-8000
-6000
-4000
-2000
0
2000
4000
6000
-8,000
-6,000
-4,000
-2,000
0
2,000
4,000
6,000
Source: BuildForce Canada
Net in-mobility New entrantsRetirements Change in labour force
Num
ber o
f wor
kers
6 BRITISH COLUMBIA – CONSTRUCTION AND MAINTENANCE LOOKING FORWARD
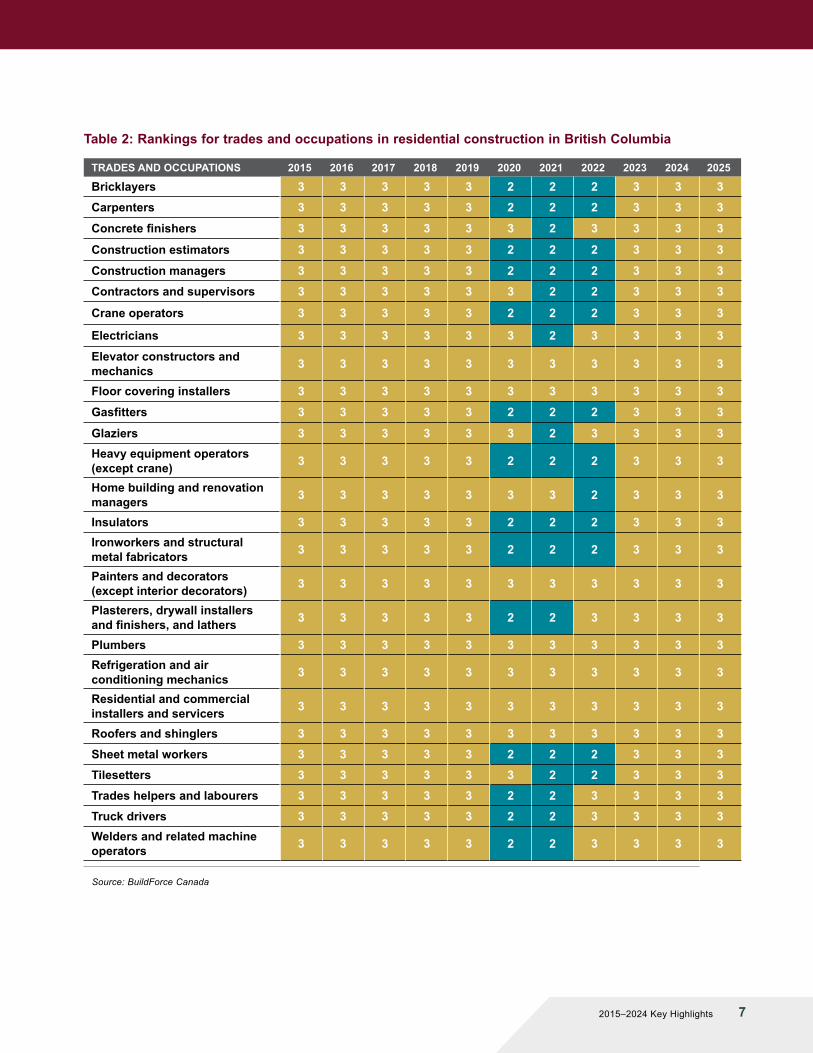
Table 2: Rankings for trades and occupations in residential construction in British Columbia
TRADES AND OCCUPATIONS 2015 2016 2017 2018 2019 2020 2021 2022 2023 2024 2025
Bricklayers 3 3 3 3 3 2 2 2 3 3 3Carpenters 3 3 3 3 3 2 2 2 3 3 3
Concrete finishers 3 3 3 3 3 3 2 3 3 3 3
Construction estimators 3 3 3 3 3 2 2 2 3 3 3
Construction managers 3 3 3 3 3 2 2 2 3 3 3Contractors and supervisors 3 3 3 3 3 3 2 2 3 3 3
Crane operators 3 3 3 3 3 2 2 2 3 3 3
Electricians 3 3 3 3 3 3 2 3 3 3 3
Elevator constructors and mechanics 3 3 3 3 3 3 3 3 3 3 3
Floor covering installers 3 3 3 3 3 3 3 3 3 3 3
Gasfitters 3 3 3 3 3 2 2 2 3 3 3
Glaziers 3 3 3 3 3 3 2 3 3 3 3Heavy equipment operators (except crane) 3 3 3 3 3 2 2 2 3 3 3
Home building and renovation managers 3 3 3 3 3 3 3 2 3 3 3
Insulators 3 3 3 3 3 2 2 2 3 3 3Ironworkers and structural metal fabricators 3 3 3 3 3 2 2 2 3 3 3
Painters and decorators (except interior decorators) 3 3 3 3 3 3 3 3 3 3 3
Plasterers, drywall installers and finishers, and lathers 3 3 3 3 3 2 2 3 3 3 3
Plumbers 3 3 3 3 3 3 3 3 3 3 3Refrigeration and air conditioning mechanics 3 3 3 3 3 3 3 3 3 3 3
Residential and commercial installers and servicers 3 3 3 3 3 3 3 3 3 3 3
Roofers and shinglers 3 3 3 3 3 3 3 3 3 3 3Sheet metal workers 3 3 3 3 3 2 2 2 3 3 3Tilesetters 3 3 3 3 3 3 2 2 3 3 3Trades helpers and labourers 3 3 3 3 3 2 2 3 3 3 3Truck drivers 3 3 3 3 3 2 2 3 3 3 3Welders and related machine operators 3 3 3 3 3 2 2 3 3 3 3
Source: BuildForce Canada
2015–2024 Key Highlights 7

Timely construction forecast data is available online at www.constructionforecasts.ca. Create customized reports on a broad range of selected categories within sector, trade or province covering up to 10 years.
For more information, contact:
BuildForce Canada Phone: 613-569-5552 [email protected]
January 2016
Funded by the Government of Canada’s Sectoral Initiatives Program
The opinions and interpretations in this publication are those of the author and do not necessarily reflect those of the Government of Canada.
CONCLUSIONS AND IMPLICATIONSEmployment prospects in British Columbia’s construction industry are good. In particular, several major resource-related projects are expected to start over the 2016‒2019 period, providing employment opportunities. As known projects end after 2019, employment declines from peak levels, but overall employment at the end of the scenario period remains above current levels.
Residential growth is limited, as new housing starts are running at a high but stable level from 2016 to 2018. The current immigration cycle is reaching a peak that will sustain new household formations until 2019, but a moderate decline in new arrivals will prompt a decline in new activity from 2020 to 2025.
Renovation and maintenance work will provide a steady increase in residential jobs across the coming decade. A key recruiting challenge is the steady rise in retirements as the workforce ages.
These trends will create challenges in the first half of the coming decade. Employers will need to attract new workers from other industries or provinces to meet rising demands.
The 2016–2025 Construction and Maintenance Looking Forward scenario anticipates continuing labour market challenges:
● Slower population growth and the shifting age profile of the workforce will create specific challenges for employers. – Recruiting young people into the industry will bring
construction into competition with other industries drawing from the same, limited population.
● Cyclical changes in employment may require continuing mobility in the workforce across the residential and non-residential sectors and among the provinces.
● Local demographics restrict labour force growth, leaving in-mobility key to recruiting.
● Changing market conditions could constrain recruiting for even modest increases in demand requirements.
The Construction and Maintenance Looking Forward national highlights report expands on the range of worker mobility options and industry implications.
8 BRITISH COLUMBIA – CONSTRUCTION AND MAINTENANCE LOOKING FORWARD

For the most detailed and comprehensive construction labour market data in Canada, visit
Developed with industry for industry
Customizable tables and graphs available for:
Data on more than 30 construction trades and occupations by province looking ahead 10 years
Macroeconomic and investment data
Key economic indicators, construction investment and labour market conditions by province and/or sector
www.constructionforecasts.ca
Best viewed on tablets (or computers)
Also check out the Construction Map App for major resource construction projects mapped across Canada.
www.constructionmapapp.ca
2015–2024 Key Highlights 9