construction€¦ · building equipment contractors residential building construction foundation,...
TRANSCRIPT

2019 SECTOR SPOTLIGHT
CONSTRUCTION
Published Decmeber 2019This program is funded in part by the Government of Canada and the Government of Ontario.

Local Employment Planning Council – 2019 SECTOR SPOTLIGHT (Published December 2019) 1
2019 SECTOR SPOTLIGHT – NAICS 23
Construction Report Contents
Note on geography: This report looks at data for the Ottawa Census subdivision. Census subdivision (CSD) is the general term for municipalities (as determined by provincial/territorial legislation).
STATISTICS CANADA DEFINITIONWhat is this industry sector?
OTTAWA DASHBOARDHIGHLIGHTS
How does this sector stack up in Ottawa?
REGIONAL TRENDS (5-year Job Growth - Ottawa vs. Ontario vs. Canada)2018 EMPLOYMENT – A SUBSECTOR VIEW2018 EMPLOYMENT SNAPSHOT – INDUSTRY GROUPSJOB NUMBERS BY INDUSTRY GROUP (Past 5 years and 3-year outlook)KEY OCCUPATIONS IN THE SECTOR
Sector Employment ( Jobs)
SECTOR AT A GLANCEA CLOSER LOOK AT SHARE OF SELF-EMPLOYMENT
Sector Self-Employment
SECTOR AT A GLANCEBUSINESS COUNTS AT INDUSTRY GROUP LEVEL
Sector Business & Employer Counts
ONLINE JOB POSTINGSONLINE JOB SEEKER PROFILES
Online Supply & Demand
GAINSLOSSESTRENDS/PROJECTIONS
In the News
SECTOR STRUCTURESAMPLE REPORT - INDUSTRY SUMMARIES
Appendices

Local Employment Planning Council – 2019 SECTOR SPOTLIGHT (Published December 2019) 2
Construction (NAICS 23)
STATISTICS CANADA DEFINITION
What is this industry sector?
Below we show this sector’s three subsectors (3-digit level), as well as the 4-digit level Industry Groups that will be explored in this report.
SECTOR STRUCTURE
This sector comprises establishments primarily engaged in constructing, repairing and renovating buildings and engineering works, and in subdividing and developing land. These establishments may operate on their own account or under contract to other establishments or property owners. They may produce complete projects or just parts of projects. Establishments often subcontract some or all of the work involved in a project, or work together in joint ventures. Establishments may produce new construction, or undertake repairs and renovations to existing structures. There are substantial differences in the types of equipment, work force skills, and other inputs required by establishments in this sector. To highlight these differences and variations in the underlying production functions, this sector is divided into three subsectors. Establishments are distinguished initially between those that undertake projects that require several different construction activities (known as trades) to be performed (NAICS 236 and 237), and establishments that specialize in one trade (NAICS 238). A significant amount of construction work is performed by enterprises that are primarily engaged in some business other than construction, for these enterprises’ own use, using employees and equipment of the enterprise. This activity is not included in the construction sector unless the construction work performed is the primary activity of a separate establishment of the enterprise. However, if separate establishments do exist, they are classified in the construction sector.
• 236 - Construction of buildings • 237 - Heavy and civil engineering construction• 238 - Specialty trade contractors
SUBSECTORS
Local Employment Planning Council – 2019 SECTOR SPOTLIGHT (Published December 2019) 3
Construction (NAICS 23)
OTTAWA DASHBOARD
How does this sector stack up in Ottawa?
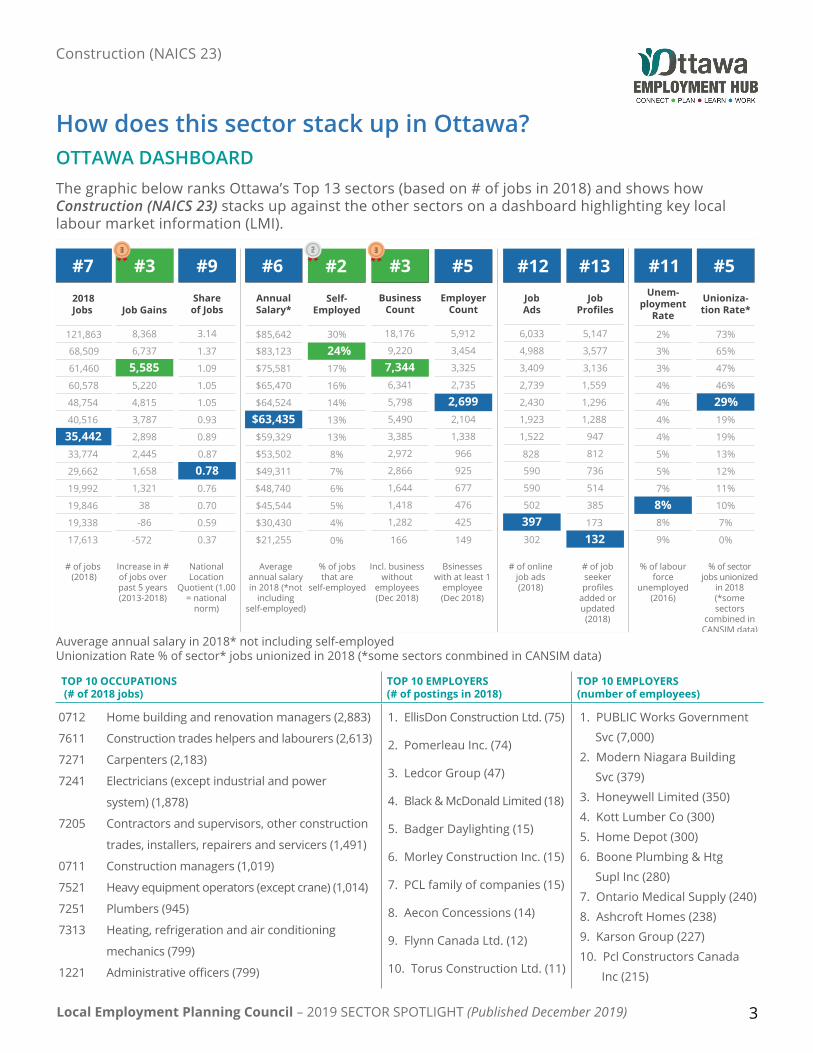
The graphic below ranks Ottawa’s Top 13 sectors (based on # of jobs in 2018) and shows how Construction (NAICS 23) stacks up against the other sectors on a dashboard highlighting key local labour market information (LMI).
OTTAWA DASHBOARD - Public Administration
“Running Your Ottawa Business” Workshop Series
How does this sector stack up? (NAICS 23)
#72018 Jobs
121,863
68,509
61,460
60,578
48,754
40,516
35,44233,774
29,662
19,992
19,846
19,338
17,613
#3
Job Gains
8,368
6,737
5,5855,220
4,815
3,787
2,898
2,445
1,658
1,321
38
-86
-572
#9Share of Jobs
3.14
1.37
1.09
1.05
1.05
0.93
0.89
0.87
0.780.76
0.70
0.59
0.37
#6Annual Salary*
$85,642
$83,123
$75,581
$65,470
$64,524
$63,435$59,329
$53,502
$49,311
$48,740
$45,544
$30,430
$21,255
#2Self-
Employed
#3Business
Count
18,176
9,220
7,3446,341
5,798
5,490
3,385
2,972
2,866
1,644
1,418
1,282
166
#5Employer
Count
5,912
3,454
3,325
2,735
2,6992,104
1,338
966
925
677
476
425
149
#12Job Ads
#13Job
Profi les
5,147
3,577
3,136
1,559
1,296
1,288
947
812
736
514
385
173
132
#5Unioniza-tion Rate*
73%
65%
47%
46%
29%19%
19%
13%
12%
11%
10%
7%
0%
#11Unem-
ployment Rate
2%
3%
3%
4%
4%
4%
4%
5%
5%
7%
8%8%
9%
Average annual salary in 2018 *not including self-employedUnionization Rate % of sector* jobs unionized in 2018 (*some sectors combined in CANSIM data)
30%
24%17%
16%
14%
13%
13%
8%
7%
6%
5%
4%
0%
6,033
4,988
3,409
2,739
2,430
1,923
1,522
828
590
590
502
397302
# of jobs (2018)
Increase in # of jobs over past 5 years (2013-2018)
National Location
Quotient (1.00 = national
norm)
Average annual salary in 2018 (*not
including self-employed)
% of jobs that are
self-employed
Incl. business without
employees (Dec 2018)
Bsinesses with at least 1
employee (Dec 2018)
# of online job ads (2018)
# of job seeker profiles
added or updated
(2018)
% of labour force
unemployed (2016)
% of sector jobs unionized
in 2018 (*some sectors
combined in CANSIM data)
Auverage annual salary in 2018* not including self-employedUnionization Rate % of sector* jobs unionized in 2018 (*some sectors conmbined in CANSIM data)
0712 Home building and renovation managers (2,883)
7611 Construction trades helpers and labourers (2,613)
7271 Carpenters (2,183)
7241 Electricians (except industrial and power
system) (1,878)
7205 Contractors and supervisors, other construction
trades, installers, repairers and servicers (1,491)
0711 Construction managers (1,019)
7521 Heavy equipment operators (except crane) (1,014)
7251 Plumbers (945)
7313 Heating, refrigeration and air conditioning
mechanics (799)
1221 Administrative officers (799)
1. EllisDon Construction Ltd. (75)
2. Pomerleau Inc. (74)
3. Ledcor Group (47)
4. Black & McDonald Limited (18)
5. Badger Daylighting (15)
6. Morley Construction Inc. (15)
7. PCL family of companies (15)
8. Aecon Concessions (14)
9. Flynn Canada Ltd. (12)
10. Torus Construction Ltd. (11)
1. PUBLIC Works Government
Svc (7,000)
2. Modern Niagara Building
Svc (379)
3. Honeywell Limited (350)
4. Kott Lumber Co (300)
5. Home Depot (300)
6. Boone Plumbing & Htg
Supl Inc (280)
7. Ontario Medical Supply (240)
8. Ashcroft Homes (238)
9. Karson Group (227)
10. Pcl Constructors Canada
Inc (215)
TOP 10 OCCUPATIONS (# of 2018 jobs)
TOP 10 EMPLOYERS (# of postings in 2018)
TOP 10 EMPLOYERS (number of employees)

Local Employment Planning Council – 2019 SECTOR SPOTLIGHT (Published December 2019) 4
Construction (NAICS 23)
REGIONAL TRENDS (5-year Job Growth - Ottawa vs. Ontario vs. Canada)
Sector Employment ( Jobs)
Region 2013 Jobs 2018 Jobs Change % Change
Ottawa 29,857 35,442 5,585 18.7%
Ontario 447,511 502,075 54,564 12.2%
Canada 1,334,003 1,412,916 78,913 5.9%
Job numbers, growth rate and forecast number of new jobs
2018 EMPLOYMENT – A SUBSECTOR VIEW
Ranked seventh out of 13 on # of jobs
Less than One-third (29%) are in Construction of buildings
63% of sector jobs are in the Specialty trade contractors subsector
#7
6%35,442
Jobs in other sectors 599,703
35,442 Sector Jobs in 2018 (6% of all Ottawa Jobs)
Specialty trade contractors
Heavy and civil engineering constructionConstruction of buildings
22,21563%
10,26229%
2,9668%
NAICS Description 2013 2014 2015 2016 2017 2018 % Change (2013-2018)
Forecast change (2018-2021)
238 Specialty trade contractors 18,911 19,386 20,181 20,120 21,762 22,215 17% 1,688
236 Construction of buildings 8,617 8,581 9,750 10,177 9,897 10,262 19% 460
237 Heavy and civil engineering construction 2,329 2,299 2,412 2,520 2,770 2,966 27% 2,402
Source: EMSI Analyst 2019

Local Employment Planning Council – 2019 SECTOR SPOTLIGHT (Published December 2019) 5
Construction (NAICS 23)
2018 EMPLOYMENT SNAPSHOT – INDUSTRY GROUPS
35,442 Sector Jobs in 2018 (6% of all Ottawa Jobs)
Ranked ninth out of 13 on specialization
22% below the national average for share of workers in this industry
29% of sector jobs are in Building equipment controctors industry group
#9
6%35,442
Jobs in other sectors 599,703 Source: EMSI Analyst 2019
A closer look at specialization:Ottawa’s share of workers in Utility system construction is 54% lower than the Canadian average (the lowest share of all industry groups in this sector).
Building equipment contractors
Residential building construction
Foundation, structure, and building exterior contractors
Building finishing contractors
Non-residential building construction
Other specialty trade contractors
Utility system construction
Highway, street and bridge construction
Other heavy and civil engineering construction
Land subdivision
29%
21%
14%
12%
9%
7%
3%
3%
1%
1%
10,389
7,222
4,868
4,374
3,039
2,583
1,109
1,027
445
386

Local Employment Planning Council – 2019 SECTOR SPOTLIGHT (Published December 2019) 6
Construction (NAICS 23)
JOB NUMBERS BY INDUSTRY GROUP (Past 5 years and 3-year outlook)
Job numbers, growth rate and forecast number of new jobs *NAICS Description 2013 2014 2015 2016 2017 2018 % Change
(2013-2018)Forecast change
(2018-2021)
2382 Building equipment contractors 8,318 8,525 8,852 9,083 9,977 10,389 25% 990
2361 Residential building construction 6,379 5,920 6,636 7,023 6,962 7,222 13% 309
2381 Foundation, structure, and building exterior contractors 4,586 4,942 4,868 4,372 4,880 4,868 6% 310
2383 Building finishing contractors 4,029 4,015 4,210 4,089 4,453 4,374 9% 195
2362 Non-residential building construction 2,238 2,661 3,114 3,153 2,934 3,039 36% 152
2389 Other specialty trade contractors 1,978 1,904 2,250 2,575 2,452 2,583 31% 194
2371 Utility system construction 754 769 873 924 953 1,109 47% 124
2373 Highway, street and bridge construction 1,069 1,079 958 876 1,005 1,027 -4% 44
2379 Other heavy and civil engineering construction 154 200 308 385 449 445 189% 56
2372 Land subdivision 351 250 273 334 363 386 10% 27
SECTOR TOTAL 29,138 29,259 29,645 31,708 32,566 34,071 19% 2,402
Source: EMSI Analyst 2019 (*EMSI recommends taking occupation data below 500 jobs with “a grain of salt” because of source data sampling sizes; occupation data is not considered reliable where fewer than 100 jobs)
0
2000
4000
6000
8000
10000
12000
2013 Jobs 2014 Jobs 2015 Jobs 2016 Jobs 2017 Jobs 2018 Jobs 2019 Jobs 2020 Jobs 2021 Jobs
Building equipment contractors Residential building construction Foundation, structure, and building exterior contractors
Building finishing contractors Non-residential building construction Other specialty trade contractors
Utility system construction Highway, street and bridge construction Other heavy and civil engineering construction
Land subdivision
12000
10000
8000
6000
4000
2000
02013 Jobs 2014 Jobs 2015 Jobs 2016 Jobs 2017 Jobs 2018 Jobs 2019 Jobs 2020 Jobs 2021 Jobs
Local Employment Planning Council – 2019 SECTOR SPOTLIGHT (Published December 2019) 7
Construction (NAICS 23)
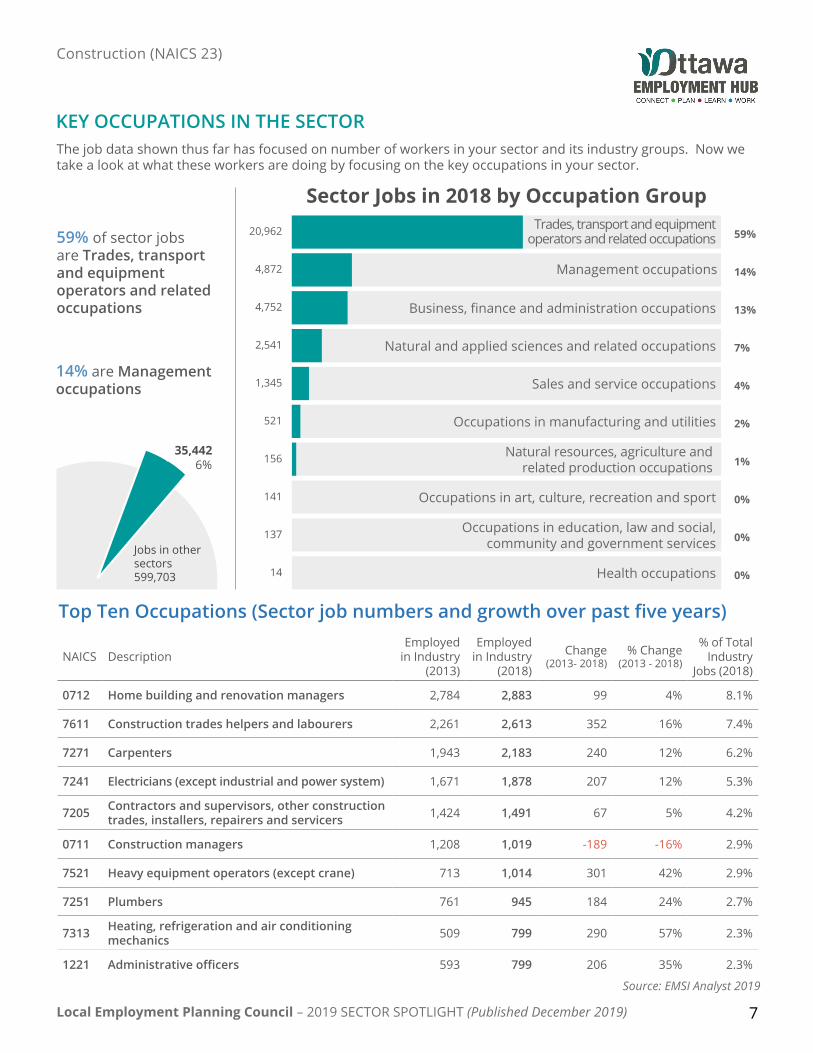
KEY OCCUPATIONS IN THE SECTORThe job data shown thus far has focused on number of workers in your sector and its industry groups. Now we take a look at what these workers are doing by focusing on the key occupations in your sector.
Top Ten Occupations (Sector job numbers and growth over past five years)
NAICS DescriptionEmployed
in Industry (2013)
Employed in Industry
(2018)
Change (2013- 2018)
% Change (2013 - 2018)
% of Total Industry
Jobs (2018)
0712 Home building and renovation managers 2,784 2,883 99 4% 8.1%
7611 Construction trades helpers and labourers 2,261 2,613 352 16% 7.4%
7271 Carpenters 1,943 2,183 240 12% 6.2%
7241 Electricians (except industrial and power system) 1,671 1,878 207 12% 5.3%
7205 Contractors and supervisors, other construction trades, installers, repairers and servicers 1,424 1,491 67 5% 4.2%
0711 Construction managers 1,208 1,019 -189 -16% 2.9%
7521 Heavy equipment operators (except crane) 713 1,014 301 42% 2.9%
7251 Plumbers 761 945 184 24% 2.7%
7313 Heating, refrigeration and air conditioning mechanics 509 799 290 57% 2.3%
1221 Administrative officers 593 799 206 35% 2.3%
Sector Jobs in 2018 by Occupation Group
59% of sector jobs are Trades, transport and equipment operators and related occupations
6%35,442
Jobs in other sectors 599,703
14% are Management occupations
59%
14%
13%
7%
4%
2%
1%
0%
0%
0%
20,962
4,872
4,752
2,541
1,345
521
156
141
137
14
Trades, transport and equipment operators and related occupations
Management occupations
Business, finance and administration occupations
Natural and applied sciences and related occupations
Sales and service occupations
Occupations in manufacturing and utilities
Natural resources, agriculture and related production occupations
Occupations in art, culture, recreation and sport
Occupations in education, law and social, community and government services
Health occupations
Source: EMSI Analyst 2019
Local Employment Planning Council – 2019 SECTOR SPOTLIGHT (Published December 2019) 8
Construction (NAICS 23)
SECTOR AT A GLANCE
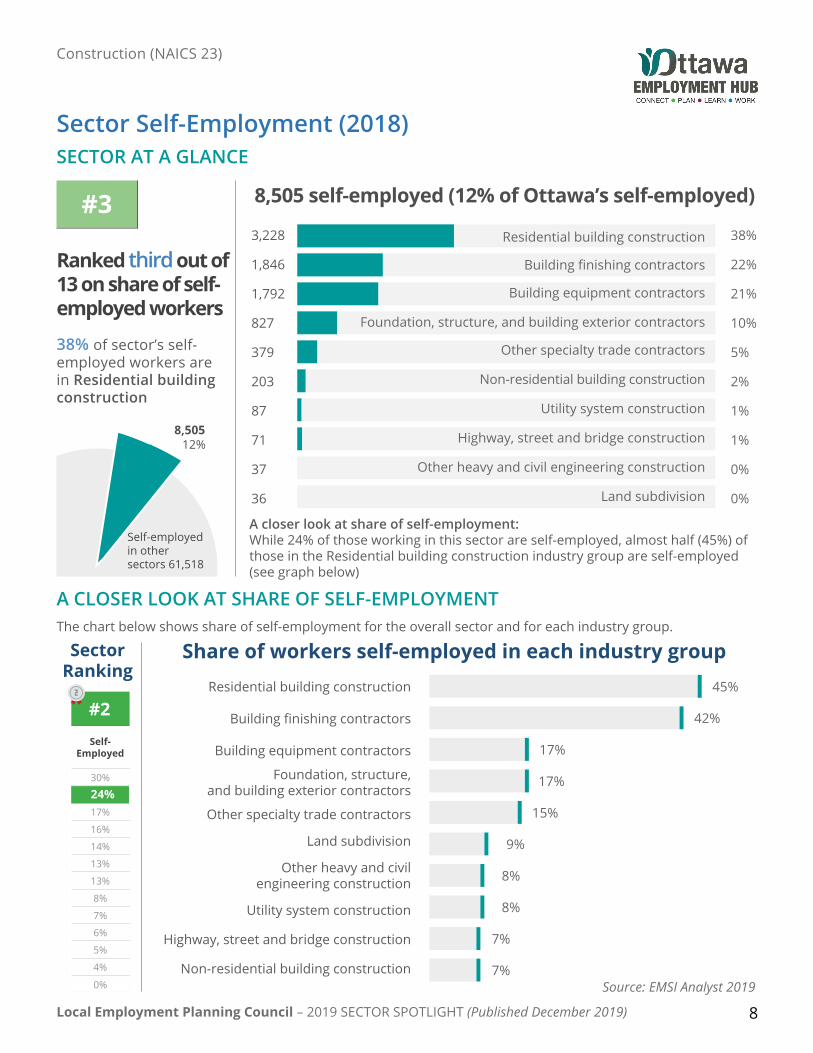
Sector Self-Employment (2018)
8,505 self-employed (12% of Ottawa’s self-employed)
38% of sector’s self-employed workers are in Residential building construction
12%8,505
Self-employed in other sectors 61,518
Ranked third out of 13 on share of self-employed workers
A closer look at share of self-employment:While 24% of those working in this sector are self-employed, almost half (45%) of those in the Residential building construction industry group are self-employed (see graph below)
38%
22%
21%
10%
5%
2%
1%
1%
0%
0%
3,228
1,846
1,792
827
379
203
87
71
37
36
Residential building construction
Building finishing contractors
Building equipment contractors
Foundation, structure, and building exterior contractors
Other specialty trade contractors
Non-residential building construction
Utility system construction
Highway, street and bridge construction
Other heavy and civil engineering construction
Land subdivision
A CLOSER LOOK AT SHARE OF SELF-EMPLOYMENTThe chart below shows share of self-employment for the overall sector and for each industry group. OTTAWA DASHBOARD - Public Administration
“Running Your Ottawa Business” Workshop Series
How does this sector stack up? (NAICS 23)
#72018 Jobs
121,863
68,509
61,460
60,578
48,754
40,516
35,44233,774
29,662
19,992
19,846
19,338
17,613
#3
Job Gains
8,368
6,737
5,5855,220
4,815
3,787
2,898
2,445
1,658
1,321
38
-86
-572
#9Share of Jobs
3.14
1.37
1.09
1.05
1.05
0.93
0.89
0.87
0.780.76
0.70
0.59
0.37
#6Annual Salary*
$85,642
$83,123
$75,581
$65,470
$64,524
$63,435$59,329
$53,502
$49,311
$48,740
$45,544
$30,430
$21,255
#2Self-
Employed
#3Business
Count
18,176
9,220
7,3446,341
5,798
5,490
3,385
2,972
2,866
1,644
1,418
1,282
166
#5Employer
Count
5,912
3,454
3,325
2,735
2,6992,104
1,338
966
925
677
476
425
149
#12Job Ads
#13Job
Profi les
5,147
3,577
3,136
1,559
1,296
1,288
947
812
736
514
385
173
132
#5Unioniza-tion Rate*
73%
65%
47%
46%
29%19%
19%
13%
12%
11%
10%
7%
0%
#11Unem-
ployment Rate
2%
3%
3%
4%
4%
4%
4%
5%
5%
7%
8%8%
9%
Average annual salary in 2018 *not including self-employedUnionization Rate % of sector* jobs unionized in 2018 (*some sectors combined in CANSIM data)
30%
24%17%
16%
14%
13%
13%
8%
7%
6%
5%
4%
0%
6,033
4,988
3,409
2,739
2,430
1,923
1,522
828
590
590
502
397302
# of jobs (2018)
Increase in # of jobs over past 5 years (2013-2018)
National Location
Quotient (1.00 = national
norm)
Average annual salary in 2018 (*not
including self-employed)
% of jobs that are
self-employed
Incl. business without
employees (Dec 2018)
Bsinesses with at least 1
employee (Dec 2018)
# of online job ads (2018)
# of job seeker profiles
added or updated
(2018)
% of labour force
unemployed (2016)
% of sector jobs unionized
in 2018 (*some sectors
combined in CANSIM data)
SectorRanking
Share of workers self-employed in each industry groupResidential building construction
Building finishing contractors
Building equipment contractors
Foundation, structure,and building exterior contractors
Other specialty trade contractors
Land subdivision
Other heavy and civilengineering construction
Utility system construction
Highway, street and bridge construction
Non-residential building construction
45%
42%
17%
17%
15%
9%
8%
8%
7%
7%Source: EMSI Analyst 2019
#3

Local Employment Planning Council – 2019 SECTOR SPOTLIGHT (Published December 2019) 9
Construction (NAICS 23)
SECTOR AT A GLANCE
Sector Business & Employer Counts (December 2018)
7,344 Ottawa Businesses (7% of all businesses)
37% of sector businesses have employees currently on payroll
7%7,344
Businesses in other sectors 92,304
Ranked #3 out of 13 on number of businesses and #5 on number of employers
A closer look at employers:Business counts include locations with no employees on payroll; employer counts only include locations with employees.
Source: EMSI Analyst 2019
SECTOR BUSINESSES
SECTOR EMPLOYERS
No employees4,64563%
One or more employees
2,699 37%
<0%2
MICRO - 1 to 4 employees
MEDIUM - 100 to 499 employeesSMALL - 5 to 99 employees
LAGRE - 500+ employees
1,377
47%
1,2772%
43
51%
BUSINESS COUNTS AT INDUSTRY GROUP LEVELCode Description 1-4 5-9 10-19 20-49 50-99 100-199 200-499 500+ None Total
2361 Residential building construction 377 140 77 39 6 4 0 0 1,428 2,071
2362 Non-residential building construction 68 33 32 23 6 1 3 0 216 382
2371 Utility system construction 2 5 7 7 5 2 0 0 15 43
2372 Land subdivision 18 5 5 4 1 0 1 0 615 649
2373 Highway, street and bridge construction 6 2 7 7 1 1 3 0 16 43
2379 Other heavy and civil engineering construction 3 1 2 1 1 0 0 0 8 16
2381 Foundation, structure, and building exterior contractors 160 91 61 29 13 3 0 1 308 666
2382 Building equipment contractors 319 140 104 62 30 15 3 0 471 1,144
2383 Building finishing contractors 299 115 49 28 3 3 0 0 1,118 1,615
2389 Other specialty trade contractors 125 59 37 28 11 3 1 1 450 715
#5#3
Local Employment Planning Council – 2019 SECTOR SPOTLIGHT (Published December 2019) 10
Construction (NAICS 23)
ONLINE JOB POSTINGS
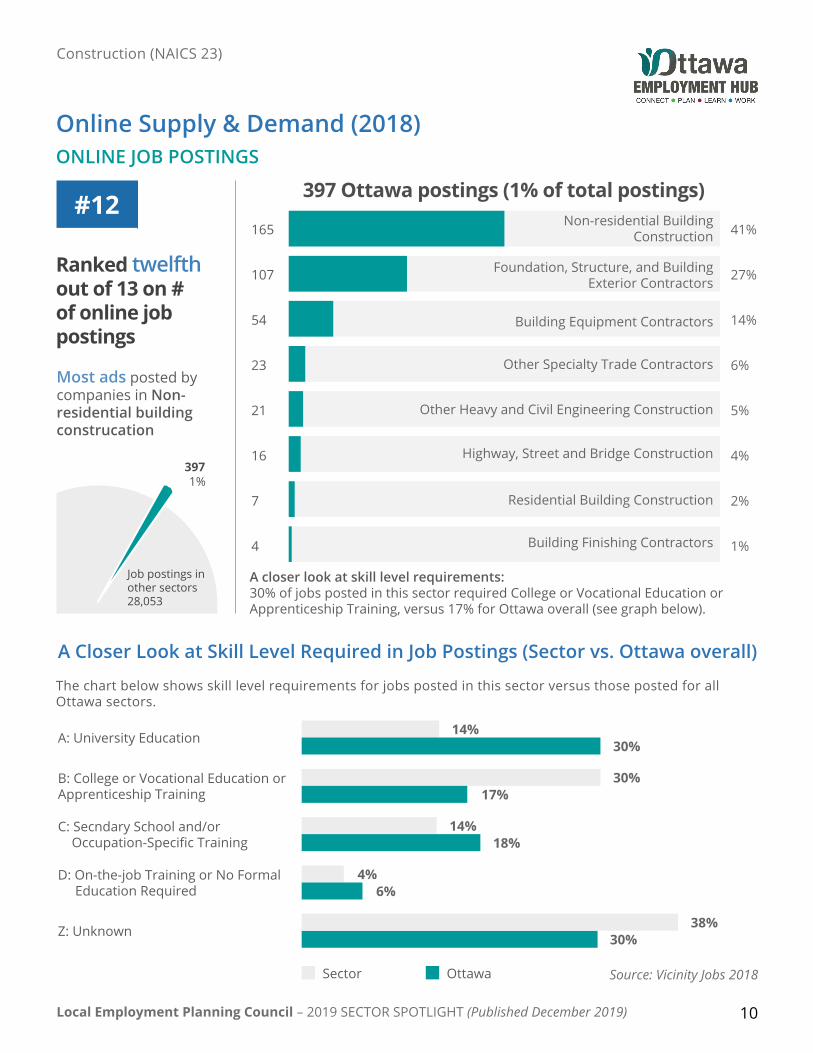
Online Supply & Demand (2018)
397 Ottawa postings (1% of total postings)
Most ads posted by companies in Non-residential building construcation
1%397
Job postings in other sectors 28,053
Ranked twelfth out of 13 on # of online job postings
#12
A closer look at skill level requirements:30% of jobs posted in this sector required College or Vocational Education or Apprenticeship Training, versus 17% for Ottawa overall (see graph below).
165
107
54
23
21
16
7
4
Non-residential Building Construction
Foundation, Structure, and Building Exterior Contractors
Building Equipment Contractors
Other Specialty Trade Contractors
Other Heavy and Civil Engineering Construction
Highway, Street and Bridge Construction
Residential Building Construction
Building Finishing Contractors
41%
27%
14%
6%
5%
4%
2%
1%
A Closer Look at Skill Level Required in Job Postings (Sector vs. Ottawa overall)
The chart below shows skill level requirements for jobs posted in this sector versus those posted for all Ottawa sectors.
Source: Vicinity Jobs 2018
C: Secndary School and/or Occupation-Specific Training
14%18%
Z: Unknown
D: On-the-job Training or No Formal Education Required
4%6%
B: College or Vocational Education or Apprenticeship Training
30%17%
A: University Education 30%14%
Sector Ottawa
30%38%
Local Employment Planning Council – 2019 SECTOR SPOTLIGHT (Published December 2019) 11
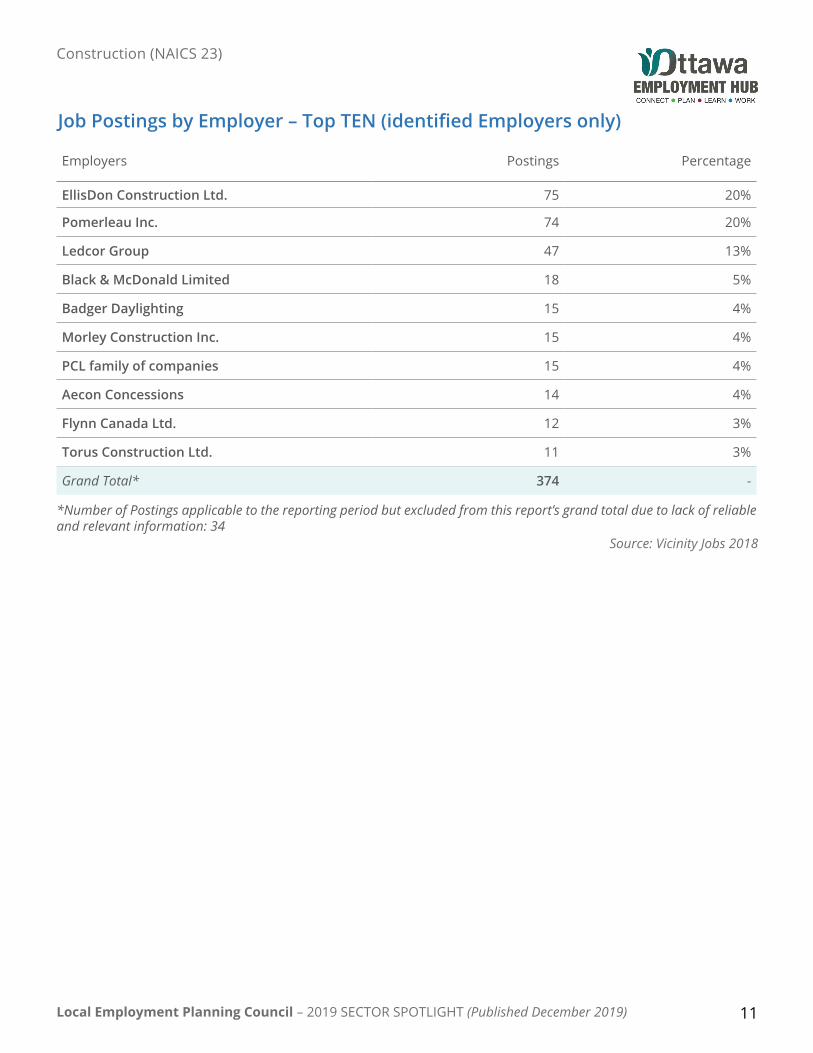
*Number of Postings applicable to the reporting period but excluded from this report’s grand total due to lack of reliable and relevant information: 34
Job Postings by Employer – Top TEN (identified Employers only)
Employers Postings Percentage
EllisDon Construction Ltd. 75 20%
Pomerleau Inc. 74 20%
Ledcor Group 47 13%
Black & McDonald Limited 18 5%
Badger Daylighting 15 4%
Morley Construction Inc. 15 4%
PCL family of companies 15 4%
Aecon Concessions 14 4%
Flynn Canada Ltd. 12 3%
Torus Construction Ltd. 11 3%
Grand Total* 374 -
Construction (NAICS 23)
Source: Vicinity Jobs 2018

Local Employment Planning Council – 2019 SECTOR SPOTLIGHT (Published December 2019) 12
Construction (NAICS 23)
ONLINE JOB SEEKER PROFILES
132 Ottawa profiles in 2018 (1% of total profiles)
Most profiles posted by job seekers with most recent experience in the Building equinpment contractors industry group
1%132
Job seeker profiles in other sectors 17,620
Ranked last out of 13 on # of online job seeker profiles
#13
A closer look at occupations for active job profiles:Of those job profiles where occupation group could be identified, the most (53) were in Trades, transport and equipment operators and related occupations (see graph below).
72
22
15
9
6
3
3
2
Building Equipment Contractors
Non-residential Building Construction
Foundation, Structure, and Building Exterior Contractors
Other Specialty Trade Contractors
Building Finishing Contractors
Residential Building Construction
Other Heavy and Civil Engineering Construction
Utility System Construction
55%
17%
11%
7%
5%
2%
2%
1%
The numbers shown reflect Job Profiles that were either added or updated within a 30-day span by job seekers living in Ottawa between January and December 2018.
A Closer Look at Occupations of those with Active Job Profiles The chart below shows number of job seeker profiles by occupation group most recently worked in.
Source: Vicinity Jobs 2018
2 - Natural and applled sclences and related occupations
6 - Sales and service occupations
5 - Occupations in art, culture, recreation and sport
1 - Business, finance and adminstration occupations
0 - Management occupations
7 - Trades, transport and equipment operators and related occupations9 - Occupations in manufacturing and utill ties
Other / Unidentified
53
6
31
7
13
4
3
15

Local Employment Planning Council – 2019 SECTOR SPOTLIGHT (Published December 2019) 13
Construction (NAICS 23)
In the News HighlightsGAINS
LOSSES
Continuing the trend of recent infrastructure spending, the City of Ottawa decided to continue its ambitious LRT project with the approval of its Stage 2 motion, which will see the extension of the Trillium and Confederation lines at the cost of $4.66B. A scarcity in skilled labour helped to exacerbate the size of this bloated figure, but the project provides an optimism to grow Ottawa’s construction industry.
February 26, 2019 CBC News
A Community Improvement Plan for the revitalization of the Vanier area was developed by the City of Ottawa, as part of a continued effort at stimulating urban renewal and promoting economic growth within the neighbourhood. The strategy will incentivize local business owners to contribute towards redevelopment efforts of lands and buildings by way of tax grants.
March 20, 2019 City of Ottawa
The construction industry’s loss of 2,500 jobs in March helped offset gains in what was otherwise a promising month for the Ottawa-Gatineau labour market, as it finished the first quarter with an unemployment rate of 5.1%.
April 5, 2019 Ottawa Business Journal
The City of Ottawa committed to revitalizing Elgin Street with a $36M reconstruction project, providing infrastructure and streetscaping upgrades. While the work (which is expected to be completed sometime in the fall of 2020) will provide a temporary pain to local residents due to increased traffic, the benefits of the project are reflected in the City’s commitment to Ottawa’s construction sector.
January 7, 2019 Ottawa Citizen
City proposes plan to spark urban renewal and economic growth in Vanier
LRT Stage 2: What Ottawa will get for $4.66B
Everything you need to know about the Elgin Street renewal in 2019--and beyond
Larger labour force offsets March job gains in Ottawa-Gatineau
Local Employment Planning Council – 2019 SECTOR SPOTLIGHT (Published December 2019) 14
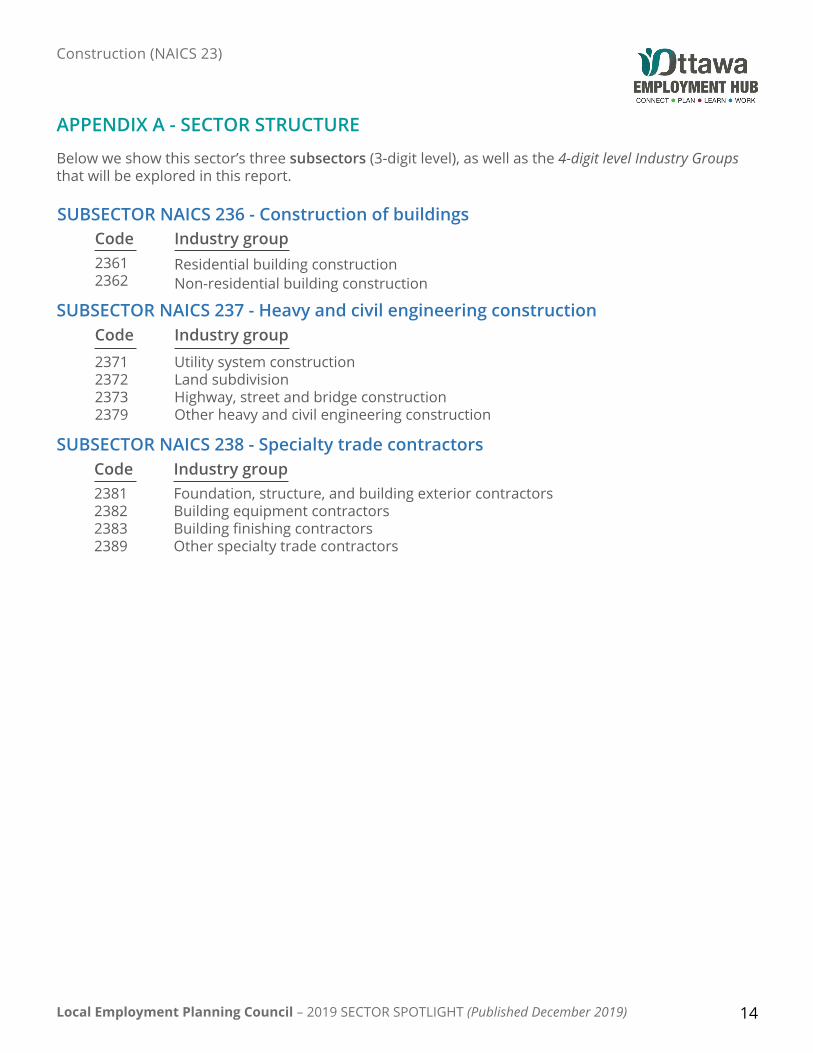
SUBSECTOR NAICS 236 - Construction of buildings Code23612362
Industry group Residential building constructionNon-residential building construction
SUBSECTOR NAICS 237 - Heavy and civil engineering construction Industry group
Utility system construction Land subdivision Highway, street and bridge constructionOther heavy and civil engineering construction
Code
2371237223732379
SUBSECTOR NAICS 238 - Specialty trade contractors Industry group Foundation, structure, and building exterior contractors Building equipment contractors Building finishing contractors Other specialty trade contractors
Code2381 238223832389
Below we show this sector’s three subsectors (3-digit level), as well as the 4-digit level Industry Groups that will be explored in this report.
APPENDIX A - SECTOR STRUCTURE
Construction (NAICS 23)

Local Employment Planning Council – 2019 SECTOR SPOTLIGHT (Published December 2019) 15
Below is a sample report that can be requested for any industry at the 3- or 4-digit (subsector or industry group) level. Some of these may also be available on the Labour Market Ottawa web portal.
Construction (NAICS 23)
Sample Report – Industry Summaries
Industry Summary for Building equipment contractors (NAICS 2382)
10,389 24.9% Jobs (2018) % Change (2013-2018)
7% below National average Nation: 10.7%
Regional Trends
Region 2013 Jobs 2018 Jobs Change % Change
Ottawa 8,318 10,389 2,071 24.9%
Ontario 114,910 138,656 23,746 20.7%
Canada 315,679 349,608 33,929 10.7%
Top Occupations Employed by this Industry
Description Employed in Industry (2018)
% of Total Jobs in Industry (2018)
Electricians (except industrial and power system) 1,771 17.0%
Plumbers 893 8.6%
Heating, refrigeration and air conditioning mechanics 787 7.6%
Contractors and supervisors, electrical trades and telecommunications occupations 520 5.0%
Contractors and supervisors, mechanic trades 353 3.4%
Source: EMSI Analyst 2019
Perc
ent C
hang
e
140 120 100
80 60 40 20
0 -20 -40 -60
2001 2003 2005 2007 2009 2011 2013 2015 2017 2019 2021 2023 2025

Local Employment Planning Council2019 SECTOR SPOTLIGHT
C O N S T R U C T I O N